Contents lists available at SciVerse ScienceDirect
Ecological Indicators
journa l homepage: www.e lsev ier .com/ locate /eco l ind
ndicator based sustainability assessment tool for affordable housingonstruction technologies
. Wallbaum ∗, Y. Ostermeyer, C. Salzer, E. Zea Escamillanstitute of Construction and Infrastructure Management, Chair of Sustainable Construction, ETH Zurich, Zurich, Switzerland
r t i c l e i n f o
rticle history:eceived 6 October 2011eceived in revised form 5 December 2011ccepted 9 December 2011
eywords:ustainable developmentustainabilityousing
a b s t r a c t
With the growing worldwide demand for affordable housing and the importance of supporting andstimulating sustainable development, the need for sustainable solutions in the affordable housing sectoris at a peak. The present paper screened about 75 construction technologies and assessed 46 of them.The present paper presents the first results of a step wise approach to identify, assess and recommendmost promising technologies for affordable housing projects. A database was developed to store detailedtechnical information about each of the technologies. A grading and ranking scheme was developedto identify the most promising construction technologies from a sustainability perspective. The mainchallenges for affordable housing production and most relevant assessment indicators were identified
ssessmentaterials
ffordable
from the literature, interviews and meetings with experts. An indicator based assessment system wasdeveloped by cross-referencing the identified eight challenges with ten selected indicators. The finalranking demonstrated that a wide variety of technologies perform strongly overall, and these rangefrom bio-based materials, such as bamboo and timber, to industrialized technologies, such as concrete.Moreover, the possibilities for improvement are vast, and the option of combining different technologies
misin
seems to be the most pro
. Introduction
Housing is one of the most basic human needs and is aey component in the sustainable development of a communityDumreicher and Kolb, 2008). In general, sustainable developments divided into three interacting sectors: economic, environmen-al, and social (Keiner, 2005). From a social perspective, housingot only offers shelter but also gives a sense of a secure future andtrengthens local communities (Arman et al., 2009). On the otherand, the housing sector is responsible for a great deal of green-ouse gas emissions, energy and material use, waste production,nd changes in land-use dynamics (U.E. UN Habitat, 2008). Finally,rom an economic perspective, houses are among the major invest-
ents that people make in their lifetimes (Maliene and Malys,009), and the housing sector is related to 10% of the global gross
omestic product and 7% of global jobs (UN Habitat, 2009).
The worldwide demand for affordable housing has grown inecent decades and is expected to continue to grow (Wood, 2007).oreover, the affordable housing sector has been regarded as one
f the less penetrated markets by private companies (World Bank,
∗ Corresponding author at: ETH Zurich, Institute of Construction and Infras-ructure Management, Chair of Sustainable Construction, IBI – HIL, Room F 28.1,
olfgang Pauli Str. 15, 8093 Zurich, Switzerland. Tel.: +41 44 633 28 01;ax: +41 44 633 10 88.
2006). Thus, the affordable housing sector provides a wide range ofopportunities for development along with a series of challengesto be overcome (Wherever, 2008). Several challenges to afford-able housing have been put forth in the literature. The followingeight are highlighted as key challenges: scarcity of resources; lackof sufficient funds; shortage due to urgency of demand; shortageof skilled labour; quality control; wastage due to inefficiency; lackof added value creation; and quality and location.
Due to the inherent complexity of the affordable housing prob-lem, it was proposed to have a step wise approach. The first step,from which this paper presents the results, comprehends threeparts, first a global screening of construction technologies used inaffordable housing programs; second the development of an indica-tor based assessment system; and third a technology’s assessmentand ranking. Further steps will consider the development of lifecycle assessments for most promising technologies, consideringlocal factors. The final step will be a final selection process, car-ried out with specific communities and organizations interested indeveloping affordable and sustainable housing projects, to final-ize with its implementation in form of a pilot project. Therefore,the goal of this paper is to identify construction technologiesthat will be able to sustainably provide shelter to low and low-
est income communities in urban areas of emerging economiescountries. To identify these technologies an indicator based assess-ment system was developed. The indicators can be clustered intothe three main categories identified by the World Commission
n Environment and Development: Economic, Environmental andocietal (W.C.o.E.a.D., 1987). The highest-ranking technologies areresented and studied in detail in Section 6 of this paper.
.1. The definition of affordable housing
The concept of affordable housing is diverse and complex butan be generally described in economic terms (Wherever, 2008).n affordable house can be defined as a house that a family groupan acquire within a given period, which generally ranges from5 to 30 years. This period is directly connected to the acquisitionapacity of the group and the financial support that they can obtainn terms of loans, credits and subsidies (UN Habitat, 2009). Becausen affordable house is such a long-term investment, it shouldrovide added value to its owners in terms of comfort, quality and
ifespan (Jenkins et al., 2007). In this sense, affordable housing,s discussed in this paper, is different from the concept of reliefhelter and considers the social effects of long-term habitation.ffordable housing is defined in this paper as housing that costs
ess than 200 USD/m2 to produce, including the costs associatedith construction and finishing details.
.2. The need for sustainable affordable housing
When analysing global development scenarios, the buildingector is obviously of high social and economic importance ineveloping and the least-developed countries. The tendencyowards urbanization in these countries is well documented, andt is expected that 70% of the world’s population will be living inities by 2050 (World Bank, 2006). This trend is primarily driveny the perception of cities as centres of wealth and prosperityhat attract people from rural areas in search of better futuresDumreicher and Kolb, 2008).
This increase in the global urban population will inevitablyesult in a very sharp increase in the demand for housing. Unfor-unately, the current housing sector cannot cope with the demandor living space (Jenkins et al., 2007). This gap between demandnd supply creates a very complex problem, driving the housingector towards less efficient and more-expensive solutions andew city dwellers towards informal (and often illegal) indepen-ent construction of dwellings (Arman et al., 2009). Independentonstruction has become a widespread phenomenon in emergingconomy countries. It has driven a corresponding sense of urgencyo develop socially responsible housing solutions (Erguden, 2001)hat do not unnecessarily impact the environment and that can becquired by low-income family groups in a reasonable period.
The building sector is regarded by many authors as the primaryonsumer of resources and energy in the modern environmentKavgic et al., 2010). Therefore, it is of great importance to developechnologies to reduce negative environmental impacts and tossess (Ali and Al Nsairat, 2009) the potential and performancef traditional and novel ideas. Furthermore, the development ofustainable housing projects should aim to reduce the energy andaterial flows in their whole life cycle, starting on its planning and
esign phases, considering their construction and use and they finalenovation or demolition (Arslan, 2007). To identify the best solu-ion, a consistent set of indicators must be developed (Yao, 2005)hat encompass all the aspects of sustainability. Furthermore, thessessment of sustainable construction technologies and solutionsequires the development of comparison schemes and benchmarkshat will highlight the challenges and opportunities (Monahan andowell, 2011) of each technology.
.3. Key challenges of affordable housing
The development of affordable housing project as is in itself a very complex challenge. The first step in the technologies
icators 18 (2012) 353–364
assessment process was to identify, which are the main challengesfor the execution of such projects. These challenges were identifiedon the literature and through interviews with organizations like UNhabitat, HILTI Foundation and UNESCAP. The proposed challengesdo not claim to show the whole variety of difficulties that canoccur when providing newly constructed affordable houses but tohighlight the most commonly occurring. The identified challengeswere used to configure a matrix that relates the main challengeswith the proposed indicators. The challenges are described on thefollowing sections.
1.3.1. Scarcity of resourcesThe consumption of resources increases tremendously by the
rapid urban growth and changing living standards in emerg-ing economies. Already today shrinking resources and upcomingscarcities are a main issue. In case of the housing deficit this chal-lenge means to look favourably upon the improvement of existingmethods and the establishment of innovative technologies actingas drivers for higher efficiency or resource substitution. Financialand technical capabilities of municipalities have to be strength-ened and private sector has to serve all income groups. From theconstruction point of view this means: producing good qualityconstruction materials, increasing its efficiency and reducing itsembodied energy.
1.3.2. Lack of sufficient fundsThe income of households in vulnerable conditions and/or infor-
mal settlements is usually one of the lowest on given countries.The marginal income of the target group has to be considered asa key limitation when thinking about construction technologies.Even though this project intends to highlight technologies that areable to produce sound results over the whole life cycle, the ini-tial construction costs are a key driver for the implementation ofa concept for this market segment. Being cost efficient is there-fore assessed as key challenge for all technologies presented in thisresearch. As the income is typically not only low but also irregular,the credibility of the dwellers is predominantly insufficient for theloan taking procedure in conventional credit institutes.
1.3.3. Time shortage due to urgency of demandThe rapid urban growth asks for fast solutions however the huge
housing demand requires large volumes to be managed. Bureau-cratic and legal burdens frequently lead to longer time spans thanneeded. A clear lack of effective implementation strategies is amajor challenge that has to be tackled by the improvement of theinterface between policy instruments and reality. A lot has beendone in policy framework but its implementations is still lackingbehind.
1.3.4. Shortage of skilled labourOne important role of housing production is the generation of
new jobs, particularly for unskilled labour. Thus, technologies thatrequire a high skill level will face significant problem in findingskilled and trained works among the members of the target com-munities. Thus, technologies that require the lowest level of bothskill and training will have priority.
1.3.5. Quality controlBeside the significantly difficult access to finance funds, the
quality of the final products is one of the most relevant challenges. It
does not only affect the performance of the house but also its tech-nical useful life. Thus, is of great relevance to control and assurethe quality of materials, and end products as well as the properutilization on site.
cal Ind
1
ctita
1
imeeo
1
t“nssvcb
1
sctadtbwttsnap
cMoebagspcwwwwttosp
sion in 1987, that is: “to meet the needs of the present generationwithout compromising the ability of future generations to meettheir own needs” (W.C.o.E.a.D., 1987). Based on this definitionand the present research used a triple-bottom-line approach that
Table 1Database’ information categories.
1 Name of the technology2 Information source, country of practice and reference
projects (if available)3 Pictures4 Building category5 Size|dimension6 Settlement environment7 Construction components8 Cost per m2
9 Building process10 Time schedule11 Economy of scale|mass production12 Durability13 Maintenance requirements14 Modularization|flexibility
H. Wallbaum et al. / Ecologi
.3.6. Wastage due to inefficiencyThe wastage of resources due to inefficient processes or tools
auses an increase in investment costs of around 12%. But beyondhe negative influence on costs, wastage also causes negativempacts on resource consumption. A shift from in situ constructiono prefabrication and a higher standardization of work flows prob-bly result in less quality problems and lower wastage of resources.
.3.7. Lack of added value creationIn regard of the inadequate living conditions the dwellers lived
n before, it is important to contribute positively to the develop-ent of the local environment. The target population is usually
mbossed by political and social exclusion. One key principle is tongage locals during planning and construction, another is to relyn locally available materials.
.3.8. Quality and locationLow quality products reduce the houses’ life spans and increase
he need for maintenance interventions. As mentioned in the bookHouse of Form and Culture” the cultural, social and economicorms of the specific societies must be reflected in shelter andettlement responses (Rapoport, 1969). A second principle is thattrategic planning covering land use, tenure, livelihoods and ser-ices have to be integrated in the method in addition to shelteronstruction. Otherwise there is a danger that solutions do notecome permanent value.
.4. Indicator selection
One of the biggest challenges for this research was select aet of indicators that would encompass the previously describedhallenges. Based on previous experiences, it was decided to starthe whole process by a clear definition of an indicator. The mostppealing definition was presented by Heink and Kowarik (2010)escribing the indicator as a measure from which conclusions onhe phenomenon of interest can be inferred. Moreover, as proposedy Moldan et al. (2011) the main challenges of an indicator systemill relate to its use and interpretation. To minimize the impact of
his challenge a linear grading scale was applied for each indica-or. This process brings on its self, new challenges by reducing theensitivity between values, making it more difficult to rank tech-ologies that will end up with equal scores. On the other hand,linear grading scale reduces the subjectivity on the assessmentrocess.
Another complexity was added by the enormous amount of indi-ators and indicators set extensively described in the literature.ost of these sets are focused on specific aspects of sustainability
r simply focus on technical components. As proposed by Jian-yit al. (2012) the main challenges was not the lack of indicatorsut the lack of a clear process selecting them selecting indicators,nd linking them to the final objective of assessing the technolo-ies’ sustainability performance. Therefore, the indicators wereelected based not only on its recurrent use in affordable housingrojects but also because of its connection to the program’s suc-ess. Moreover, the great majority of these indicators are connectedith affordable housing programs that hand been built around theorld. Moreover, as proposed by Krank and Wallbaum (2011), theeaknesses and strengths of each program was studied in relationith its indicators system, in order to provide the background for
he final set of indicators used on the present research. The selec-
ion of indicators were further refined with the help of experts fromrganizations like the HILTI foundation and UN ESCAP. The finalelection of indicators; a brief description; and its grading scale areresented on the following section.
icators 18 (2012) 353–364 355
2. Methodology
In this paper, the methodology for screening and rating sustain-able housing technologies consisted of three primary steps: datacollection, data processing, and technology screening.
2.1. Data collection procedures
Motivated by the diversity of building technologies and theabsence of a common exchange platform, the aim was to developa database with a wide range of data sources. Three major datasources consulted were: international development organizations;the private sector; and research institutions.
Data for the present research was collected from the publishedliterature about existing technologies and concepts; the databasesof organizations involved in affordable housing projects; and per-sonal interviews with representatives of the companies producingaffordable housing technologies.
A format using the 18 levels of information shown in Table 1 wasdeveloped to standardize the collected data. This format enables thesystematic study of different technologies and formed the basis forthe grading and ranking process.
2.2. Data processing
The total sample encompasses approximately 75 building tech-nologies, from which 46 were selected for the assessment. Adatabase was developed with 2–4 pages of information for eachtechnology. The first pre-requisite on the screening process wasan economic filter that excluded any technologies with initial con-struction costs above 200 USD/m2 from further study.
2.3. Technology assessment
The indicators for assessing the construction technologies arebased on the key challenges identified in the first section of thispaper. Furthermore, through in depth study of affordable hous-ing programs, as explained in Section 1.4 and interviews withexperts, from organizations working on the development of afford-able housing programs, the ten most commonly used and acceptedindicators were selected. The concept of sustainability was based onwidely accepted definition, developed by the Brundtland Commis-
15 Potential for recycling|demolition16 Local value creation17 Social acceptance18 Interface to basic services
3 cal Indicators 18 (2012) 353–364
cnautmatootp
2
siTasksactfTauiwciitt
TI
2
ITdtt
TI
Table 4Indicator values – time schedule, degree of prefabrication.
Time schedule, prefabrication degree Rating
Erection of one unit <1 day 10Erection of one unit 1–3 days 8Erection of one unit <1 week 6
56 H. Wallbaum et al. / Ecologi
onsiders the economic, ecological and social aspects of each tech-ology. It is important to remark that most of the selected indicatorsre measures of dimensions of economic, social or environmentalnsustainability which must be minimized to keep on a sustainablerajectory. And as described by Lyon, they are guides to manage-
ent future decision and action, but they cannot guarantee sustain-bility (Dahl, 2011). Furthermore, this approach allows the rankingso use a flexible weighting scheme between indicators or clustersf indicators that can help identify the weaknesses and strengthsf technologies through a sensitivity analysis. In the following sec-ions, the assessment indicators are briefly described, and a table isresented that contains the values used to grade each technology.
.3.1. Initial construction costs per m2
The initial construction costs are a key determinant of theuccessful implementation of a technology on the market. Thisndicator addresses the key challenge “lack of sufficient funds”.he amount listed under [USD/m2] in the ranking matrix includesll direct and indirect costs of the superstructure includingtandard equipment, such as windows, doors, inner walls anditchen/sanitation facilities. Furthermore, labour costs for con-truction are included. When only the total project cost was given,scientific estimate of the margin was made using a ratio work
ost to material cost of 20:80. This ratio was based on the litera-ure (Bhaskara, 1994; Mathur, 1993) and discussion with expertsrom the Hilti foundation (Bürmann, 2010) working on this field.he proposed ratio considers that most of the studied technologiesre meant to produce single family housing units; to use limitednskilled labour (mainly future inhabitants); and to maximize the
nitial investment. The price of land and infrastructure costs forater, sewage, roads and electricity are not included in the initial
onstruction costs of the ranking matrix. It should be noted that thenitials costs refer to the value provided by the company referredn the fact sheet. Labour and material costs might vary accordingo country, and this must be taken into account when consideringransferring technologies (see Table 2).
able 2ndicator values – initial construction costs.
.3.2. Requirements of the production and construction processesHousing construction can create a significant number of jobs.
t is important to define the skill level associated with these jobs.his indicator focuses on skill and equipment requirements in theevelopment, production, and construction phases. This indicatorackles the key challenge “shortage of skilled labour” by reducinghe rating of technologies that require high skill levels (see Table 3).
able 3ndicator values – requirement of the production and construction processes.
Requirements production|construction process Rating
Unskilled labour with no training or local skills traditionallyavailable, low-tech tools
10
Unskilled labour with short training (<2 weeks) or local skillsavailable
8
Unskilled labour with intensive training (several weeks) or 6
skilled workers
Advanced skills or tools required 4Very advanced skill level or tools required 2Information not available 0
Erection of one unit <2 weeks 4Erection of one unit >2 weeks 2Information not available 0
2.3.3. Time schedule, prefabrication degreeThis indicator evaluates the importance of prefabrication, sup-
ply chains, and management, each of which are indirectly linked tothe costs (see Table 4).
2.3.4. Economy of scale, prefabrication degreeThe scalability of the technology plays an important role on this
indicator, as it is indirectly linked to the initial construction costs.As the demand for houses grows, programs that utilize economiesof scale have significant potential to reduce costs through massproduction (see Table 5).
Table 5Indicator values – economy of scale, mass production.
Economy of scale, mass productionImmense price reduction potential 10Significant large price reduction potential or only possible
with large scale approach8
Decisive price reduction potential through mass production orlarge scale approach of advantage
6
Minor price reduction potential through mass production 4No significant price reduction potential through mass
production2
Information not available 0
2.3.5. DurabilityThe service lifespan of the house plays a major role in the
creation of local value as well as in resource consumption. Goodindicators to assess the durability of building technology includeresistance against insects and against natural deterioration, such ashigh humidity, earthquakes, flooding and wind loads (see Table 6).
Table 6Indicator values – durability.
Durability>40 years 10>30 years 8>20 years 6>10 years 4<10 years 2Information not available 0
2.3.6. Maintenance requirementsThe integration of maintenance requirements is relevant when
taking a holistic view of a building’s life cycle. Costs (as well asresources) can be saved by reducing maintenance requirements.This key indicator complements the initial construction costs byaccounting for the maintenance requirements over a building’s life-cycle (see Table 7).
Table 7Indicator values – maintenance costs.
Maintenance costs – interaction costs for corrective and preventive maintenanceSeldom interventions 10Interventions of low skill and cost level 8
Average interventions of medium skill and cost level 6Very frequent interventions 4Intervention of advanced skill and cost level 2Information not available 0
cal Indicators 18 (2012) 353–364 357
2
rpdau
TI
2
caff
TI
2
bsl
TI
2
da
TI
crit
eria
.
Cos
tp
erm
2
(su
per
stru
ctu
reon
ly)
Req
uir
emen
tsbu
ild
ing
pro
cess
,ski
lls
Tim
esc
hed
ule
,p
refa
bric
atio
nd
egre
e
Econ
omy
ofsc
ale,
mas
sp
rod
uct
ion
Mod
ula
riza
tion
and
flex
ibil
ity
Du
rabi
lity
Mai
nte
nan
cen
eed
sR
ecyc
lin
gp
oten
tial
,d
emol
itio
nab
ilit
y
Loca
lval
ue
crea
tion
–la
bou
r,m
ater
ial
Inte
rfac
ein
fras
tru
ctu
rean
dh
ousi
ng
tech
niq
ues
xx
xx
Has
tobe
tack
led
bya
busi
nes
sm
odel
xx
xx
xx
xx
xx
xx
xx
xx
xx
xx
xx
xx
xx
xx
xx
xx
H. Wallbaum et al. / Ecologi
.3.7. Modularization and flexibilityThis indicator captures a technology’s capacity to be delivered in
eady-engineered modules and kits as well as its flexibility to floorlan changes. Housing design needs to be flexible to adapt to theifferent needs of each location and cultures. This mainly aiming atfuture the expansion of a building unit to better satisfy the familynit’s space needs (see Table 8).
able 8ndicator values – modularization and flexibility.
Modularization and flexibilityHigh flexibility in case of change of use 10High modularization 8Medium modularization or medium flexibility in case of change of use 6Low modularization 4Low flexibility in case of change of use 2Information not available 0
.3.8. Local value creationThis indicator evaluates integrated design features that include
ommunities on both design and production process of sociallyccepted architecture. Moreover, housing schemes that fulfil mixedunctions and provide broad socio-economic to the locals are pre-erred (see Table 9).
able 9ndicator values – local value creation.
Local value creation B material availabilityAvailable in the country own open market with high potential for
large scale use10
Available in the country own open market with medium potentialfor large scale use
8
Available in the country potential market (not currentlycommercial)
6
Large degree of import 4Not available on the local market 2Information not available 0
.3.9. Interface to basic utilitiesThis indicator accounts for how each specific technology can
e connected with existing infrastructure such as drinking water,ewage, waste disposal and housing amenities (e.g. ventilation,ighting, heating, and energy) (see Table 10).
able 10ndicator values – interface to basic services.
Intersection to infrastructure and housing techniquesIntegrated within construction process, reduced efforts 10Minimal effort for integration 8Additional processes required such as wall chasing 6Large effort for integration 4Only exposed possible 2Information not available 0
.3.10. Recycling and demolition abilityThis indicator considers the potential and required effort for
emolishing and recycling the main construction components ofbuilding (see Table 11).
able 11ndicator values – recycling and demolition ability.
Recycling and demolition abilityHigh degree of recycling 10Low demolition effort 8Medium degree of recycling and demolition effort 6High demolition effort 4Low degree of recycling 2Information not available 0 Ta
ble
12O
verv
iew
key
chal
len
ges
and
asse
ssm
ent
Key
chal
len
ges
Scar
city
ofre
sou
rces
Lack
ofsu
ffici
ent
fun
ds
Shor
tage
du
eto
urg
ency
ofd
eman
dSh
orta
geof
skil
led
labo
ur
Qu
alit
yco
ntr
olW
asta
ged
ue
toin
effi
cien
cyLa
ckof
add
edva
lue
crea
tion
Qu
alit
yan
dlo
cati
on
3 cal Ind
2
tt
58 H. Wallbaum et al. / Ecologi
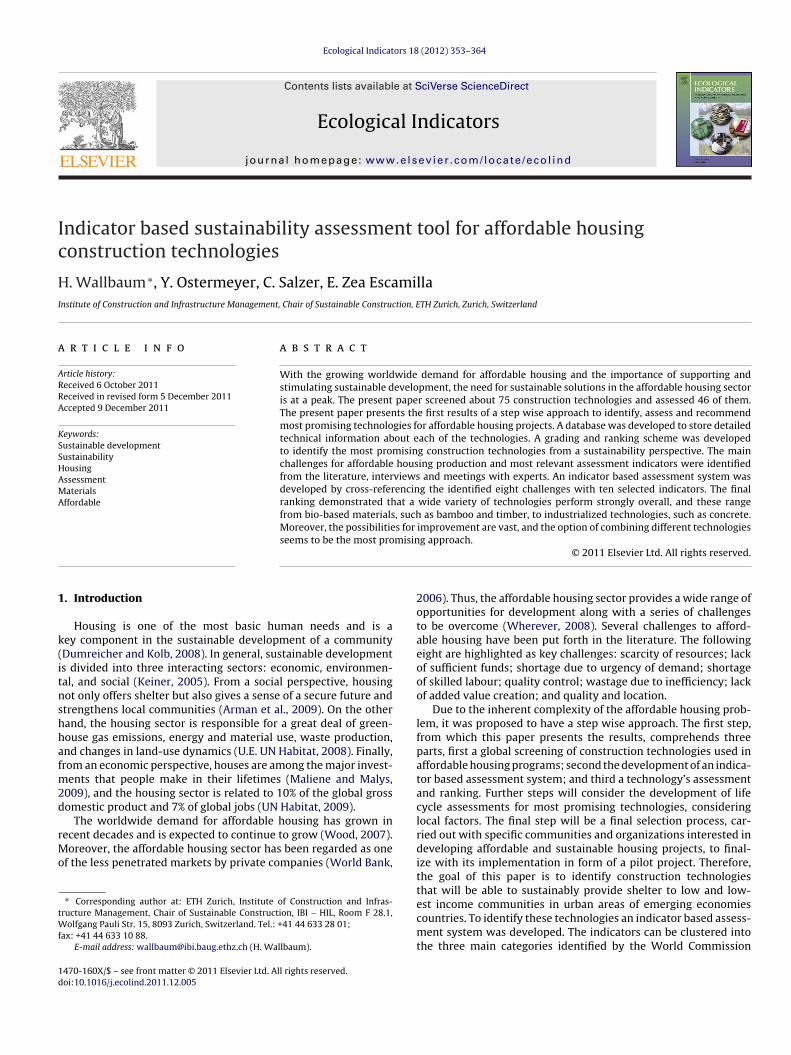
.4. Overview challenges and indicators
Table 12 presents how the identified challenges relate tohe proposed indicators. It can be observed that many indica-ors are able to assess the ability of a building technology in
Fig. 1. Sustainability assessment o
icators 18 (2012) 353–364
more than one key challenge. This show on one hand that the
proposed set of indicators covers the whole spectre of chal-lenges for affordable housing and in the other hand indicatesthat the set can still be refined without losing sensitivity on itsassessment.
f construction technologies.
H. Wallbaum et al. / Ecological Indicators 18 (2012) 353–364 359
tructi
3
aditcgppnra
3
e
Fig. 2. Average per cons
. Results
The final screening showed that the data had standard devi-tions of 0.98 showing that the results are very compact andistributed over a relatively short range. Fig. 1 shows that there
s no perfectly ranked technology under the proposed set of indica-ors. Only a few technologies were even ranked at the top of threeategories. These results demonstrate that the studied technolo-ies each have specific strengths. Many of them can be consideredromising depending on the emphasis of a particular housingroject. The final ranking also shows that the best-performing tech-ologies overall are not the best technologies in each category butather are those technologies that obtained average and above-verage results in each category.
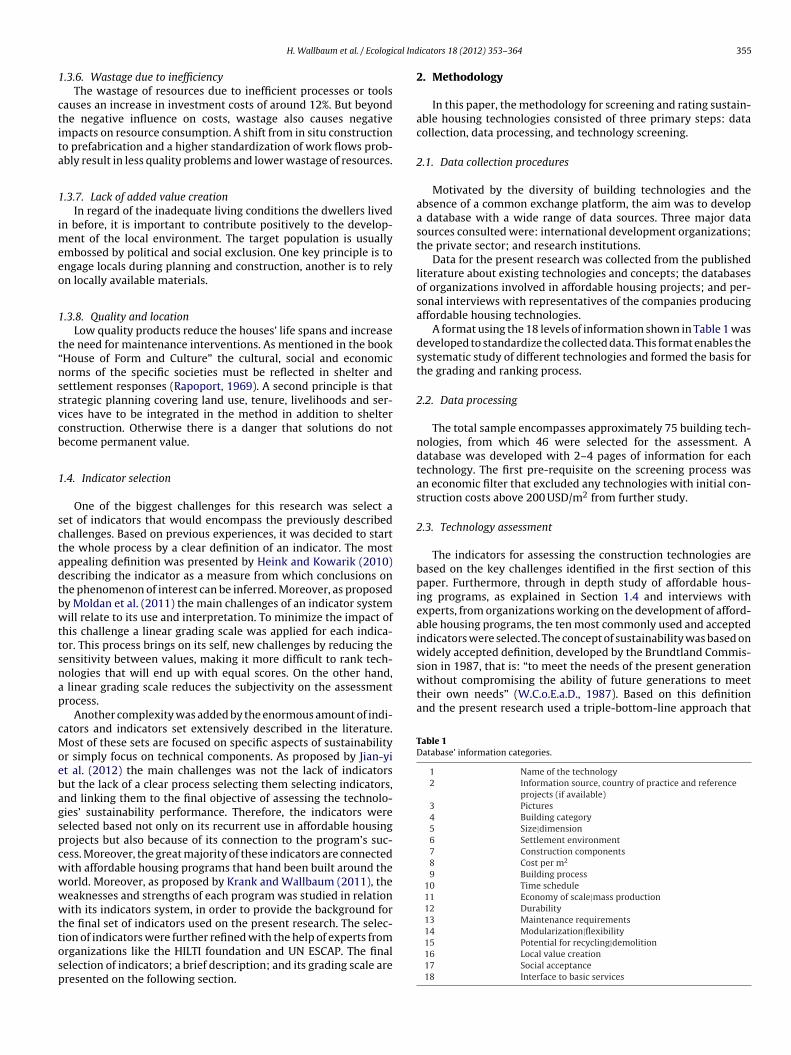
.1. Average per material’s group
Fig. 2 presents the results of the assessment aggregated by cat-gory. This approach helps to identify promising technologies in a
Fig. 3. Average per asse
on technology category.
general level and not simply identify individual over performingcases, which can be only applied on specific contexts. From graphs2 it is clear that bio based technologies have the highest scoresfollowed by industrialized products as concrete and syntheticallymaterials. While the categories metal and earth/soil obtained thelowest marks.
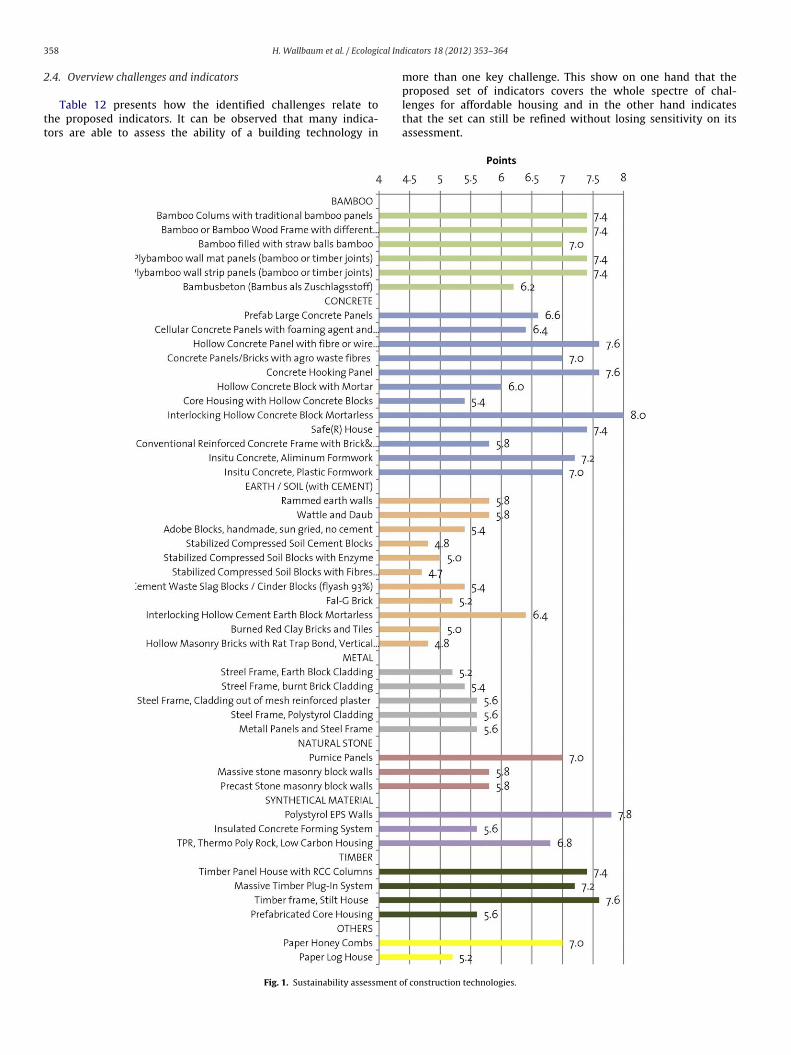
3.2. Average per assessment indicator
Fig. 3 presents the average results studied per indicator. Theseresults show that the studied sample of technologies perform verywell in terms of local added value creation; its recycling ability andthe skills requirements. On the other hand, it is clear that thereis significant room for improvement in relevant indicators such as
cost per square meter, economy of scale and durability among oth-ers. Furthermore, more research and efforts should be allocatedto further develop technology’s performance on the low scoringindicators.
ssment indicator.
360 H. Wallbaum et al. / Ecological Indicators 18 (2012) 353–364
arian
3
ttmpiitHi
eT
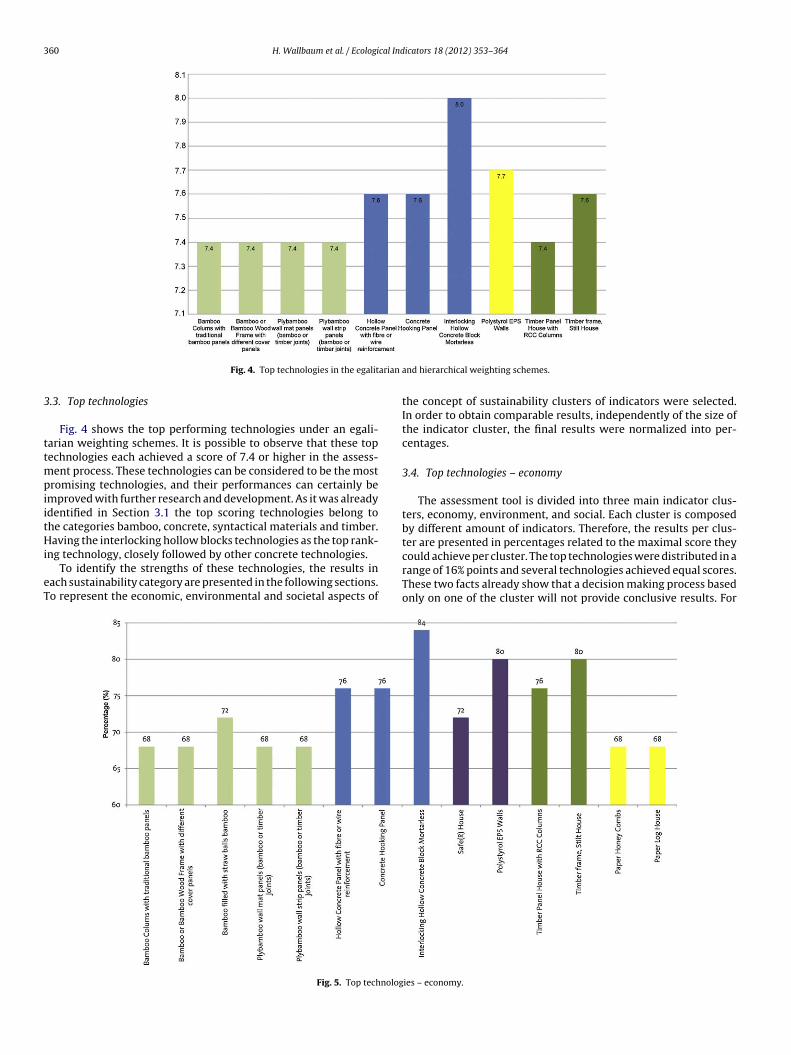
Fig. 4. Top technologies in the egalit
.3. Top technologies
Fig. 4 shows the top performing technologies under an egali-arian weighting schemes. It is possible to observe that these topechnologies each achieved a score of 7.4 or higher in the assess-
ent process. These technologies can be considered to be the mostromising technologies, and their performances can certainly be
mproved with further research and development. As it was alreadydentified in Section 3.1 the top scoring technologies belong tohe categories bamboo, concrete, syntactical materials and timber.aving the interlocking hollow blocks technologies as the top rank-
ng technology, closely followed by other concrete technologies.To identify the strengths of these technologies, the results in
ach sustainability category are presented in the following sections.o represent the economic, environmental and societal aspects of
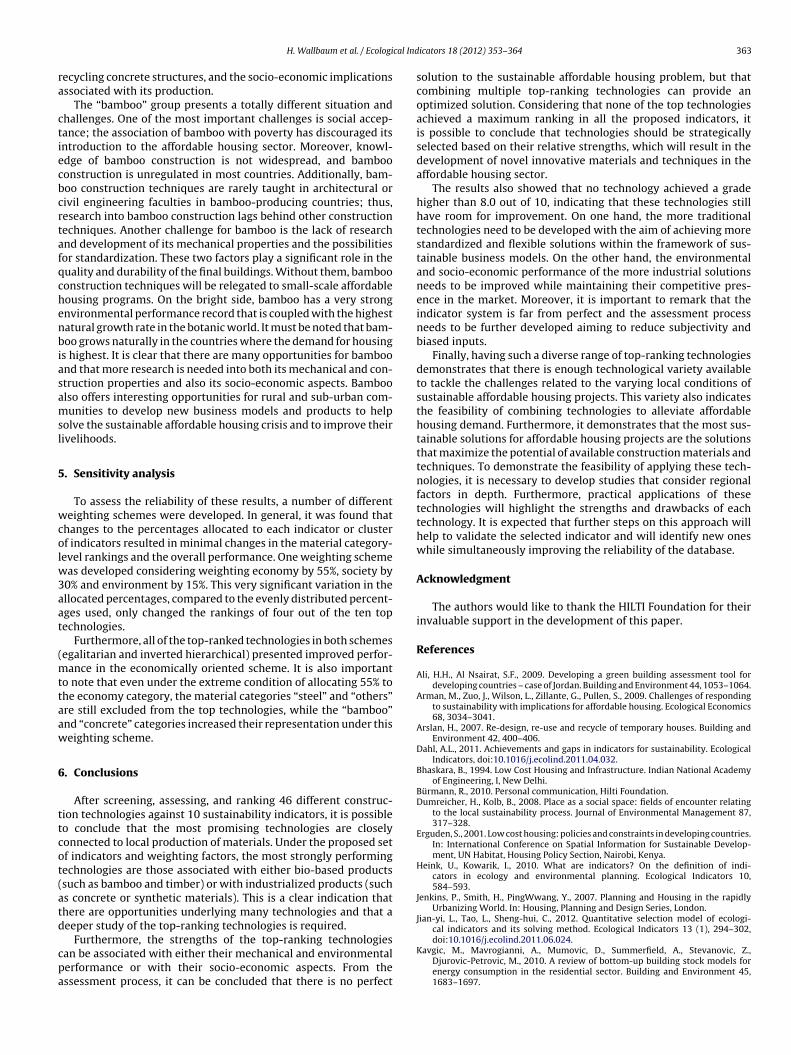
Fig. 5. Top technolog
and hierarchical weighting schemes.
the concept of sustainability clusters of indicators were selected.In order to obtain comparable results, independently of the size ofthe indicator cluster, the final results were normalized into per-centages.
3.4. Top technologies – economy
The assessment tool is divided into three main indicator clus-ters, economy, environment, and social. Each cluster is composedby different amount of indicators. Therefore, the results per clus-ter are presented in percentages related to the maximal score they
could achieve per cluster. The top technologies were distributed in arange of 16% points and several technologies achieved equal scores.These two facts already show that a decision making process basedonly on one of the cluster will not provide conclusive results. For
ies – economy.
H. Wallbaum et al. / Ecological Indicators 18 (2012) 353–364 361
techn
tpctii(
Fig. 6. Top construction
he economy cluster the most influential indicators were the coster square meter, the requirements of the building process, and theombined time schedule/degree of prefabrication. This shows that
echnologies that can be easily erected in short time, with a min-mum investment are preferred, indicating that prefabricated andndustrialized products will tend to perform better in this categorysee Fig. 5).
Fig. 7. Top technolo
ologies – environment.
3.5. Top construction technologies – environment
The results for the environment cluster have a range of 20%
points and again several technologies achieved equal marks indif-ferently from the material category they belong to. Nineteentechnologies were ranked as top for this cluster. This showsthat technologies with promising environmental performance are
gies – society.
362 H. Wallbaum et al. / Ecological Indicators 18 (2012) 353–364
techn
aatitbTg
3
gts
fIi
theprv
4
tnaidFatsfic
it
Fig. 8. Number of top ranking
vailable in a good number. Nevertheless, a detailed life cyclessessment, where local factors like energy sources and transporta-ion costs are considered, needs to be carried out in order to clearlydentify the most promising technologies. The results also showedhat the technologies achieving high scores on the indicators dura-ility and/or recycling potential were selected as top technologies.hus, showing the relevance of these indicators for the technolo-ies’ environmental performance (see Fig. 6).
.6. Top technologies – society
The society cluster consists of two indicators. The top technolo-ies on this cluster are distributed in a 20% point range. Seventeenechnologies were ranked as top and all of them achieved highcores (see Fig. 7).
This shows that the available technologies have great potentialor the creation of local value, either in terms of labour or materials.t is also clear that materials which are locally available or producedn situ will obtain higher scores given the proposed set of indicators.
The balance between environmental, social and economic fac-ors is a key to the development of sustainable and affordableousing. Moreover, it is possible to consider the negative reboundffect for example obtaining increased durability by raising therice per square meter or to use industrialized technologies toeduce cost and increase efficiency but simultaneously reduce localalue creation.
. Discussion
This paper assessed construction technologies that will be ableo sustainably provide shelter to low and lowest income commu-ities in urban areas of emerging economies countries and havell already been used in practice. For the identification of promis-ng technologies a set of 10 sustainability indicators have beeneveloped based on a literature review and personal interviews.urthermore criteria for grading from 0 to 10 with intermedi-te steps of 2 and linear ranking solutions were developed. Inotal 46 technologies have been assessed against the sample ofustainability indicators covering all material groups from bio-bres to metals and from long term established to pilot phase
onstructions.
The findings showed that all material groups were representedn the top technologies; in many cases, these technologies enablehe use of local materials. Socio-cultural and climatic condition
ologies by material category.
can also possibly be addressed by the top technologies because oftheir diversity. Generally, the level of information about these toptechnologies is high, making the evaluation reliable.
Improving the quality of the information in the database wouldcertainly the improve validity of these results. In addition, sometechnologies are closely connected with regional programs andenjoy high levels of local acceptance despite having objectiverestrictions and drawbacks.
Fig. 8 shows that material’s groups earth/soil; metal; naturalstone; and others had no technologies ranked at the top. This is aclear indication that highly industrialized construction techniques(such as steel frames, polystyrene cladding, and metal panels fromthe “metal” category or paper honey combs and rapid prototyp-ing from the “others” category) do not represent optimal solutionsto the sustainable affordable housing problem given the currentconditions and indicators.
The categories “timber” and “synthetic materials” show a veryinteresting trend. On one hand, timber products maintain itsposition as a prominent alternative technology despite claims oflow environmental and social performance in many developingcountries, but their performance can be improved with new modelsof production and certification. Moreover, education and researchin timber construction have a very long tradition, making it an easilyaccessible technology with enough knowledge and regulatory sup-port. On the other hand, synthetically produced materials are on therise, and these new and innovative products present very interest-ing approaches to the challenges of sustainable affordable housing.However, there are serious concerns about their environmentalperformance and about the local value that they can produce inthe long and short terms.
Finally, the two top-ranking material groups are to some extentinherently opposed, but each has undeniable strengths on its own.The case of concrete is very special, as many authors regard it asone of the most energy-demanding, carbon emission intensiveand waste-producing construction materials; at the same time, itsversatility is difficult to match. Beyond its well-known durabilityand mechanical strength, concrete can be easily mixed withother construction materials, it can be produced either at largeindustrial scales or at the local handcrafted level, and there is along tradition of concrete construction education and research.
These results show that there is a promising future for concrete inthe sustainable affordable housing sector, although there remainareas for improvement, including the negative environmentalimpacts from cement production, the difficulty in dismantling and
cal Ind
ra
ctiecbcrtafqchenbiasamsl
5
wcolw3aat
(mttaaw
6
ttcot(atd
cpa
H. Wallbaum et al. / Ecologi
ecycling concrete structures, and the socio-economic implicationsssociated with its production.
The “bamboo” group presents a totally different situation andhallenges. One of the most important challenges is social accep-ance; the association of bamboo with poverty has discouraged itsntroduction to the affordable housing sector. Moreover, knowl-dge of bamboo construction is not widespread, and bambooonstruction is unregulated in most countries. Additionally, bam-oo construction techniques are rarely taught in architectural orivil engineering faculties in bamboo-producing countries; thus,esearch into bamboo construction lags behind other constructionechniques. Another challenge for bamboo is the lack of researchnd development of its mechanical properties and the possibilitiesor standardization. These two factors play a significant role in theuality and durability of the final buildings. Without them, bambooonstruction techniques will be relegated to small-scale affordableousing programs. On the bright side, bamboo has a very strongnvironmental performance record that is coupled with the highestatural growth rate in the botanic world. It must be noted that bam-oo grows naturally in the countries where the demand for housing
s highest. It is clear that there are many opportunities for bamboond that more research is needed into both its mechanical and con-truction properties and also its socio-economic aspects. Bamboolso offers interesting opportunities for rural and sub-urban com-unities to develop new business models and products to help
olve the sustainable affordable housing crisis and to improve theirivelihoods.
. Sensitivity analysis
To assess the reliability of these results, a number of differenteighting schemes were developed. In general, it was found that
hanges to the percentages allocated to each indicator or clusterf indicators resulted in minimal changes in the material category-evel rankings and the overall performance. One weighting scheme
as developed considering weighting economy by 55%, society by0% and environment by 15%. This very significant variation in thellocated percentages, compared to the evenly distributed percent-ges used, only changed the rankings of four out of the ten topechnologies.
Furthermore, all of the top-ranked technologies in both schemesegalitarian and inverted hierarchical) presented improved perfor-
ance in the economically oriented scheme. It is also importanto note that even under the extreme condition of allocating 55% tohe economy category, the material categories “steel” and “others”re still excluded from the top technologies, while the “bamboo”nd “concrete” categories increased their representation under thiseighting scheme.
. Conclusions
After screening, assessing, and ranking 46 different construc-ion technologies against 10 sustainability indicators, it is possibleo conclude that the most promising technologies are closelyonnected to local production of materials. Under the proposed setf indicators and weighting factors, the most strongly performingechnologies are those associated with either bio-based productssuch as bamboo and timber) or with industrialized products (suchs concrete or synthetic materials). This is a clear indication thathere are opportunities underlying many technologies and that aeeper study of the top-ranking technologies is required.
Furthermore, the strengths of the top-ranking technologiesan be associated with either their mechanical and environmentalerformance or with their socio-economic aspects. From thessessment process, it can be concluded that there is no perfect
icators 18 (2012) 353–364 363
solution to the sustainable affordable housing problem, but thatcombining multiple top-ranking technologies can provide anoptimized solution. Considering that none of the top technologiesachieved a maximum ranking in all the proposed indicators, itis possible to conclude that technologies should be strategicallyselected based on their relative strengths, which will result in thedevelopment of novel innovative materials and techniques in theaffordable housing sector.
The results also showed that no technology achieved a gradehigher than 8.0 out of 10, indicating that these technologies stillhave room for improvement. On one hand, the more traditionaltechnologies need to be developed with the aim of achieving morestandardized and flexible solutions within the framework of sus-tainable business models. On the other hand, the environmentaland socio-economic performance of the more industrial solutionsneeds to be improved while maintaining their competitive pres-ence in the market. Moreover, it is important to remark that theindicator system is far from perfect and the assessment processneeds to be further developed aiming to reduce subjectivity andbiased inputs.
Finally, having such a diverse range of top-ranking technologiesdemonstrates that there is enough technological variety availableto tackle the challenges related to the varying local conditions ofsustainable affordable housing projects. This variety also indicatesthe feasibility of combining technologies to alleviate affordablehousing demand. Furthermore, it demonstrates that the most sus-tainable solutions for affordable housing projects are the solutionsthat maximize the potential of available construction materials andtechniques. To demonstrate the feasibility of applying these tech-nologies, it is necessary to develop studies that consider regionalfactors in depth. Furthermore, practical applications of thesetechnologies will highlight the strengths and drawbacks of eachtechnology. It is expected that further steps on this approach willhelp to validate the selected indicator and will identify new oneswhile simultaneously improving the reliability of the database.
Acknowledgment
The authors would like to thank the HILTI Foundation for theirinvaluable support in the development of this paper.
References
Ali, H.H., Al Nsairat, S.F., 2009. Developing a green building assessment tool fordeveloping countries – case of Jordan. Building and Environment 44, 1053–1064.
Arman, M., Zuo, J., Wilson, L., Zillante, G., Pullen, S., 2009. Challenges of respondingto sustainability with implications for affordable housing. Ecological Economics68, 3034–3041.
Arslan, H., 2007. Re-design, re-use and recycle of temporary houses. Building andEnvironment 42, 400–406.
Dahl, A.L., 2011. Achievements and gaps in indicators for sustainability. EcologicalIndicators, doi:10.1016/j.ecolind.2011.04.032.
Bhaskara, B., 1994. Low Cost Housing and Infrastructure. Indian National Academyof Engineering, I, New Delhi.
Bürmann, R., 2010. Personal communication, Hilti Foundation.Dumreicher, H., Kolb, B., 2008. Place as a social space: fields of encounter relating
to the local sustainability process. Journal of Environmental Management 87,317–328.
Erguden, S., 2001. Low cost housing: policies and constraints in developing countries.In: International Conference on Spatial Information for Sustainable Develop-ment, UN Habitat, Housing Policy Section, Nairobi, Kenya.
Heink, U., Kowarik, I., 2010. What are indicators? On the definition of indi-cators in ecology and environmental planning. Ecological Indicators 10,584–593.
Jenkins, P., Smith, H., PingWwang, Y., 2007. Planning and Housing in the rapidlyUrbanizing World. In: Housing, Planning and Design Series, London.
Jian-yi, L., Tao, L., Sheng-hui, C., 2012. Quantitative selection model of ecologi-cal indicators and its solving method. Ecological Indicators 13 (1), 294–302,
doi:10.1016/j.ecolind.2011.06.024.
Kavgic, M., Mavrogianni, A., Mumovic, D., Summerfield, A., Stevanovic, Z.,Djurovic-Petrovic, M., 2010. A review of bottom-up building stock models forenergy consumption in the residential sector. Building and Environment 45,1683–1697.
. Keiner, 2005. LinkHistory, definition(s) and models of sustainable development[Elektronische Daten] ETH e-Collection.
rank, S., Wallbaum, H., 2011. Lessons from seven sustainability indicator programsin developing countries of Asia. Ecological Indicators 11, 1385–1395.
aliene, V., Malys, N., 2009. High-quality housing—a key issue in delivering sustain-able communities. Building and Environment 44, 426–430.
athur, G.C., 1993. Low-Cost Housing in Developing Countries. Oxford & IBH Pub-lishing Co. Pvt. Ltd., New Delhi.
oldan, B., Janousková, S., Hák, T., 2011. How to understand and measure environ-
mental sustainability. Indicators and targets. Ecological Indicators.
onahan, J., Powell, J.C., 2011. An embodied carbon and energy analysis of modernmethods of construction in housing: a case study using a lifecycle assessmentframework. Energy and Buildings 43, 179–188.
apoport, A., 1969. House Form and Culture.
icators 18 (2012) 353–364
U.E. UN Habitat, 2008. Housing the Poor in Asian Cities. UN Habitat, UN ESCAP,Nairobi, Bangkok.
UN Habitat, 2009. Planning Sustainable Cities. Earthscan Ltd., Nairobi.W.C.o.E.a.D. 1987. WCED, Our Common Future. Oxford University Press.AMP.NATSEM, 2008. Wherever I lay my debt, that’s my home: trends in housing
affordability and housing stress 1995–96 to 2005–06. AMP.NATSEM Income andWealth Report.
Wood, J., 2007. Synergy city: planning for a high density, super-symbiotic society.
World Bank, 2006. In: Kalarickal, J., Buckley, R.M. (Eds.), Thirty Years of WorldbankShelter Lending. World Bank, Washington, DC.
Yao, Y., 2005. Environmental Friendly Building Materials Technologies for Low CostHousing, Beijing.