65
IAEA-TECDOC-1490 Indicators for management of planned outages in nuclear power plants April 2006

IAEA-TECDOC-1490
Indicators for management ofplanned outages in
nuclear power plants
April 2006

IAEA-TECDOC-1490
Indicators for management ofplanned outages in
nuclear power plants
April 2006

The originating Section of this publication in the IAEA was:
Nuclear Power Engineering Section International Atomic Energy Agency
Wagramer Strasse 5 P.O. Box 100
A-1400 Vienna, Austria
INDICATORS FOR MANAGEMENT OF PLANNED OUTAGES IN NUCLEAR POWER PLANTS
IAEA, VIENNA, 2006 IAEA-TECDOC-1490 ISBN 92–0–102706–0
ISSN 1011–4289 © IAEA, 2006
Printed by the IAEA in Austria April 2006

FOREWORD
The outages considered within the scope of this publication are planned refuelling outages (PWR and BWR nuclear power plants) and planned outages associated with major maintenance, tests and inspections (PHWR and LWGR nuclear power plants).
The IAEA has published some valuable reports providing guidance and assistance to operating organizations on outage management. This TECDOC outlines main issues to be considered in outage performance monitoring and provides guidance to operating organizations for the development and implementation of outage programmes which could enhance plant safety, reliability and economics. It also complements the series of reports published by the IAEA on outage management and on previous work related to performance indicators developed for monitoring different areas of plant operation, such as safety, production, reliability and economics.
This publication is based upon the information presented at a technical meeting to develop a standardized set of outage indicators for outage optimization, which was organised in Vienna, 6–9 October 2003. At this meeting, case studies and good practices relating to performance indicator utilization in the process of planned outage management were presented and discussed.
The IAEA wishes to express its gratitude to all experts who participated in the drafting and reviewing of the publication and to all those contributing with case studies. Particular thanks are due to C.R. Chapman (United Kingdom) and M. Ibanez (Spain) for their assistance in the compilation of this publication.
The IAEA officers responsible for this publication were R. Spiegelberg-Planner (through 2003) and J. Mandula (since 2004) of the Division of Nuclear Power.

EDITORIAL NOTE
The use of particular designations of countries or territories does not imply any judgement by the publisher, the IAEA, as to the legal status of such countries or territories, of their authorities and institutions or of the delimitation of their boundaries.
The mention of names of specific companies or products (whether or not indicated as registered) does not imply any intention to infringe proprietary rights, nor should it be construed as an endorsement or recommendation on the part of the IAEA.

CONTENTS
1. INTRODUCTION ............................................................................................................ 1
2. OUTAGE MONITORING ............................................................................................... 3
2.1. Assumptions for outage monitoring ........................................................................ 3 2.2. Indicator selection ................................................................................................... 4 2.3. Organization and responsibilities for the outage monitoring system ...................... 5 2.4. Use of indicators...................................................................................................... 5
3. OUTAGE INDICATORS................................................................................................. 6 3.1. Pre-outage indicators ............................................................................................... 6 3.2. Indicators for outage execution ............................................................................. 10
3.2.1. Work control management......................................................................... 10 3.2.2. Work quality control .................................................................................. 11 3.2.3. Safety ......................................................................................................... 11
3.3. Post-outage evaluation .......................................................................................... 13
4. CONCLUSIONS ............................................................................................................ 16
BIBLIOGRAPHY .................................................................................................................... 17
ANNEX I: DUKOVANY NPP, CZECH REPUBLIC, REFUELLING OUTAGE INDICATORS........................................................ 19
ANNEX II: OLKILUOTO NPP, FINLAND, OUTAGE INDICATORS............................. 31
ANNEX III: ASCO NPP, SPAIN, DOSE INDEX................................................................. 37
ANNEX IV: CERNAVODA NPP, ROMANIA OUTAGE INDICATORS.......................... 43
CONTRIBUTORS TO DRAFTING AND REVIEW ............................................................. 55


1. INTRODUCTION
Planned outages are an important part of plant operational performance. The time expended on planned outages is frequently the most significant contributing factor to plant unavailability. The scope and quality of work undertaken during planned outages directly affects operating reliability, the number of unplanned outages and maintenance costs. Moreover, experience has shown that outages may create plant safety problems unless properly planned, executed, monitored and followed up.
Depending on the type of NPP technology, the scope of planned outages usually encompasses the following activities:
• Refuelling the reactor
• Inspection of different components and structures
• Tests and surveillance of process and safety systems
• Preventive and corrective maintenance
• Minor or major design modifications.
Outage management is a complex task that involves the co-ordination of available resources, regulatory and technical requirements and all outage activities before and during the outage.
The planned outage can be considered successful when it meets the following main requirements: an outage with low risk, no deviation from or violation of licensing conditions, minimum impact on personnel and the environment, no significant unscheduled events, an optimized scope of work, schedule adherence, good work quality (no re-work) and an efficient use of material, human and financial resources.
Management of planned outages can be divided into three main phases:
• Pre-outage period (work scheduling and activation of resources)
• Outage execution (implementation of planned work)
• Post-outage evaluation.
Planning and preparation of an outage is the foundation of success for managing outage execution in an optimal manner. A post-outage evaluation applies to the whole outage process. It aims to identify and take into consideration possible risks in the next outage and ensure that the plant operates smoothly, efficiently, safely and without unplanned energy losses in the next production cycle.
The processes during outage preparation and execution should be monitored and evaluated continuously using outage management indicators. Various sets of indicators are used at nuclear power plants to efficiently monitor and assess outage preparation and execution. Usually those indicators are plant specific; nevertheless it is possible to identify a subset of indicators that may be used in general.
Many NPPs are continuously working on programmes to optimize the duration of planned outages and thereby reduce the associated planned energy losses and minimize unplanned
1

energy losses related to equipment failures. Such a process leads to operation with higher plant availability.
Outage optimisation seeks to ensure that scheduled work is performed effectively, safely and within budget, while keeping the outage time at an optimum. The objectives for good and efficient outage execution are a safe status of the unit during the outage, disturbance-free operation of the next cycle, and execution of the outage according to schedule and budget, with the minimum impact on personnel and the environment.
An operating organization’s business plans include goals and objectives for normal operation and outage periods. Monitoring of progress toward the goals may be achieved by the use of plant-specific performance indicators.
Indicators are one of the management tools for performance monitoring and latent weakness identification. They are dynamic and can provide management with a timely warning. The use of indicators can improve the process of outage optimisation as well as identification of weaknesses and prompt implementation of corrective actions or improvements for the next outage. Management should ensure the involvement of all relevant personnel in applying and interpreting the indicators and improving performance.
Continuing development and application of outage indicators could further make benchmarking processes easier at a utility, national or international level. Nevertheless, comparison of plant-specific indicators should be made with care, bearing in mind that inappropriate comparison between units can be misleading and can cause inappropriate goals to be established as a result of differences in design, regulatory environments and other external factors.
This publication outlines a set of outage indicators that could be considered by operators of nuclear power plants when establishing or revising their own specific outage indicator systems.
This publication is based on case studies that were elaborated by participants of the technical meeting held 6–9 October 2003. This introduction provides a background to the project. Section 2 presents an overview of assumptions for outage monitoring, classification of outage indicators according to different phases of outage, and areas to be monitored. Section 3 provides definitions of selected outage indicators widely used to monitor outage success in the main outage phases: pre-outage preparation, outage execution and post-outage evaluation. Examples of case studies dealing with outage indicators are given in the annexes. Representatives from thirteen countries with different NPP designs (PWR, BWR, PWR-WWER, LWGR, PHWR) participated in the preparation of the case studies.
2

2. OUTAGE MONITORING
For safe operation of an NPP, all periods including planned outages have to be considered as part of the whole process. This means that outages are part of the normal operation process and are integrated into the business process of the NPP organization.
Effective outage planning and control requires the involvement, including coordination, communication and awareness of plant status, of personnel at all organizational levels. For this reason, at NPPs an outage monitoring system is implemented that follows all fundamental and critical activities and deadlines in each phase of the outage.
NPP management needs a monitoring system that incorporates a systematic review of actual results and compares these with expectations established by objectives. NPP management has to be able to respond promptly to any situation when the above-mentioned attributes are not achieved.
Nuclear industry experience has shown that an effective way to perform outage monitoring is to use a set of indicators that reflect, in a quantitative manner, the achievements of different aspects of the outage process.
2.1. Assumptions for outage monitoring
The basic function of an outage monitoring system is to gather and evaluate quantitative and qualitative information for prompt and effective decision-making. The information should cover all aspects, commencing with safety of the plant and personnel, and continuing with work management and cost.
The main areas for outage monitoring can be considered as:
• Safety – Nuclear – Radiation – Industrial – Configuration control
• Work management – Work task planning/scheduling – Adherence to the schedule. – Human performance – Work quality
• Cost effectiveness – Budget variation
Safety is the first priority in any activity at an NPP. Because the planned outage is a period having a high concentration of work activities and of personnel in potentially hazardous conditions, the safety aspects are fundamental and are reflected comprehensively when activities are planned and scheduled. During outage execution any deviation from safety requirements and limits should be monitored and investigated.
3

Nuclear safety should be monitored, examining the application of safety critical parameters in different plant configurations, as required by operational limits and conditions during execution of outage tasks. The use of indicators and risk monitoring, or other methods widely used to assess nuclear safety, is a part of so called “shutdown risk management”.
Radiation safety monitoring concentrates on radiation conditions at the unit, individual and collective radiation exposure, and any impact on the environment caused by releases and radioactive waste.
Industrial safety reflects the hazards of outages due to the status of the systems, structures and components, the amount of work and increased numbers of personnel on site.
Configuration control reflects the balance between the actual situation and the associated documentation.
The indicators related to management of the outage should contain all aspects including: planning and scheduling, preparation of documentation (work plans, work packages for modification and maintenance, submissions to the regulatory body and work permits), execution of the work in the field according to the schedule, work quality (number of re-workings, deviation from specifications) and human performance (deviations from procedures, and productivity). With few exceptions, most of these indicators are intended to check the deviation from the planning and to measure the effectiveness of work progress and outage execution.
Cost indicators, such as the budget allocated to the plant outage, are important items in a business plan. Deviations from projected figures should be monitored, while the allocation of costs to specific projects, departments or tasks, facilitates good cost control.
All the above-mentioned areas apply to each of the three phases (pre-outage, outage execution, post-outage). The three phases should be understood as a closed loop, although the application and importance of a particular indicator might vary, depending on the current status of the plant.
Performance indicators related to the pre-outage phase are focused on outage scope, progress monitoring during this phase, and adherence to the pre-outage milestones. Safety and cost aspects are implicitly considered during the planning and scheduling process.
After an outage, performance indicators are used to evaluate unit reliability (reflecting the quality of work that has been done) and for outage overall evaluation, which is provided in the Outage Evaluation Report, where all monitored areas are analysed in detail.
2.2. Indicator selection
Selection of adequate indicators is necessary for proper functioning of the whole system. In the implementation of outage monitoring, consideration should be given to the quality of the information that each indicator provides.
The following criteria can be used when selecting a particular indicator for the monitoring system:
• There is a direct relationship between the indicator and the area to be covered • The indicator can be expressed in quantitative terms
4

• The indicator is unambiguous and it’s meaning is well understood • The indicator can be considered as a part of normal outage activities and is commonly
used • Goals and thresholds can be specified for the indicator results • The necessary data are available or capable of being generated at a high standard
(complete, correct and on time) and with minimum possibility of that data being manipulated
• The indicators can be validated (the accuracy of the data at each level can be subjected to quality control and verification)
• Proper corrective actions can be taken on the basis of the indicator.
2.3. Organization and responsibilities for the outage monitoring system
Once the management of an NPP decides to implement an outage monitoring system using outage indicators, it is recommended that the following steps be taken:
• System establishment and development:
A dedicated team is assigned for system development covering activities related to: review of existing documents and international experience, indicator selection and definition, system description, elaboration of procedures, identification of resources, database and software development. The team collectively should have complete knowledge of outage activities and outage management.
• Responsibility assignment:
Personnel within the NPP should be assigned for data collection, indicator calculation and system administration.
• Data collection:
Data providers are responsible for timely reporting in prescribed periods, especially during outage execution, when information is needed and used daily. The complexity and variety of outage activities in all phases of the outage requires the use of an automatic system for data collection and storage. An integrated management system, with a dedicated module for maintenance, should be implemented. Several commercial software packages are available.
It is the responsibility of management to undertake a periodic evaluation of the outage monitoring system, using feedback from users and operational experience. The review should consider the following aspects:
• System performance — e.g. implementation of the process itself, set of indicators, data quality, availability of computerised tools, supporting adequate software
• System effectiveness — e.g. undertaking outage duration, cost, number of events.
2.4. Use of indicators
Outage performance indicators, which are used for monitoring status during outage preparation, outage execution and post-outage evaluation have two complementary functions:
5

• The first function is used particularly by the outage manager and by outage teams. Such indicators, evaluated daily or weekly (depending on the outage phase), provide important information about adherence to the schedule, unplanned findings, events or other difficulties that can affect the smooth running of an outage. Data for indicators, which are used for this purpose, are usually collected continuously during an outage. These indicators are important for immediate decision-making and corrective measures that may need to be applied to the current outage.
• The second function is to provide an experience feedback tool for post-outage evaluation. By comparing values to the history, and by benchmarking, they can help to identify and analyse weaknesses related to any of the outage phases. The corrective measures specified, based on the identified problems, can be applied in the future and are reflected in preparing for the next outage.
The indicators have to be evaluated against expectations and goals. Therefore, it is recommended to establish for each selected indicator a goal and thresholds. Goals should be set for each indicator based on experience and analysis. They should be meaningful, achievable, and aggressive, i.e. conducive to improvement.
Indicators that could be used by NPP operating organizations are offered in the next section. An organization can choose those appropriate to the status of maturity of operation and existing databases holding the necessary information. Considering that outage indicators are used as a tool to monitor the status of different outage activities, it is recommended to start with the areas or phases that most need improvements.
For possible benchmarking, consideration should be given to the preservation of definition, concept and way of calculation of outage indicators offered here.
3. OUTAGE INDICATORS
This section provides a set of potential outage performance indicators to:
(1) monitor progress during the pre-outage phase and adherence to the pre-outage milestones; (2) assess outage execution; (3) evaluate, during the post-outage phase (including the start up after connection to the grid)
and the next production cycle, the efficiency and quality of the work done.
3.1. Pre-outage indicators
The purpose of pre-outage indicators is to monitor progress during the pre-outage phase and adherence to the pre-outage milestones. In this way, the indicators should be used to assist in the monitoring of the scope of outage work and in developing an overall schedule, in adhering to the milestones of this period, and in identifying, in advance, deviations and correcting them proactively and on a timely basis.
Examples of pre-outage milestones or activities are:
• Outage goals and objectives defined • Outage organization established and outage team members nominated • Outage work scope defined and critical path scheduled
6

• Outage work scope frozen (maintenance and modifications) • Outage contracts completed and provided • Work packages prepared (maintenance and modifications) • Work packages scheduled • Work permits prepared (including radiation protection, fire protection, industrial safety) • Equipment isolations prepared • Spare parts and materials available at the site • Personnel training completed • Independent outage safety review completed • Outage plan and works approved by the plant management and the Regulatory Body, if
applicable.
Possible indicators are:
1. Scope of outage works
Purpose: To give an indication of outage task list.
Definition (data elements): The total number of work tasks that could be expressed by the following data:
• Work requests • Work orders • Work packages • Work permits.
These indicators can be evaluated at a department level (mechanical, electrical, I&C, operation, radiation protection, fire protection, etc). Also they can be categorised as planned and unplanned.
Note: The absolute values of these indicators depend on the arrangement of the work management system, and are usually plant-specific. Accordingly, these indicators are used more when identifying trends than for evaluation of effectiveness of pre-outage activities, and are rarely used for benchmarking.
2. Work load
Purpose: To give an indication of outage work and the extent of human resources needed. This indicator can be calculated for the whole outage, as well as for each particular day of the outage, to optimize human resources and contracts.
Definition (data elements): The total number of man-hours required for implementation of specified work within the outage. Data elements are man-hours planned for both plant personnel and contractors.
Unit: man-hour
Note: Unlike the indicator above it is not so dependent on outage management systems, which are usually plant specific.
7

3. Work preparedness
Purpose: To provide a measure of progress of the work package preparation. The target is to maximize the ratio of timely-prepared work packages.
Definition (data elements): The ratio of the number of work specifications that are ready at a required milestone or deadline, to the total number of work specifications expected to be ready, multiplied by 100.
The work tasks could be expressed by the following data elements:
• Work requests • Work orders • Work packages • Work permits.
Unit: %
Note: This indicator should be calculated for particular departments (mechanical, electrical, I&C, operation, etc). The same data elements can be used for calculating the delayed preparation ratio (after the freeze date).
4. Work structure
Purpose: To provide information about the structure of work tasks, planned for the outage.
Definition (data elements): The ratio of the number of work tasks related to the work categories specified below, to the total number of work tasks, multiplied by 100. It is a percentage of the following work tasks:
• Standard preventive maintenance and surveillance activities prescribed for the reference outage
• Corrective maintenance • Design modifications and investment projects.
Unit: %
5. Work scope stability
Purpose: To determine work planning effectiveness
Definition (data elements): The ratio of the number of changes in work tasks, to the total number of work tasks at the freeze date, multiplied by 100.
6. Provisional outage duration
Purpose: To provide information about the expected duration of the outage, considering critical paths. This information is used for outage optimization.
Definition (data elements): Number of hours/days required for implementation of all the planned work tasks.
Unit: hour/day
8

Note: The duration between unit disconnection from the grid and its reconnection. This indicator can also be used for the different outage execution phases.
7. Provisional outage financial budget
Purpose: To provide information about the expected budget needed for outage work task implementation. This information is used for outage optimization.
Definition (data elements): Budget required for implementation of all planned work tasks.
Unit: relevant currency
8. Provisional outage dose budget
Purpose: To provide information about the expected doses related to outage work task implementation. This information is used for outage optimization.
Definition (data elements): Collective radiation doses related to implementation of all the planned work tasks. Calculated from doses planned for each particular work task in a controlled area.
Unit: sievert
9. Contract preparedness
Purpose: To measure the progress in contract timely preparation for the planned work tasks.
Definition (data elements): The ratio of the number of contracts (the number of contractor personnel) already awarded during the pre-outage phase, to the number of contracts needed for an outage, considering the contract award schedule, multiplied by 100.
Unit: %
10. Spare parts and materials availability
Purpose: To assure that each activity requiring spare parts and materials can be executed according to the outage schedule. The availability of the spare parts and materials means that they are verified and found ready for the activity.
Definition: The ratio of the number of spare parts and materials available at the pre-outage phase (in a timely manner) at the site, to the total number required, multiplied by 100.
Unit: %
11. Outage personnel training
Purpose: To measure the progress of outage personnel training and qualification.
Definition (data elements): The ratio of the number of personnel trained in a preparation period, to the number of personnel for whom training was required, multiplied by 100.
Note: Can be calculated for a department, and separately for contractors.
9

Unit: %
12. Regulatory body involvement
Purpose: To measure the fulfilment of the Regulatory Body requirements.
Definition (data elements): The ratio of the number of outage work tasks that have been approved by a Regulatory Body (modifications, refuelling approval, outage scope, etc), to the number of work tasks identified for the outage as requiring Regulatory Body approval, multiplied by 100.
Unit: %
13. Independent safety review of outage planning
Purpose: To assess the quality of safety-related outage planning.
Definition (data elements): Number of safety-related changes in the outage plan identified through the independent safety revision.
3.2. Indicators for outage execution
The purpose of the indicators used during the outage is to assess work progress, adherence to the schedule, and safety-related requirements. Indicators are used for effective outage management and in the decision-making process. Indicators also provide a tool for clear communication among all outage participants: NPP management, plant departments, plant personnel, contractors and crews. They are used in daily meetings as well as for on-line tracking systems.
The following indicators are used by many NPPs:
3.2.1. Work control management
1. Timeliness of critical path activities
Purpose: To provide outage managers with information about the actual situation in adhering to the planned schedule for critical path activities.
Definition (data elements): Time deviation for tasks on the critical path (in advance or delayed) compared with the outage schedule.
Unit: hour
2. Timeliness of work task implementation
Purpose: To provide actual (daily) information about the work tasks initiated and completed on time. Timeliness of work task implementation is a key point for outage schedule adherence. The indicator provides also information about the percentage of uncompleted tasks.
Definition (data elements): The ratio of the actual number of work tasks initiated/completed, to the total number of work tasks scheduled (on a daily basis), multiplied by 100.
10

Unit: %
3. Effectiveness of operation tasks
Purpose: To monitor effectiveness of operations tasks affecting outage progress.
Definition (data elements): Number of delays in completing the operational staff tasks related to outage activities.
4. Workload utilization
Purpose: To monitor efficiency in the utilization of planned workload and to analyze the actual range of outage activities.
Definition (data elements): The ratio of the actual workload (in man-hours), to the planned workload, multiplied by 100.
Unit: %
Note: The indicator could be evaluated both on plant level and department level.
3.2.2. Work quality control
1. Re-work rate
Purpose: To monitor work quality.
Definition (data elements): The ratio of the number of re-worked tasks, to the total number of works tasks, multiplied by 100.
Unit: %
Note: At some plants the percentage of successful post-maintenance tests is used as a measure of work quality.
2. Equipment isolation
Purpose: To monitor the correctness of equipment isolation
Definition (data elements): The number of incorrect equipment isolations.
3.2.3. Safety
1. Individual radiation doses
Purpose: To control and track the individual doses globally or by specific activities during the outage, in accordance with ALARA principles and the goals determined during the planning phase.
Definition: The daily maximum individual effective dose of personnel involved in the outage.
Unit: sievert
11

Note: The indicator can be calculated for specific outage activities and equipment.
2. Individual doses above the administrative limits
Purpose: To assess the effectiveness of the ALARA programme.
Definition: Number of personnel having doses higher than the plant administrative limit.
3. Daily collective dose assessment
Purpose: To assess the effectiveness of the ALARA programme.
Definition (data elements): The daily ratio of actual accumulated collective dose to the planned collective dose budget for the outage, multiplied by 100.
Unit: %
Note: At some plants the Dose Index is used in preference to the Collective Dose. The Dose Index is a ratio of the accumulated effective dose, to the relevant man-hours of workload during the specific period of the outage.
4. Number of contamination events
Purpose: To assess the effectiveness of the ALARA programme.
Definition (data elements): Number of personnel contamination events and area contaminations.
5. Industrial safety events and associated near misses
Purpose: To assess the effectiveness of the industrial safety programme at the plant.
Definition (data elements): Number of industrial safety events and associated near misses during the outage.
6. Fire hazard events during outage
Purpose: To assess the effectiveness of the fire protection programme ate the plant.
Definition (data elements): Number of fire hazard events during the outage.
7. Nuclear safety related events
Purpose: To assess the effectiveness of nuclear safety programmes through the occurrence of the operating organization’s reportable events and associated near misses.
Definition (data elements): Number of nuclear safety-related events and associated near misses.
8. Number of operating limits and conditions entries
Purpose: To assess safety-related equipment reliability and effectiveness of operation controls.
12

Definition (data elements): The indicator is defined as the total number of unplanned Operaing Limits and Conditions entries during the outage.
3.3. Post-outage evaluation
The purpose of post-outage indicators is to evaluate, during the post outage phase, the efficiency and quality of the outage. This evaluation should be done during the month after the outage.
The following indicators may be used after the outage:
1. Outage cost
Purpose: To provide information about the outage cost and adherence to the budget.
Definition (data elements): The ratio of the actual cost, to the financial budget, multiplied by 100.
Unit: %
2. Outage duration
Purpose: To evaluate the total outage duration and to compare the result with the plan.
Definition (data elements): Number of days required for implementation of all outage work tasks between unit disconnection from a grid and its reconnection.
Unit: day
Note: It is recommended to use results of this indicator together with planned values.
3. Outage extension
Purpose: To evaluate an unplanned extension of the outage duration, compared with the planned duration of the outage.
Definition (data elements): Number of days/hours of the unplanned extension.
Unit: day/hour
4. Start up period effectiveness
Purpose: To monitor the process of unit start-up after the outage. This indicator measures the quality of the outage and also the effectiveness of control room operations during the start-up phase.
Definition (data elements): The ratio of the actual time taken for the plant start-up phase, to the standard duration of this phase, multiplied by 100.
Unit: %
13

Note: Due to the standard scope of the start-up period this indicator is suitable for benchmarking. Similarly defined indicators can be used for other outage phases.
5. Ratio of corrective and preventive maintenance
Purpose: To identify trends in the condition of the plant equipment and to optimise maintenance strategy.
Definition (data elements): The ratio of the number of work tasks for corrective maintenance during the outage, to the total number of maintenance tasks, multiplied by 100.
Unit: %
6. Unplanned work
Purpose: To assess unplanned work needed during the outage
Definition (data elements): The ratio of the number of unplanned work tasks (not included in the work package scope), to the total number of work tasks during the outage, multiplied by 100.
Unit: %
Note: Special attention should be paid to the unplanned modifications, because they significantly complicate the outage progress and cost.
7. Not executed planned work
Purpose: To assess the extent to which planned work is deferred.
Definition (data elements): The ratio of work tasks not executed, to the total number of work tasks during the outage, multiplied by 100.
Unit: %
8. Unplanned energy losses resulting from poor quality work
Purpose: To measure the quality of outage work.
Definition (data elements): Unplanned energy losses under the control of plant management resulting from poor quality work undertaken during the outage, and observed during the following fuel cycle (or plant specific time) after the end of the outage.
Units: MW•h
9. Failure reports during the next cycle related to work done during the outage
Purpose: To measure the quality of outage work.
Definition (data elements): Number of failures of the equipment maintained in the outage during the next cycle.
14
10. Radioactive waste volume and releases
Purpose: To minimise the radioactive waste volume and releases.
Definition (data elements): The ratio of solid radioactive waste volume and amount of liquid and gaseous releases during the outage, to the standards, multiplied by 100.
Units: %
11. Material availability
Purpose: To assess effectiveness of the procurement process.
Definition: The number of cases when work tasks were not executed as planned due to lack of material or spare parts.
12. Foreign material intrusions
Purpose: To avoid foreign material intrusions to the plant systems and problems caused by them (fuel leakages, operation disturbances etc.).
Definition (data elements): The number of events with foreign material intrusions.
13. Collective radiation exposure
Purpose: To assess the effectiveness of radiological protection programmes in minimizing radiation exposure to plant personnel.
Definition (data elements): The collective radiation exposure is defined as the sum of individual external and internal radiation exposures, determined for all NPP personnel and contractors during the outage.
Units: sievert
14. Human errors
Purpose: To identify trends in the performance of the contractors and NPP personnel.
Definition (data elements): Number of human-related events and near misses related to NPP personnel and contractors.
15. Suggestions for improvements
Purpose: To assess the effectiveness of the outage suggestion system.
Definition (data elements): The number of suggestions to improve the outage performance.
15

4. CONCLUSIONS
Management of planned outages is a complex task that involves the planning and co-ordination of available resources and all outage activities. Operating organizations are continuously working on programmes to optimize the duration of planned outages and thereby increase plant availability.
Outage management indicators provide a tool for continuous and systematic monitoring and evaluation of processes during outage preparation and execution and for identifying latent weaknesses. Early indication of deviations helps plant management to better control outage processes. Indicator trend analyses and benchmarking can help in outage optimization process.
This TECDOC presents principles and assumptions for outage monitoring using a set of quantitative indicators. It provides guidelines for plant specific outage monitoring system implementation, criteria for selection of outage performance indicators and their appropriate use.
Based on international practices a set of potential indicators for an outage monitoring system has been presented. Annexes illustrate that various sets of indicators are used at nuclear power plants to efficiently monitor and assess outage processes.
Managers of NPP operating organizations can consider these recommendations and indicators for use in the plant outage monitoring system. Standardized definitions of indicators create the possibility to use some indicators for benchmarking.
16

BIBLIOGRAPHY
INTERNATIONAL ATOMIC ENERGY AGENCY, Good Practices for Outage Management in Nuclear Power Plants, IAEA-TECDOC-621, IAEA, Vienna (1989).
INTERNATIONAL ATOMIC ENERGY AGENCY, Good Practices for Cost Effective Maintenance in Nuclear Power Plants, IAEA-TECDOC-928, IAEA, Vienna (1997).
INTERNATIONAL ATOMIC ENERGY AGENCY, Evaluating and Improving Nuclear Power Plant Operating Performance, IAEA-TECDOC-1098, IAEA, Vienna (1999).
INTERNATIONAL ATOMIC ENERGY AGENCY, Operational Safety Performance Indicators for Nuclear Power Plants, IAEA-TECDOC-1141, IAEA, Vienna (2000).
INTERNATIONAL ATOMIC ENERGY AGENCY, Nuclear Power Plant Outage Optimization Strategy, IAEA-TECDOC-1315, IAEA, Vienna (2002).
INTERNATIONAL ATOMIC ENERGY AGENCY, The Power Reactor Information System (PRIS) and its Extension to Non-electrical Applications, Decommissioning and Delayed Projects Information, Technical Reports Series No. 428, IAEA, Vienna (2005).
17

Annex I
DUKOVANY NPP, CZECH REPUBLIC REFUELLING OUTAGE INDICATORS
1. INTRODUCTION
Nuclear Power Plant Dukovany is a four-unit station operating VVER-440/V213 reactors. Total gross power capacity of the plant is 1760 MWe. The plant has been constructed according to the original Russian design and was commissioned between 1985 and 1987.
The reactor coolant system consists of six loops with one horizontal steam generator and one reactor coolant pump per loop. Each primary loop can be isolated from the reactor by two main gate valves.
The steam produced in the unit’s six steam generators drives two main turbine-generators of 220 MWe rated power each.
Before 1993, mostly plant maintenance groups had carried out the plant maintenance. Contractors provided only maintenance and overhauls of major components (steam generators, turbine-generators). In 1993, the plant maintenance groups were privatized, and currently, contractors on a commercial basis perform most of maintenance tasks.
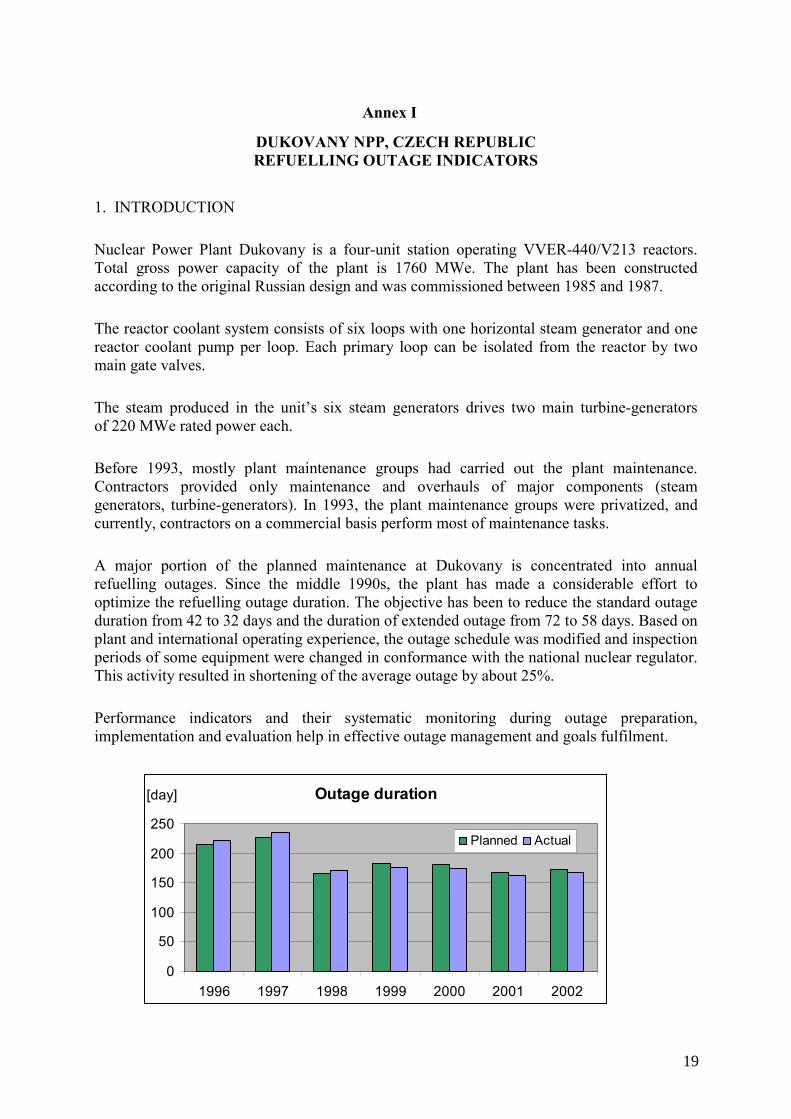
A major portion of the planned maintenance at Dukovany is concentrated into annual refuelling outages. Since the middle 1990s, the plant has made a considerable effort to optimize the refuelling outage duration. The objective has been to reduce the standard outage duration from 42 to 32 days and the duration of extended outage from 72 to 58 days. Based on plant and international operating experience, the outage schedule was modified and inspection periods of some equipment were changed in conformance with the national nuclear regulator. This activity resulted in shortening of the average outage by about 25%.
Performance indicators and their systematic monitoring during outage preparation, implementation and evaluation help in effective outage management and goals fulfilment.
Outage duration
0
50
100
150
200
250
1996 1997 1998 1999 2000 2001 2002
[day]
Planned Actual
19

2. INDICATOR OVERVIEW
2.1. Outage preparation
The planned outage preparation consists in defining the scope of outage, developing an overall schedule of activities to be carried out during the outage and generating of work orders.
The outage activities can be grouped by their nature as follows:
• Standard activities during a reference outage; the standard activity plan can be modified within annual planning according to the actual unit condition.
• Removal of faults that occurred during the fuel cycle and which of repair could be postponed until the refuelling outage.
• Implementation of minor unit design modifications.
• Implementation of investment projects (major design modifications, equipment replacement, etc.).
The individual investment projects and design modifications are judged by their effect on the overall outage duration. If any of these projects requires the outage to be extended beyond its standard length, the project scope is reviewed in order to eliminate or minimise the necessary outage extension. Another factor determining the outage scope is the available budget.
After the overall outage schedule is prepared and approved, the parallel schedules of work on primary circuit, secondary circuit, electrical systems and I&C equipment need to be developed.
For each planned outage activity, a work order is issued within the outage preparation. The work orders are the basic tool of outage work control. They contain all necesasary information regarding the kind of task, type and location of equipment to be worked on, term of completion, expected number of working hours, responsible system engineer and the contractor performing the task. The number of work orders per outage at the Dukovany plant is usually about 10 000. If required by the task, concurrent work orders are issued besides the main one (e.g. for scaffolding installation, insulation removal, motor disconnection or de-mounting). The work orders related to the same plant system are grouped into a work package. There are about 250 to 300 work packages per outage.
During the outage preparation, the closest attention is always paid to the activities being carried out at the plant for the first time, as the lack of experience with them could affect the actual course of activities, which might lead to unplanned outage extension.
The performance indicators monitoring this outage stage are focused on the scope of outage work and on meeting the deadline for preparation of outage work packages.
20

Monitored performance indicators:
• Number of work orders
Definition: The total number of work orders issued for a particular refuelling outage.
The number of work orders reflects the scope of the prospective outage. The absolute values of this indicator depend on the work order system. It is therefore questionable to use this indicator for benchmarking (comparison between plants), because different plants may use different work order systems. It is also difficult to determine acceptability limits for this indicator. Thus the indicator is mostly used for identifying trends.
• Work order preparedness
.
A ratio of the number of work orders being prepared on time (2 months in advance of the outage) to the total number of outage work orders expressed in percentage.
This indicator is very important with respect to the outage preparation. Timely prepared work orders can be optimally included into the outage schedule, which contributes to a smooth implementation of the outage. The objective is to maximize this percentage. Currently, the indicator acceptability limit is 75%. Indicator data are obtained from the Passport maintenance management system
Work order preparedness
0%
20%
40%
60%
80%
100%
U1 U2 U3* U4 2001 U1 U2 U3 U4* 2002 U1* U2 U3 U4 2003
2 months in advance During 2 last months During an outage
Number of work orders
0 2000 4000 6000 8000
10000 12000 14000
U1 U2 U3* U4 U1 U2 U3 U4* U1* U2 U3 U42001 2002 2003
21

• Number of design modifications
Number of additional tasks related to design modifications and investment projects to be implemented during the outage.
These additional tasks make each outage unique and the outage preparation and management rather difficult. In addition, the design modifications affecting nuclear safety have to be approved by the nuclear regulator. Higher indicator values mean a more complicated and challenging outage. Acceptability limit of this indicator is not easy to determine, because the indicator value depends on many conflicting factors. The percentage of the design modification from all the outage tasks is usually about 20%.
2.2. Outage implementation
The outage is managed by the plant Coordination Department. To resolve issues occurring during the outage preparation and implementation, an Outage Managing Group (OMG) is established about 2 months ahead of the outage. The OMG is called and lead by the Outage Manager. The OMG implements decisions of monthly Coordination Meetings called by the Head of Coordination Department about 6 months in advance of the outage.
The Coordination Department observes task completion terms and availability of human and material resources to perform tasks. If an unplanned repair becomes necessary, it updates the outage schedule.
In this stage of the outage, performance indicators are used to monitor adherence to the outage schedule, especially for activities on the critical path.
Design modifications per outage
0
20
40
60
80
2001 2002 2003
Planned Unplanned
22

Monitored performance indicators:
• Work orders completed on time
This indicator provides daily information about the number of work orders commenced (opened) and completed (closed) on time.
Timelines of work order completion is especially important to meeting the outage schedule. The indicator evaluates also the entire outage. A work supervisor enters information regarding starting and finishing work according to the Work Order into the computer-based Passport system. The data are evaluated by the plant Outage Coordination Division. The acceptability limit is 90%, the target value is 95%.
• Attainment of outage milestones
Each outage is divided into stages by several milestones — usually important nodal points on the critical path (such as transfer of shutdown cooling, end of refuelling, pressure tests etc.).
Work Order Completion (GO 3/02)
0
50
100
150
200
250
300
350
400
450
500
13.4.
15.4.
17.4.
19.4.
21.4.
23.4.
25.4.
27.4.
29.4. 1.5
.3.5
.5.5
.7.5
.9.5
.11
.5.13
.5.15
.5.17
.5.19
.5.
date
num
ber o
f tas
ks
0%
10%
20%
30%
40%
50%
60%
70%
80%
90%
100%
DelayedOn timePercentage of 'In time'
Outage management effectiveness(percentage of work order on-time termination)
0102030405060708090
100
1997 1998 1999 2000 2001 2002 2003
%
Unit 1
Unit 2
Unit 3
Unit 4
23

Attainment of these milestones is closely monitored (with accuracy in hours). Any deviation from the milestone schedule can adversely affect the associated tasks challenging the overall outage schedule. The Outage Manager daily checks attainability of the next milestone on schedule (according to the actual work status). Any possible delay is immediately addressed.
• Deviation from the outage schedule
The outage manager daily evaluates the difference between the outage schedule and the actual status of outage work. The difference is evaluated for critical path activities, for work on the reactor, steam generators, turbine-generators and electrical equipment as well as for start-up activities.
The plant management receives daily information of hourly deviations from the outage schedule (advance, delay). In case of a delay, meetings are called to identify the cause and take corrective measures.
• Number of uncompleted tasks from the Operations Daily Plan
During the outage, The Operations Daily Plan includes requirements for participation of operations personnel in outage tasks (equipment operations). These requirements follow from the outage work orders. The indicator monitors whether these requirements are met on time and in the required scope.
The requirements are included in the Operations Daily Plan by Operations and Coordination Departments. The operations personnel sign off completed actions. The system provides a possibility to continuously monitor the actual status of those tasks that substantially affect the outage progress. The Outage Manager and management daily review this information. Each significant delay in completing the planned tasks is immediately investigated and corrective measures are taken.
Schedu le De v ia tions
-3
-2 ,5
-2
-1 ,5
-1
-0 ,5
0
0 ,5
11 3 5 7 9 11 13 15 17 19 21 23 25 27 29 31 33 35
[day]
Crit ical P ath Reac tor
24

• Unsatisfied equipment securing and restoring requirements
This is a special case of the above indicator, as the requirements for equipment securing and restoring are also included in the Operations Daily Plan. Because of the importance of this activity, however, it is monitored separately.
The data are collected according the same rules as above and each delay is investigated individually.
• Radiation exposure of workers
During the outage, workers entering the controlled area are provided with electronic dosimeters that allow daily monitoring of their radiation exposure. The investigation threshold for an individual or for one radiation work permit is 1 mSv.
2.3. Outage evaluation
Upon outage completion, an Outage Evaluation Report is prepared. In the report, the following outage aspects are evaluated:
• Actual work scope, including the unplanned tasks • Accordance of the actual unit shutdown and start-up with the outage schedule • Completion of major work controls and tests • Work performed/managed by individual plant departments • Nuclear safety — safety-related tasks, entering/violation of Limiting Conditions of
Operation, safety-significant events, scope of regulatory inspections • Radiological inspections — radiation doses received by workers, plant radiation
monitoring before, during and after the outage, effect of outage on radioactivity releases, consumption of personal protective equipment
• Refuelling • Reactor start-up and power ascension tests • Implemented design modifications and investment projects — in comparison with the
planned ones, including reasons for deviations • Work quality and efficiency — measured, among others, by the number of equipment
failures within two weeks immediately after the outage.
In its final chapter, the Outage Evaluation Report identifies problems and proposes corrective measures that should be taken either at the particular unit or at the whole plant.
The Outage Evaluation Report provides a complete overview of the actual scope and course of the outage. However the performance indicators following from this report cannot influence the outage progress and management, the gained experience is used for scheduling and implementation of next outages. Information from the report helps identify schedule margins and weaknesses in resources management, industrial safety and radiological protection. Based on the evaluation, the outage schedule can be further optimized and the safety risk, radiation doses and radioactive waste can be minimised.
25

The Outage Evaluation Report provides mainly qualitative evaluation. The quantitative indicators include the following:
• Accordance with the unit startup schedule
The unit start-up is an important part of each outage (it takes about 10 days). This indicator monitors hourly deviations of the individual start-up steps from the original schedule.
It serves for optimization of the start-up schedule. Control room personnel provide indicator data.
• Shutdown time
The indicator is defined as the time, expressed in hours, from power reduction start to reactor opening in the cold shutdown mode.
Unit shutdown is performed according to a general procedure independent of the type or scope of the outage. Acceptability limit for this indicator is 2 days.
• Refuelling time
The indicator is defined as the time, expressed in hours, needed to refuel the reactor.
For this indicator, the type of outage must be considered. During the extended outage (marked by * in the Figure), which is performed once in 4 years, the refuelling is divided in two parts : (1) a complete de-fuelling (removal of all the fuel assemblies from the reactor); and (2) fuelling (loading of all fuel assemblies back to the rector). The fuel loading is performed only after all inspections of reactor internals are completed. The indicator acceptability limits are 4.5 days for the standard outage, and 9 days for the extended outage.
Duration of shutdown, refuelling and start-up
0
2
4
6
8
10
12
14
U1 U2 U3* U4 U1 U2 U3 U4* U1* U2 U3 U4
[day]
Shutdown
Refuelling
Startup
2001 2002 2003
26

• Startup time
The indicator is defined as the time, expressed in hours, from beginning of Engineered Safety Feature test to connecting the second turbine-generator to the grid.
The start-up procedure includes many tests, the scope of which depends on the outage type. Depending on the design modifications implemented during the outage, the scope of the tests may vary from outage to outage. It is therefore rather difficult to establish a single acceptability limit for this indicator. For the standard outages, the start-up time is about 10 days, while in the extended outages, the start-up may take up to 13 days.
• Number of unplanned design modifications
The indicator is defined as the number of unplanned design modifications required by the actual equipment condition revealed during the outage.
The unplanned design modifications significantly complicate outage management and may adversely affect the outage progress. The objective is to minimize the value of this indicator
• Number of safety related events
The indicator is defined as the number of events rated INES ≥ 0 that occurred during the outage.
Number of unplanned design modifications
0 5
10 15 20 25
U1 U2 U3* U4 U1 U2 U3 U4* U1* U2 U3 U4 2001 2002 2003
Number of outage events
0
5
10
15
20
25
U1 U2 U3* U4 U1 U2 U3 U4* U1* U2 U3 U4
INES = 0
Below INES scale
2001 2002 2003
27

The indicator purpose is to monitor the frequency of INES-rated events. Practically, these events occur very rarely, therefore minor events (below INES scale) are monitored in addition to this indicator.
The target indicator value for the safety related events (INES ≥ 0) is 0.
• Collective Radiation Exposure
The indicator is defined as the sum of all individual radiation exposures (effective doses in milli-Sieverts) that all workers received during the outage.
The indicator value is calculated separately for the plant employees and for the contractor workers. It generally expresses the plant radiation conditions, scope of jobs in the controlled area, adherence to radiation protection rules and safety culture. The indicator acceptability limit is established separately for each outage, considering scope and kind of the outage work as well as the actual radiation situation at the plant. The indicator data are obtained from the personal dosimeters: film badges, TLD dosimeters and electronic dosimeters.
• Maximum Individual Radiation exposure
The indicator is defined as the maximum individual radiation exposure (effective dose) that an individual received during the outage.
The indicator monitors conformance of the individual radiation exposure with the regulatory limits and determines the range of the individual radiation exposure.
• Distribution of the Collective Radiation Exposure (CRE)
The indicator monitors distribution of radiation exposure among selected equipment and activities.
The indicator objective is to identify critical components and activities that cause the highest radiation exposures while working on them. For the indicator purposes, 8 components and 8
Collective Radiation Exposure
0
100
200
300
400
500
600
U1 U2 U3* U4 U1 U2 U3 U4* U1* U2 U3 U4
mSv
CRE - contractors mSv
CRE - plant staff mSv
2001 2002 2003
28

activities are selected. In addition to the collective radiation exposure, the maximum individual radiation exposure (IRE) is evaluated for each component and activity.
Table 1: Distribution of the Collective Radiation Exposure in 2002
Equipment CRE % max IRE
Activity CRE % max IRE
Steam Generator 238,9 34,2 0,92 Equipment Removals & Installations
297,0 42,3 0,92
Reactor 160,6 23,0 0,98 Testing & Inspections 157,3 22,4 0,80
Reactor Coolant System 94,3 13,5 0,73 Grinding, Cutting, Welding 83,5 11,9 0,63
I&C 72,7 10,4 0,53 I&C Activities 52,0 7,4 0,45
Reactor Coolant Pump 39,2 5,6 0,55 Electrical Activities 36,3 5,2 0,60
Electrical Equipment 34,8 5,0 0,60 Insulation Removals & Installations 35,5 5,1 0,31
Buildings, Floors 32,7 4,7 0,28 Scaffolding 24,3 3,5 0,24
Reactor Coolant System Piping
26,1 3,7 0,63 Decontamination 16,6 2,4 0,55
3. USE OF PERFORMANCE INDICATORS FOR MILESTONE MONITORING
During the outage, the outage manager has to keep close eye on the work progress and has to promptly respond to any change in the actual time schedule or work scope due to unexpected conditions.
The main nodes on the critical path of outage network chart represent the outage milestones. They are paid special attention, because most of the subsequent work depends on timely attainment of these milestones. The outage manager daily checks the milestone attainability on time. The milestone attainability is also checked after each schedule deviation.
From the quantitative performance indicators, the Number of Uncompleted Tasks from the Operations Daily Plan, Deviation from the Outage Schedule and Work Orders Completed on Time are used for the milestone checking.
4. EXPERIENCES WITH THE INDICATOR USE
The outage represents extensive and multi-professional teamwork including a high volume of non-standard activities and conditions. In spite of considerable effort to standardize the outage work, each outage is more or less specific. Mutual comparison of outages and evaluation of trends based merely on the quantitative indicators are therefore difficult and the indicators must be complemented by qualitative information.
29

The quantitative indicators provide an effective tool for outage management and evaluation. For the outage planning, however, there are only limited possibilities for their use. The performance indicators have the following advantages:
• They provide quick, clear and synoptic information
• They facilitate communication
• They can be displayed in charts and trends identified
• They allow mutual comparison of outages
• They facilitate objective evaluation.
Some of the quantitative indicators are used only momentarily. They are evaluated, but they are not stored (recorded), so trends cannot be identified. They are used only for information by actual decision-making in the outage management process.
30

Annex II
OLKILUOTO NPP, FINLAND OUTAGE INDICATORS
1. INTRODUCTION
Teollisuuden Voima Oy (TVO) operates two identical 840 MWe BWR units, Olkiluoto 1 (OL1) and Olkiluoto 2 (OL2), on the southwest coast of Finland. OL1 was commissioned in 1978 and OL2 two years later. Production results have been very satisfactory. Capacity factors have been over 93 percent for well over 10 years, and after the power up rating annual production has been around 14 TWh. The plant design is maintenance-friendly and has many features helpful in carrying out short outages.
The plant site also includes an interim storage for spent fuel and reactor waste, a final repository for operating waste and training centre featuring a full-scope simulator. The final disposal of all spent nuclear fuel from Finnish nuclear facilities will also be carried out in the Olkiluoto bedrock.
Annual outages are the largest production loss, about 5% of total production. Therefore, efficient outages are a key factor in our performance, and our aim is to continuously improve and update our outage policy. At present, a system of consecutive refuelling and service outages has been adopted.
19
1413
14
22
1311
10
2018
15
8
14
8
13
10
14
7
16 16
1917
1416
24
1311
1819
10
1315
7
14
7
25
31
27
32
21
36
3130
34
20
23 24
18
36
23
2932
35 35
0
5
10
15
20
25
30
35
40
1988 1989 1990 1991 1992 1993 1994 1995 1996 1997 1998 1999 2000 2001 2002 2003 2004 2005
OL1OL2TotalDays
Fig. 1. Olkiluoto NPP, lengths of annual outages.
2. OUTAGE INDICATORS
The purpose of outage indicators is to monitor progress during outage planning and execution and evaluate outage performance to identify areas for improvements. Outage indicators used in Olkiluoto NPP indicates not only the general progress and performance but also that for individual groups and persons. The purpose is to connect indicators clearly to specified milestones. Separate indicators are used for the pre-outage period, during outage and after outage to evaluate outage performance. Some of indicators used in Olkiluoto NPP are presented in this document.
31

Fig. 2. Outage scope evaluation based on previous outages.
2.1. Pre-outage indicators
Pre-outage indicators are connected to pre-outage milestones specified in the outage planning time schedule. Milestones include following items:
• Critical path scheduled • Outage work scope frozen (maintenance and modifications) • Outage resources specified, ordered • Spare parts and materials ordered, on the site • Work orders (packages) planned and scheduled • Work permits planned • Outage budget done, reviewed • Outage safety review completed.
Planning of Annual Outages 2004
Olkiluoto 1 Olkiluoto 2Number of works 972 438Number of work orders 2053 725Manhours, total 59682 23052
Planned, total (%) 84,7 93,5
Planning of safety measures (work permits)
I&C isolations
Electrical isolation
Process isolations
Safety review
OL1 Not needed 548 592 181 794Not planned 154 266 348 68Planned (ready) 6 4 333 0
OL2 Not needed 291 284 116 346Not planned 59 69 29 9Planned (ready) 6 3 211 1
OL1 Planned (%) 78,2 69,1 59,6 92,1OL2 Planned (%) 83,4 80,6 91,9 97,5
Planning of work orders (maintenance/modification work packages)
Resource planning
Rad.prot. instructions
Rad.prot. permit
Fire prot. instructions
Material requisitions
Work instructions
OL1 New (not handled) 0 39 37 60 43 62Not needed 0 1894 1665 2094 1884 655Not planned 214 54 128 60 6 37Planned (ready) 2053 275 437 53 328 1513
OL2 New (not handled) 0 0 0 10 7 7Not needed 0 604 574 720 681 204Not planned 18 1 4 9 5 3Planned (ready) 725 138 165 4 50 529
OL1 Planned (%) 90,6 95,9 92,7 94,7 97,8 95,6OL2 Planned (%) 97,6 99,9 99,5 97,4 98,4 89,7
Reporting week: 48/2003.OL1: Service OutageOL2: Refuelling (Only) Outage
Fig. 3. Planning status report can be divided also to group/individual level.
07/2003 08/2003 09/2003 10/2003 11/2003 12/2003 01/2004 02/2004 03/2004 04/2004 05/2004 06/20040
10000
20000
30000
40000
50000
60000
70000
80000
90000
R205 HS
R105 PVS
R104 HS
R204 PVS
R103 PVS
R203 HS
Outages 2004
Outage ManhoursR103/R104/R105 = Olkiluoto 1 Outage 2003/2004/2005R20 3/R204/R205 = Olkiluoto 2 Outage 2003/2004/2005HS = Service OutagePVS = Refuelling (only) Outage
32

2.2. During outage
During outage adherence to planned time schedule, costs, outage plans etc. is followed up as much as possible in real time using proper indicators and real time reporting.
Annual Outages 2003 (R103 = Olkiluoto 1, R203 = Olkiluoto 2)
117
188 215
302
0
50
100
150
200
250
300
350
1 2 3 4 5 6 7 8 9 10 11 12 13 14 15 16
Outage Days
Am
ount
R103R203
New failure notificationsduring outage
Failures reportedduring outage (all works)
Failure notifications and reports
1270
3109
0
500
1000
1500
2000
2500
3000
3500
1 2 3 4 5 6 7 8 9 10 11 12 13 14 15
Outage days
Am
ount
R103
R203
Total
Ready / reported
Ready / reported
Total
Work orders (maintenance/work packages)1083
529
0
200
400
600
800
1000
1200
1 2 3 4 5 6 7 8 9 10 11 12 13 14 15
Outage days
Am
ount
R203R103
Total
Returned and reported
Permits released out/not returned
Total
Returned and reported
Permits released out/not returned
Work permits
Dose budget
Olkiluoto 2 – Collective doses
Realized
1 2 3 54 6 7 8 9 11 12 13 14 15 16
Outage days
Fig. 4. Real time reporting helps to follow up the status of outage works, to react at time to deviations and to evaluate readiness to start up the plant unit after the outage.
Outage Week 20/2003 21/2003Outage day (d) -1 1 2 3 4 5 6 7 8 9 10 11 12 13 14 15Weekday Sun Mon Tue Wed Thu Fri Sat Sun Mon Tue Wed Thu Fri Sat Sun MonDate 11.05 12.05 13.05 14.05 15.05 16.05 17.05 18.05 19.05 20.05 21.05 22.05 23.05 24.05 25.05 26.05
1. Removal of tool from moderator lid 4. Test installation of feedwater distributors2. Apusillan viat höyrynkuivaimen mittauksissa 5. Installation of plugs in control rods L40 and S653. Installation of plugs in recirculation system 6. Reactor protection system tests
-18 h
-12 h
-6 h-4 h
-21,5 h
-24
-12
0
12
1 2
AHEAD / h
BEHIND / h
3 4 65
Fig. 5. Olkiluoto 2 outage in 2003: realization of the critical path activities.
Outage events (outage and occupational safety, near misses, functional deviations etc.) are followed up and evaluated separately during outages.
33

2.3. Post-outage
Post outage indicators are used to find areas where improvements should be needed in coming outages: safety and quality, management, performance and economy.
0
1 0 0
2 0 0
3 0 0
4 0 0
5 0 0
6 0 0
7 0 0
8 0 0
9 0 09.
5.
10.5
.
11.5
.
12.5
.
13.5
.
14.5
.
15.5
.
16.5
.
17.5
.
18.5
.
19.5
.
20.5
.
21.5
.
22.5
.
23.5
.
24.5
.
25.5
.
26.5
.
27.5
.
28.5
.
29.5
.
30.5
.
31.5
.
1.6.
2.6.
3.6.
4.6.
5.6.
6.6.
Olkiluoto 2 outage (R203)11.5.-26.5.2003
Olkiluoto 1 outage (R103)27.5.-6.6.2003
Fixed priceHour-based
Planned
Fig. 6. Number of contractor personnel divided to fixed price contracts and
hour-based contracts.
2 0 2
7 1 1
0
5 0 0
1 0 0 0
1 5 0 0
2 0 0 0
1 9 9 2 1 9 9 3 1 9 9 4 1 9 9 5 1 9 9 6 1 9 9 7 1 9 9 8 1 9 9 9 2 0 0 0 2 0 0 1 2 0 0 2 2 0 0 3
O L 1
O L 2
mmanSv
Fig. 7. Collective doses of annual outages.
1996 1997 1998 1999 2000 2001 2002 2003 2004 B
OL1OL2Yhteensä
M€
5
10
15
20
25
30
OL1+OL2
Fig. 8. Activity based costing (ABC) is used to follow up outage costs.
34

13,0
17,3
9,1
26,6
14,015,315,4
12,710,8
9,0
14,314,9
10,1
19,5
22,2
14,4
0
5
10
15
20
25
30
1987 1989 1991 1993 1995 1997 1999 2001
211208
254
147
423
388
330
181
307
248
311
283262
275
303
259
0
50
100
150
200
250
300
350
400
450
1987 1989 1991 1993 1995 1997 1999 2001
1000
h
211208
254
147
423
388
330
181
307
248
311
283262
275
303
259
0
50
100
150
200
250
300
350
400
450
1987 1989 1991 1993 1995 1997 1999 2001
1000
h
Outage Costs Outage Manhours
M€
Contractor personnel Spare parts and materialsOwn personnel
Fig. 9. Outage costs and manhours (Olkiluoto 1+2).
0
10
20
30
40
50
60
70
1989 1990 1991 1992 1993 1994 1995 1996 1997 1998 1999 2000 2001 2002 20030
10
20
30
40
50
60
70
Modifications / Improvements
Olkiluoto 1+2
%%
Corrective Maintenance
Preventive Maintenance
Fig. 10. Distribution of outage man-hours: corrective maintenance ca 10%, preventive maintenance and inspections ca 60% and modifications/improvements ca 30% (1996–1998 modernization project).
3. DEVELOPMENT OF INDICATORS
The following could be considered in further development of outage indicators:
• Indicators should not be “only nice pictures and curves” • Indicators should be clearly connected to milestones • Indicator should be adhered clearly to responsible organization groups and/or individual
persons • Data collection should be fully automatic (in real time) and well defined • Management level reporting should be developed • Indicators should be “early warning type” to find real problems and “bottlenecks” at
time • Better human performance indicators should be developed.
35


Annex III
ASCO NPP, SPAIN DOSE INDEX
1. INTRODUCTION
Ascó Nuclear Power Plant is a two-unit PWR station with a total capacity of 2060 MW. Unit 1 began commercial operation in December 1984 and Unit 2 in March 1986. The Unit Capability Factor at Ascó averaged 93.3% between 1998 and 2002. It is known that 90% of the collective dose at a LWR NPP is received during the outage period. The Ascó NPP Radiation Protection Service has established a simple parameter that makes it possible to accurately know the source term during an NPP outage. This index is obtained by dividing the collective dose (man-μSv) by the workload (man-hours); both are obtained from the operational dosimeter control system. This factor, in μSv/hour, represents the average dose rate received by personnel performing tasks in the controlled area.
This annex shows a presentation methodology of the different parameters; all of them related to the dose index in order to make outer evaluations and conclusions on the global or specific radiation source term of each activity or task during the outage period, in addition to the work load associated and, therefore, the collective dose reached. All of this allows us to have a broader scope of information to assess the results from an ALARA point of view.
2. DEVELOPMENT
The proposal for different forms of presentation in relation with dose index parameters is:
• Global evolution of the daily and accumulated work loads throughout every outage day • Global evolution of the accumulated dose index throughout the outage • Same nuclear power plant inter-comparison of the different work loads and dose index
reached at the end of their respective outages • Daily workloads and accumulated dose index evolution throughout outage days when
referring to outstanding outage activities • Work loads and dose index inter-comparison of the different outages for the same facility.
The daily workload during outage 13 of Ascó I and during outage 12 of Ascó II NPP is shown in Figure 1. The periodic diminutions in the daily workloads take place on Sundays.
37

DAILY WORK LOAD
0
500
1000
1500
2000
2500
3000
3500
1 2 3 4 5 6 7 8 9 10 11 12 13 14 15 16 17 18 19 20 21 22 23 24 25 26 27 28 29 30 31 32 33
OUTAGE DAYS
MA
N .
HO
UR
S
13-ASCÓ 1 12-ASCÓ 2
Fig. 1. Workload during outage 13 of Ascó I and during outage 12 of Ascó II.
Accumulated workload for the indicated outages is shown in Figure 2.
Fig. 2. Accumulated work loads.
An interesting representation is collected in Figure 3: the daily work load in man hours and the accumulated dose index for three outages at Ascó; the 11th and 12th outages of Unit II and the 13th outage of Unit I.
The coincidence of accumulated dose indexes for a similar workload during the 11th and the 12th outages of Ascó II induced an idea that this parameter for the same scope and load work has a practically constant characteristic. This characteristic is used for outage collective dose forecasting, and at the same time during the first outage days as an indicator of the radiation source term in NPP outages.
For instance, in the graph of the 13th Ascó I outage, it is observed that this outage was subjected to a radiation source term 20% lower than the last Ascó II outages. This fact is already noticed very early at the beginning of the outage. This is not always obvious through
ACCUMULATED WORK LOAD
0
10000
20000
30000
40000
50000
60000
70000
1 2 3 4 5 6 7 8 9 10 11 12 13 14 15 16 17 18 19 20 21 22 23 24 25 26 27 28 29 30 31 32 33
OUTAGE DAYS
MA
N .
HO
UR
S
13-ASCÓ 1 12-ASCÓ 2 11-ASCÓ 2
38

direct measurement by the portable gamma survey meter due to the heterogeneous nature of the radiation field in the Controlled Area (basically in the Containment Building).
DAILY W O RK LO AD AND ACCUM ULATED DO SE INDEX OUTAG ES ASCÓ
0
500
1000
1500
2000
2500
3000
3500
1 3 5 7 9 11 13 15 17 19 21 23 25 27 29 31 33
OUTAGE DAYS
MA
N ·
HO
UR
S
0,00
5,00
10,00
15,00
20,00
25,00
30,00
35,00
40,00
DO
SE IN
DEX
(u
Sv/h
)
13-ASCÓ 1 11-ASCÓ 2 12-ASCÓ 2
DOSE INDEX 13-A1 DOSE INDEX 11-A2 DOSE INDEX 12-A2
Fig. 3. Daily work load in man hours and the accumulated dose index.
The final collective dose index in the last outages of Ascó I and Ascó II is presented in Figure 4. The decrease of the dose index from the Steam Generator replacement is observed. These replacements were performed during the 11th Ascó I outage and the 10th Ascó II outage, respectively.
Fig. 4. Collective dose index in the last outages of Ascó I and Ascó II.
ACCUMULATED DOSE INDEX OUTAGES ASCÓ N.P.P.
20,15 20,53
15,88
9,0910,54
12,41
8,4
25,76
18,77
22,27
16,17
12,14 11,8510,83
9,58
28,55
12,3713,73
0
5
10
15
20
25
30
8ª 9ª 10ª 11ª 12ª 13ª 14ª 15ª 16ª 6ª 7ª 8ª 9ª 10ª 11ª 12ª 13ª 14ª
ASCO I OUTAGES ASCO II
(S.G.R.= Steam Generator Replacement)
DO
SE IN
DEX
(µSv
/h)
(S.G.R.)(S.G.R.)
39

ACCUMULATED WORK LOAD OUTAGES ASCÓ N.P.P.
87481 88182 89694
65475 6738955383
64668 6584575031 72263
100239
62808 6085151218 48380
73567
307619
396069
0
50000
100000
150000
200000
250000
300000
350000
400000
450000
8ª 9ª 10ª 11ª 12ª 13ª 14ª 15ª 16ª 6ª 7ª 8ª 9ª 10ª 11ª 12ª 13ª 14ª
ASCO I OUTAGE ASCO II(S.G.R.= Steam Generator Replacement)
MA
N H
OU
RS
(S.G.R.)
(S.G.R.)
Subsequently, after these Ascó outages a new plan was drawn up for the outage duration and the scope on maintenance work.
Fig. 5. Workload in the last outages of Ascó I and Ascó I.
The daily workloads and accumulated dose index, through their appropriate representation, allow us to make specific valuations of the radiological performance, radiation source term and ALARA of different activities during the outage period. These valuations are more obvious if we compare different outages at the same plant.
The tasks carried out for this follow-up are basically developed through all the outage days. These tasks will be more reliable if they last longer and if the daily work load is more similar. The plant tasks related to cleaning and decontamination are a good example.
0
5
10
15
20
25
30
35
40
1 2 3 4 5 6 7 8 9 10 11 12 13 14 15 16 17 18 19 20 21 22 23 24 25 26 27 28 29 30
Outage Days
Acc
umul
ated
Dos
e In
dex
( μSv
/h)
0
100
200
300
400
500
600
700
800
Wor
k Lo
ad (m
an x
h)
DAILY W ORK LOAD 12-II (man x h) DAILY W ORK LOAD 11-II (man x h)ACCUMULATED DOSE INDEX 12-II (uSv/h) ACCUMULATED DOSE INDEX 11-II (uSv/h)
Fig. 6. Ascó II outages — cleaning and decontamination.
40

In the indicated Ascó outages this activity has resulted in an average of 27.8% of the total workload and 8.9% of the total collective dose, with few discrepancies between them.
The accumulated dose index of the 11th and 12th Ascó II outages is compared in Figure 6. The coincidence can be observed, since these outages had a more global radiation source term similarity.
In the same way, the radiation monitoring tasks in the Ascó outages have supposed an average of 7.2% of the total workload and 4.3% of the total collective dose. The coincidence in the evolution of this index is recognized in Figure 7, as well as the similar value obtained in the two indicated Ascó II outages.
Fig. 7. Ascó II outages — radiation monitoring
The same graph as for operation tasks (see Figure 8) could be drawn for other activities such as valve repair, insulation work, etc.
0
5
10
15
20
25
30
35
40
1 2 3 4 5 6 7 8 9 10 11 12 13 14 15 16 17 18 19 20 21 22 23 24 25 26 27 28 29 30
Outage Days
Acc
umul
ated
Dos
e In
dex
( μSv
/h)
0
50
100
150
200
250
300
350
400
Wor
k Lo
ad (m
an x
h)
DAILY W ORK LOAD 12-II (man x h) DAILY W ORK LOAD 11-II (m an x h)ACCUMULATED DOSE INDEX 12-II (uSv/h) ACCUMULATED DOSE INDEX 11-II (uSv/h)
Fig. 8. Ascó II outages — operation tasks.
0
5
10
15
20
25
30
35
40
1 2 3 4 5 6 7 8 9 10 11 12 13 14 15 16 17 18 19 20 21 22 23 24 25 26 27 28 29 30
Outage Days
Acc
umul
ated
Dos
e In
dex
(Sv
/h)
0
50
100
150
200
250
Wor
k Lo
ad (m
an x
h)
DAILY WORK LOAD 12-II (man x h) ACCUMULATED DOSE INDEX 11-II (man x h)ACCUMULATED DOSE INDEX 12-II (uSv/h) ACCUMULATED DOSE INDEX 11-II (uSv/h)
41

3. CONCLUSIONS
It has been observed that throughout a normal outage, there are few fluctuations of this Dose Index factor calculated on a daily basis. Because of this, it is possible to know, a few days after initiating the outage, if the source term is higher or lower than in other outages.
A precise estimation of the total dose for the whole outage can be made if no additional source term reduction measures are taken. The application of this factor for specific tasks (decontamination, valve work, health physics, operation, insulation, etc.) also allows their contribution to the global outage dose to be evaluated.
From the final workload and dose index data related to each outage activity, collective doses for the next outage can be estimated, keeping in mind the specific work scope.
In case of deviations from estimated values, the dose index allows us to know if it has been caused by radiation source terms different to those expected (it is not obvious through a direct measurement by the portable gamma survey meter due to the heterogeneous nature of the radiation field) or by an incorrect forecast of the workload.
Finally, the Dose Index can be also used for a comparison of effective source terms of different NPPs. The total result obtained (collective dose) can be separated as a product of two factors: the radiation source term (dose index) and the workload in the Controlled Area (man-hours of operational dosimeters). This approach allows the ALARA effort of the plant to be considered.
42

Annex IV
CERNAVODA NPP, ROMANIA OUTAGE INDICATORS
1. INTRODUCTION
Cernavoda Unit 1 NPP is a single unit 700 MWe PHW CANDU reactor located on the Danube River at Cernavoda Romania. The plant was commissioned between 1994 and 1996 and was placed in service in December 1996. The unit has at power fuelling capability. Capacity factor since in service is 86.44%.
To date the interval between planned outages is established by the Mandatory Testing programme. The critical path is determined by the requirements for Turbine Generator inspections. Other major activities include an In Service Inspection Programme, preventative and corrective maintenance in non-accessible areas.
Another significant aspect of planned outages is the implementation of design changes. Between first outage in 1997 to date there have been installed 317 modifications aimed at improving stations operation.
Performance indicators provide the information necessary for the station to assess readiness for the outage and the effectiveness of its implementation.
2. INDICATOR OVERVIEW
2.1. Outage preparation
The planned outage preparation consists of the following major steps:
• identifying outage milestones and performance indicators • identifying members of the outage preparation and implementation team • identifying outage work • freezing the scope of outage work • building the outage schedule.
0
10
20
30
40
50
60(days)
1997 1998 1999 2000 2001 2002 2003
Outage duration
PlannedActual
43

Outage work consists of:
• standard activities that occur every outage • outage preventative maintenance call-ups • design changes • Work Requests identifying defective equipment that require a station outage to repair.
The Work Request is the tool in place at Cernavoda to identify work. For each Work Request a work package is prepared by maintenance that lists the activities, duration and number of people required to complete the work. For more complex jobs a Work Plan is prepared by Engineering. This Work Plan is prepared to coordinate the activities for several Work Groups. The output from the work packages and Work Plans are input to a Project Schedule to determine the outage critical path and resource levels for all station Work Groups. When all jobs are entered into the Project Scheduler, the resulting schedule is reviewed for compliance with Nuclear Safety rules and the ability to complete the work as scheduled.
Three major milestones are set for any outage:
• Work Requests identified 7 months prior to the outage start • Outage scope freeze 6 months prior to outage start • All design packages issued to maintenance 4 months prior to outage start.
The following pre-outage performance indicators are monitored during outage preparation:
• Effectiveness of the Outage Work Assessment Process
This is a presentation of the number of work requests to be assessed for the annual outage. The target to complete the assessment is two months prior to outage start. This is based on the fact that scope freeze occurs six months prior to the start of the outage.
Owner: Maintenance Superintendent
Formula: number of work requests remaining to be assessed for the annual outage compared to target.
This chart has to be updated weekly and presented at Outage Preparation Meeting by Assessment representative to the outage team.
Work Request Assessment - target vs actual
0
1000
2000
3000
4000
5000
E-8 E-7 E-6 E-5 E-4 E-3 E-2 E-1 E0
Months to Outage
# W
ork
Req
uest
s
TargetActual
44

• Effectiveness of the Outage Work Plan Preparation Process
This is a presentation of the number of Work Plans to be prepared for the annual outage. The target to complete the issue of all Work Plans is one month prior to outage start. This is based on the fact that scope freeze occurs six months prior to the start of the outage.
Owner: Technical Unit Superintendent
Formula: Number of Work Plans remaining to be issued for the annual outage compared to target.
This chart has to be updated weekly and presented at Outage Preparation Meeting by Technical unit.
• Effectiveness of the Outage Work Permit Process
This is a presentation of the number of work permits to be prepared and checked for the annual outage. The target to complete the preparation of all Work Permits is one month prior to outage start. This is based on the fact that scope freeze occurs six months prior to the start of the outage.
Work Permit Preparation - target vs actual
0500
10001500200025003000
E-8 E-7 E-6 E-5 E-4 E-3 E-2 E-1 E0
Months to Outage
# W
ork
Perm
its
TargetActual
Work Plan Preparation - target vs actual
020406080
100120
E-8 E-7 E-6 E-5 E-4 E-3 E-2 E-1 E0
Months to Outage
# W
ork
Plan
s
TargetActual
45

Owner: Operations Superintendent
Formula: number of Work Permits remaining to be prepared and checked for the annual outage compared to target.
This chart to be updated weekly and presented at Outage Preparation Meeting by Operations coordinator assigned to the outage team.
• Effectiveness of the Outage Design Package Preparation Process
Owner: Design Superintendent
Formula: number of Design Packages remaining to be prepared and issued for the annual outage compared to target.
This chart has to be updated weekly and presented at Outage Preparation Meeting by Design representative to the outage team.
• Effectiveness of the Outage Technical Modification Preparation Process
T Mod Preparation and issue Target vs actual
0
10
20
30
40
50
60
E-10 E-8 E-6 E-4 E-2 E0
Months to Outage
# T
Mod
Pac
kage
s
TargetActual
Design Package Preparation - target vs actual
05
101520253035
E-10 E-9 E-8 E-7 E-6 E-5 E-4 E-3 E-2
Months to Outage
# D
esig
n P
acka
ges
TargetActual
46

Outage Prerequisites - target vs actual
0
100
200
300
400
E-6 E-5 E-4 E-3 E-2 E-1 E0
# of
Wor
k R
eque
sts
TargetActual
Parts Availability for Planned Outage
01020304050607080
E-10 E-8 E-6 E-4 E-2 E0
Months to Outage
Out
stan
ding
PR
s
TargetActual
This is a presentation of the number of technical modification (T Mod) Packages to be prepared and issued for the annual outage. The target is to complete the preparation and issue T Mods Packages four months prior to outage start. This is based on the fact that scope freeze occurs six months prior to the start of the outage.
Owner: Design Superintendent
Formula: number of T Mods remaining to be prepared and issued for the annual outage compared to target.
This chart has to be updated weekly and presented at Outage Preparation Meeting by Design representative to the outage team.
• Effectiveness of the Procurement Process for outage
This is a presentation of the number of Purchase Requisitions required for the annual outage. The target is to complete the procurement of all spare parts prior to outage start.
Owner: Procurement Superintendent
Note: Some procurement activities may be held up in Procurement Engineering. In this case, a chart would be required for each group.
Formula: number of outstanding purchase requisitions required for the planned outage.
This chart has to be updated weekly and presented at Outage Preparation Meeting by Procurement representative to the outage team.
• Effectiveness of the Outage Prerequisites Completion Process
47

This is a presentation of the number of outage prerequisites to be completed for the annual outage. The target is to complete all these Work Requests prior to outage start.
Owner: Maintenance Superintendent
Formula: remaining number of pre-outage requests for the annual outage compared to target.
This chart has to be updated weekly and presented at Outage Preparation Meeting by Design representative to the outage team.
2.2. Outage implementation
An Outage Manager from the Operations Department manages the outage. Individuals assigned from the station departments support the Outage Manager.
A schedule is issued daily that identifies all work to be completed in the next 72 hours. The schedule is updated once each day and a new critical path is calculated. Outage duration and completion of work activities are also monitored daily.
Monitored Performance Indicators:
• Outage activities progress
This indicator provides daily information about the number of activities completed, remaining, deferred and % of work completed.
Monitoring of this indicator is important in order to provide an overview of the outage and manage the daily outage schedule. The work group coordinators, at the daily planning meetings, update the activities status (start/finish). The Planning Outage Supervisor inputs the data in computer-based Primavera system. All information is updated and evaluated by the Station Management in cooperation with the Outage Team, during the daily meetings.
The graph illustrates actual progress during the 2003 outage at Cernavoda.
The progress of the scheduled activities implementation
0800
160024003200400048005600640072008000
17-M
ai
19-M
ai
21-M
ai
23-M
ai
25-M
ai
27-M
ai
29-M
ai
01-Iu
n
03-Iu
n
05-Iu
n
07-Iu
n
09-Iu
n
11-Iu
n
13-Iu
n
15-Iu
n
17-Iu
n
19-Iu
n
21-Iu
n
23-Iu
n
25-Iu
n
27-Iu
n
29-Iu
n
01-Iu
l
0.0%10.0%20.0%30.0%40.0%50.0%60.0%70.0%80.0%90.0%100.0%
Remaining Activities Deffered Activities Completed Activities Percentage of 'In time"
48

• Resource loading/day (histogram)
Crew loading is monitored regularly during the outage to ensure there are adequate resources to complete the reviewing work.
• Attainment of outage milestones
Each outage includes several milestones generally based on completion of major work. These milestones are closely monitored, as any deviation will affect the next series of activities. The outage planner monitors these milestones and identifies delays to the outage manager.
2.3. Outage evaluation
Upon outage completion, an Outage Report is prepared. In the report, the following outage aspects are evaluated:
• Work scope, including emergent work • Time of the actual unit shutdown and start-up compared with the outage schedule • Major work and tests completed • Design modifications completed • Completion of pre-outage work • Problems identified and proposed actions • Problems identified with equipment
# Resources
49

• Nuclear Safety — safety related tasks, violation of Operating Policies and Principles, safety-significant events, scope of regulatory inspections
• Radiological inspections — radiation doses received by workers, plant radiation monitoring before, during and after the outage, consumption of personnel safety equipment
• Reactor start-up and run-up tests • Activities not performed and the reasons. In the Outage Report the problems identified are reviewed and corrective actions are proposed in order to be implemented during the next period, depending on the status of the plant. All these actions are part of the Lessons Learned Program.
The Outage Report provides an overview of the outage scope and its activities. Although the performance indicators cannot influence the outage progress, the information identifies actions to improve scheduling and implementation of the next outage.
Information contained in the report helps identify schedule issues and weakness in resources management, industrial safety and radiological protection. Based on the evaluation, the outage schedule can be further optimized and safety risk, radiation doses and radioactive waste can be minimized.
The Outage Report includes the following indicators:
• The unplanned heat sink reduction capability
This indicator provides the number of events when heat sink capability has been reduced during the planned outage.
The target value for this indicator is zero. The indicator is prepared by Safety & Licensing.
• Events reporting to Regulatory Authority
0
1
2
3
4
5
No
of e
vent
s
1998 1999 2000 2001 2002 2003
Events reporting to Regulatory Authority
0.0
0.2
0.4
0.6
0.8
1.0
No.
eve
nts
1997 1998 1999 2000 2001 2002 2003
The unplanned heat sink reduction capability
50

This indicator provides the number of events reporting to Regulatory Authority produced during the planned outage.
The target value is to be established. The indicator is prepared by Safety & Licensing.
• Human errors
This indicator provides the number of human errors that occurred during the planned outage. These events are reviewed and corrective actions are taken in order to reduce them as much as possible.
The target value for this indicator is to be established. The indicator is produced by Safety & Licensing.
• Events involving industrial safety and health physics
This indicator is defined as being a sum of events involving industrial safety and health physics such as: deficiencies related to individual safety equipment not being used, organizational safety deficiencies, deficiencies related to not following work procedures, Heavy Water leaks in R/B.
The target value for this indicator is to be established. The indicator is produced by Industrial Safety & Health Physics.
04080
120160200
1998 1999 2000 2001 2002 2003
Events involving industrial safety and health physics
0
5
10
15
20
25N
o of
hum
an
erro
rs
1998 1999 2000 2001 2002 2003
Human errors
51

• Collective / Maximum individual radiation exposure
The indicator “Collective radiation exposure” is defined as being a sum of total doses for the whole body (internal and external), doses collected by the workers during the entire outage period.
The indicator “Maximum Individual radiation exposure” is defined as being the biggest individual dose collected by one worker during the entire outage period.
The acceptable limits for “Collective radiation exposure” indicator are established separately for each outage, considering the outage scope and the activities categories to be executed.
The indicator “Maximum individual radiation exposure” is monitored so that the administrative radiation exposure will be under agreed limits.
The Dosimetry personnel produce the indicators based on: film badges, TLD dosimeters and electronic dosimeters.
• Zones, personnel contamination
The indicator “Zones, personnel contamination” provides the total number of zones/personnel that were contaminated during the entire outage period. Health Physics personnel produce the indicator.
0100200300400500600
man
-mSv
1998 1999 2000 2001 2002 2003
Collective radiation exposure
0
2
4
6
8
10
mSv
/per
son
1998 1999 2000 2001 2002 2003
Maximum Individual radiation exposure
52

• Emergent work % of original scope
The indicator provides the percentage of new emergent activities that were issued during the outage, against the number of the initial scheduled activities.
The indicator is produced by Planning Department.
3. USE OF MILESTONES TO MONITOR OUTAGE PERFORMANCE
During the outage, the Outage Manager monitors a number of milestones identified on the critical path. Any deviations are followed up immediately and a recovery plan is developed to get back on track. Emergent work can also affect the outage schedule and its impact is assessed based on the original milestones.
0
20
40
60
80
100
%
1998 1999 2000 2001 2002 2003
Emergent Work % of Original Scope
05
101520253035
No.
of z
ones
co
ntam
inat
ed1998 1999 2000 2001 2002 2003
Zones contamination
0
50
100
150
200
No.
of p
erso
nnel
co
ntam
inat
ed
1998 1999 2000 2001 2002 2003
Personnel contamination
53

4. EXPERIENCES WITH INDICATOR USE
Preparing and implementing an outage requires a significant level of effort and team work from all departments at the station. Indicators are the primary tool used by the Outage Manager to track progress of activities during all phases of the outage.
Successful implementation of any outage requires that all milestones and indicators are taken seriously. It is important that they are presented to the Management Team on a regular basis and for those that are not meeting target, a recovery plan is prepared and implemented.
54

CONTRIBUTORS TO DRAFTING AND REVIEW
Alejeva, L. JSC ITECHA, Lithuania
Arrevillaga Romero, F. Laguna Verde NPP, Mexico
Bucur, I. Nuclearelectrica, S.A., Romania
Carbonnier, D. Electricite de France, France
Chapman, C. Consultant, United Kingdom
Dias Cost, S. Eletronuclear, Brazil
Frtusova, S. Mochovce NPP, Slovakia
Grauf, E. Gemeinschaftskernkraftwerk Neckar GmbH, Germany
Hafner, A. Krsko Nuclear Power Plant, Slovenia
Hansson, B. International Atomic Energy Agency
Ibanez, M. UNESA, Spain
Kim, M.K. Korea Hydro & Nuclear Company, Republic of Korea
Krajnc, J. Krsko NPP, Slovenia
Ma, M. Qinshan Nuclear Power Plant, China
Mandula, J. International Atomic Energy Agency
Mazour, T. International Atomic Energy Agency
Specht, J. Framatome ANP, Germany
Spiegelberg-Planer, R. International Atomic Energy Agency
Unga, T. Toellisuuden Voima Oy, Finland
Vega, R. Laguna Verde NPP, Mexico
TECHNICAL MEETING
Vienna, Austria: 6–9 October 2003
CONSULTANTS MEETINGS
Vienna, Austria: 2–4 December 2002, 31 January–2 February 2005
55


In the following countries IAEA publications may be purchased from the sources listed below, or frommajor local booksellers. Payment may be made in local currency or with UNESCO coupons.
AustraliaDA Information Services, 648 Whitehorse Road, MITCHAM 3132Telephone: +61 3 9210 7777 • Fax: +61 3 9210 7788Email: [email protected] • Web site: http://www.dadirect.com.au
BelgiumJean de Lannoy, avenue du Roi 202, B-1190 BrusselsTelephone: +32 2 538 43 08 • Fax: +32 2 538 08 41Email: [email protected] • Web site: http://www.jean-de-lannoy.be
CanadaBernan Associates, 4611-F Assembly Drive, Lanham, MD 20706-4391, USATelephone: 1-800-865-3457 • Fax: 1-800-865-3450Email: [email protected] • Web site: http://www.bernan.com
Renouf Publishing Company Ltd., 1-5369 Canotek Rd., Ottawa, Ontario, K1J 9J3Telephone: +613 745 2665 • Fax: +613 745 7660Email: [email protected] • Web site: http://www.renoufbooks.com
ChinaIAEA Publications in Chinese: China Nuclear Energy Industry Corporation, Translation Section, P.O. Box 2103, Beijing
Czech RepublicSuweco CZ, S.R.O. Klecakova 347, 180 21 Praha 9Telephone: +420 26603 5364 • Fax: +420 28482 1646Email: [email protected] • Web site: http://www.suweco.cz
FinlandAkateeminen Kirjakauppa, PL 128 (Keskuskatu 1), FIN-00101 HelsinkiTelephone: +358 9 121 41 • Fax: +358 9 121 4450Email: [email protected] • Web site: http://www.akateeminen.com
FranceForm-Edit, 5, rue Janssen, P.O. Box 25, F-75921 Paris Cedex 19Telephone: +33 1 42 01 49 49 • Fax: +33 1 42 01 90 90 • Email: [email protected]
Lavoisier SAS, 145 rue de Provigny, 94236 Cachan CedexTelephone: + 33 1 47 40 67 02 • Fax +33 1 47 40 67 02Email: [email protected] • Web site: http://www.lavoisier.fr
GermanyUNO-Verlag, Vertriebs- und Verlags GmbH, Am Hofgarten 10, D-53113 BonnTelephone: + 49 228 94 90 20 • Fax: +49 228 94 90 20 or +49 228 94 90 222Email: [email protected] • Web site: http://www.uno-verlag.de
HungaryLibrotrade Ltd., Book Import, P.O. Box 126, H-1656 BudapestTelephone: +36 1 257 7777 • Fax: +36 1 257 7472 • Email: [email protected]
IndiaAllied Publishers Group, 1st Floor, Dubash House, 15, J. N. Heredia Marg, Ballard Estate, Mumbai 400 001,Telephone: +91 22 22617926/27 • Fax: +91 22 22617928Email: [email protected] • Web site: http://www.alliedpublishers.com
Bookwell, 2/72, Nirankari Colony, Delhi 110009Telephone: +91 11 23268786, +91 11 23257264 • Fax: +91 11 23281315Email: [email protected]
ItalyLibreria Scientifica Dott. Lucio di Biasio “AEIOU”, Via Coronelli 6, I-20146 MilanTelephone: +39 02 48 95 45 52 or 48 95 45 62 • Fax: +39 02 48 95 45 48
JapanMaruzen Company, Ltd., 13-6 Nihonbashi, 3 chome, Chuo-ku, Tokyo 103-0027Telephone: +81 3 3275 8582 • Fax: +81 3 3275 9072Email: [email protected] • Web site: http://www.maruzen.co.jp
Where to order IAEA publications
No. 20, August 2005

Korea, Republic ofKINS Inc., Information Business Dept. Samho Bldg. 2nd Floor, 275-1 Yang Jae-dong SeoCho-G, Seoul 137-130Telephone: +02 589 1740 • Fax: +02 589 1746Email: [email protected] • Web site: http://www.kins.co.kr
NetherlandsDe Lindeboom Internationale Publicaties B.V., M.A. de Ruyterstraat 20A, NL-7482 BZ HaaksbergenTelephone: +31 (0) 53 5740004 • Fax: +31 (0) 53 5729296Email: [email protected] • Web site: http://www.delindeboom.com
Martinus Nijhoff International, Koraalrood 50, P.O. Box 1853, 2700 CZ ZoetermeerTelephone: +31 793 684 400 • Fax: +31 793 615 698 • Email: [email protected] • Web site: http://www.nijhoff.nl
Swets and Zeitlinger b.v., P.O. Box 830, 2160 SZ LisseTelephone: +31 252 435 111 • Fax: +31 252 415 888 • Email: [email protected] • Web site: http://www.swets.nl
New ZealandDA Information Services, 648 Whitehorse Road, MITCHAM 3132, AustraliaTelephone: +61 3 9210 7777 • Fax: +61 3 9210 7788Email: [email protected] • Web site: http://www.dadirect.com.au
SloveniaCankarjeva Zalozba d.d., Kopitarjeva 2, SI-1512 LjubljanaTelephone: +386 1 432 31 44 • Fax: +386 1 230 14 35Email: [email protected] • Web site: http://www.cankarjeva-z.si/uvoz
SpainDíaz de Santos, S.A., c/ Juan Bravo, 3A, E-28006 MadridTelephone: +34 91 781 94 80 • Fax: +34 91 575 55 63 • Email: [email protected]@diazdesantos.es • [email protected] • [email protected] Web site: http://www.diazdesantos.es
United KingdomThe Stationery Office Ltd, International Sales Agency, PO Box 29, Norwich, NR3 1 GNTelephone (orders): +44 870 600 5552 • (enquiries): +44 207 873 8372 • Fax: +44 207 873 8203Email (orders): [email protected] • (enquiries): [email protected] • Web site: http://www.tso.co.uk
On-line orders:DELTA Int. Book Wholesalers Ltd., 39 Alexandra Road, Addlestone, Surrey, KT15 2PQEmail: [email protected] • Web site: http://www.profbooks.com
Books on the Environment:Earthprint Ltd., P.O. Box 119, Stevenage SG1 4TPTelephone: +44 1438748111 • Fax: +44 1438748844Email: [email protected] • Web site: http://www.earthprint.com
United Nations (UN)Dept. I004, Room DC2-0853, First Avenue at 46th Street, New York, N.Y. 10017, USATelephone: +800 253-9646 or +212 963-8302 • Fax: +212 963-3489Email: [email protected] • Web site: http://www.un.org
United States of AmericaBernan Associates, 4611-F Assembly Drive, Lanham, MD 20706-4391Telephone: 1-800-865-3457 • Fax: 1-800-865-3450Email: [email protected] • Web site: http://www.bernan.com
Renouf Publishing Company Ltd., 812 Proctor Ave., Ogdensburg, NY, 13669Telephone: +888 551 7470 (toll-free) • Fax: +888 568 8546 (toll-free)Email: [email protected] • Web site: http://www.renoufbooks.com
Orders and requests for information may also be addressed directly to:
Sales and Promotion Unit, International Atomic Energy AgencyWagramer Strasse 5, P.O. Box 100, A-1400 Vienna, AustriaTelephone: +43 1 2600 22529 (or 22530) • Fax: +43 1 2600 29302Email: [email protected] • Web site: http://www.iaea.org/books
06-1
0681


