46
Report No. 20436-IND INDONESIA MANAGING GOVERNMENT DEBT AND ITS RISKS The World Bank East Asia and the Pacific Region May 22, 2000

Report No. 20436-IND
INDONESIA
MANAGING GOVERNMENT DEBT AND ITS RISKS
The World Bank East Asia and the Pacific Region May 22, 2000

ii
CURRENCY EQUIVALENTS (As of May 22, 2000)
Currency Unit = Rupiah US$1= Rupiah 8,297
ABBREVIATIONS AND ACRONYMS
ADB - Asian Development Bank ADF - Asian Development Fund BAPEPAM - Capital Market Supervisory Board BULOG - Agency for Logistics Affairs CAR - Capital Adequacy Ratio DMO - Debt Management Office DSA - Debt Sustainability Analysis GDP - Gross Domestic Product HIPC - Heavily Indebted Poor Country IBRA - Indonesian Banking Restructuring Agency IBRD - International Bank for Reconstruction and Development IDA - International Development Association IFIs - International Finance Institutions IMF - International Monetary Fund INDRA - Indonesian Debt Restructuring Agency JBIC - Japan Bank for International Cooperation KKN - Corruption, Collusion and Nepotism KKPA - Credit for Primary Cooperatives Members KUT - Credit for Farmers LIBOR - London Inter Bank Offer Rate MOF - Ministry of Finance NPV - Net Present Value NGO - Non-Governmental Organization ODA - Official Development Assistance OECD - Organization for Economic Cooperation and Development SBI - Bank Indonesia Certificate TA - Technical Assistance
FISCAL YEAR:
April 1-March 31 till 2000 FY2000 is 9 months, Apr. 1 to Dec. 31
Same as CY from 2001 onwards
Regional Vice President: Mr. Jemal-ud-din Kassum, EAPVP Country Director: Mr. Mark Baird Chief Economist: Mr. Masahiro Kawai, EAPVP Sector Director: Mr. Homi Kharas, EASPR Task Team Leader: Mr. Lloyd McKay, EASPR
This report has been prepared by a team including Lloyd McKay, Hana Polackova Brixi, Punam Chuhan, Nunu Hendrawanto, Magda Adriani, Caridad Valdehuesa (ADB consultant) and Nina Herawati. John Underwood and Sara Calvo were peer reviewers. Invaluable review comments and suggestions were also provided by Homi Kharas, Vikram Nehru, Bert Hofman, Sudarshan Gooptu and John Clarke.

iii
INDONESIA MANAGING GOVERNMENT DEBT AND ITS RISKS
Table of Contents
Executive Summary iv Ringkasan Eksekutif vi A. The Problem of Size and Risks 1
Indonesia�s Government debt is very large 1 Government debt service obligations impose a heavy burden 2 Government finances are exposed to significant risks 3 Key factors affecting the size of fiscal risks 3 Actions needed to make Government debt manageable 5 Growth is a necessary foundation for debt reduction 7 B. How to reduce the debt burden 8
(i) Generate significant primary fiscal surpluses, especially over the next few years 8 (ii) Contain off-budget losses and counteract fiscal risks 10 (iii) Aggressively sell assets and reduce debt 12 (iv) Reschedule existing debt under international rules and seek the best possible terms for new borrowing 12 (v) Build government capacity for strategic debt management 14 (vi) Establish an effective domestic bond market 15 (vii) Conclusion 15 Annex 1 Key Data on Indonesia�s Government Debt 16 Annex 2 Market Perception of Risk 19 Annex 3 Established International Guidelines for Rescheduling Debt Service Payments 22 Annex 4 Contingent Liabilities and Fiscal Risks 24 Annex 5 Selected Case Examples of Debt Management 25

iv
EXECUTIVE SUMMARY
The economic crisis has left Indonesia�s Government deeply in debt. Government debt has increased from $53 billion (23 percent of GDP) before the crisis to about $134 billion (83 percent of GDP) in early 2000. Nearly three-quarters of this increase is domestic debt to pay for bank restructuring. This rise in debt is the combined result of past policy mistakes and the economic crisis, not new spending.
Debt service obligations (interest and amortization) will be over 40 percent of government revenue for several years. This will severely constrain fiscal flexibility throughout the term of the current government. The Government will need new financing (both external and domestic) in the coming years to meet expenditure needs.
Though very large, Indonesia�s Government debt is manageable. Government debt can be reduced from about 91 percent of GDP at the end of 2000 to 67 percent within five years, and 46 percent within ten years. But achieving this will not be easy. Actions (such as macro-economic stability, improved governance, and market-friendly policies) to rebuild investor confidence, keep real interest rates down and renew growth are necessary. But these alone would not be sufficient. Actions are also needed in the following six key areas:
1. Generate significant primary fiscal surpluses (at least 2 percent of GDP), especially over the next few years. Every one trillion Rupiah more of fiscal surplus would reduce debt by the same amount. Tax revenues need to be increased, subsidies that are not strategically focused on the poor reduced, and non-essential expenditures deferred. Expenditures can be increased
again after public confidence in the Government�s ability to use resources well is strengthened.
2. Contain off-budget losses and counteract fiscal risks. Actions are needed to minimize new debt arising from off-budget obligations. These include state enterprise losses, local government spending in excess of revenues, directed credit programs, potential additional costs of bank restructuring, and possible further costs to recapitalize Bank Indonesia. Without these actions, efforts to reduce debt can be offset by the concurrent creation of new government debt. Further large increases in debt from off-budget losses, such as the bank restructuring cost of the past two years, may have catastrophic consequences for fiscal management.
3. Aggressively sell government assets to reduce government debt. Early debt reduction would pay big dividends. So IBRA�s assets should be sold as quickly as possible. Rupiah 60 trillion from asset sales now would reduce debt by about 5 percent of GDP. IBRA asset sales would help establish a virtuous cycle, as they would spur recovery by building investor confidence, increasing the value of subsequent sales, and improving efficiency. Similarly, further privatization of state owned enterprises would also help reduce debt and increase efficiency. Any situation where individuals may have acquired state assets through corrupt practices should be examined thoroughly. Wherever evidence of wrongdoing is found, those responsible should be prosecuted and the government compensated.

v
4. Reschedule existing debt under international rules and seek the best possible terms for new borrowing. A very heavy debt service burden could delay recovery and threaten the political sustainability of planned actions. Even with a successful second Paris Club rescheduling, new lending will be needed to mitigate the annual cash requirements of debt servicing. The Government needs to seek concessional loans and grants, ensure productive use of borrowed and other public resources, and smooth the profile of future debt service payments.
5. Build capacity to manage debt well. Vigorous institutional capacity building
will be needed to manage debt well, deal with fiscal risks, and ensure that public resources are used well. High and potentially volatile debt service payments call for a strategy to manage risks and develop new borrowing instruments. The Government needs strong analytical and oversight capacity in a Debt Management Office.
6. Establish an effective domestic bond market. This will provide government with more options for strategic debt management, making it easier to smooth domestic debt service payments that are expected to peak in 2004 and then again in 2008.

vi
RINGKASAN EKSEKUTIF
Krisis ekonomi telah membuat Pemerintah Indonesia terbelit hutang yang berat. Hutang pemerintah telah bertambah dari $53 milyar (23 persen dari PDB) sebelum krisis menjadi sekitar $134 milyar (83 persen dari PDB) di awal tahun 2000. Hampir tiga perempat dari pertambahan ini merupakan hutang dalam negeri yang harus dibayar untuk restrukturisasi perbankan. Kenaikan jumlah hutang ini merupakan akibat gabungan kesalahan kebijakan masa lalu dengan krisis ekonomi, bukan karena pengeluaran baru.
Kewajiban-kewajiban penutupan hutang (bunga dan amortisasi) akan melebihi 40 persen dari penerimaan pemerintah selama beberapa tahun. Ini akan sangat membatasi fleksibilitas fiskal selama masa pemerintahan sekarang ini. Pemerintah akan membutuhkan pembiayaan baru (baik luar maupun dalam negeri) di tahun-tahun mendatang untuk memenuhi kebutuhan pengeluaran.
Meskipun sangat besar, hutang Pemerintah Indonesia dapat dikelola. Hutang Pemerintah dapat dikurangi dari sekitar 91 persen dari PDB pada akhir tahun 2000 menjadi 67 persen dalam waktu lima tahun, dan 46 persen dalam waktu sepuluh tahun. Tetapi untuk mencapai hal ini tidak mudah. Perlu tindakan-tindakan (seperti kestabilan makro-ekonomi, pengendalian pemerintah (governance) yang lebih ditingkatkan, serta kebijakan-kebijakan yang bersahabat terhadap pasar) untuk membangun kembali kepercayaan investor, mempertahankan tingkat bunga nyata pada tingkat yang rendah dan memperbaharui pertumbuhan. Tetapi hal-hal ini saja tidak akan cukup.
Tindakan-tindakan juga dibutuhkan dalam enam bidang utama berikut ini:
1. Hasilkan surplus fiskal primer yang signifikan (paling tidak 2 persen dari PDB), khususnya selama beberapa tahun mendatang. Setiap satu trilyun Rupiah tambahan surplus fiskal akan mengurangi hutang sampai sejumlah yang sama. Penerimaan pajak perlu ditingkatkan, subsidi yang tidak secara strategis ditujukan pada kalangan miskin dikurangi, dan pengeluaran-pengeluaran yang tidak esensial ditangguhkan. Pengeluaran-pengeluaran dapat diting- katkan kembali setelah kepercayaan publik kepada kemampuan Pemerintah untuk menggunakan sumber daya dengan baik telah kuat kembali.
2. Tahan kerugian-kerugian luar anggaran dan atasi risiko-risiko fiskal. Tindakan-tindakan dibutuhkan untuk meminimalkan hutang baru yang timbul dari kewajiban-kewajiban luar anggaran. Ini mencakup kerugian-kerugian BUMN, pengeluaran pemerintah daerah yang melebihi penerimaan, program-program kredit yang diarahkan, biaya tambahan yang mungkin timbul untuk restrukturisasi perbankan, serta kemungkinan tambahan biaya lebih lanjut untuk rekapitalisasi Bank Indonesia. Tanpa tindakan-tindakan ini, upaya-upaya untuk mengurangi hutang bisa disamai oleh pengadaan hutang baru pemerintah pada waktu yang bersamaan. Pertambahan-pertambahan besar lebih jauh dalam jumlah hutang akibat kerugian-kerugian luar anggaran, seperti biaya restrukturisasi bank-bank dua

vii
tahun terakhir, bisa berakibat bencana terhadap pengelolaan fiskal.
3. Jual secara agresif aset-aset pemerintah untuk mengurangi hutang pemerintah. Pengurangan hutang secara dini dapat menghasilkan keuntungan besar. Maka, aset-aset IBRA perlu dijual selekas mungkin. Sejumlah 60 trilyun Rupiah dari penjualan aset sekarang ini dapat mengurangi hutang kira-kira 5 persen dari PDB. Penjualan aset IBRA akan membantu membentuk suatu siklus yang baik, karena akan merangsang pemulih- an dengan membangun kepercayaan investor, menambah nilai penjualan selanjutnya, dan meningkatkan efisiensi. Demikian pula, privatisasi BUMN lebih lanjut juga akan turut mengurangi hutang dan meningkatkan efisiensi. Setiap situasi di mana orang-perorangan mung- kin telah memperoleh aset negara melalui praktek korupsi perlu diperiksa dengan saksama. Di mana saja ditemukan bukti perbuatan salah, mereka yang bertanggung jawab perlu diusut dan pemerintah diberi kompensasi.
4. Jadwal ulang hutang yang ada berdasarkan aturan-aturan inter-nasional dan upayakan syarat-syarat terbaik untuk peminjaman baru. Beban penutupan hutang yang sangat berat dapat menunda pemulihan serta mengancam keberlanjutan politik untuk melaksanakan program-program yang telah direncanakan. Bahkan dengan keberhasilan penjadwalan ulang Paris
Club kedua, pinjaman baru akan diperlukan untuk meringankan kebutuhan uang tunai tahunan guna menutupi hutang. Pemerintah perlu mengupayakan pinjaman-pinjaman lunak serta dana bantuan, memastikan penggunaan yang produktif atas sumber daya pinjaman maupun sumber daya publik lainnya, dan memperlancar profil pembayaran penutupan hutang di masa depan.
5. Bangun kapasitas untuk mengelola hutang dengan baik. Peningkatan kapasitas kelembagaan secara giat akan diperlukan untuk mengelola hutang dengan baik, menanggulangi risiko-risiko fiskal, dan memastikan bahwa sumber daya publik digunakan dengan baik. Pembayaran penutupan hutang yang tinggi dan sangat tidak menentu membutuhkan suatu strategi untuk mengelola risiko dan mengembangkan instrumen-instrumen pinjaman baru. Pemerintah membutuhkan kapasitas analisis dan pengawasan yang kuat dalam suatu Instansi Pengelolaan Hutang.
6. Bentuk suatu pasar obligasi dalam-negeri yang efektif. Ini akan memberikan pemerintah lebih banyak pilihan bagi pengelolaan hutang strategis dan akan mempermudah usaha memperlancar pembayaran hutang dalam negeri yang diperkirakan mencapai puncak pada tahun 2004 dan sekali lagi di tahun 2008.

1
MANAGING GOVERNMENT DEBT AND ITS RISKS
A. THE PROBLEM OF SIZE AND RISKS
1. Indonesia�s Government debt is very large. Total government debt has risen from 23 percent of GDP in March 1997 to 83 percent of GDP in 2000 (see Table 1). Almost three quarters of the increase in debt is new domestic debt arising from the financial crisis; $72 billion in bonds issued to recapitalize banks and to compensate Bank Indonesia for liquidity credits (see Table 2). Only $8 billion of this domestic government debt is held by the private sector, $33 billion is held by state banks, and $31 billion by Bank Indonesia.
2. Contrary to common perception, the government�s external debt has risen modestly, from $53 billion in March 1997 to an expected $63 billion in March 2000. New foreign borrowing accounts for only 13 percent of the increase in government debt. At its peak of 62 percent of GDP, government external debt in Indonesia was comparable with the total external public debt of Mexico and the Philippines in the late 1980s (see Table 3). Foreign borrowing of the rest of the public sector has also been modest compared with this rise in domestic debt. Bank Indonesia has borrowed about $10 billion from the IMF and external debt of state-owned enterprises has remained relatively stable at about $9 billion (see Annex 1 for details).
3. Government borrowing has traditionally relied heavily on official sources of finance � bilateral and multilateral � with Japan being by far the largest single creditor (see Annex 1). The currency composition of the Government�s external debt is largely denominated in US dollars and Yen (see Table 4). Most of foreign borrowing has been long-term, with average maturity of 22 years and grace period of seven years. The average interest rate is 5 percent, which reflects concessional terms of some foreign loans. As a result, the net present value
Table 1. Indonesia: Government Debt Outstanding (US$ billion, end of period)
FY96/97 FY97/98 FY98/99 FY99/00 2000 ------- Actual ------ Projection
Total 52.6 51.2 78.1 134.2 157.2 Domestic a/ 0 0 18.9 71.5 91.5 External 52.6 51.2 59.2 62.7 65.7 Memo items (%): Total/GDP 22.9 61.9 67.3 83.3 90.7 external/GDP 22.9 61.9 51.0 38.9 37.9
Source: Bank Indonesia, MOF and World Bank estimates. a/ Assuming an exchange rate of Rp 7,000 per US dollar for 2000.
Table 3 : External Public Debt (end of period, % of GDP) 1987 1990 1993 1996 1998
Argentina 44 33 20 23 26 Brazil 30 19 21 12 13 Indonesia 54 42 36 26 621/ Korea, Rep. 18 7 7 9 18 Malaysia 47 27 21 16 25 Mexico 60 29 19 29 22 Philippines 69 54 51 32 43 Thailand 28 15 12 9 25
Source: World Development Indicators, 1999. 1/ Central Government debt only
Table 2. Domestic Government Debt (Cumulative, Rupiah trillion)
Variable rate
bonds
Fixed rate
bonds
Inflation indexed bonds
Hedge bonds
Total
Dec-98 0 0 100 0 20 Mar-99 0 0 165 0 165 Jun-99 95 9 218 0 322 Sep-99 95 9 218 0 322 Dec-99 204 51 218 27 500 Mar-00 204 53 218 25 500 Jun-00 330 59 218-253 29 636-671
Source: MOF and World Bank estimates.

2
(NPV) of government external debt is 12 percent lower than the nominal value of the government�s external debt. The NPV of government external debt was about $51 billion at the end of 1998, compared with a face value of $58 billion (see Table 5).
4. This large increase in stock of domestic government debt is partly offset by a concurrent rise in government assets. In particular, the Government received shareholdings in industrial enterprises, equity in banks, real estate and loan portfolios in exchange for bank restructuring bonds. It is very difficult to be put a precise value on these assets, but IBRA has estimated that they could generate about $30 billion in revenue from asset sales over the next five years. Subtracting this from the stock of government debt suggests that �net government debt� in March 2000 was about $104 million (54 percent of GDP) compared with gross government debt of $134 million (72 percent of GDP).
5. Government debt service obligations impose a heavy burden. Debt service payments will severely constrain public expenditures and the flexibility of overall fiscal and monetary policy for at least the life of the current government. Total government debt service obligations (external and domestic) absorbed 36
percent of government tax revenues in FY1999/00, compared with only 24 percent before the crisis. They are expected to peak at 45 percent of government revenue in 2000 and are projected to remain above 40 percent for several years. Interest payments will be 35-40 percent of government revenue for the next few years. Interest payments on domestic bonds alone will be 25-30 percent of government revenues per annum.1 Principle repayment on domestic bonds peaks at $5.8 billion equivalent in 2004 and $9 billion equivalent in 2008.
6. External debt service payments were kept down to 22 percent of government tax revenues for FY99/00 by the quasi Paris Club agreements. Without the second quasi Paris Club rescheduling, external debt service payments would have risen to a projected 28 percent of government revenue in the 2000 fiscal year before falling back to 25 percent in 2001 and 21 percent in 2002. Total debt service obligations would have been about $15 billion per annum (half on external debt and half on domestic debt interest payments) if there had been no second Paris Club. Bunching of principle repayments and possible volatility in the cost of debt service, which we discuss below, calls for a careful borrowing strategy to avoid excessive pressures on government budget at this critical time.
1 Excluding the inflation indexed part of bonds
issued to bank Indonesia, as this is capitalized.
Table 6. Government Debt Service Payments (US$ billion) FY98/99 FY99/00 2000 b/ 2001 2002 Actual --------- Projection ---------- Total 6.1 8.8 9.8 12.9 15.6 External 5.5 5.6 3.7 5.4 7.6 Principal a/ 2.9 2.7 1.4 2.5 5.1 Interest 2.6 2.9 2.3 2.8 2.5 Domestic 0.6 3.2 6.1 7.6 8.0 Bond maturities .. .. .. .. 0.8 Interest 0.6 3.2 6.1 7.6 7.2 Memo items: Total/revenue (%) a/ 38.8 36.4 44.9 41.8 42.6 Total/GDP (%) 5.9 6.3 8.5 8.2 9.4 External/exports (%) 10.5 9.4 8.3 8.9 12.0 BI to IMF (US$ bil): 0.3 0.4 0.3 2.3 2.8 Source: Bank Indonesia and World Bank staff estimates. a/ This reflects rescheduling under the quasi-Paris Club. b/ This is the nine month fiscal year, April till December, 2000.
Table 4. Currency Composition of External Government Debt (March, 1999)
US$ billions Share (%) Total 59.2 100.0 Yen 23.0 38.9 US dollars 26.5 44.8 �Other 9.6 16.2
Source: Bank Indonesia and World Bank staff estimates.
Table 5. Net Present Value of External Government Debt (US$ billion, end-1998) Nominal value NPV Total 58 51 Multilateral 18 18 o.w. IBRD 11 11 Bilateral 35 28 o.w. Japan 21 17 Other 5 5
Source: Bank Indonesia data and World Bank staff estimates.

3
7. Assessing the manageability of debt service obligations is akin to assessing fiscal sustainability. Hence, before turning to explicitly address the question of debt sustainability, we first look at key factors affecting government expenditures and revenues.
8. Government finances are exposed to significant risks. Indonesia's government expenditures are exposed to two key risks - sudden increases in debt service costs and unexpected spending pressures. Sudden increases in debt service costs may arise from an increase in domestic interest rates, new debt needed to account for past or new policy mistakes, depreciation of the Rupiah, and inflation. Unexpected spending pressures may arise from social or political pressures and from off-budget obligations associated with financial institutions, state-owned enterprises, independent government agencies, and sub-national governments. The likelihood of these risks actually resulting in additional government expenditures depends heavily on the Government�s commitment to prudent and transparent fiscal management.
9. The fiscal risk matrix (Box 1) illustrates sources of future possible pressures on government expenditures. Government debt may rise if any of these explicit (legally substantiated) and implicit (politically and morally grounded) contingent liabilities are realized. The largest contingent liabilities relate to the banking sector (government guarantee on interbank claims, implicit commitment to recapitalize large state-owned banks and maintain a stable financial system). Box 2 summarizes potential sources of debt reduction.
10. Key factors affecting the size of fiscal risks. The leading factors affecting the potential costs arising from these risks and the Government�s capacity to meet them are summarized below: • Investor confidence is vital for the
Government to successfully obtain the
expected 207 trillion Rupiah2 from IBRA asset sales and to privatize state owned enterprises. It is also critical for renewed growth, keeping interest rates down, achieving government tax revenue targets and establishing a successful domestic bond market. Investor confidence, in turn, will depend on prudent fiscal and monetary policies, sound market institutions, and transparency in government decision making.3
• Domestic interest rates affect the cost of debt service and the size of likely off-budget losses. A one percentage point increase in the SBI rate would increase the cost of servicing domestic debt by about 0.3 percent of GDP annually (4 trillion Rupiah). An increase in domestic interest rates would weaken government credit programs4 and increase likely corporate and banking sector losses that could in turn increase government obligations.
• Political actions are likely to alter the size of off-budget obligations and the revenue from asset sales. A soft stance vis-à-vis large banks or enterprises would be likely to result in further bank recapitalization costs and would reduce IBRA revenues 5. Indirectly, a lack of political will would tend to undermine the return of investor confidence.
2 Book value of IBRA assets is reported to be 533
trillion Rupiah, but average expected recovery rate is only about 30-35 percent.
3 Investor confidence in Indonesia has yet to fully recover. Annex 2 illustrates that, for Indonesia, secondary market spreads on international bonds remain high, and sovereign credit rating low.
4 In 2000-01, the government is expected to face a contingent liability of about 28 trillion Rupiah on credits outstanding. For most credits, such as KUT and KKPA, the government explicitly covers default risk. Average maturity of these credits is 12 months and average default risk 40 percent.
5 This relationship has already surfaced through asset management companies in a number of countries (including Mexico and the Philippines) and also in Indonesia. IBRA reported a significant drop in debt collection rates following the Bank Bali scandal.

4
Box 1. Fiscal Risk Matrix Obligations Direct
Obligation in any event Contingent
Obligation if a particular event occurs Explicit Government liability as recognized by a law or contract
• Sovereign debt (domestic and external, loans contracted and securities issued by Government)
• Expenditures � non-discretionary and legally binding in the long term (salaries and pensions of civil servants, minimum benefits under the pay as you go pension system)
• Blanket guarantee on bank depositors (cost 600 trillion Rupiah during 1997-1999)
• Guarantee on interbank claims • Umbrella government guarantees for non-sovereign
borrowing by small and medium-sized enterprises, farmers, BULOG, and other entities
• Trade and exchange rate guarantees (via the Export Bank, INDRA and other entities)
Implicit A moral obligation of Government that reflects public and interest-group pressures
• Future recurrent costs of public investment projects and other discretionary expenditures
• Losses associated with take-or-pay contracts of public utility companies
• Support to enterprises (government possibly covering losses and assuming non-guaranteed obligations of state-owned or private enterprises)
• Subsidies related to the pricing of rice and regulated oil products (via BULOG and PERTAMINA programs)
• Possible need for further recapitalization for any banks that fail to reach the 8 percent CAR by end-2001
• Possible need for further recapitalization of Bank Indonesia • Possible spill-over of sub-national government obligations to
the central government Source: World Bank staff.
Box 2. Potential Sources of Debt Reduction Potential sources of
debt reduction Direct
Based on available assets Contingent
Dependent on future events Explicit Sources based on government legal powers (ownership) and the right to raise revenues
• IBRA assets recovery (workout and sales of non-performing loans and sales of equity)
• Privatization of state-owned enterprises and other public resources
• Government revenues from oil and gas • Tax revenues less revenue committed to sub-national governments • Savings from cuts of discretionary expenditures, such as subsidies • Hedging instruments and (re-)insurance policies purchased by the
government from financial institutions • Recovery of loans made by government to public enterprises
Implicit Sources not under direct government control
• Future profits of state-owned enterprises and agencies under government control
• Possible positive net worth of Bank Indonesia (adjusted for currency structure and liquidity of reserves)
Source: World Bank staff.

5
• Policy actions directly affect government revenues (e.g. through tax exemptions), current expenditures (e.g. subsidies on petroleum products, electricity and rice) and potential future expenditures (e.g. potential liabilities arising from credit programs, BULOG�s operations, and power projects). A failure to maintain fiscal discipline, as could happen with the implementation of fiscal decentralization, would increase government debt.
• Operational risks pervade fiscal and debt management arrangements. A shortage of trained staff in many aspects of fiscal risk and debt management, together with inadequate information, gives rise to the likelihood of misjudgments and poor implementation
• Changes in the Rupiah affect external debt service payments, exchange rate guarantees provided by the Export Bank and INDRA, and liquidity and solvency problems of banks with large foreign debts. This effect on expenditures is partly off-set by changes in oil revenues and the market value of export companies under IBRA control. Deregulation of domestic fuel prices would increase the offsetting effect that oil price has on fiscal balances. Cross-currency risk, particularly the risk of yen appreciation, is significant, as 39 percent of government foreign debt is denominated in yen and Indonesia has a large ($1 billion) deficit in Yen-denominated trade. A 10-percent appreciation of the Yen would increase government debt by nearly 2.3 billion dollars.
• Commodity price changes, particularly for oil and rice, affects government finances. The budget deficit falls by about 0.1 percent of GDP for every 1 dollar rise in the oil price.6 An increase in the price of rice affects the government budget through BULOG losses.7
6 World Bank, Indonesia, Public Spending in a
Time of Change, 1999. 7 BULOG procures domestically produced rice at
a price fixed by the government and distributes rice to the poor and the army at low prices.
11. Actions needed to make government debt manageable. Achievable macroeconomic and fiscal developments would reduce the debt to GDP ratio to 67 percent of GDP within 5 years and about 46 percent of GDP within 10 years.8 But this cannot be achieved without bold and sustained actions by government. Renewed growth, conservative fiscal policies, and asset sales are all essential if this potential reduction in debt is to be realized. Future shocks and losses of investor confidence must be avoided too. This reduction in debt as a share of GDP depends directly on: (a) the difference between GDP growth and the average interest rate paid on government debt; and (b) the primary fiscal surplus9, capital revenues (e.g. IBRA�s asset sales) and off-budget losses.10 Any attempt to inflate away part of the domestic debt would not only undermine investor confidence, but its effectiveness would be severely limited by the fact that about 90 percent of domestic debt is subject to a variable interest rate or has its �interest rate� indexed to the rate of inflation.
12. Figure 1 illustrates this achievable decline in the government debt to GDP ratio. It assumes that government succeeds in undertaking the needed difficult policy actions, that investor confidence returns and that renewed growth is achieved. The key assumptions underpinning this scenario are shown in Table 7. This scenario demonstrates that Indonesia�s debt is sustainable. But it also demonstrated how difficult this challenge is and how long it will take.
8 A debt level is technically sustainable if the
ratio of debt to GDP is falling over time. 9 The primary fiscal surplus is the overall fiscal
balance plus interest payments. It could be interpreted to include quasi-fiscal revenues.
10 The change in the ratio of government debt to GDP (dt) = dt (it � gt) - primary fiscal surplust - capital revenuet + new off-budget debtt where i is the average nominal interest rate paid on government debt, g is the nominal growth of GDP, primary fiscal surplus is the fiscal surplus plus interest payments, capital revenue is government resources from the sale of assets (IBRA and state enterprises), and new off-budget debt is additions to debt arising from off-budget losses (e.g. contingent liabilities). All except i and g are ratios to GDP.

6
0
10
20
30
40
50
60
70
80
90
100
Dom.debt/GDPExt.debt/GDP
Government Debt/GDP (%)
Figure 1. An Achievable Scenario of Declining Government Debt
Source: Bank Indonesia and World Bank projections.
Table 7. Key Outcomes and Assumptions Underlying Debt Reduction (%) Real GDP
growth rate Ave. int. rate on domestic debt a/
Primary fiscal surplus/GDP
Capital revenue/GDP b/
Off-budget losses/GDP c/
FY1999/00 3.0 .. - 0.9 1.5 0.0 2000 d/ 3.5 7.8 1.5 2.9 13.5 2001 4.5 9.9 2.2 3.8 1.3 2002 5.0 9.4 2.5 3.4 0.3 2003 6.0 9.3 2.2 3.1 0.2 2004 6.0 9.3 2.0 1.2 0.2 2005 6.0 9.3 2.0 0.5 0.1 2006 6.0 9.3 2.0 0.3 0.1 2007 6.0 9.3 2.0 0.3 0.1 2008 6.0 9.3 2.0 0.2 0.1 2009 6.0 9.2 2.0 0.2 0.1 2010 6.0 9.2 2.0 0.2 0.1
Source: Bank Indonesia, Ministry of Finance and World Bank projections. The exchange rate is assumed to be Rp 7,000 per US$ in 2000 and thereafter remains constant in real terms. The average inflation rate is assumed to be 5 percent and the oil price is assumed to be $20 per barrel. Note: a/ The average real interest rate on non-indexed variable rate domestic bonds is assumed to be about 4.5
percent. The average nominal interest on external debt is assumed to remain at 5 percent. b/ Capital revenue includes the assumed sale of IBRA�s Rp 207 trillion in assets over the next five years
plus the progressive privatization of state owned enterprises to yield between 0.8 and 0.1 percent of GDP per annum.
c/ New off-budget losses are expected to come from directed credit programs and further recapitalization of state banks to complete the program currently under way and to raise their CAR to 8% by end 2001.
d/ This is for the nine months, April to December.

7 13. In this scenario, the debt to GDP ratio rises further in 2000 due to additional bank restructuring costs more than offsetting revenues from asset sales. Even in 2001 new bonds issued to achieve the target capital adequacy ratios to 8 percent for all banks will largely off-set the capital revenues from IBRA asset sales. But an anticipated primary budget surplus will begin to reduce the debt burden. From 2002 to 2004, the debt to GDP ratio declines quite quickly due to the combined effect of primary fiscal surpluses of over 2 percent of GDP, renewed growth of 6 percent per annum, IBRA asset sales, further privatization and little new off-budget losses. After that, the decline slows down because capital revenues from asset sales decline.
14. Such a decline in government debt would not be unique as several countries have achieved such a decline. Indonesia managed to cut its government debt to GDP in half between 1988 and 1997 (from 54 percent to 26 percent). This was achieved through rapid GDP growth and sustained conservative fiscal policies. Malaysia achieved an even more dramatic reduction in debt. They reduced government debt from about 103 percent of GDP in 1987 to 33 percent 10 years later by growing rapidly and maintaining modest fiscal surpluses (see Figure 2).
15. But the very challenging nature of policy actions needed to achieve this reduction in Indonesia�s government debt means that there is no room for complacency. Potential reductions are not real until they are actually achieved. And this will take effective and sustained implementation of painful policy actions. Actions that will need broad political and social support and strengthened implementation capacity. The simple fact that debt service obligations are likely to account for 50 percent of government revenue, or more, for the next few years highlights the pressure that reducing debt will impose on the budget process. Even when the net change in debt is modest, there is still a need to ensure that resources are available when needed to meet the actual cash requirements of debt servicing on schedule. This can be particularly difficult when there is not a well developed domestic debt market, as is the current situation in Indonesia.
16. Growth is a necessary foundation for debt reduction. Without rapid growth, reducing government debt from over 90 percent of GDP is extremely difficult. Growth helps by reducing the debt burden (the ratio of debt to GDP) without actually reducing the nominal amount of debt. And it helps provide a growing pool of resources from which to meet current expenditure needs and a surplus with which to reduce the actual stock of debt. This is illustrated in Figure 3 by simulating the effects of half as much growth (i.e. 3 percent per annum rather than 6 percent), one percent of GDP smaller primary fiscal surplus each year, and only half as much revenue from the privatization of state owned enterprises. Revenue for IBRA asset sales is assumed to remain the same. Sound macroeconomic management is, in turn, essential to generate this necessary rapid growth, to avoid a rise in interest rates and to maintain fiscal surplus.11
11 A one percent increase in domestic interest
rates would increase debt service cost by about 0.5 percent of GDP.
0
20
40
60
80
100
120
Figure 2. Malaysia's Government Debt to GDP Government Debt / GDP (%)
Source: Global Development Finance, 1999.

8
B. HOW TO REDUCE THE DEBT BURDEN
17. There are no easy actions available to government that could reduce the debt burden to pre-crisis levels within five or even ten years. As noted above, macro-economic stability, good governance, and market-friendly policies are essential to rebuild investor confidence, keep real interest rates down and renew growth. But this is not sufficient to reduce the debt burden. Concerted action is also needed in six essential areas:
• Generate significant primary fiscal surpluses, especially over the next few years.
• Contain off-budget losses and counteract fiscal risks.
• Aggressively sell government assets to reduce government debt.
• Reschedule existing debt under international rules and seek the best possible terms for new borrowing.
• Build capacity to manage debt well. • Establish an effective domestic bond
market.
18. At present, the Government of Indonesia has a low ability to absorb fiscal risks. First, the government lacks adequate liquid contingency reserves. Second, government debt is already high and the
government�s access to debt markets and to new financing is limited. Third, risks such as exchange rate depreciation are only partly offset by changes in oil revenue. And, fourth, the government does not yet have much risk management capacity. Shocks and sudden pressures on government finances are thus likely to result in disruptions to government expenditure programs, with serious consequences for the country�s social development. This highlights the importance of reducing debt to increase the flexibility for fiscal management.
19. For fiscal management to contain risks and hence ensure that the reduction in debt is sustained, the Government needs to build institutional arrangements and capacities. Transparency and public accountability are crucial for effective debt and fiscal management. The fact that responsibility is currently divided between several parts of the Ministry of Finance and Bank Indonesia militates against well coordinated transparent debt management. It is important that government establish an integrated debt management unit in the Ministry of Finance and support this unit with clear and objective criteria/guidelines for debt creation for all levels of government.
(i) Generate significant primary fiscal surpluses, especially over the next few years 20. As part of any effective strategy to reduce the debt burden, it is vital that the Indonesian government maintain a substantial primary fiscal surplus. The larger the surplus, the quicker the reduction in debt, so primary fiscal surpluses of at least 2 percent per annum in the next few years are particularly important. In fact, the larger the fiscal surplus in the next few years, the smaller the overall fiscal surplus needed to achieve any given reduction in the debt to GDP ratio. An extra one trillion Rupiah in fiscal surplus and debt reduction now would be equivalent to at least two trillion Rupiah of budget resources in ten
0.0
20.0
40.0
60.0
80.0
100.0
120.0
0
20
40
60
80
100
120
Base Scenario
Weaker macroeconomic management
Government Debt / GDP (%)
Figure 3. The Importance of Renewed Growth and Good Macroeconomic Management

9
years time. In practical terms, generating fiscal surpluses requires government to:
• increase revenues by improving tax administration, tax policy (e.g. reducing tax exemptions and forward carry-overs), and efficiency of state owned enterprises and
• lower expenditures by reducing subsidies and price controls, re-focusing its role, and deferring non-essential expenditures.
21. In Indonesia, the appeal of generating large primary fiscal surpluses for the next few years is reinforced by lingering concerns regarding the capacity of public institutions to ensure that resources are well used. Public expenditures could be constrained now and relaxed once institutional strengthening provided greater confidence that the resources will be well used.
22. A detailed discussion of revenue and expenditure options is beyond the scope of this study but there are some glaring opportunities for increased revenues that deserve mention.12 Doubling the forestry resource royalty rate and enforcing compliance could yield about 0.5 a percent of GDP in additional revenue. And logging would still be quite profitable.13 Abolishing all import tax exemptions now that the tariff rates are virtually all below 20 percent would increase customs revenue a little14, and simplify administration without creating a large disincentive to invest.
12 For a detailed discussion of revenue and
expenditure options, see the 1998 and 1999 World Bank Public Expenditure Reviews (Indonesia, Public Spending in a Time of Change) and the IMF recent tax study.
13 Such an increase in taxation would still only collect about 60 percent of the economic rent in log harvesting.
14 Import duty revenue is currently only 0.2 percent of GDP and falling as rates fall.
0.0
10.0
20.0
30.0
40.0
50.0
60.0
70.0
80.0
90.0
100.0
0
10
20
30
40
50
60
70
80
90
100
Government Debt / GDP (%)
1 percent smaller primary fiscal surplus
1 percent larger primary fiscal surplus
Base Scenario
Figure 4. The Importance of Primary Fiscal Surpluses

10 23. One critical aspect of fiscal management over the coming few years will be ensuring that decentralization does not undermine the attainment of primary fiscal surpluses. It is vital that the devolution of revenues to regional or local government be matched by the concurrent transfer of expenditures responsibility. Otherwise, it will be virtually impossible for the Central Government to generate the primary fiscal surplus needed to reduce its debt burden.
24. The importance of maintaining a fiscal surplus is illustrated in Figure 4 by simulating the effect of a one percentage point change in the primary fiscal surplus. Maintained for 10 years, a one percentage point increase in the primary fiscal surplus would reduce the debt burden by about 10 percent of GDP.
(ii) Contain off-budget losses and counteract fiscal risks
25. Without actions to contain fiscal risks, efforts to reduce the debt burden could be in vain, as new debt could emerge to offset hard won reductions in existing debt. The creation of additional new debt needs to be limited to accounting for past mistakes, not the result of new mistakes. The earlier analysis (Boxes 1 and 2) indicates that policy actions are needed in many areas to offset fiscal risks and secure sustained debt reduction. A particularly important concern is the possibility of a renewed loss of confidence giving rise to new government debt.
26. To minimize the risk of further increases in debt, contingent liabilities need to be avoided wherever possible. Where government does assume contingent liabilities, actions should be taken to provision for the risk and spread the risk by sharing it. Contingent liabilities to other parts of the public sector � state owned banks, non-financial public enterprises and Bank Indonesia � need to be transparent and contained. Restructuring of state banks to avoid further losses is critical. Analysis under
way to clarify Bank Indonesia�s assets and liabilities and therefore the extent of any further calls on government resources is also important in this context. With credit programs, arrangements should include a sharing of risks with the borrower, lender, and program manager. Government guarantees should not be provided to cover obligations or risks that are under control of the borrower and lender. Commercial risks are one such example, though some degree of guarantee for trade credit may be justified because of its importance to economic recovery. The contingent liability arising from the guaranteed procurement price of rice needs to be contained. One option would be to reduce it whenever there is a large harvest or low world prices.
27. As the crisis-induced rise in government debt over the past two years demonstrates, a blanket government guarantee of depositors coupled with inadequate bank supervision and an exchange rate exposed to buffeting from large capital flows exposes the government to a very large contingent liability. Bank portfolios have been cleaned up as part of the bank recapitalization program, but until capital adequacy ratios are increased from the present 4 percent to something like 12 percent, bank supervision strengthened, and the blanket government guarantee replaced by a self-financing deposit insurance scheme, the possibility of further increases in government debt from corporate losses and poor bank performance remains.
28. Plans to generate primary fiscal surpluses are exposed to commodity price (e.g. oil) and exchange rate risks and to changes in economic performance. These affect government revenue through business and income taxes and expenditures on subsidies and relief programs. Tools, such as derivative instruments and re-insurance policies, to hedge such risk exposure are not yet available to the Indonesian Government. Second, as mentioned earlier, efforts to

11
generate primary surpluses may be undermined by fiscal decentralization. Devolution of revenues to regional or local government must be matched by the concurrent transfer of expenditure responsibility. Furthermore, mechanisms need to be developed to contain local government borrowing within prudent limits. As experience in countries like Argentina, Brazil, Germany, India and Mexico indicates, regional and local governments tend to demand additional support from the central government when they experience financial pressure. Obligations of sub-national government thus create an implicit contingent liability of the central government and add a further risk to government debt management.
29. The importance of containing off-budget losses and counteract fiscal risks is illustrated in Figure 5, by simulating the possible impact of a sudden decline in investor confidence. This stress scenario assumes that investor confidence declines again in 2003, and is reflected in a sudden decline in demand
for Rupiah and other Indonesian assets. This would generate a temporary sharp depreciation of the Rupiah (say 12,000 Rupiah per US dollar during 2003-2004) and an increase in domestic interest rate (SBI rate up to 40 percent in 2003 and 28 percent in 2004). The decline in the Rupiah value would make imports more expensive and thus generate inflation (up to 30 percent in 2003 and 10 percent in 2004). This loss of confidence and associated rise in uncertainty would negatively affect overall economic performance (reducing the GDP growth from 6 to -2 and 0 percent in 2003 and 2004 respectively), lead to renewed primary fiscal deficits (5 percent of GDP in 2003 and 2004), generate new off-budget losses through bank recapitalization and other contingent liabilities (up by about 100 trillion of Rupiah in 2003 and 2004), and erode revenues from government asset sales15. A future loss in confidence could well result in
15 Following this 2003-2004 stress, all
assumptions are assumed to return to the baseline.
0.0
20.0
40.0
60.0
80.0
100.0
120.0
140.0
0
20
40
60
80
100
120
140
Base Scenario
A sudden drop in investor confidence
Government Debt / GDP (%)
Figure 5. The Importance of Avoiding Adverse Shocks

12 further increases in government debt as a share of GDP and consequently create an even heavier debt burden. To avoid such a scenario and ensure success with debt reduction efforts, the Government needs to reduce its exposure to risks that could lead to additional new government debt.16
(iii) Aggressively sell assets and reduce debt. 30. The easiest and quickest way to achieve a substantial reduction in government debt is to sell IBRA assets and privatize state owned enterprises. It may be politically painful to sell assets below their book value, but international evidence suggests that it is generally better to sell assets early rather than wait and hope for a higher price. Assets under management by restructuring agencies tend to lose rather than gain in value. To avoid the risks of corruption associated with asset sales, it is important that IBRA follows transparent procedures and maintains a high level of information disclosure.
31. Asset sales and privatization will not only generate immediate capital revenues that can be used to reduce debt, but higher growth and future tax revenues as well.17 They will contribute to the establishment of a virtuous cycle of increased investor confidence, higher growth and higher revenue for subsequent asset sales. Care is needed though to ensure that there is a sound regulatory framework in place for any enterprises that, once privatized,
16 For example, the Government�s borrowing
strategy should take into account the existing unhedged exposure to increasing interest rates and to the yen appreciation, and aim at the development of domestic debt and derivatives markets.
17 If selling an entire enterprise in what is though to be a depressed market is politically impossible, consideration could be given to selling majority shareholding to establish private sector leadership and management. Then the public sector could still benefit from recovery of the enterprise and associated increases in value, as a minority shareholder.
will not be in a competitive environment. Second, it is important to have a sales procedure that avoids corruption, collusion and nepotism (KKN).
32. Selling Rupiah 200 trillion in assets over the next few years, as IBRA�s plans to, will reduce government debt by about 15 percent of GDP. Privatization of state owned enterprises could well reduce it by a further 5 percent of GDP over the next 5-7 years. Without such asset sales, total public debt would certainly continue to increase and the government debt to GDP would only fall slowly.
33. Finally, any situation where individuals may have acquired state assets through corrupt practices should be examined thoroughly. Wherever evidence of wrongdoing is found, those responsible should be prosecuted and recompense to the state sought. Aggressive pursuit of persons involved in corrupt practices would yield additional revenue through the recovery of some of these assets and it would deter corrupt behavior in future.
34. The choice of what debt to retire with capital revenues should be decided as part of a comprehensive debt management strategy. It will depend on the cost of alternative liabilities and associated risks, the ability of public finances and the financial system to carry these various risks, and the possible need to smooth amortization payments.
(iv) Reschedule existing debt under international rules and seek the best possible terms for new borrowing.
35. Government has been working with donors to keep debt service payments down to manageable levels and allow time for an orderly sale of IBRA assets, strengthening the tax revenue base and solidifying renewed growth. Without debt rescheduling of ODA, debt service obligations would severely constrain other government spending over the

13
next few years. Once renewed growth is firmly established, the assets sales program is well under way, and a domestic debt market begins to provide needed resources, the government�s capacity to service debt and concurrently maintain other expenditures would be increased.
36. Indonesia has already received $4.6 billion in debt �rescheduling� (or in Japan�s case additional new finance) from bilateral donors under a quasi-Paris Club covering the period between August 1998 and March 2000.18 Rescheduling provided under the auspices of the Paris Club depends on the per capita income and debt level and debt service capacity of the particular debtor country (see Box 3). This �rescheduling� to date kept the
18 Note that Indonesia also received debt
rescheduling from bilateral creditors when unable to meet obligations from 1966 to 1969 (see Annex V).
external debt service to government revenue ratio at 34 percent for FY1998/99 and 25 percent for FY 1999/00. Without rescheduling these ratios would have been 45 percent and 38 percent respectively. Without the second Paris Club agreement, debt service obligations would have risen to about 60 percent of government revenue in FY2000 and stayed near 50 percent of government revenue for the following two years. 37. The second Paris Club rescheduling, covering $5.8 billion in amortization due on bilateral debt between April 2000 and March 2002, was agreed in April, 2000.19 This will 19 This agreement was made conditional on the
successful completion of first review of the IMF program scheduled for no later than June 5, 2000. It should be noted that the US$5.8 billion estimate of this rescheduled amount is based on end-December 1999 exchange rates. The Paris Club has since calculated a revised estimate of US$5.44 billion which uses exchange rates as of February 29, 2000.
Box 3. Rescheduling Options for Lower Middle-Income Countries a/
Rescheduling of bilateral debt is determined within the framework of the Paris Club, reflecting the principles of �solidarity� and �comparability�. For each individual country, rescheduling provided under the auspices of the Paris Club depends on the per capita income, debt level and debt service capacity of the debtor country.
Houston terms Indonesia Philippines Jordan Date signed Sept 98 1991 & 1994 May 1997 Amount rescheduled ($bln) 4.6 b/ 1.7 & 0.6 0.4 Coverage principal principal princ. & int. Consolidation period 20 months 14 & 17 months 21 months General Grace period (years) Up to 8 3 8 & 8 3 Maturity (years) 15 11 14 &14 15 Repayment schedule flat/graduated graduated graduated Interest rate Market rates Market rates Market rates Market rates Reduction in NPV (%) nil nil nil nil ODA Credits Grace period (years) Up to 10 5 10 &10 10 Maturity (years) 20 20 19 & 19 19
a/ Lower middle income is defined (World Bank) as countries with a per capita GNP of between $761 and $3,030 in 1998. b/ Japan actually provided new money in lieu of rescheduling.

14 make a major contribution to the resources Indonesia needs to re-establish sustained growth and strengthen its debt management. Under the terms agreed for this second Paris Club, ODA amortization falling due will be rescheduled with seven years grace and a repayment period of 20 years. The interest rate will be at least as favorable as that applying to the ODA loans concerned. The terms for rescheduling non-ODA bilateral amortization is three years grace and 15 years repayment. The interest rate will be bilaterally determined and will be set at an appropriate market rate. In accordance with standard practice, the Paris Club creditors based their decision on an assessment of Indonesia's balance of payments needs and foreign exchange requirements. In providing this support, the Paris Club creditors expressed their strong endorsement of the reform programs being implemented by Indonesia's new, democratically elected government and noted the importance of continued satisfactory implementation of that program.
38. The rescheduling of ODA amortization payments by the Paris Club will also provide significant relief to the government�s difficult fiscal position this year and next. By rescheduling ODA debt, bilateral donors effectively reduced the Indonesian government�s near-term debt service burden. Rescheduling at less than market interest rates also increases the average concessionality of Indonesia�s outstanding government debt. By providing a portion of its lending as IDA credits since GDP per capita fell in 1998, the World Bank has also increased the average concessionality of its financial support to Indonesia. The ADB too is increasing the average concessionality of its lending by providing ADF credits. Such increases in concessionality are important to help Indonesia maintain strategic social and human resource investments until economic recovery is firmly established.
(v) Build government capacity for strategic debt management
39. High and potentially volatile debt service payments call for a strategy to manage existing risks and to develop new borrowing instruments. But government currently has only fragmented information about its debt service profile and risks of contingent liabilities. Moreover, debt management responsibility is split among several directorates of the Ministry of Finance and Bank Indonesia. This makes comprehensive analyses and accountability virtually impossible. This in turn calls for the establishment and empowerment of a government Debt Management Office (DMO).20 Work has begun to build this capacity in the Ministry of Finance. But much remains to be done and this will take time and resources. This DMO needs to work very closely with, or be an integral part of, the budget and treasury parts of the Ministry of Finance.
40. This needed capacity to manage government debt strategically in Indonesia could be built around the following principles: First, the Cabinet and government should set priorities among competing debt management objectives, and consult with Parliament. For example, should the government focus on minimizing the immediate cost of debt service or minimizing its risk exposure? Minimizing 20 Colombia, Hungary, Ireland, and Sweden have
each assigned responsibility for managing government liabilities and assets to an agency with a degree of autonomy from political influence. Under such an arrangement, the government formulates and publicly announces its strategy, while the debt and asset management agency implements that strategy in a transparent and publicly accountable manner. International experience has shown that autonomy, transparency and public accountability in the management of government assets and liabilities boost the country�s creditworthiness and investors� confidence.

15 debt service suggests issuing short-term debt, whereas minimizing risk suggests issuing long-term debt. The DMO would focus on implementing these government priorities. Given the potentially catastrophic consequences of further increases in debt, it is suggested that debt management place a high priority on reducing the government risk exposure, ensuring a steady and predictable debt service profile, and enhancing the government�s access to debt markets. Specifically, this means reducing the volatility of debt servicing arising from refinancing risk, currency risk, and interest rate risk and issuing domestic bonds of specific maturities to set a benchmark for the domestic bond market.
41. Second, the DMO needs to develop a capacity to analyze debt management options and their likely consequences. Strong analytical capacity, transparency and public accountability are crucial for effective debt and fiscal management.21 The DMO needs to analyze future debt service costs and the debt profile under alternative assumptions; the risks emerging from government debt portfolio (refinancing risk, currency risk, interest rate risk); the risks of contingent government liabilities (off-budget pressure emerging from obligations state-owned enterprises, banks, independent government agencies, and sub-national governments); and the impact of alternative borrowing strategies on the cost and volatility of future debt service.
21 Contemporary approaches to reduce
government exposure to risk (e.g. Canada, the Netherlands, New Zealand, and South Africa) are based on the following principles: First, limit budget and off-budget obligations for each sector. Second, calculate the future expected fiscal cost of off-budget support. Third, include the expected cost of off-budget support in full in the year when it is issued and place it in a central contingency reserve fund. Fourth, hold policy makers accountable for their risk analysis.
42. Third, the DMO should advise policy makers on the pros and cons of alternative policy choices. As part of this, the DMO should build awareness of the expected cost of debt service, existing contingent liabilities, and proposed budgetary and off-budget commitments. This should also cover borrowing and risk exposure of sub-national (provincial and district level) governments, independent government agencies, and state-owned enterprises.
(vi) Establish an effective domestic bond market.
43. The establishment of an effective domestic bond market is essential for government to be able to manage the large amount of new domestic debt. Without it, government would have limited options for strategic debt management. Without it, government would not be able to smooth domestic debt service payments that begin to mature in large amounts in 2003 and are bunched in 2004 and 2008. Developing this domestic bond market will require close coordination between the Ministry of Finance (including the DMO and BAPEPAM) and Bank Indonesia. And it should provide for a range of short, medium and longer-term bonds.
(vii) Conclusion.
44. Indonesia can overcome its government debt burden with renewed growth and prudent fiscal management. But this will not be easily or quickly achieved. Sustained fiscal surpluses and asset sales will both be important. So will actions to avoid additional new government debt and strengthen debt management capacity.

16
Annex 1. Key Data on Indonesia�s Government Debt
Table A1. Government Debt Outstanding by Creditor (US$ Billions, End of period, Fiscal years, 1994/95-99/00, Calendar years, 2000 onwards)
FY94/95 FY95/96 FY96/97 FY97/98 FY98/99 FY99/00 2000 2001 2002 ------------------------- Actual -------------------------- Projection ---------------------------------------- Total Gov�t debt outstanding 62.6 58.6 52.6 51.2 78.1 134.24 157.2 158.0 155.5 Domestic a/ 0.0 0.0 0.0 0.0 18.9 71.5 91.5 90.5 87.9 Held by - Private sector 8.0 9.1 8.8 8.4 - State banks 32.3 50.0 48.7 45.8 - Bank Indonesia 18.9 31.2 32.4 33.0 33.7 External 62.6 58.6 52.6 51.2 59.2 62.7 65.6 67.5 67.6 Multilateral 22.8 19.4 16.5 15.5 18.0 20.0 21.4 21.7 22.0 o.w. IBRD 13.2 11.9 10.1 10.2 11.0 11.7 12.7 12.9 13.1 ADB 4.5 6.0 7.4 7.8 8.0 8.0 Bilateral 23.0 22.9 20.1 19.4 22.5 23.3 24.1 24.9 24.9 o.w. Japan 13.2 16.3 17.0 17.6 18.3 18.3 Others b/ 16.8 16.4 16.1 16.3 18.7 19.4 20.1 20.9 20.7 o.w. Japan 4.9 6.3 6.1 6.1 6.1 5.2 Memo items: CG debt/GDP (%) 34.7 28.4 22.9 61.9 67.3 83.3 90.7 85.5 78.8 IMF (to BI) - - - 3.0 9.2 10.2 12.3 11.8 10.7 State enterprises (ext. debt) 8.5 7.8 6.7 8.9 9.0 9.1 7.7 5.8 4.4 o.w. Banks 3.6 2.9 3.0 5.0 4.9 4.9 4.1 2.8 2.2Memo items: Gross Foreign Reserves (BI) 17.1 20.6 26.7 16.5 25.7 27.8 29.2 31.2 33.7Source: Bank Indonesia, MOF and World Bank estimates . a/ Assuming an exchange rate of Rp 7,000 per US dollar in 2000 and is constant in real terms thereafter. b/ Suppliers' credits, financial institutions and export credits.

17
Table A2. Central Government: External Debt Service Payments (US$ Billions)
FY98/99 FY99/00 2000 2001 2002 Actual ------------------- Projection --------------- Total 5.51 5.57 3.71 5.36 7.61 Principal 2.90 2.71 1.42 2.53 5.14 IBRD 0.74 0.87 0.67 1.04 1.15 ADB 0.22 0.31 0.35 0.49 0.64 Other multilateral 0.04 0.06 0.05 0.06 0.06 Japan 0.42 0.55 0.02 0.03 0.63 Other bilateral 0.17 0.05 0.03 0.03 0.30 Other 1.31 0.87 0.31 0.88 2.36 Interest 2.61 2.86 2.29 2.83 2.47 IBRD 0.77 0.82 0.58 0.73 0.64 ADB 0.22 0.4 0.36 0.46 0.44 Other multilateral 0.01 0.02 0.02 0.02 0.02 Japan1 0.38 0.42 0.33 0.49 0.45 Other bilateral1 0.20 0.19 0.16 0.20 0.16 Other2 1.03 1.01 0.84 0.93 0.76 Memo items: Ext. debt service/GDP 5.3 4.0 3.2 3.4 4.6 Ext. debt service/exports 10.5 9.4 8.3 8.9 12.0 Ext. debt service/revenue 34.1 23.1 16.9 17.5 20.8 BI obligations to the IMF: 0.26 0.43 0.33 2.31 2.84 Principal 0 0 0 1.89 2.52 Interest 0.26 0.43 0.33 0.42 0.32
Source: Bank Indonesia and World Bank estimates. 1 Includes the impact of existing recent Paris Club Agreements 2 Export credit & commercial

18
Table A3. Total National External Debt-Cross Country Comparisons Table A4. External Public Debt Cross-Country Comparisons
1987 1990 1993 1996 1998 1987 1990 1993 1996 1998 External debt/GDP (%) Public & publicly guaranteed debt (PPG)/GDP (%) Argentina 53 44 27 35 48 Argentina 44 33 20 23 26 Brazil 41 26 33 23 30 Brazil 30 19 21 12 13 Indonesia 69 61 56 57 157 1/ Indonesia 54 42 36 26 62 Korea, Rep. 35 19 19 27 43 Korea, Rep. 18 7 7 9 18 Malaysia 72 36 41 40 62 Malaysia 57 27 21 16 25 Mexico 78 40 33 48 41 Mexico 60 29 19 29 22 Philippines 90 69 66 48 73 Philippines 69 54 51 32 43 Thailand 40 33 42 50 77 Thailand 28 15 12 9 25 External debt/Exports of goods and services 1/ (%) PPG debt service/Government revenue (%) Argentina 717 420 453 389 463 Argentina 30 33 14 24 .. Brazil 425 341 330 339 395 Brazil 8 4 4 .. .. Indonesia 287 239 220 227 269 Indonesia 38 34 33 30 49 Korea, Rep. 89 64 66 86 89 Korea, Rep. 58 11 10 6 .. Malaysia 113 47 50 43 62 Malaysia 38 31 19 17 .. Mexico 331 214 214 148 123 Mexico 38 19 18 53 .. Philippines 369 268 224 120 129 Philippines 47 39 44 26 .. Thailand 139 96 111 127 131 Thailand 25 21 10 6 13 External debt service/Exports of goods and services 1/ (%) Government revenue/GDP (%) Argentina 77 42 42 52 58 Argentina 14 10 14 12 .. Brazil 42 23 26 47 74 Brazil 34 31 30 .. .. Indonesia 38 34 35 38 33 Indonesia 20 19 17 17 .. Korea, Rep. 34 11 10 10 13 Korea, Rep. 17 18 19 22 .. Malaysia 22 13 9 9 9 Malaysia 25 27 28 25 .. Mexico 37 23 39 38 19 Mexico 16 15 15 15 .. Philippines 42 31 31 16 12 Philippines 15 17 18 19 .. Thailand 24 18 14 13 19 Thailand 15 19 18 19 .. Source: World Development Indicators. Source: World Development Indicators. 1/ This sharp peak is largely due to Rupiah depreciation.

19
Annex 2. Market Perception of Risk
It is instructive to understand how the market is perceiving Indonesia�s risk. Markets indicate that risks have lessened following the October elections. Nonetheless, risk perceptions are high as indicated by continuing large yield spreads on Indonesian issues, below-investment grade country risk ratings and limited access of Indonesian banks and corporations to external finance.
Yield spreads. Secondary market yield spreads on debt issues are a measure of the premium to holders of these issues to compensate for possible future default, uncertainty associated with expected returns and liquidity of issues. Most analysts agree that in early 1997 yield spreads on emerging market bonds were �unreasonably� low and seemed to indicate that emerging market debt represented a mainstream asset class. The Asian crisis of 1997 and the Russian unilateral debt restructuring in August 1998 forced investors to re-evaluate risk in emerging markets. These crises revealed weaknesses in emerging markets and demonstrated susceptibilities arising from the growing financial linkages and channels through which shocks are being transmitted.1 Investors� re-evaluation of risk has translated into large liquidity and credit spreads for emerging market debt, although there are important differences across countries (see chart A1).
This reassessment of emerging market risk has translated into high spreads
1 Notable is the growing trend among investors
of financing investments on margin and short position taking financed by bank borrowing on margins. With leveraged positions on emerging market assets, margin calls in response to change in market value of these assets leads to selling or unwinding of positions in a broad range of assets to meet these margins.
for Indonesian benchmark bond issues. These spreads widened sharply in 1997 and again in 1998, reaching a peak of over 1400 basis points in October 1998. Spreads have trended down since then, but remain stubbornly high. At end March, 2000, they were around 500 basis points or over three times their pre-Asia crisis levels. By contrast, spreads on benchmark issues from China, Malaysia and Thailand have edged much closer to the pre-Asian crisis levels. Country rating. Indonesia�s credit rating has been on a downward slide. Major credit rating agencies such as Moody�s and Standard & Poor�s have successively downgraded the country�s foreign currency rating beginning in October 1997 (see table A5). The downgrades to non-investment grade or speculative category imply a perception of continuing vulnerabilities and indicate expected payment difficulties for the country.
Favorable developments including a Rupiah exchange rate which is fluctuating in a narrow band and falling interest rates, have only partially alleviated market concerns. Local factors that are particularly worrisome include a lack of progress on corporate debt restructurings and the implication of this for banks� balance sheets, continuing financial sector weaknesses, and the possibility that banks require further recapitalization support. In the near term, large repayment obligations, which are larger than reserves, continue to make the country vulnerable to roll-over or liquidity risk. Again, sensitivity to exchange rate and interest rate movements can add to an already high debt burden. While rescheduling of principal payments due to bilateral donors between August 8, 1998 and March 2000 provided much needed relief, further rescheduling is still needed.

20
Chart A1: Secondary Market Spreads on International Bonds
Source: Bloomberg. Note: Secondary market spreads vis-a-vis comparable US treasuries on sovereign liquid US$ denominated benchmark of medium term maturity.
0
200
400
600
800
1000
1200
1400
1600
Argentina
Brazil
0
200
400
600
800
1000
1200
1400
1600
IndonesiaChinaThailand

21
Table A5: Indonesia�s Sovereign Rating Movements, 1997 � 1999 Standard & Poor�s Moody�s Investors Service
Date Foreign Currency Rating LT/Outlook/ST
Local Currency Rating LT/Outlook/ST
Date Foreign Currency Rating LT/Outlook/ST
Local Currency Rating LT/Outlook/ST)
Beginning of 1997
BBB/Stable/-- A+/Stable/-- Beginning of 1997
Baa3
Oct. 10, 1997 BBB-/Stable/-- A-/Stable/-- Oct. 27, 1997 --/Negative/--
Dec. 31,1997 BB+/Negative/-- BBB+/Negative/-- Dec. 21, 1997 Ba1/--/NP
Jan. 9, 1998 BB/CW-Neg./-- BBB/CW-Neg./-- Jan. 9, 1998 B2/--/--
Jan. 27, 1998 B/CW-Neg./-- BB-/CW-Neg./--
March 11, 1998 B-/CW-Neg./-- B+/CW-Neg./-- March 20, 1998 B3/--/--
May 15, 1998 CCC+/CW-Neg./-- B-/CW-Neg./-- Sept. 4, 1998 B3/--/--
July 8, 1998 CCC+/Negative/-- B-/Negative/--
March 30, 1999 SD/NM/-- B-/Negative/--
March 31, 1999 CCC+/Stable/C B-/Stable/C
Sept. 13, 1999 CCC+/CW-Neg./C B-/CW-Neg./C Dec. 15, 1999 B3/positive/--
Source: Moody�s Investors Service and Standard and Poor�s Sovereign Ratings Services. Note: LT�Long-term bonds. ST�Short-term bonds CW-Neg.�On CreditWatch with negative implications. SD�Selective Default. NM�Not meaningful. NP�Not Prime. Without it, payments to these creditors will rise sharply during 2000-2001. And another round of relief from bilateral donors would have implication for foreign currency commercial debt under the so-called �burden sharing� requirements of official restructurings.2 Markets, not surprisingly, are particularly wary of any calls for debt forgiveness. Access to private-source financing. A reassessment of emerging market risk has resulted in a generalized pullback in private debt financing. Indonesia is particularly hard hit by the liquidity squeeze and its access to foreign finance remains severely constrained. In 1998, Indonesian banks experienced a near drying up of credit lines and overseas banks refused letters of credit issued by Indonesian banks. With extensive government
2 A second round of official restructuring
covering April 2000 to March 2002, would affect Indonesia�s $26 million floating rate note due on Feb 20, 2001.
guarantees, inter-bank lines were restored to levels of $2.7 billion. Investor sentiment toward Indonesia has improved but this has yet to translate into capital inflows. A successful and speedy resolution of the corporate debt situation could pave the way for a return of private-source foreign funds.
Another key factor in the return of foreign funds (overseas funds of local investors) is IBRA�s implementation of asset sales. There are two essential issues from the perspective of market participants. First, what is the price at which IBRA will sell these assets? The market view is that many of IBRA�s assets are inflated and efforts to sell them at face value won�t work. Second, to whom will these assets be sold: shareholders, who may be willing to purchase these assets at discounted amounts, or new investors? An improvement in sovereign rating will be helpful in attracting foreign investors� funds.
22
Annex 3. Established International Guidelines for Rescheduling Debt Service Payments
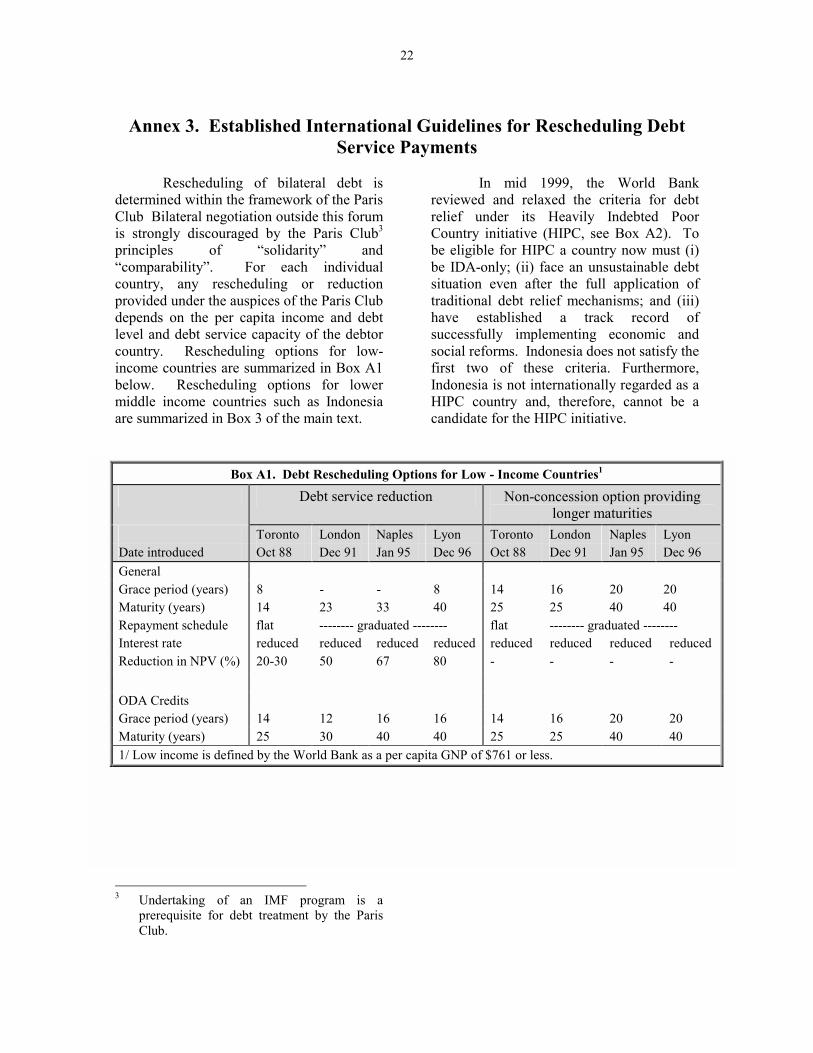
Rescheduling of bilateral debt is determined within the framework of the Paris Club Bilateral negotiation outside this forum is strongly discouraged by the Paris Club3 principles of �solidarity� and �comparability�. For each individual country, any rescheduling or reduction provided under the auspices of the Paris Club depends on the per capita income and debt level and debt service capacity of the debtor country. Rescheduling options for low-income countries are summarized in Box A1 below. Rescheduling options for lower middle income countries such as Indonesia are summarized in Box 3 of the main text.
3 Undertaking of an IMF program is a
prerequisite for debt treatment by the Paris Club.
In mid 1999, the World Bank reviewed and relaxed the criteria for debt relief under its Heavily Indebted Poor Country initiative (HIPC, see Box A2). To be eligible for HIPC a country now must (i) be IDA-only; (ii) face an unsustainable debt situation even after the full application of traditional debt relief mechanisms; and (iii) have established a track record of successfully implementing economic and social reforms. Indonesia does not satisfy the first two of these criteria. Furthermore, Indonesia is not internationally regarded as a HIPC country and, therefore, cannot be a candidate for the HIPC initiative.
Box A1. Debt Rescheduling Options for Low - Income Countries1
Debt service reduction Non-concession option providing longer maturities
Toronto London Naples Lyon Toronto London Naples Lyon Date introduced Oct 88 Dec 91 Jan 95 Dec 96 Oct 88 Dec 91 Jan 95 Dec 96 General Grace period (years) 8 - - 8 14 16 20 20 Maturity (years) 14 23 33 40 25 25 40 40 Repayment schedule flat -------- graduated -------- flat -------- graduated -------- Interest rate reduced reduced reduced reduced reduced reduced reduced reduced Reduction in NPV (%) 20-30 50 67 80 - - - - ODA Credits Grace period (years) 14 12 16 16 14 16 20 20 Maturity (years) 25 30 40 40 25 25 40 40 1/ Low income is defined by the World Bank as a per capita GNP of $761 or less.

23
Box A2. The HIPC Debt Reduction Initiative for IDA Countries
To be eligible for HIPC, a country must: (a) be IDA-only; (b) face an unsustainable debt situation even after the full application of traditional debt relief mechanisms; and (c) have established a track record of successfully implementing economic and social reforms. HIPC-eligible countries are required to undertake sustained improvements in their economic management, structural and social policy reform, including especially actions that will improve basic health care and education. A three-year performance period is required for a country to become eligible for a stock-of-debt operation by the Paris Club. A Debt Sustainability Analysis is undertaken to determine whether this Paris Club operation would be enough for the country to achieve debt sustainability after a further three years. Countries for which existing mechanisms would not achieve debt sustainability after this additional three years receive assistance under the HIPC Initiative sufficient to achieve debt sustainability at the end of this second three year period, provided they continue with of strong policy reform.1
A Debt Sustainability Analysis (DSA) would be prepared by the staff of the World Bank and the IMF, and where appropriate, other major regional development banks, together with officials of the debtor country. DSAs would use actual data on (i) a three-year backward-looking average of exports; (ii) the latest year central government revenues; and (iii) the six-monthly average of the commercial interest reference rates as currency-specific discount rates.
Sustainable debt levels are defined on a case-by-case basis within the range of 150 to 200 percent for the debt-to-exports ratio (on a Net Present Value (NPV) Basis) and 20 to 25 percent for the ratio of debt service to exports. Specific targets, within this range, are determined in the light of country-specific vulnerability factors, such as the concentration and variability of exports, and the fiscal indicators of the burden of debt service. For very open economies where the exclusive reliance on external indicators may not adequately reflect the fiscal burden of external debt: an NPV debt-to-export target below 200 percent at the completion point can be recommended, provided that the country concerned meets two criteria at the decision point: an export-to-GDP ratio of at least 40 percent and a minimum threshold of fiscal revenue in relation to GDP of 20 percent. For countries meeting these thresholds, the NPV debt-to-export target will be set at a level which achieves a 280 percent ratio of the NPV of debt-to-revenue at the completion point.

24
Annex 4. Contingent Liabilities and Fiscal Risks
The government�s financial position is exposed to a wide range of risks that affect the value of the government�s liabilities and assets as well as the size of its budget deficit. Risks facing government commonly include: (a) refinancing risk (short maturities or maturity bunching under restricted access to debt markets) emerging from the direct and guaranteed debt portfolio; (b) liquidity risk (risk of having to sell assets at loss) emerging from maturity mismatch between assets and liabilities and from rigidities in the government�s capacity to raise revenues and cut expenditures; (c) currency risk (exchange rate risk and cross-currency risk, exposure to short-term exchange rate volatility) arising from the currency structure of government debt and exchange rate guarantees, which is partly offset by the currency structure of foreign reserves and the current account flows; (d) interest rate risk (floating interest rate) in the direct and
guaranteed debt portfolio; (e) commodity price risk (e.g. swings in the price of oil and rice), which affects government contingent liabilities as well as its budgetary revenues and expenditures; (f) derivative risk (risk of large losses from the use of derivative instruments) facing the central bank as well as the government; (g) medium- and long-term sustainability risk, which includes issues of debt sustainability and expenditure sustainability (for instance, pension expenditures in an aging society); (h) political risk (risk of political weakness and of insufficient commitment to fiscal stability) affecting both the value of government liabilities and assets; and (i) operational risk (poor valuation and risk assessment, system errors, poor organizational structures, corruption and fraud) that may emerge in government debt management, in central bank reserve management, in the pursuit of asset sales and recovery, and in privatization.
Dealing with Contingent Liabilities and Other Fiscal Risks International evidence has confirmed that country fiscal performance can be ruined by the emergence of �hidden� fiscal risks, such as obligations facing the government outside its budget. Analyses of past increases in the stock of government debt have shown that governments often accumulate debt as a result of �hidden deficits� rather than reported budget deficits. Hidden deficits mainly arise from debt structure, as currency, maturity or interest rate risks materialize, and from off-budget government obligations, such as contingent liabilities that fall due. Consequently, narrow interests in reducing budget deficit may actually increase rather than reduce government exposure to fiscal risks, and deteriorate rather than improve the prospects of future fiscal performance.
Analysis of fiscal risks in a broad sense is important to assess fiscal vulnerability and debt sustainability over time. Reasons include increasing volumes and volatility of private capital flows, transformation of the state from financing of services to guaranteeing particular outcomes, and related to both of these, moral hazards in the markets, and fiscal opportunism of policy makers. Fiscal risks become particularly threatening in countries with a limited scope for maneuver in government financing. Limited access to debt market and inflexible exchange rate policy reduce the amount of fiscal risks that governments can take on without facing excessive fiscal risks.
Fiscal vulnerability is concerned in particular with the emergence of unexpected fiscal risks and policy challenges and with the government�s capacity to respond to them. Fiscal vulnerability takes into account: (a) the initial fiscal position (including the central government budget, other levels of government, extra-budgetary funds and quasi-fiscal activities, assets and liabilities, contingent liabilities, fiscal indicators), (b) sensitivity of the fiscal position to short-term risks, such as macroeconomic volatility, called contingent liabilities, and unclear expenditure commitments, (c) medium- and long-term fiscal sustainability (debt dynamics, baseline projection and stress testing, and long-term pressures from demographic trends, resource depletion, etc.), and (d) structural or institutional weaknesses (expenditure composition, revenue system, deficit financing, government access debt markets, institutional capacity for fiscal management).

25
Annex 5. Selected Case Examples of Debt Management
Box A3. Renegotiations of the 'Sukarno' Debt (1966-70)
During Sukarno's regime, Indonesia had incurred very large external debts due to profligate borrowing and unwise lending. The successor government, finding itself unable to meet contractual obligations on these debts, requested debt relief. The renegotiation process was complicated by the fact that more than half of Indonesia's total external public debt of $2.1 billion was owed to Eastern European creditors, particularly USSR for substantial military assistance. The debt negotiation with the western creditors' group was chaired first by a Japanese, and then by a French national, to which Indonesia's socialist creditors were invited but declined to attend. A protracted debt negotiation ensured within a Paris Club framework. The principal of the entire 'Sukarno' debt (including development credits on concessional terms, and amounts which had been renegotiated previously by the Paris Club), was consolidated for repayment in 30 equal installments at zero interest. Contractual interest and interest on earlier Paris Club rescheduling, was deferred until 1985 and to be paid thereafter in 15 equal installments, but with no additional interest applied to these deferments of interest payments (these arrangements were based on recommendations of Dr. Abs, a prominent German banker). In addition, the Paris Club permitted Indonesia, under a bisque clause arrangement similar to that contained in the Anglo-American Financial Agreement, to defer at its option up to one-half of the principal payments falling due during the early years of the new schedule. These deferred obligations were to be repaid with interest at 4 percent per annum during the final years of the agreement. The 'Sukarno' debt renegotiation was unprecedented because of its unusually generous terms, exceptionally large volume and the inclusion of all external public debt incurred prior to July 1st, 1966. It is also unprecedented in that socialist countries, which had refused to join the Paris Club negotiations, rescheduled their portion of the debt on essentially the same terms. In fact, Paris Club members assured themselves, and other developing countries, that Indonesian debt settlement of 1970 was generous in nature and that its repetition should not be expected.

26
Box A4. Argentina�s BONEX Plan (1989-90) Background: As the availability of external resources declined during the 1980s and fiscal adjustments were inadequate to offset this change, there was an increased recourse to domestic financing. In the case of Argentina, the ratio of domestic debt as a percentage of GDP rose from 7.4 percent in 1986:Q1 to 18.3 percent in 1989:Q2. Argentina went through three unsuccessful stabilization programs (Austral, Primavera and the BB) between 1984-89, each ending with large devaluation followed by sky-rocketing inflation.
Immediate Developments leading up to the BONEX Plan: During 1989, as the new debt sales fell short of the maturities falling due, there was increasing pressure on the central bank to accommodate the borrowing needs of the non-financial public sector. Bank reserve and investment requirements on deposits, and at a later stage frozen deposits, were used for this purpose. In addition, the central bank accelerated placement of CEDEPS (short-term debts). By midyear these instruments were financing interest payments on the central bank's own debt (the quasi-fiscal cost reached 30 percent of GDP during the same period). According to Fernandez (1991), the CEDEPS were being issued at such a high nominal interest rates that, most depositors knew that such a yield of nearly 15 percent monthly in US dollars can not last long and tried to capitalize on the gain by converting their local currency (austral) deposits to US dollars. The exchange rate depreciated by nearly 175 percent and inflation rose to 80 percent in December 1989 and the authorities tried to prevent capital flight by raising interest rate further. But that led to a rapid increase in central bank's interest-bearing debt stock. Surging interest rate and swelling debt made the BONEX conversion unavoidable. The BONEX plan was implemented on January 1, 1990.
The Measures: The central measure of the plan was the forced conversion of commercial bank time deposits and public sector debt coming due in 1990 for a dollar-denominated government security BONEX 89. Approximately 500,000 Argentinean pesos (Ap) of each account were exempted from conversion and were made available in cash and exemptions were extended to deposits of senior citizens, deposits used to pay taxes or wages. By IMF estimates, out of an outstanding stock of deposits of 4.6 trillion At the end of December 1989, only 2.1 trillion Ap was converted to BONEX. The bonds paid an interest equal to six months LIBOR plus a small spread and were paid in quarterly installments. This government decree however did not restrict the convertibility of local currency into foreign exchange.
Cost and Benefit: Initially, BONEX 89 traded at a discount of more than two-thirds, representing a substantial loss to its holders, mostly individuals and private sector companies. In addition, debt exchange operation also led to an initial decline in the price of dollar denominated bonds issued in previous years (the price of 1982 series fell from 80 percent to 50 percent of face value immediately after the debt exchange). The debt conversion scheme also created a portfolio imbalance for many banks as they received international interest rates on their external bond assets and paid domestic interest rates on their domestic liabilities. The government directly eliminated its domestic quasi-fiscal deficit through the debt conversion scheme, but ended up recapitalizing the banks through the provision of a special financial instruments (BIC bonds).
Evaluation: The BONEX plan reduced the fiscal cost of the government and led to extinction of roughly one half of the economy's broad liquidity stock (which later, favorably contributed in establishment of the currency board in April 1991), but it had many destabilizing consequences as well. It gave a profound blow to financial market confidence and a sharp reduction in commercial banks' solvency and profitability. Most importantly, it did not succeed in stopping the economy from moving into hyperinflation once again, as it did in February 1990. The economy began to turn around in March 1990 after announcement of substantial fiscal measures, tight monetary policy and ambitious plan of privatization and deregulation. In February 1991, there was a new run against the currency, which led to appointment of Domingo Cavallo as the economics minister and subsequent establishment of Currency Board and Convertibility plan in April 1991.

27
Box A5. Renegotiations of Peru's External Debt with Official Creditors (1969, 1978) The Peru debt renegotiations of 1969 were not carried out in a typical Paris Club framework but were conducted individually between Peru's government representatives and its creditors. The government of Peru also attempted to coordinate the rescheduling effort by convening creditor meetings in Lima and in Nov 1969 in Brussels. When European and Japanese creditors could not agree to uniform terms, bilateral settlements were further pursued. Through these various settlements, amortization payments due between 1968 and 1970 were sharply reduced by agreeing to higher interest payments on the outstanding amounts. In 1968, effective amortization was reduced from $151 million to $95 million, and in 1969 from $197 million to $127 million, with the deferred amounts falling due between 1970 and 1975. In 1970, German government agreed to reschedule 75% of the obligations to be paid in 16 years from 1972 with interest at 8.5%. The French government rescheduled 75% of the obligations to French nationals at 9%, to be repaid from 1972 to 1976, and the Belgian government rescheduled credits at 9%, to be repaid from 1972 to 1975. Spanish credits were privately rescheduled at 8% and deferred until 1972-76. During the Nov 1978 debt renegotiations meeting with Paris Club members, Peru's government proposed the rescheduling of 90% of the principal due to official creditors in 1979 and 1980, on terms similar to those that had been proposed earlier to bank creditors (see below). This proposal was accepted by Paris Club participants. The agreement covered all principal due on officially guaranteed commercial credits and loans from governments or government agencies, contracted prior to Jan 1st 1978, with an original maturity of more than one year. The amount consolidated was $211 million, equivalent to 90% of the outstanding total debt to public creditors. Payment of the remaining 10% and payment of all interest rate was to be made as originally scheduled. Principal payments falling due in 1979 were to be repaid in ten equal and successive semiannual installments. Payments falling due in 1980 were to be repaid in eight equal and successive semiannual installments. The grace period granted was 3 years, and the maturities (grace plus repayments periods) were extended to 71/2 and 6
1/2 years, respectively. The interest rates on the rearranged maturities were to be determined bilaterally between Peru and the individual creditor governments. A nondiscrimination clause was added to the arrangement to make sure discrimination among creditor categories would be avoided. The commercial bank rescheduling was agreed on, in basic terms, before the Paris Club meetings, but it was signed only after the agreement had been reached with the official creditors. The two agreements were, therefore, almost identical. An important difference, however, was that the consolidation interest rate on the bank debt floated over LIBOR, rather than being fixed and concessional.

16
Annex 1. Key Data on Indonesia�s Government Debt
Table A1. Government Debt Outstanding by Creditor (US$ Billions, End of period, Fiscal years, 1994/95-99/00, Calendar years, 2000 onwards)
FY94/95 FY95/96 FY96/97 FY97/98 FY98/99 FY99/00 2000 2001 2002 ------------------------- Actual -------------------------- Projection ---------------------------------------- Total Gov�t debt outstanding 62.6 58.6 52.6 51.2 78.1 134.24 157.2 158.0 155.5 Domestic a/ 0.0 0.0 0.0 0.0 18.9 71.5 91.5 90.5 87.9 Held by - Private sector 8.0 9.1 8.8 8.4 - State banks 32.3 50.0 48.7 45.8 - Bank Indonesia 18.9 31.2 32.4 33.0 33.7 External 62.6 58.6 52.6 51.2 59.2 62.7 65.6 67.5 67.6 Multilateral 22.8 19.4 16.5 15.5 18.0 20.0 21.4 21.7 22.0 o.w. IBRD 13.2 11.9 10.1 10.2 11.0 11.7 12.7 12.9 13.1 ADB 4.5 6.0 7.4 7.8 8.0 8.0 Bilateral 23.0 22.9 20.1 19.4 22.5 23.3 24.1 24.9 24.9 o.w. Japan 13.2 16.3 17.0 17.6 18.3 18.3 Others b/ 16.8 16.4 16.1 16.3 18.7 19.4 20.1 20.9 20.7 o.w. Japan 4.9 6.3 6.1 6.1 6.1 5.2 Memo items: CG debt/GDP (%) 34.7 28.4 22.9 61.9 67.3 83.3 90.7 85.5 78.8 IMF (to BI) - - - 3.0 9.2 10.2 12.3 11.8 10.7 State enterprises (ext. debt) 8.5 7.8 6.7 8.9 9.0 9.1 7.7 5.8 4.4 o.w. Banks 3.6 2.9 3.0 5.0 4.9 4.9 4.1 2.8 2.2Memo items: Gross Foreign Reserves (BI) 17.1 20.6 26.7 16.5 25.7 27.8 29.2 31.2 33.7Source: Bank Indonesia, MOF and World Bank estimates . a/ Assuming an exchange rate of Rp 7,000 per US dollar in 2000 and is constant in real terms thereafter. b/ Suppliers' credits, financial institutions and export credits.

17
Table A2. Central Government: External Debt Service Payments (US$ Billions)
FY98/99 FY99/00 2000 2001 2002 Actual ------------------- Projection --------------- Total 5.51 5.57 3.71 5.36 7.61 Principal 2.90 2.71 1.42 2.53 5.14 IBRD 0.74 0.87 0.67 1.04 1.15 ADB 0.22 0.31 0.35 0.49 0.64 Other multilateral 0.04 0.06 0.05 0.06 0.06 Japan 0.42 0.55 0.02 0.03 0.63 Other bilateral 0.17 0.05 0.03 0.03 0.30 Other 1.31 0.87 0.31 0.88 2.36 Interest 2.61 2.86 2.29 2.83 2.47 IBRD 0.77 0.82 0.58 0.73 0.64 ADB 0.22 0.4 0.36 0.46 0.44 Other multilateral 0.01 0.02 0.02 0.02 0.02 Japan1 0.38 0.42 0.33 0.49 0.45 Other bilateral1 0.20 0.19 0.16 0.20 0.16 Other2 1.03 1.01 0.84 0.93 0.76 Memo items: Ext. debt service/GDP 5.3 4.0 3.2 3.4 4.6 Ext. debt service/exports 10.5 9.4 8.3 8.9 12.0 Ext. debt service/revenue 34.1 23.1 16.9 17.5 20.8 BI obligations to the IMF: 0.26 0.43 0.33 2.31 2.84 Principal 0 0 0 1.89 2.52 Interest 0.26 0.43 0.33 0.42 0.32
Source: Bank Indonesia and World Bank estimates. 1 Includes the impact of existing recent Paris Club Agreements 2 Export credit & commercial

18
Table A3. Total National External Debt-Cross Country Comparisons Table A4. External Public Debt Cross-Country Comparisons
1987 1990 1993 1996 1998 1987 1990 1993 1996 1998 External debt/GDP (%) Public & publicly guaranteed debt (PPG)/GDP (%) Argentina 53 44 27 35 48 Argentina 44 33 20 23 26 Brazil 41 26 33 23 30 Brazil 30 19 21 12 13 Indonesia 69 61 56 57 157 1/ Indonesia 54 42 36 26 62 Korea, Rep. 35 19 19 27 43 Korea, Rep. 18 7 7 9 18 Malaysia 72 36 41 40 62 Malaysia 57 27 21 16 25 Mexico 78 40 33 48 41 Mexico 60 29 19 29 22 Philippines 90 69 66 48 73 Philippines 69 54 51 32 43 Thailand 40 33 42 50 77 Thailand 28 15 12 9 25 External debt/Exports of goods and services 1/ (%) PPG debt service/Government revenue (%) Argentina 717 420 453 389 463 Argentina 30 33 14 24 .. Brazil 425 341 330 339 395 Brazil 8 4 4 .. .. Indonesia 287 239 220 227 269 Indonesia 38 34 33 30 49 Korea, Rep. 89 64 66 86 89 Korea, Rep. 58 11 10 6 .. Malaysia 113 47 50 43 62 Malaysia 38 31 19 17 .. Mexico 331 214 214 148 123 Mexico 38 19 18 53 .. Philippines 369 268 224 120 129 Philippines 47 39 44 26 .. Thailand 139 96 111 127 131 Thailand 25 21 10 6 13 External debt service/Exports of goods and services 1/ (%) Government revenue/GDP (%) Argentina 77 42 42 52 58 Argentina 14 10 14 12 .. Brazil 42 23 26 47 74 Brazil 34 31 30 .. .. Indonesia 38 34 35 38 33 Indonesia 20 19 17 17 .. Korea, Rep. 34 11 10 10 13 Korea, Rep. 17 18 19 22 .. Malaysia 22 13 9 9 9 Malaysia 25 27 28 25 .. Mexico 37 23 39 38 19 Mexico 16 15 15 15 .. Philippines 42 31 31 16 12 Philippines 15 17 18 19 .. Thailand 24 18 14 13 19 Thailand 15 19 18 19 .. Source: World Development Indicators. Source: World Development Indicators. 1/ This sharp peak is largely due to Rupiah depreciation.

19
Annex 2. Market Perception of Risk
It is instructive to understand how the market is perceiving Indonesia�s risk. Markets indicate that risks have lessened following the October elections. Nonetheless, risk perceptions are high as indicated by continuing large yield spreads on Indonesian issues, below-investment grade country risk ratings and limited access of Indonesian banks and corporations to external finance.
Yield spreads. Secondary market yield spreads on debt issues are a measure of the premium to holders of these issues to compensate for possible future default, uncertainty associated with expected returns and liquidity of issues. Most analysts agree that in early 1997 yield spreads on emerging market bonds were �unreasonably� low and seemed to indicate that emerging market debt represented a mainstream asset class. The Asian crisis of 1997 and the Russian unilateral debt restructuring in August 1998 forced investors to re-evaluate risk in emerging markets. These crises revealed weaknesses in emerging markets and demonstrated susceptibilities arising from the growing financial linkages and channels through which shocks are being transmitted.1 Investors� re-evaluation of risk has translated into large liquidity and credit spreads for emerging market debt, although there are important differences across countries (see chart A1).
This reassessment of emerging market risk has translated into high spreads
1 Notable is the growing trend among investors
of financing investments on margin and short position taking financed by bank borrowing on margins. With leveraged positions on emerging market assets, margin calls in response to change in market value of these assets leads to selling or unwinding of positions in a broad range of assets to meet these margins.
for Indonesian benchmark bond issues. These spreads widened sharply in 1997 and again in 1998, reaching a peak of over 1400 basis points in October 1998. Spreads have trended down since then, but remain stubbornly high. At end March, 2000, they were around 500 basis points or over three times their pre-Asia crisis levels. By contrast, spreads on benchmark issues from China, Malaysia and Thailand have edged much closer to the pre-Asian crisis levels. Country rating. Indonesia�s credit rating has been on a downward slide. Major credit rating agencies such as Moody�s and Standard & Poor�s have successively downgraded the country�s foreign currency rating beginning in October 1997 (see table A5). The downgrades to non-investment grade or speculative category imply a perception of continuing vulnerabilities and indicate expected payment difficulties for the country.
Favorable developments including a Rupiah exchange rate which is fluctuating in a narrow band and falling interest rates, have only partially alleviated market concerns. Local factors that are particularly worrisome include a lack of progress on corporate debt restructurings and the implication of this for banks� balance sheets, continuing financial sector weaknesses, and the possibility that banks require further recapitalization support. In the near term, large repayment obligations, which are larger than reserves, continue to make the country vulnerable to roll-over or liquidity risk. Again, sensitivity to exchange rate and interest rate movements can add to an already high debt burden. While rescheduling of principal payments due to bilateral donors between August 8, 1998 and March 2000 provided much needed relief, further rescheduling is still needed.

20
Chart A1: Secondary Market Spreads on International Bonds
Source: Bloomberg. Note: Secondary market spreads vis-a-vis comparable US treasuries on sovereign liquid US$ denominated benchmark of medium term maturity.
0
200
400
600
800
1000
1200
1400
1600
Argentina
Brazil
0
200
400
600
800
1000
1200
1400
1600
IndonesiaChinaThailand
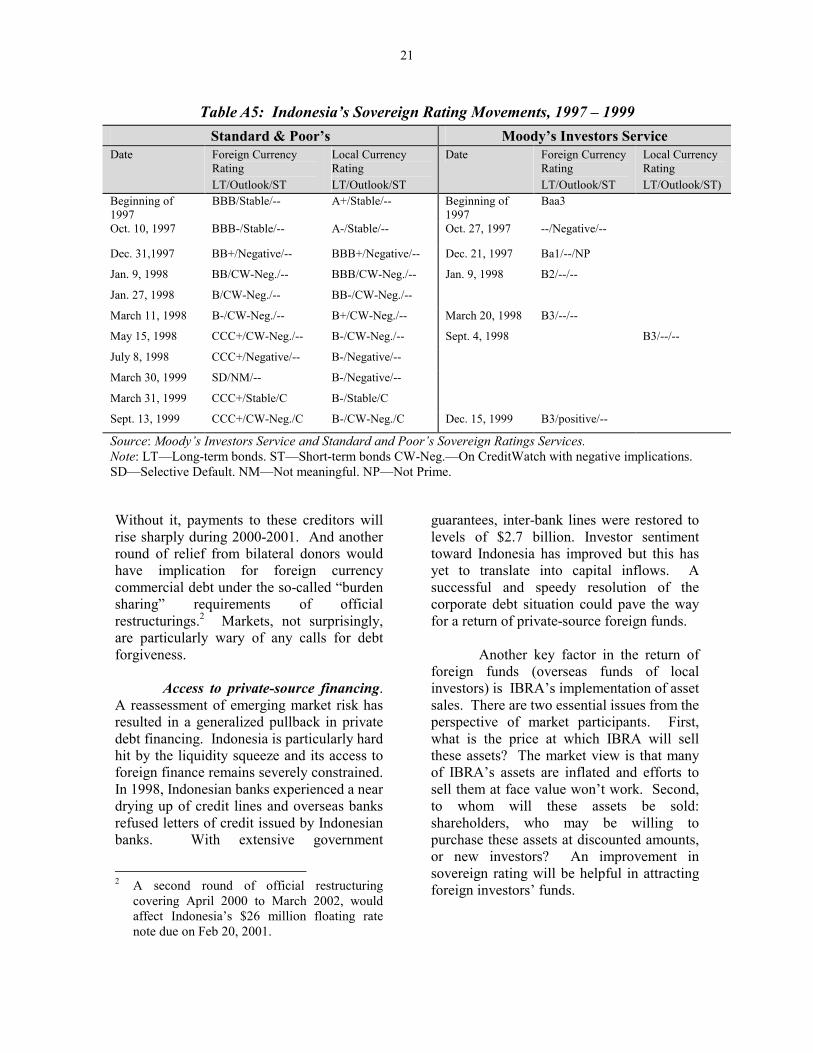
21
Table A5: Indonesia�s Sovereign Rating Movements, 1997 � 1999 Standard & Poor�s Moody�s Investors Service
Date Foreign Currency Rating LT/Outlook/ST
Local Currency Rating LT/Outlook/ST
Date Foreign Currency Rating LT/Outlook/ST
Local Currency Rating LT/Outlook/ST)
Beginning of 1997
BBB/Stable/-- A+/Stable/-- Beginning of 1997
Baa3
Oct. 10, 1997 BBB-/Stable/-- A-/Stable/-- Oct. 27, 1997 --/Negative/--
Dec. 31,1997 BB+/Negative/-- BBB+/Negative/-- Dec. 21, 1997 Ba1/--/NP
Jan. 9, 1998 BB/CW-Neg./-- BBB/CW-Neg./-- Jan. 9, 1998 B2/--/--
Jan. 27, 1998 B/CW-Neg./-- BB-/CW-Neg./--
March 11, 1998 B-/CW-Neg./-- B+/CW-Neg./-- March 20, 1998 B3/--/--
May 15, 1998 CCC+/CW-Neg./-- B-/CW-Neg./-- Sept. 4, 1998 B3/--/--
July 8, 1998 CCC+/Negative/-- B-/Negative/--
March 30, 1999 SD/NM/-- B-/Negative/--
March 31, 1999 CCC+/Stable/C B-/Stable/C
Sept. 13, 1999 CCC+/CW-Neg./C B-/CW-Neg./C Dec. 15, 1999 B3/positive/--
Source: Moody�s Investors Service and Standard and Poor�s Sovereign Ratings Services. Note: LT�Long-term bonds. ST�Short-term bonds CW-Neg.�On CreditWatch with negative implications. SD�Selective Default. NM�Not meaningful. NP�Not Prime. Without it, payments to these creditors will rise sharply during 2000-2001. And another round of relief from bilateral donors would have implication for foreign currency commercial debt under the so-called �burden sharing� requirements of official restructurings.2 Markets, not surprisingly, are particularly wary of any calls for debt forgiveness. Access to private-source financing. A reassessment of emerging market risk has resulted in a generalized pullback in private debt financing. Indonesia is particularly hard hit by the liquidity squeeze and its access to foreign finance remains severely constrained. In 1998, Indonesian banks experienced a near drying up of credit lines and overseas banks refused letters of credit issued by Indonesian banks. With extensive government
2 A second round of official restructuring
covering April 2000 to March 2002, would affect Indonesia�s $26 million floating rate note due on Feb 20, 2001.
guarantees, inter-bank lines were restored to levels of $2.7 billion. Investor sentiment toward Indonesia has improved but this has yet to translate into capital inflows. A successful and speedy resolution of the corporate debt situation could pave the way for a return of private-source foreign funds.
Another key factor in the return of foreign funds (overseas funds of local investors) is IBRA�s implementation of asset sales. There are two essential issues from the perspective of market participants. First, what is the price at which IBRA will sell these assets? The market view is that many of IBRA�s assets are inflated and efforts to sell them at face value won�t work. Second, to whom will these assets be sold: shareholders, who may be willing to purchase these assets at discounted amounts, or new investors? An improvement in sovereign rating will be helpful in attracting foreign investors� funds.

22
Annex 3. Established International Guidelines for Rescheduling Debt Service Payments
Rescheduling of bilateral debt is determined within the framework of the Paris Club Bilateral negotiation outside this forum is strongly discouraged by the Paris Club3 principles of �solidarity� and �comparability�. For each individual country, any rescheduling or reduction provided under the auspices of the Paris Club depends on the per capita income and debt level and debt service capacity of the debtor country. Rescheduling options for low-income countries are summarized in Box A1 below. Rescheduling options for lower middle income countries such as Indonesia are summarized in Box 3 of the main text.
3 Undertaking of an IMF program is a
prerequisite for debt treatment by the Paris Club.
In mid 1999, the World Bank reviewed and relaxed the criteria for debt relief under its Heavily Indebted Poor Country initiative (HIPC, see Box A2). To be eligible for HIPC a country now must (i) be IDA-only; (ii) face an unsustainable debt situation even after the full application of traditional debt relief mechanisms; and (iii) have established a track record of successfully implementing economic and social reforms. Indonesia does not satisfy the first two of these criteria. Furthermore, Indonesia is not internationally regarded as a HIPC country and, therefore, cannot be a candidate for the HIPC initiative.
Box A1. Debt Rescheduling Options for Low - Income Countries1
Debt service reduction Non-concession option providing longer maturities
Toronto London Naples Lyon Toronto London Naples Lyon Date introduced Oct 88 Dec 91 Jan 95 Dec 96 Oct 88 Dec 91 Jan 95 Dec 96 General Grace period (years) 8 - - 8 14 16 20 20 Maturity (years) 14 23 33 40 25 25 40 40 Repayment schedule flat -------- graduated -------- flat -------- graduated -------- Interest rate reduced reduced reduced reduced reduced reduced reduced reduced Reduction in NPV (%) 20-30 50 67 80 - - - - ODA Credits Grace period (years) 14 12 16 16 14 16 20 20 Maturity (years) 25 30 40 40 25 25 40 40 1/ Low income is defined by the World Bank as a per capita GNP of $761 or less.

23
Box A2. The HIPC Debt Reduction Initiative for IDA Countries
To be eligible for HIPC, a country must: (a) be IDA-only; (b) face an unsustainable debt situation even after the full application of traditional debt relief mechanisms; and (c) have established a track record of successfully implementing economic and social reforms. HIPC-eligible countries are required to undertake sustained improvements in their economic management, structural and social policy reform, including especially actions that will improve basic health care and education. A three-year performance period is required for a country to become eligible for a stock-of-debt operation by the Paris Club. A Debt Sustainability Analysis is undertaken to determine whether this Paris Club operation would be enough for the country to achieve debt sustainability after a further three years. Countries for which existing mechanisms would not achieve debt sustainability after this additional three years receive assistance under the HIPC Initiative sufficient to achieve debt sustainability at the end of this second three year period, provided they continue with of strong policy reform.1
A Debt Sustainability Analysis (DSA) would be prepared by the staff of the World Bank and the IMF, and where appropriate, other major regional development banks, together with officials of the debtor country. DSAs would use actual data on (i) a three-year backward-looking average of exports; (ii) the latest year central government revenues; and (iii) the six-monthly average of the commercial interest reference rates as currency-specific discount rates.
Sustainable debt levels are defined on a case-by-case basis within the range of 150 to 200 percent for the debt-to-exports ratio (on a Net Present Value (NPV) Basis) and 20 to 25 percent for the ratio of debt service to exports. Specific targets, within this range, are determined in the light of country-specific vulnerability factors, such as the concentration and variability of exports, and the fiscal indicators of the burden of debt service. For very open economies where the exclusive reliance on external indicators may not adequately reflect the fiscal burden of external debt: an NPV debt-to-export target below 200 percent at the completion point can be recommended, provided that the country concerned meets two criteria at the decision point: an export-to-GDP ratio of at least 40 percent and a minimum threshold of fiscal revenue in relation to GDP of 20 percent. For countries meeting these thresholds, the NPV debt-to-export target will be set at a level which achieves a 280 percent ratio of the NPV of debt-to-revenue at the completion point.

24
Annex 4. Contingent Liabilities and Fiscal Risks
The government�s financial position is exposed to a wide range of risks that affect the value of the government�s liabilities and assets as well as the size of its budget deficit. Risks facing government commonly include: (a) refinancing risk (short maturities or maturity bunching under restricted access to debt markets) emerging from the direct and guaranteed debt portfolio; (b) liquidity risk (risk of having to sell assets at loss) emerging from maturity mismatch between assets and liabilities and from rigidities in the government�s capacity to raise revenues and cut expenditures; (c) currency risk (exchange rate risk and cross-currency risk, exposure to short-term exchange rate volatility) arising from the currency structure of government debt and exchange rate guarantees, which is partly offset by the currency structure of foreign reserves and the current account flows; (d) interest rate risk (floating interest rate) in the direct and
guaranteed debt portfolio; (e) commodity price risk (e.g. swings in the price of oil and rice), which affects government contingent liabilities as well as its budgetary revenues and expenditures; (f) derivative risk (risk of large losses from the use of derivative instruments) facing the central bank as well as the government; (g) medium- and long-term sustainability risk, which includes issues of debt sustainability and expenditure sustainability (for instance, pension expenditures in an aging society); (h) political risk (risk of political weakness and of insufficient commitment to fiscal stability) affecting both the value of government liabilities and assets; and (i) operational risk (poor valuation and risk assessment, system errors, poor organizational structures, corruption and fraud) that may emerge in government debt management, in central bank reserve management, in the pursuit of asset sales and recovery, and in privatization.
Dealing with Contingent Liabilities and Other Fiscal Risks International evidence has confirmed that country fiscal performance can be ruined by the emergence of �hidden� fiscal risks, such as obligations facing the government outside its budget. Analyses of past increases in the stock of government debt have shown that governments often accumulate debt as a result of �hidden deficits� rather than reported budget deficits. Hidden deficits mainly arise from debt structure, as currency, maturity or interest rate risks materialize, and from off-budget government obligations, such as contingent liabilities that fall due. Consequently, narrow interests in reducing budget deficit may actually increase rather than reduce government exposure to fiscal risks, and deteriorate rather than improve the prospects of future fiscal performance.
Analysis of fiscal risks in a broad sense is important to assess fiscal vulnerability and debt sustainability over time. Reasons include increasing volumes and volatility of private capital flows, transformation of the state from financing of services to guaranteeing particular outcomes, and related to both of these, moral hazards in the markets, and fiscal opportunism of policy makers. Fiscal risks become particularly threatening in countries with a limited scope for maneuver in government financing. Limited access to debt market and inflexible exchange rate policy reduce the amount of fiscal risks that governments can take on without facing excessive fiscal risks.
Fiscal vulnerability is concerned in particular with the emergence of unexpected fiscal risks and policy challenges and with the government�s capacity to respond to them. Fiscal vulnerability takes into account: (a) the initial fiscal position (including the central government budget, other levels of government, extra-budgetary funds and quasi-fiscal activities, assets and liabilities, contingent liabilities, fiscal indicators), (b) sensitivity of the fiscal position to short-term risks, such as macroeconomic volatility, called contingent liabilities, and unclear expenditure commitments, (c) medium- and long-term fiscal sustainability (debt dynamics, baseline projection and stress testing, and long-term pressures from demographic trends, resource depletion, etc.), and (d) structural or institutional weaknesses (expenditure composition, revenue system, deficit financing, government access debt markets, institutional capacity for fiscal management).

25
Annex 5. Selected Case Examples of Debt Management
Box A3. Renegotiations of the 'Sukarno' Debt (1966-70)
During Sukarno's regime, Indonesia had incurred very large external debts due to profligate borrowing and unwise lending. The successor government, finding itself unable to meet contractual obligations on these debts, requested debt relief. The renegotiation process was complicated by the fact that more than half of Indonesia's total external public debt of $2.1 billion was owed to Eastern European creditors, particularly USSR for substantial military assistance. The debt negotiation with the western creditors' group was chaired first by a Japanese, and then by a French national, to which Indonesia's socialist creditors were invited but declined to attend. A protracted debt negotiation ensured within a Paris Club framework. The principal of the entire 'Sukarno' debt (including development credits on concessional terms, and amounts which had been renegotiated previously by the Paris Club), was consolidated for repayment in 30 equal installments at zero interest. Contractual interest and interest on earlier Paris Club rescheduling, was deferred until 1985 and to be paid thereafter in 15 equal installments, but with no additional interest applied to these deferments of interest payments (these arrangements were based on recommendations of Dr. Abs, a prominent German banker). In addition, the Paris Club permitted Indonesia, under a bisque clause arrangement similar to that contained in the Anglo-American Financial Agreement, to defer at its option up to one-half of the principal payments falling due during the early years of the new schedule. These deferred obligations were to be repaid with interest at 4 percent per annum during the final years of the agreement. The 'Sukarno' debt renegotiation was unprecedented because of its unusually generous terms, exceptionally large volume and the inclusion of all external public debt incurred prior to July 1st, 1966. It is also unprecedented in that socialist countries, which had refused to join the Paris Club negotiations, rescheduled their portion of the debt on essentially the same terms. In fact, Paris Club members assured themselves, and other developing countries, that Indonesian debt settlement of 1970 was generous in nature and that its repetition should not be expected.

26
Box A4. Argentina�s BONEX Plan (1989-90) Background: As the availability of external resources declined during the 1980s and fiscal adjustments were inadequate to offset this change, there was an increased recourse to domestic financing. In the case of Argentina, the ratio of domestic debt as a percentage of GDP rose from 7.4 percent in 1986:Q1 to 18.3 percent in 1989:Q2. Argentina went through three unsuccessful stabilization programs (Austral, Primavera and the BB) between 1984-89, each ending with large devaluation followed by sky-rocketing inflation.
Immediate Developments leading up to the BONEX Plan: During 1989, as the new debt sales fell short of the maturities falling due, there was increasing pressure on the central bank to accommodate the borrowing needs of the non-financial public sector. Bank reserve and investment requirements on deposits, and at a later stage frozen deposits, were used for this purpose. In addition, the central bank accelerated placement of CEDEPS (short-term debts). By midyear these instruments were financing interest payments on the central bank's own debt (the quasi-fiscal cost reached 30 percent of GDP during the same period). According to Fernandez (1991), the CEDEPS were being issued at such a high nominal interest rates that, most depositors knew that such a yield of nearly 15 percent monthly in US dollars can not last long and tried to capitalize on the gain by converting their local currency (austral) deposits to US dollars. The exchange rate depreciated by nearly 175 percent and inflation rose to 80 percent in December 1989 and the authorities tried to prevent capital flight by raising interest rate further. But that led to a rapid increase in central bank's interest-bearing debt stock. Surging interest rate and swelling debt made the BONEX conversion unavoidable. The BONEX plan was implemented on January 1, 1990.
The Measures: The central measure of the plan was the forced conversion of commercial bank time deposits and public sector debt coming due in 1990 for a dollar-denominated government security BONEX 89. Approximately 500,000 Argentinean pesos (Ap) of each account were exempted from conversion and were made available in cash and exemptions were extended to deposits of senior citizens, deposits used to pay taxes or wages. By IMF estimates, out of an outstanding stock of deposits of 4.6 trillion At the end of December 1989, only 2.1 trillion Ap was converted to BONEX. The bonds paid an interest equal to six months LIBOR plus a small spread and were paid in quarterly installments. This government decree however did not restrict the convertibility of local currency into foreign exchange.
Cost and Benefit: Initially, BONEX 89 traded at a discount of more than two-thirds, representing a substantial loss to its holders, mostly individuals and private sector companies. In addition, debt exchange operation also led to an initial decline in the price of dollar denominated bonds issued in previous years (the price of 1982 series fell from 80 percent to 50 percent of face value immediately after the debt exchange). The debt conversion scheme also created a portfolio imbalance for many banks as they received international interest rates on their external bond assets and paid domestic interest rates on their domestic liabilities. The government directly eliminated its domestic quasi-fiscal deficit through the debt conversion scheme, but ended up recapitalizing the banks through the provision of a special financial instruments (BIC bonds).
Evaluation: The BONEX plan reduced the fiscal cost of the government and led to extinction of roughly one half of the economy's broad liquidity stock (which later, favorably contributed in establishment of the currency board in April 1991), but it had many destabilizing consequences as well. It gave a profound blow to financial market confidence and a sharp reduction in commercial banks' solvency and profitability. Most importantly, it did not succeed in stopping the economy from moving into hyperinflation once again, as it did in February 1990. The economy began to turn around in March 1990 after announcement of substantial fiscal measures, tight monetary policy and ambitious plan of privatization and deregulation. In February 1991, there was a new run against the currency, which led to appointment of Domingo Cavallo as the economics minister and subsequent establishment of Currency Board and Convertibility plan in April 1991.

27
Box A5. Renegotiations of Peru's External Debt with Official Creditors (1969, 1978) The Peru debt renegotiations of 1969 were not carried out in a typical Paris Club framework but were conducted individually between Peru's government representatives and its creditors. The government of Peru also attempted to coordinate the rescheduling effort by convening creditor meetings in Lima and in Nov 1969 in Brussels. When European and Japanese creditors could not agree to uniform terms, bilateral settlements were further pursued. Through these various settlements, amortization payments due between 1968 and 1970 were sharply reduced by agreeing to higher interest payments on the outstanding amounts. In 1968, effective amortization was reduced from $151 million to $95 million, and in 1969 from $197 million to $127 million, with the deferred amounts falling due between 1970 and 1975. In 1970, German government agreed to reschedule 75% of the obligations to be paid in 16 years from 1972 with interest at 8.5%. The French government rescheduled 75% of the obligations to French nationals at 9%, to be repaid from 1972 to 1976, and the Belgian government rescheduled credits at 9%, to be repaid from 1972 to 1975. Spanish credits were privately rescheduled at 8% and deferred until 1972-76. During the Nov 1978 debt renegotiations meeting with Paris Club members, Peru's government proposed the rescheduling of 90% of the principal due to official creditors in 1979 and 1980, on terms similar to those that had been proposed earlier to bank creditors (see below). This proposal was accepted by Paris Club participants. The agreement covered all principal due on officially guaranteed commercial credits and loans from governments or government agencies, contracted prior to Jan 1st 1978, with an original maturity of more than one year. The amount consolidated was $211 million, equivalent to 90% of the outstanding total debt to public creditors. Payment of the remaining 10% and payment of all interest rate was to be made as originally scheduled. Principal payments falling due in 1979 were to be repaid in ten equal and successive semiannual installments. Payments falling due in 1980 were to be repaid in eight equal and successive semiannual installments. The grace period granted was 3 years, and the maturities (grace plus repayments periods) were extended to 71/2 and 6
1/2 years, respectively. The interest rates on the rearranged maturities were to be determined bilaterally between Peru and the individual creditor governments. A nondiscrimination clause was added to the arrangement to make sure discrimination among creditor categories would be avoided. The commercial bank rescheduling was agreed on, in basic terms, before the Paris Club meetings, but it was signed only after the agreement had been reached with the official creditors. The two agreements were, therefore, almost identical. An important difference, however, was that the consolidation interest rate on the bank debt floated over LIBOR, rather than being fixed and concessional.


