25
Confidential and Proprietary Information of Fluxtrol, Inc. Auburn Hills, MI Factors Influencing Inductor Cooling By Kevin Kreter 1
| Date post: | 20-Aug-2015 |
| Category: |
Documents |
| Upload: | fluxtrol-inc |
| View: | 3,392 times |
| Download: | 2 times |
Confidential and Proprietary Information of Fluxtrol, Inc. Auburn Hills, MI 1
Factors Influencing Inductor Cooling
By Kevin Kreter
Confidential and Proprietary Information of Fluxtrol, Inc. Auburn Hills, MI 2
• Factors influencing the cooling of an inductor are studied
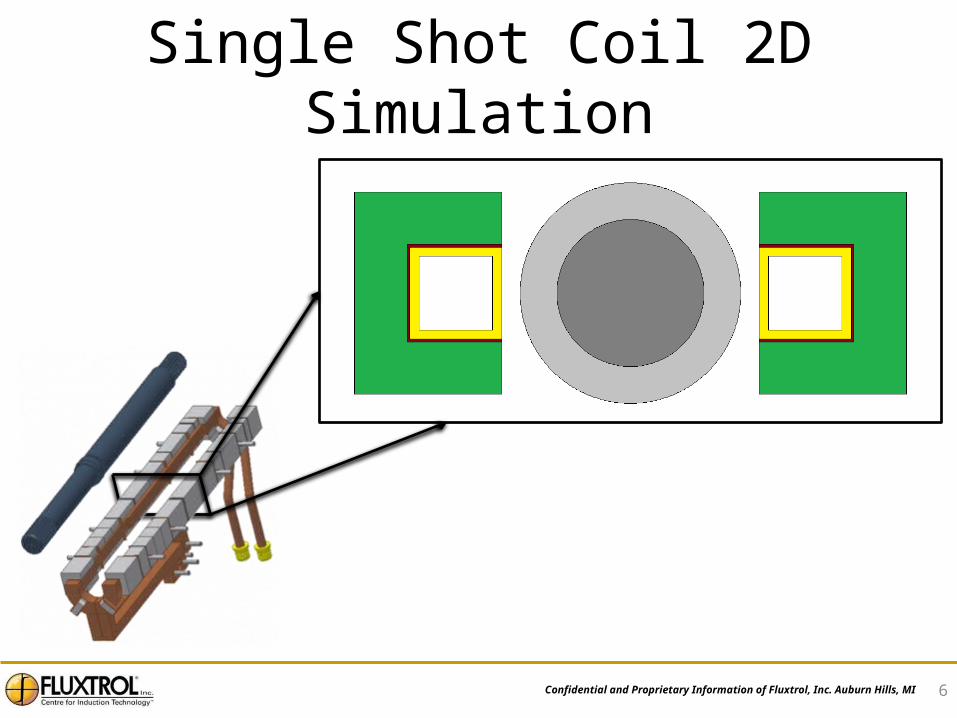
• Flux 2D coupling magnetic and thermal calculations is used to make 2D simulations of a single shot inductor
• The simulations are used to analyze the effect frequency, current, water pressure, and wall thickness have on the cooling of the inductor
Overview
Confidential and Proprietary Information of Fluxtrol, Inc. Auburn Hills, MI 3
• The results from simulation are used to investigate the following:– Effect of radiation from heated part– Cycling and reaching steady state– Effect of changing water pressure– Temperature distribution in coil– Influence of variables on coil losses
Overview
Confidential and Proprietary Information of Fluxtrol, Inc. Auburn Hills, MI 4
• Combinations of the following variables are used in the simulations– Frequency: 10 KHz, 3 kHz, 1 kHz– Current: 10,000 A, 7,500 A, 5,000 A– Water Pressure: 40 psi, 20 psi across inlet and outlet of
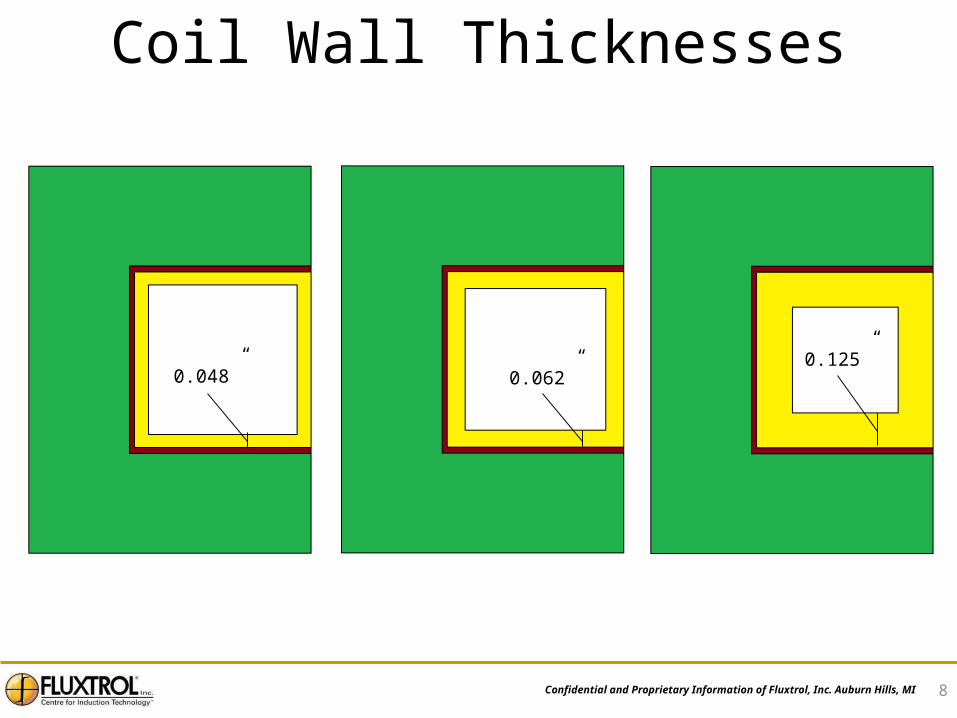
inductor leg– Wall Thickness: 0.125 in, 0.062 in, 0.048 in
• Heating lasts for 10 seconds
Variables
Confidential and Proprietary Information of Fluxtrol, Inc. Auburn Hills, MI 5
• The heat transfer coefficients used are calculated at a constant temperature when in reality they will change with temperature
• When the temperature of the inductor wall is 250°C or higher there is a risk of vapor layer formation on the inner wall– The heat transfer coefficient will drop dramatically leading
to a rapid rise in temperature– The results from these cases will be dropped from the
study
Assumptions
Confidential and Proprietary Information of Fluxtrol, Inc. Auburn Hills, MI 6
Single Shot Coil 2D Simulation

Confidential and Proprietary Information of Fluxtrol, Inc. Auburn Hills, MI 7
Dimensions and Materials
1/4”
5/8”
5/8”
1/8”1”
0.062”
0.02”0.355”
1 3/8”
1”
Fluxtrol A
1045 Steel (Above 800°C Non-Magnetic) Copper
1045 Steel
JB Weld
Confidential and Proprietary Information of Fluxtrol, Inc. Auburn Hills, MI 8
Coil Wall Thicknesses
0.062”0.048”0.125”
Confidential and Proprietary Information of Fluxtrol, Inc. Auburn Hills, MI 9
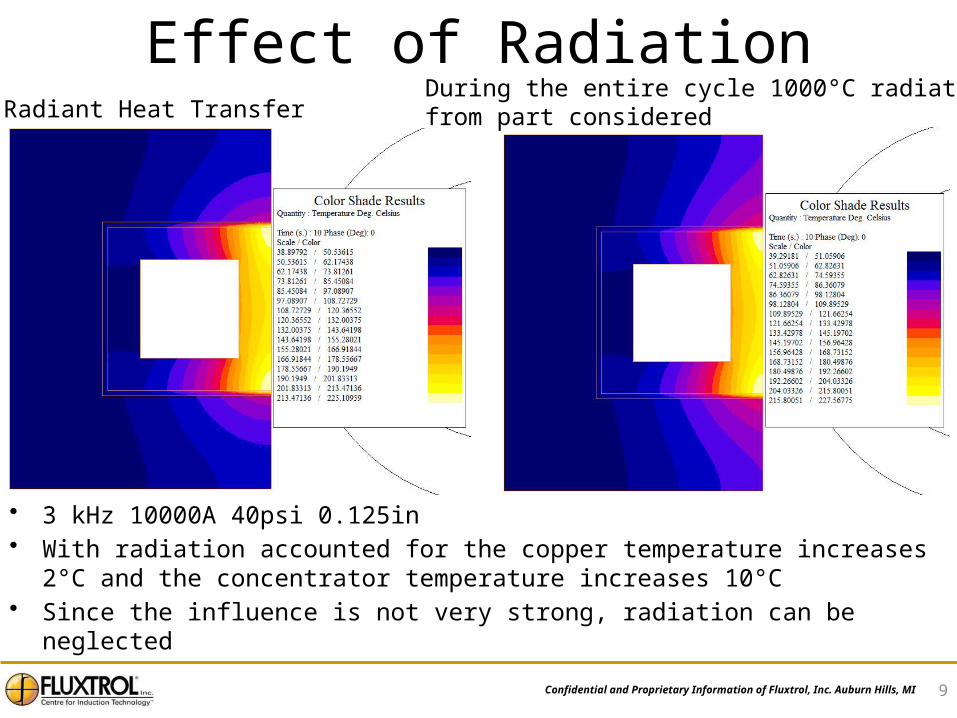
Effect of RadiationNo Radiant Heat Transfer
During the entire cycle 1000°C radiation from part considered
• 3 kHz 10000A 40psi 0.125in• With radiation accounted for the copper temperature increases 2°C and the
concentrator temperature increases 10°C• Since the influence is not very strong, radiation can be neglected
Confidential and Proprietary Information of Fluxtrol, Inc. Auburn Hills, MI 10
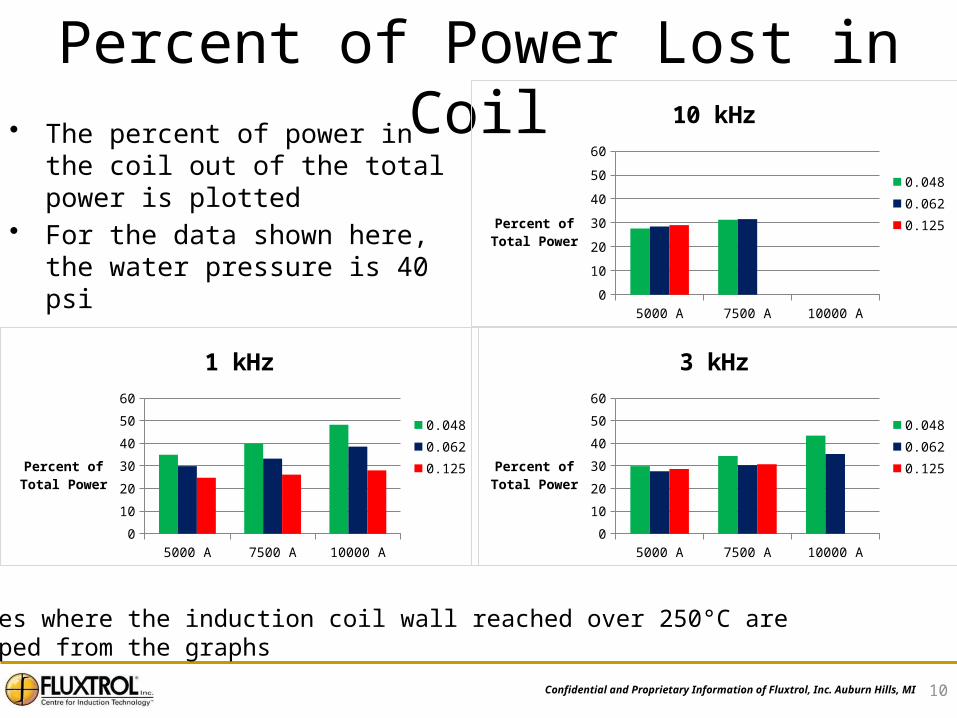
Percent of Power Lost in Coil• The percent of power in the coil
out of the total power is plotted• For the data shown here, the water
pressure is 40 psi
*Cases where the induction coil wall reached over 250°C are dropped from the graphs
5000 A 7500 A 10000 A0
10
20
30
40
50
60
10 kHz
0.048
0.062
0.125Percent of To-tal Power
5000 A 7500 A 10000 A0
10
20
30
40
50
60
1 kHz
0.048
0.062
0.125Percent of To-tal Power
5000 A 7500 A 10000 A0
10
20
30
40
50
60
3 kHz
0.048
0.062
0.125Percent of To-tal Power
Confidential and Proprietary Information of Fluxtrol, Inc. Auburn Hills, MI 11
• There are more coil losses as current increases, due to the copper having a higher resistivity at higher temperatures
• There is a correlation between the frequency and wall thickness with the coil losses. Losses are higher when the reference depth is less than the wall thickness
Coil Losses
Confidential and Proprietary Information of Fluxtrol, Inc. Auburn Hills, MI 12
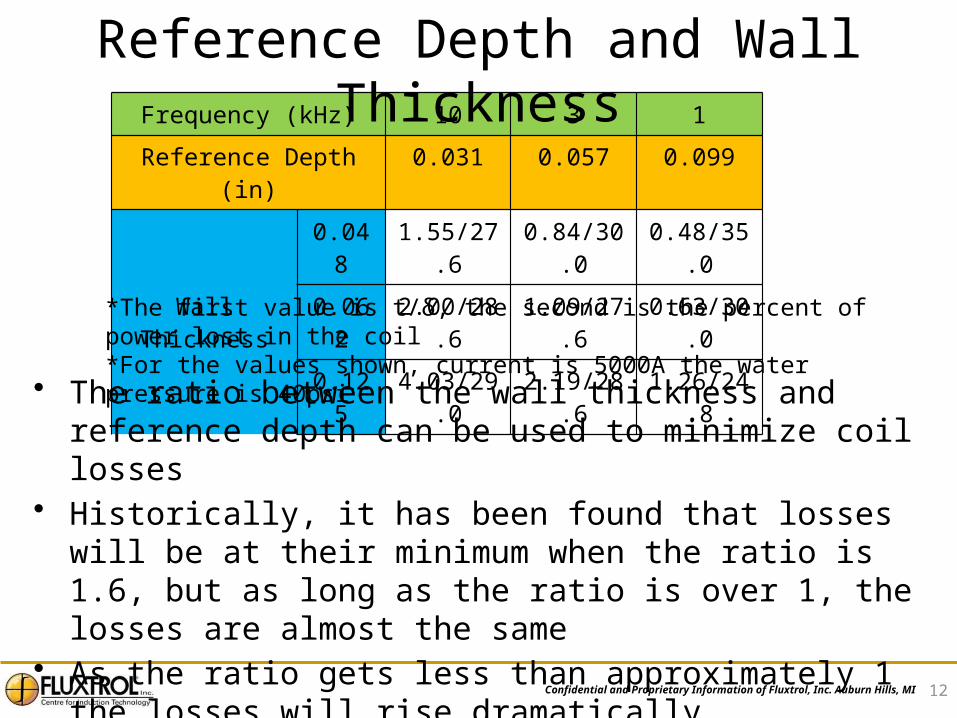
Frequency (kHz) 10 3 1
Reference Depth (in) 0.031 0.057 0.099
Wall Thickness
0.048 1.55/27.6 0.84/30.0 0.48/35.0
0.062 2.00/28.6 1.09/27.6 0.63/30.0
0.125 4.03/29.0 2.19/28.6 1.26/24.8
Reference Depth and Wall Thickness
• The ratio between the wall thickness and reference depth can be used to minimize coil losses
• Historically, it has been found that losses will be at their minimum when the ratio is 1.6, but as long as the ratio is over 1, the losses are almost the same
• As the ratio gets less than approximately 1 the losses will rise dramatically
*The first value is t/δ, the second is the percent of power lost in the coil*For the values shown, current is 5000A the water pressure is 40psi
Confidential and Proprietary Information of Fluxtrol, Inc. Auburn Hills, MI 13
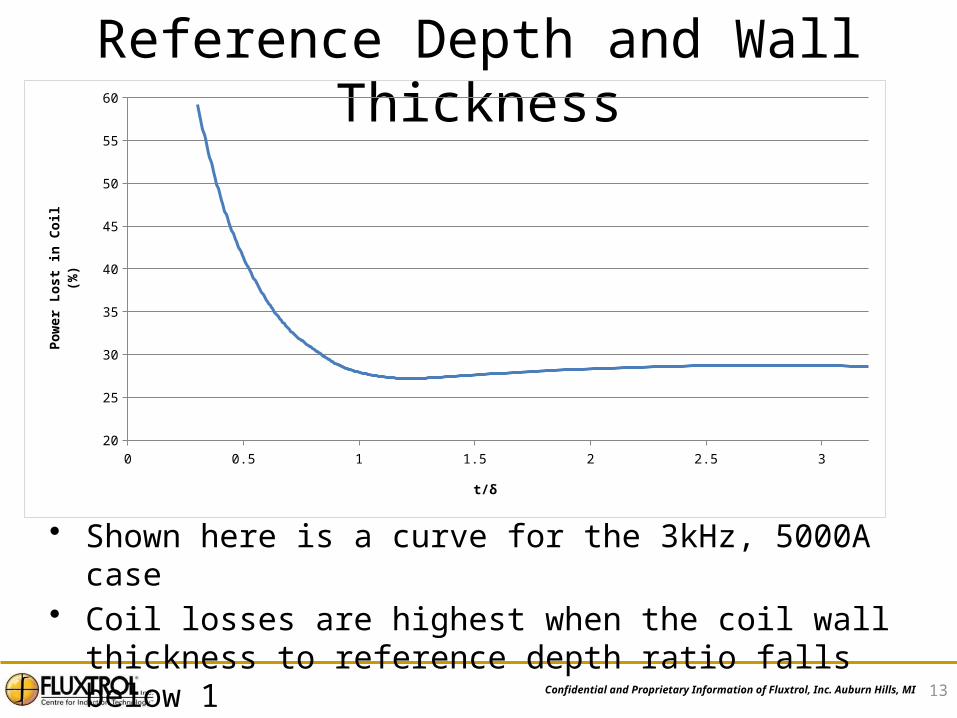
• Shown here is a curve for the 3kHz, 5000A case• Coil losses are highest when the coil wall thickness to
reference depth ratio falls below 1
Reference Depth and Wall Thickness
0 0.5 1 1.5 2 2.5 320
25
30
35
40
45
50
55
60
t/δ
Pow
er Lo
st in
Coi
l(%
)

Confidential and Proprietary Information of Fluxtrol, Inc. Auburn Hills, MI 14
Power Density in Coil
1kHz, 7,500A, 20psi 0.048 (t/δ = 0.48) 0.062 (t/δ = 0.63) 0.125 (t/δ = 1.26)
3kHz, 7,500A, 20psi 0.048 (t/δ = 0.84) 0.062 (t/δ = 1.09) 0.125 (t/δ = 2.19)

Confidential and Proprietary Information of Fluxtrol, Inc. Auburn Hills, MI 15
Corner and Center Temperature Difference• The percent difference between the
temperature of the corner and center of the copper tubing is plotted
• A positive difference correlates to the corner being hotter
• For the data shown here, the water pressure is 40 psi
*Cases where the induction coil wall reached over 250°C are dropped from the graphs
5000 A 7500 A 10000 A
-20
-15
-10
-5
0
5
10
15
20
0.048
10 kHz
3 kHz
1 kHzPercent Dif-ference
5000 A 7500 A 10000 A
-20
-15
-10
-5
0
5
10
15
20
0.062
10 kHz
3 kHz
1 kHzPercent Dif-ference 5000 A 7500 A 10000 A
-20
-15
-10
-5
0
5
10
15
20
0.125
10 kHz
3 kHz
1 kHzPercent Dif-ference

Confidential and Proprietary Information of Fluxtrol, Inc. Auburn Hills, MI 16
Corner and Center Temperature Difference
10 kHz7500 A40 psi0.125 in
1 kHz7500 A40 psi0.048 in
t/δ = 0.48 t/δ = 4.03
• The reference depth is shown to influence the thermal profile in the coil
• As shown here, when the wall thickness to reference depth ratio is small the temperature is higher in the center, but when the ratio is large it is higher in the corners.

Confidential and Proprietary Information of Fluxtrol, Inc. Auburn Hills, MI 17
Effect of Water Pressure• The percent decrease in temperature
when water pressure across the leg of the inductor is dropped from 40 psi to 20 psi is plotted
• The temperature of the center of the copper tubing is analyzed here
*Cases where the induction coil wall reached over 250°C are dropped from the graphs
5000 A 7500 A 10000 A05
101520253035404550
10 kHz
0.125
0.062
0.048Decrease in Temperature
5000 A 7500 A 10000 A05
101520253035404550
3 kHz
0.125
0.062
0.048Decrease in Temperature
5000 A 7500 A 10000 A05
101520253035404550
1 kHz
0.125
0.062
0.048Decrease in Temperature
Confidential and Proprietary Information of Fluxtrol, Inc. Auburn Hills, MI 18
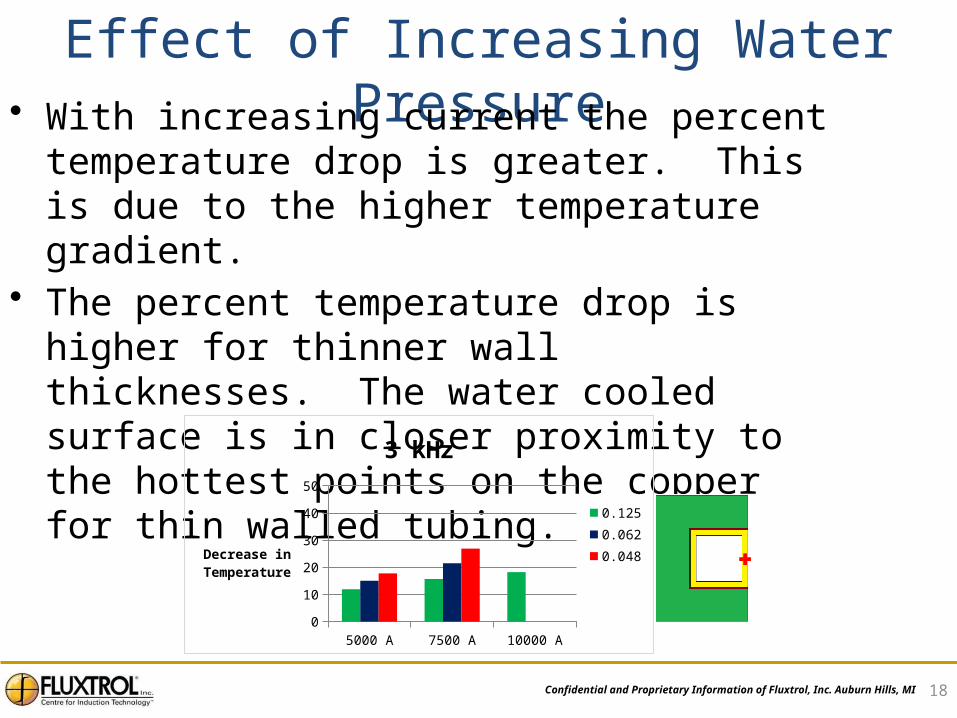
Effect of Increasing Water Pressure• With increasing current the percent temperature
drop is greater. This is due to the higher temperature gradient.
• The percent temperature drop is higher for thinner wall thicknesses. The water cooled surface is in closer proximity to the hottest points on the copper for thin walled tubing.
5000 A 7500 A 10000 A0
10
20
30
40
50
3 kHz
0.125
0.062
0.048Decrease in Temperature
Confidential and Proprietary Information of Fluxtrol, Inc. Auburn Hills, MI 19
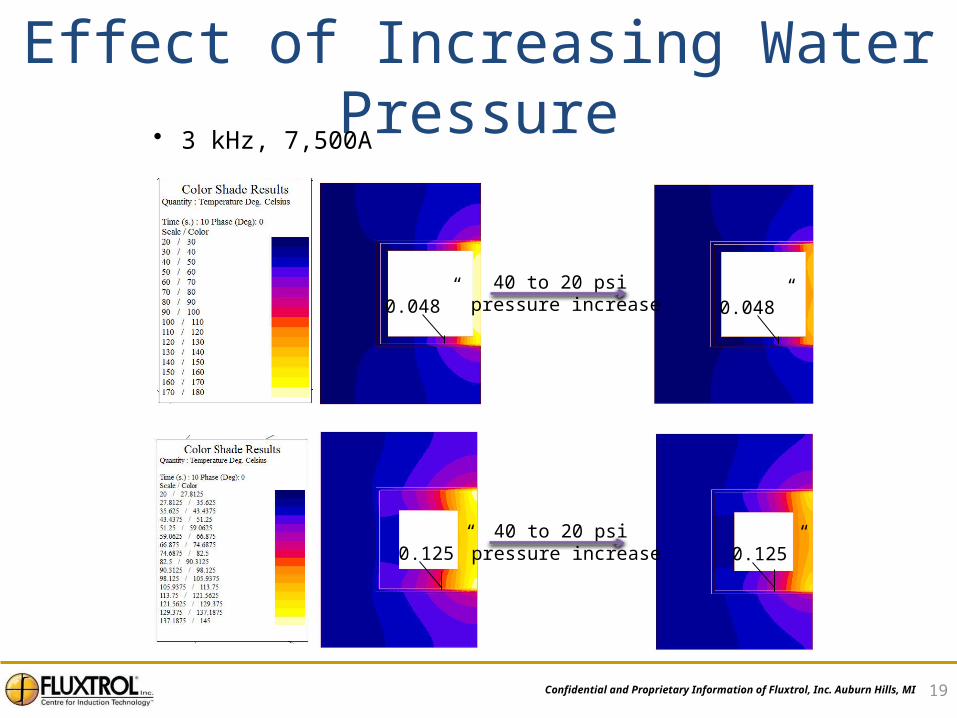
40 to 20 psi pressure increase
40 to 20 psi pressure increase
Effect of Increasing Water Pressure
0.048” 0.048”
0.125”0.125”
• 3 kHz, 7,500A

Confidential and Proprietary Information of Fluxtrol, Inc. Auburn Hills, MI 20
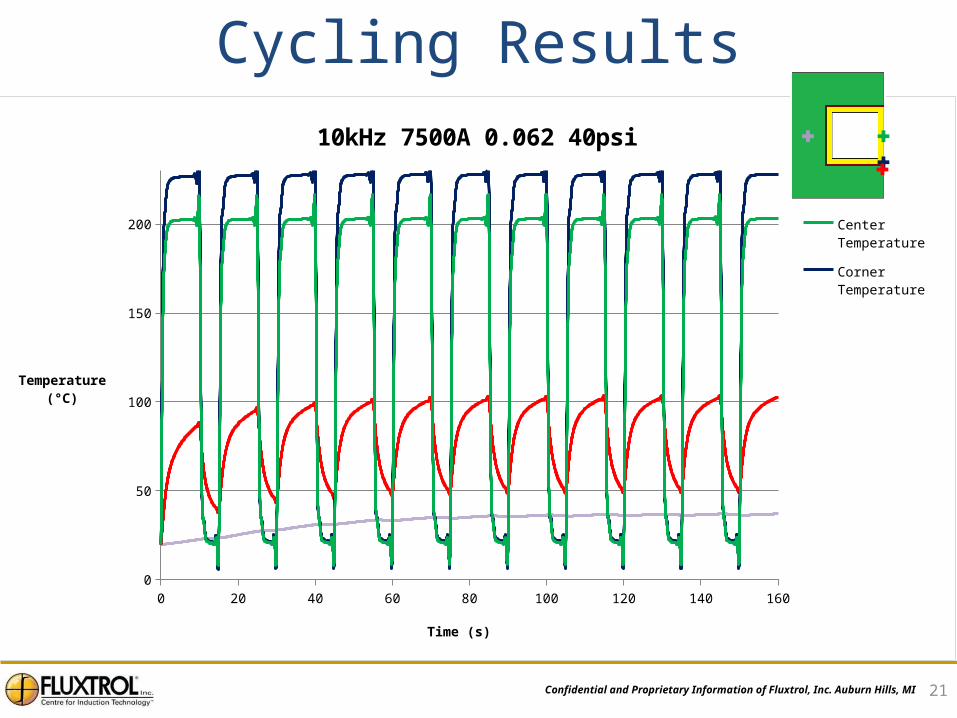
• A cycling process is modeled with intervals of 10 seconds of heating following by 5 seconds with no current
• Analyses of different points on the inductor are done to determine if and when a steady state is reached
Cycling
Confidential and Proprietary Information of Fluxtrol, Inc. Auburn Hills, MI 21
Cycling Results
0 20 40 60 80 100 120 140 1600
50
100
150
200
10kHz 7500A 0.062 40psi
Center Temperature
Corner Temperature
Concentrator Corner
Concentrator Backside
Time (s)
Temperature(°C)

Confidential and Proprietary Information of Fluxtrol, Inc. Auburn Hills, MI 22
Thermal Profile During Cycling
10 s 25 s 40 s 55 s
70 s 85 s 100 s 115 s
10kHz, 7,500A40psi, 0.062

Confidential and Proprietary Information of Fluxtrol, Inc. Auburn Hills, MI 23
• The copper reaches steady state after the first cycle, since it has a high thermal conductivity and is in contact with the cooling source
• The corner of the concentrator closest to the copper reaches steady state after 4-5 cycles. The Layer of epoxy causes it to reach a much lower temperature than the corner of the copper tube adjacent to it.
• The backside of the concentrator is slow to reach steady state, but the fact that it did within a reasonable amount of time shows that the whole inductor reaches a steady state during continuous cycling
Cycling Results

Confidential and Proprietary Information of Fluxtrol, Inc. Auburn Hills, MI 24
• Heat loss from radiation has little effect compared to the heat generated from coil losses in single shot coils
• Coil losses are higher when the reference depth is greater than the wall thickness
• Coil losses are higher when the temperature of the copper is greater, since the resistivity of copper increases with temperature
Conclusions

Confidential and Proprietary Information of Fluxtrol, Inc. Auburn Hills, MI 25
• When the reference depth is greater than the wall thickness, the temperature tends to be higher in the center of the tubing, and vice versa
• Thin walled tubing cools more efficiently and has a higher response to an increase in water pressure
• During cycling the copper tubing reaches steady state immediately, while the concentrator is slow to reach it on the backside.
Conclusions Continued


