34
1

1

INDUS RIVER SYSTEM AUTHORITY(IRSA)
“Water Resource Development in Pakistan”
2
Rao Irshad Ali KhanChairman IRSAMarch 09, 2011
Roundtable Discussion on Agriculture& Water in Pakistan – World Bank
Sequence of Presentation
Water Scenario 1947-60
Indus River System
Water Accord 1991 & Development of Water
Resources
Storage Position & World Average
Issues
Way Forward
4
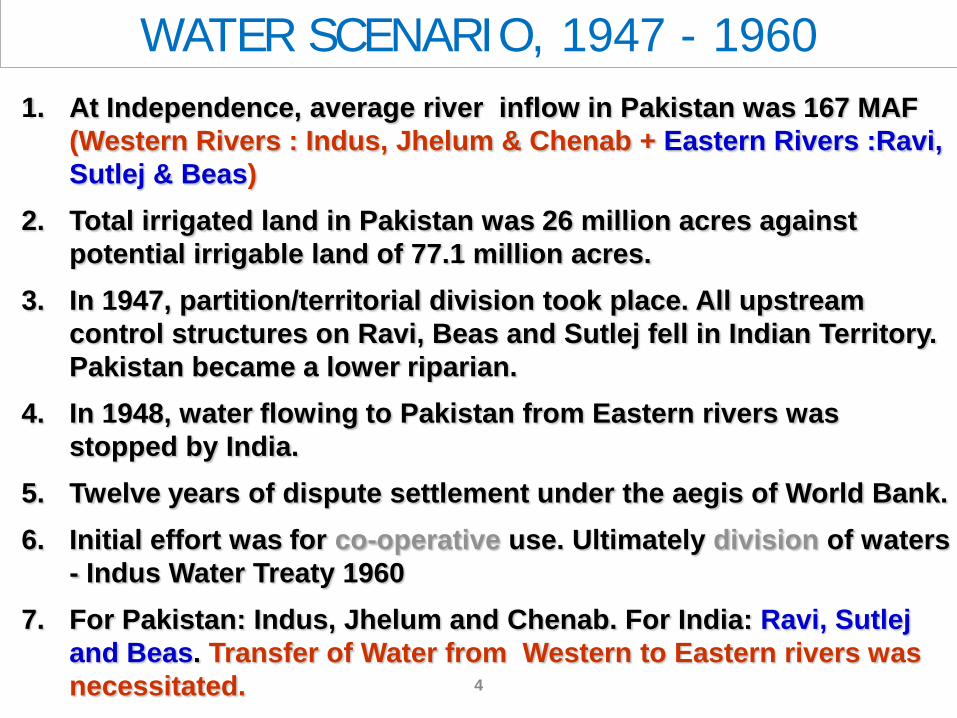
WATER SCENARIO, 1947 - 19601. At Independence, average river inflow in Pakistan was 167 MAF
(Western Rivers : Indus, Jhelum & Chenab + Eastern Rivers :Ravi, Sutlej & Beas)
2. Total irrigated land in Pakistan was 26 million acres against potential irrigable land of 77.1 million acres.
3. In 1947, partition/territorial division took place. All upstream control structures on Ravi, Beas and Sutlej fell in Indian Territory. Pakistan became a lower riparian.
4. In 1948, water flowing to Pakistan from Eastern rivers was stopped by India.
5. Twelve years of dispute settlement under the aegis of World Bank. 6. Initial effort was for co-operative use. Ultimately division of waters
- Indus Water Treaty 19607. For Pakistan: Indus, Jhelum and Chenab. For India: Ravi, Sutlej
and Beas. Transfer of Water from Western to Eastern rivers was necessitated.

The Water Agreements
Indus Waters Treaty 1960
Water Apportionment Accord 1991

6
RIVERS OF PAKISTAN INDUSJHELUM
CHENAB
RAVISUTLEJ
BEAS
WESTERN RIVERS
EASTERN RIVERS
IRAN
Indus Basin

SALIENT POINTS REGARDING WATER RIGHTS
UNDER INDUS WATERS TREATY
Eastern RiversAll the water of the Eastern Rivers to be available for the unrestricted use ofIndia, except Domestic, Non-consumptive use or Agriculture use as specifiedin IWT-1960
Western Rivers1. Pakistan shall receive for unrestricted use all waters of western rivers
2. India shall not interfere with the waters of western rivers except forfollowing uses:(A) Domestic use(B) Non-consumptive use(C) Agricultural use (limited)(D) Generation of hydro-electric power (Run of River)(E) Storage works (limited)
6

8
INDUS BASIN REPLACEMENT WORKS
Link Canals (9 No) Barrages (6 No) Storage (3 No)
Trimmu-Sidhnai Sidhnai on Ravi Mangla
Sidhnai-Mailsi Mailsi Siphon on Sutlej Chashma
Mailsi-Bahawal Qadirabad on Chenab Tarbela
Rasul-Qadirabad Rasul on Jhelum
Qadirabad-Balloki Chashma on Indus
L.C.C Feeder Marala on Chenab
Balloki-Sulemanki-IIChashma-Jhelum
Taunsa-Panjnad

9
Rim Stations:Indus @ TarbelaKabul @ NowsheraJhelum @ ManglaChenab @ Marala
Tarbela
ManglaKabul
Indus
JhelumChenab
Ravi Sutlej
ChashmaC-J
T-P
9
Sindh Barrages
Legend
Punjab Barrages
Balochistan Canals
NWFP CRBC
Reservoirs
Major Rivers

10
Development Features ofWater Accord 1991

11
Para 6
The need for storages, whereverfeasible on the Indus and other riverswas admitted and recognised by theparticipants for planned futureagricultural development.
12
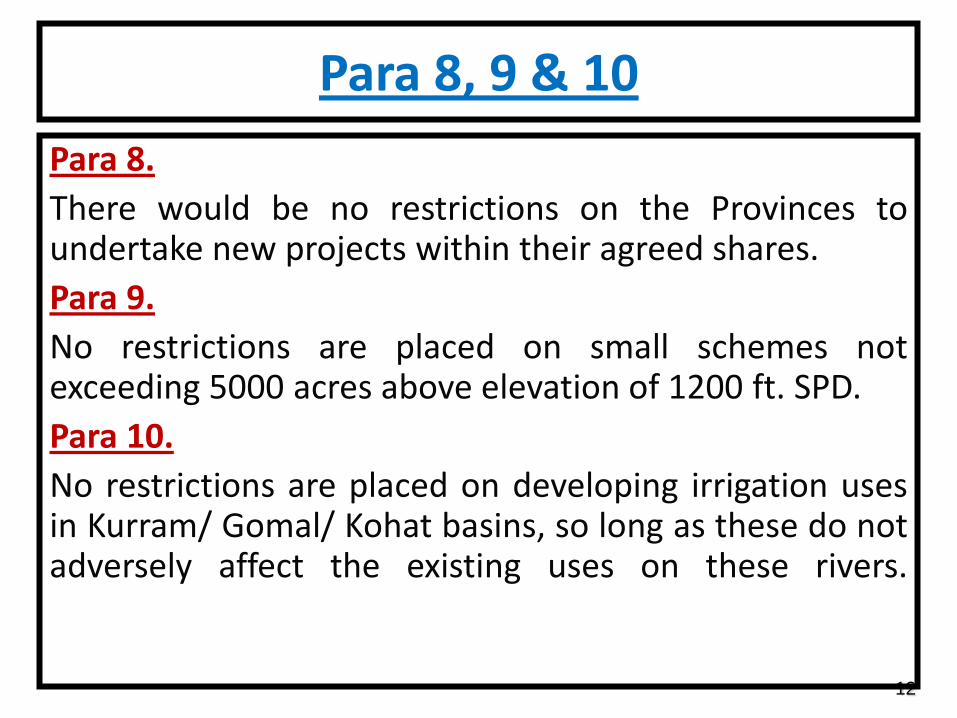
Para 8, 9 & 10
Para 8.There would be no restrictions on the Provinces toundertake new projects within their agreed shares.Para 9.No restrictions are placed on small schemes notexceeding 5000 acres above elevation of 1200 ft. SPD.Para 10.No restrictions are placed on developing irrigation usesin Kurram/ Gomal/ Kohat basins, so long as these do notadversely affect the existing uses on these rivers.

Importance of Water Resources For National Economy and Poverty Alleviation
93 % of water is used for Agriculture
64 % of population depends on agriculture
Agriculture contributes to GDP equivalent to 23 % (US$ 25
Billion annually)
Responsible to 60 to 70 % exports
Critical input for agriculture to meet food and fiber
requirements, drinking water, sanitation, industry,
environment etc.

Western & Eastern Inflows & D/S KotriPost Tarbela Average (1976.77 to 2009.10)
(MAF)
Max Min Avg *2010-11
Western River
Indus @ Kalabagh 112.18 66.81 89.71 104.80
Jhelum + Chenab 59.92 30.75 48.68 51.61
Total 172.10 97.56 138.39 155.41
Eastern River
Ravi @ Balloki 10.95 0.29 4.23 0.53
Sutlej @ Sulemanki 8.57 0.01 2.59 0.25
Total 19.52 0.30 6.82 0.78
Total Western & Eastern River 191.62 97.86 145.21 156.19
D/S Kotri 91.86 0.29 30.67 54.50
* Tentative Data for Rabi 10-11 (Mar 01 to Mar 31)

15
69.08
30.39
80.59
29.81
20.10
33.79
9.68
45.91
29.55
10.98
26.90
17.53
52.86
17.22
42.34
53.29
81.49
29.11
91.83
62.76
45.40
20.79
35.15
8.83
0.771.932.37
20.18
0.29
24.4021.78
15.82
5.384.07
51.28
0
20
40
60
80
100
1976
-77
1977
-78
1978
-79
1979
-80
1980
-81
1981
-82
1982
-83
1983
-84
1984
-85
1985
-86
1986
-87
1987
-88
1988
-89
1989
-90
1990
-91
1991
-92
1992
-93
1993
-94
1994
-95
1995
-96
1996
-97
1997
-98
1998
-99
1999
-200
0
2000
-01
2001
-02
2002
-03
2003
-04
2004
-05
2005
-06
2006
-07
2007
-08
2008
-09
2009
-10
2010
-11
AN
NU
AL
DIS
CH
AR
GE
(MA
F)
YEARS
AVG. (35.2)1976-2003
ESCAPAGE BELOW KOTRIHYDROLOGICAL YEAR FROM APRIL TO MARCH
Note: Based on data supplied by I&P Deptt: Govt. of Sindh
31.25 MAF (1976-2010)

16
Present Storage Position

17
Provincial Canal Head Wdls(Post Independence to to-date)
Year Canal Withdrawals (MAF)
1947 69.1
1960-66 (Pre-Mangla) 89.14
1967-76 (Post-Mangla) 93.45
1977-82 (Post-Tarbela) 102.73
1990-1999 107.0
2000-2009 93.5
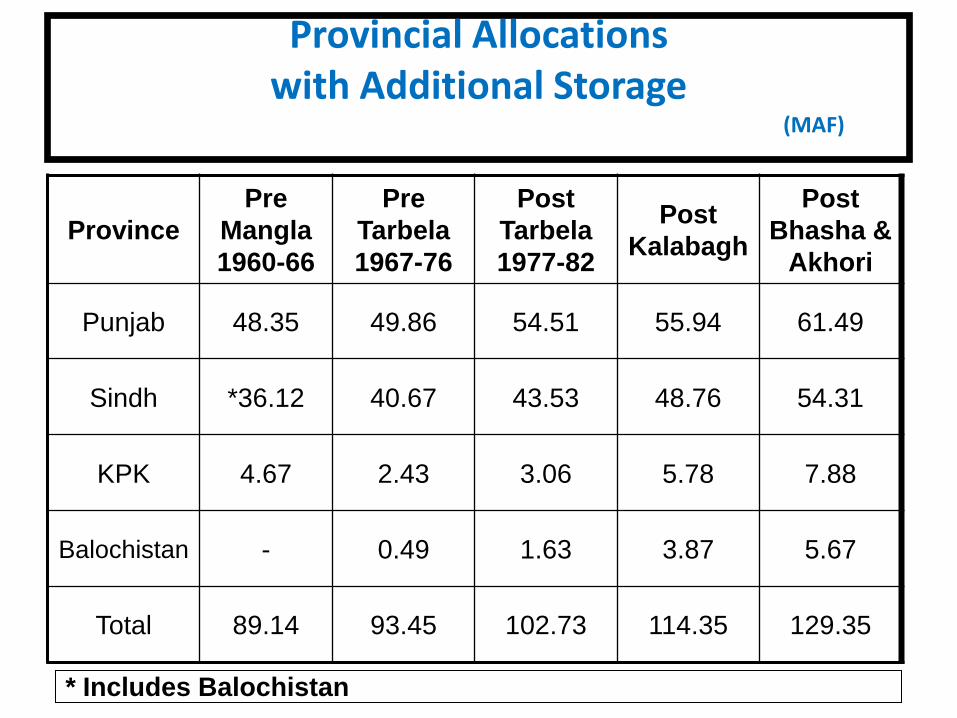
Provincial Allocationswith Additional Storage
(MAF)
ProvincePre
Mangla 1960-66
Pre Tarbela1967-76
Post Tarbela1977-82
Post Kalabagh
Post Bhasha &
Akhori
Punjab 48.35 49.86 54.51 55.94 61.49
Sindh *36.12 40.67 43.53 48.76 54.31
KPK 4.67 2.43 3.06 5.78 7.88
Balochistan - 0.49 1.63 3.87 5.67
Total 89.14 93.45 102.73 114.35 129.35
* Includes Balochistan
19
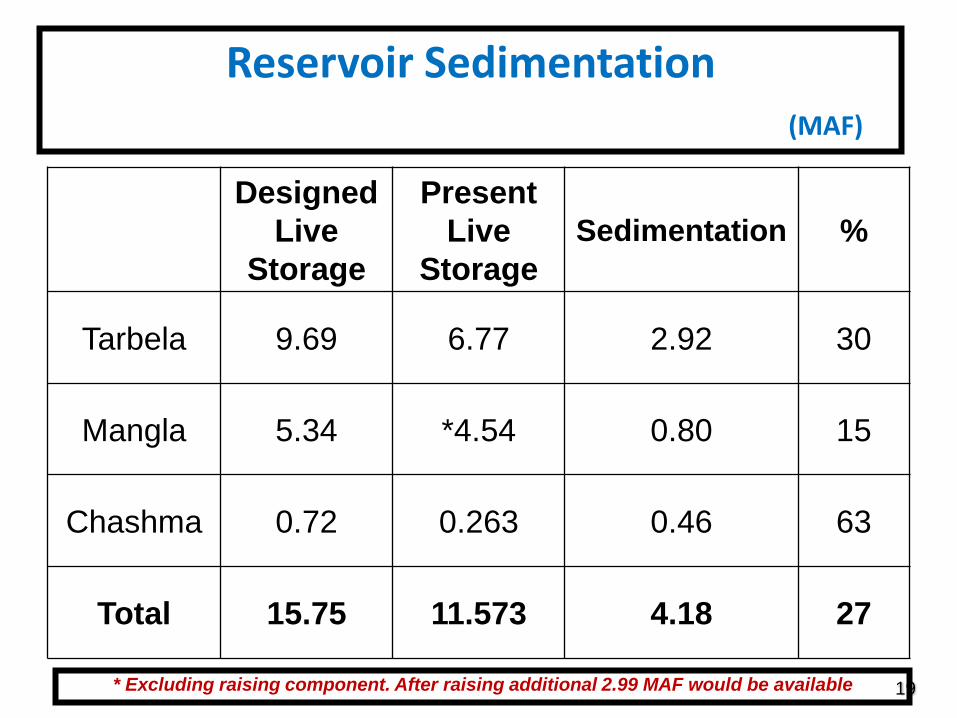
Reservoir Sedimentation(MAF)
Designed Live
Storage
Present Live
StorageSedimentation %
Tarbela 9.69 6.77 2.92 30
Mangla 5.34 *4.54 0.80 15
Chashma 0.72 0.263 0.46 63
Total 15.75 11.573 4.18 27
* Excluding raising component. After raising additional 2.99 MAF would be available
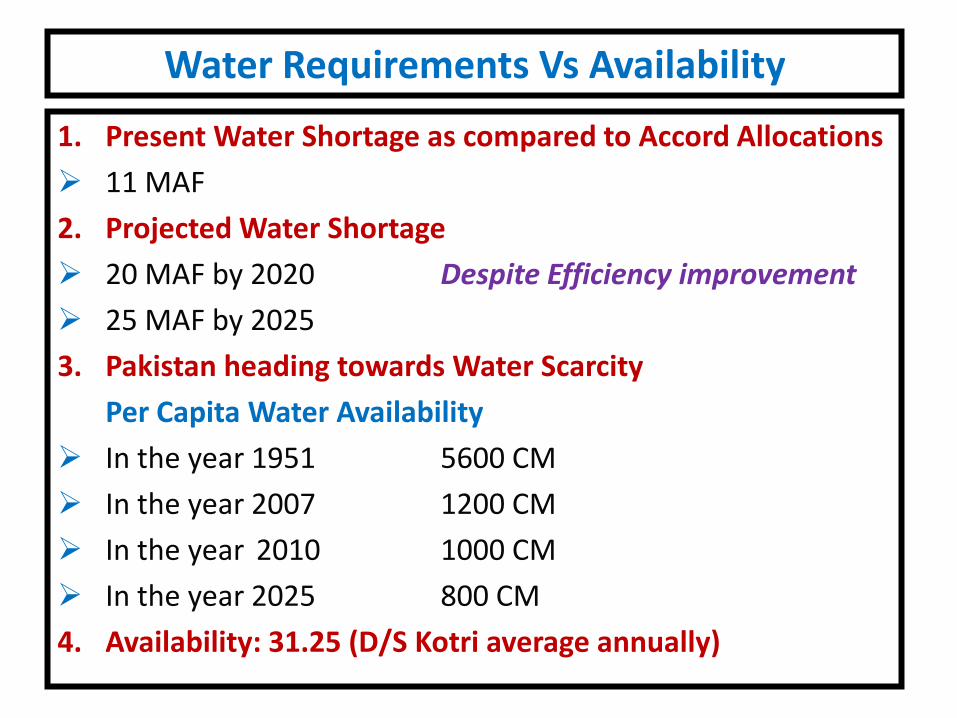
Water Requirements Vs Availability
1. Present Water Shortage as compared to Accord Allocations
11 MAF
2. Projected Water Shortage
20 MAF by 2020 Despite Efficiency improvement
25 MAF by 2025
3. Pakistan heading towards Water Scarcity
Per Capita Water Availability
In the year 1951 5600 CM
In the year 2007 1200 CM
In the year 2010 1000 CM
In the year 2025 800 CM
4. Availability: 31.25 (D/S Kotri average annually)
21
ARABIAN SEA
DISPUTED
TERRITORY
LEGENDMOUNTAINS
DESERTS
AREA UNDERIRRIGATION
AREA THATCAN BE BROUGHTUNDER IRRIGATION
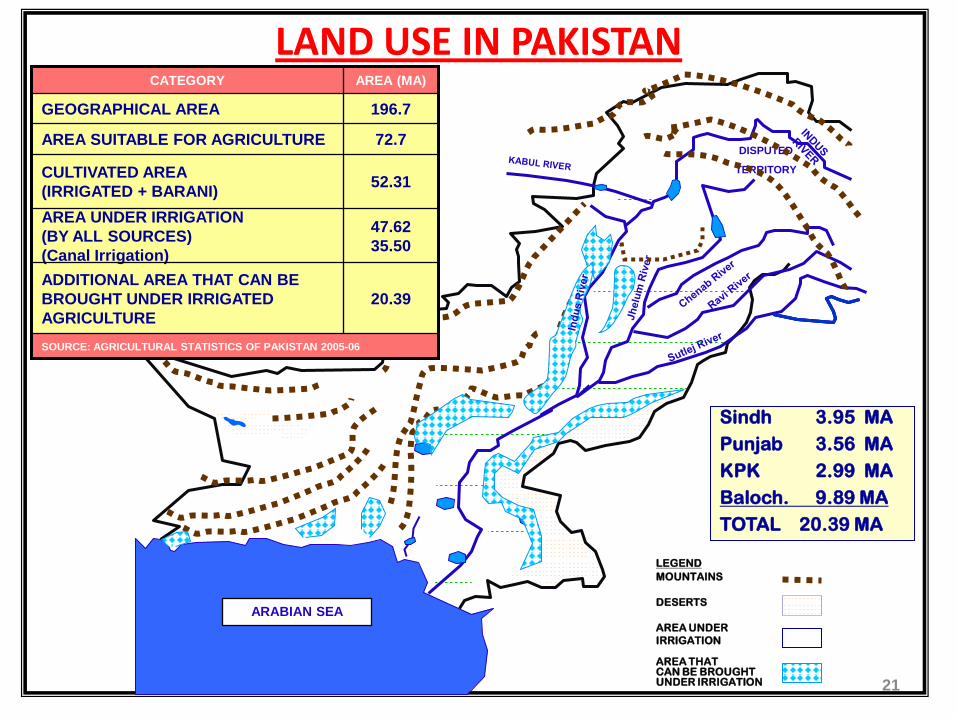
SOURCE: AGRICULTURAL STATISTICS OF PAKISTAN 2005-06
20.39ADDITIONAL AREA THAT CAN BE BROUGHT UNDER IRRIGATED AGRICULTURE
47.6235.50
AREA UNDER IRRIGATION(BY ALL SOURCES)(Canal Irrigation)
52.31CULTIVATED AREA(IRRIGATED + BARANI)
72.7AREA SUITABLE FOR AGRICULTURE
196.7GEOGRAPHICAL AREA
AREA (MA)CATEGORY
LAND USE IN PAKISTAN
Sindh 3.95 MAPunjab 3.56 MAKPK 2.99 MABaloch. 9.89 MATOTAL 20.39 MA

22
World Average

23
Sr. # River BasinAverage Annual
flow (MAF)No. of Dams
Storage Capacity
(MAF)
% age Storage
1 Colorado 12 3 59.62 497
2 Nile 47 1 132 281
3Sutlej BiasIndia (Total)
32750
54,636
11.32245
3533
4 Yellow River 345 7 68.95 20
5 Columbia 179 3 34 19
6 Indus & others Rivers 145 3
11.50*14.40
810
7 World 20,000 - 8,000 40
* After Raising of Mangla
AVERAGE ANNUAL FLOW AND STORAGE CAPACITY OF DAMS OF SOME MAJOR RIVER BASINS
Source: Wapda

24
Carry over Capacity
• Egypt (Aswan) 1,000 days (Niles)• America 900 days (Colorado)• Australia 600 days• South Africa 500 days (Orange River)• India 120 to 220 days• Pakistan 30 days

REGION WISE STORAGE STATUS IN INDIA-2010
Filling position w.r.t. storage at FRL Over all storage
Region (Status) (nos. of
Reservoirs)100% 91%-
99%81%-90%
71%-80%
61%-70%
51%-60%
41%-50%
40% & Below
Average Filling of
Reservoirs52 %
In 2010 Filled by 72 %
North (6 Reservoirs)
- - - 2 1 1 - 2
East (15 Reservoirs)
- 2 1 3 1 1 2 5
West (19 Reservoirs)
3 6 1 2 1 2 1 3
Central (11 Reservoirs)
1 1 1 2 - 1 1 4
South (30 Reservoirs)
4 7 10 4 - 4 1 -
Status of 81 Reservoirs:- 8 16 13 13 3 9 5 14
Source: Central Water Commission India Report

26
Major Initiatives inWater Sector

Major Initiatives in Water Sector
27
ProjectCost (Rs: Billion)
Live Storage (MAF)
Power Generation
(MW)
Design Capacity
(CS)
Area Benefited
(MA)
Mangla Dam Raising 101 (R) 2.88 120 - -
Mirani Dam 5.811 0.152 - - 0.33
Sabakzai Dam 1.576 0.015 - - 0.007
Satpara Dam 2.090 0.053 15.8 - 0.016
Gomal Zam Dam 12.82 0.892 17.4 - 0.163
Rainee Canal 28.862 - - 5155 0.412
Kachhi Canal 31.204 - - 6000 0.713
Greater Thal Canal 30.467 - - 8500 1.530
Fed. Financed Prov: Lining of Irrig: Chnl:
45.978 - - - -
Fed: Financed Prov: Irrig: Sys: Rehabilitation / Modernization of chnl:
42.635 - - - -

28
PROPOSED DAMS ON INDUS
AKHORI DAM
SKARDU DAM
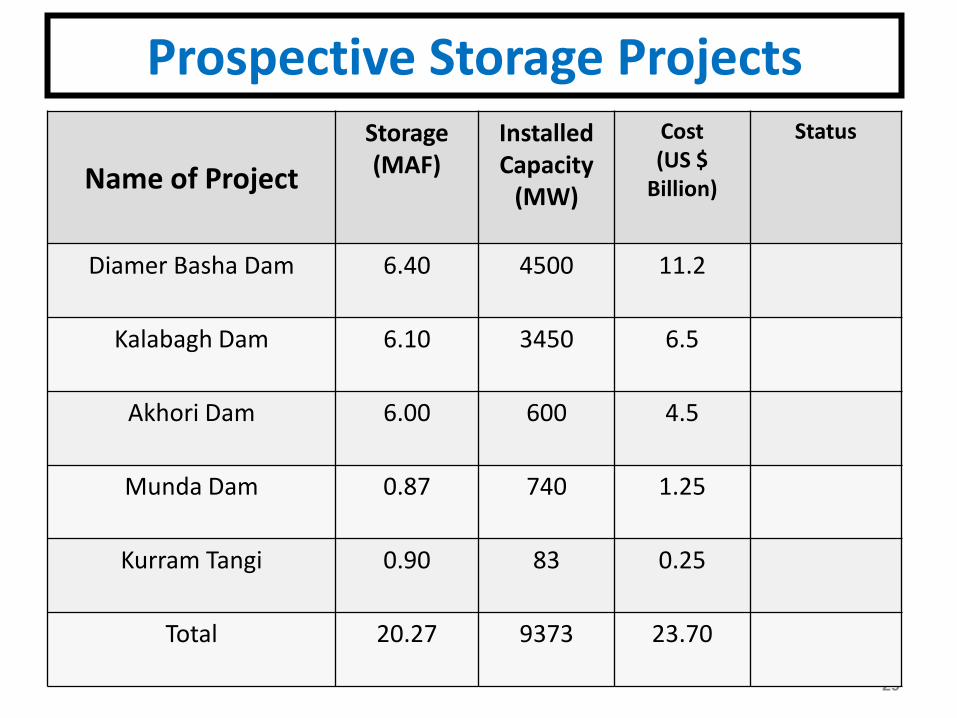
Prospective Storage Projects
29
Name of Project
Storage(MAF)
Installed Capacity
(MW)
Cost (US $
Billion)
Status
Diamer Basha Dam 6.40 4500 11.2
Kalabagh Dam 6.10 3450 6.5
Akhori Dam 6.00 600 4.5
Munda Dam 0.87 740 1.25
Kurram Tangi 0.90 83 0.25
Total 20.27 9373 23.70

30
PAKISTAN’S HYDROPOWER POTENTIAL(RIVERWISE SUMMARY)
Sr. No. River/ Tributary Power (MW)
1. Indus River 377802. Tributaries of Indus (Northern Areas) & NWFP 6006
Sub Total (1+2) 437863. Jhelum River 31434, Kunhar River 14355. Neelum River & its Tributaries 18446. Poonch River 397
Sub Total (3+4+5+6) 68197. Swat River & its Tributaries 23718. Chitral River & its Tributaries 2282
Sub Total (7+8) 46539. Schemes below 50 MW on Tributaries 1055
10. Schemes below 50 MW on Canals 408Sub Total (9+10) 1463
TOTAL 56721
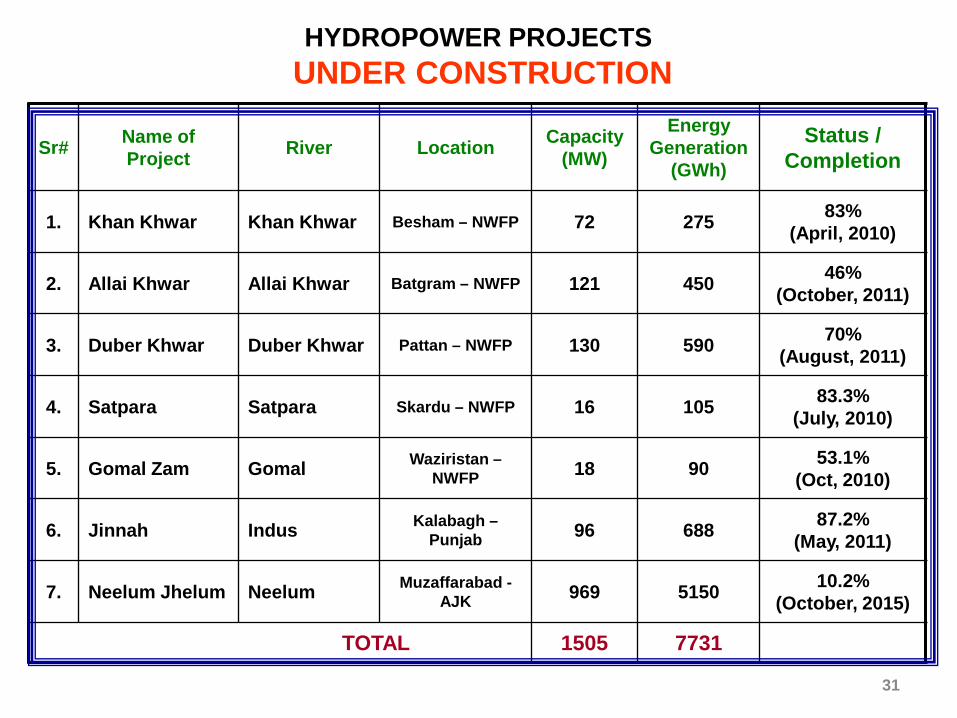
31
HYDROPOWER PROJECTSUNDER CONSTRUCTION
Sr# Name of Project River Location Capacity
(MW)
Energy Generation
(GWh)
Status / Completion
1. Khan Khwar Khan Khwar Besham – NWFP 72 275 83%(April, 2010)
2. Allai Khwar Allai Khwar Batgram – NWFP 121 450 46%(October, 2011)
3. Duber Khwar Duber Khwar Pattan – NWFP 130 590 70%(August, 2011)
4. Satpara Satpara Skardu – NWFP 16 105 83.3% (July, 2010)
5. Gomal Zam Gomal Waziristan –NWFP 18 90 53.1%
(Oct, 2010)
6. Jinnah Indus Kalabagh –Punjab 96 688 87.2%
(May, 2011)
7. Neelum Jhelum Neelum Muzaffarabad -AJK 969 5150 10.2%
(October, 2015)
TOTAL 1505 7731
Issues
Shortage of Irrigation Water
Water Use Efficiency
Management
Devastation on account of floods
32
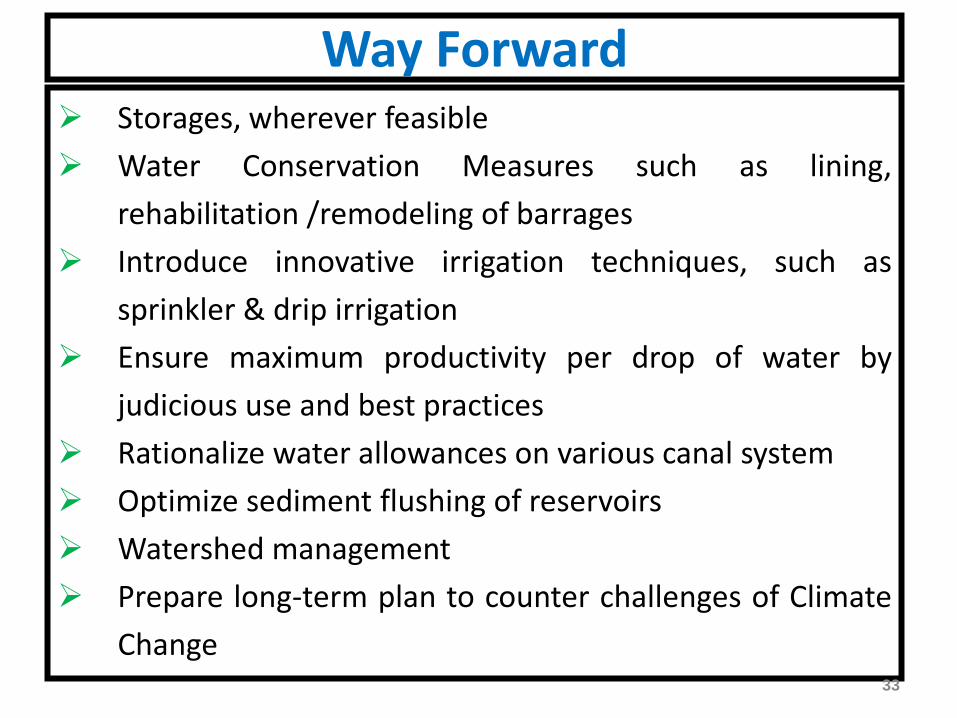
Way Forward Storages, wherever feasible
Water Conservation Measures such as lining,
rehabilitation /remodeling of barrages
Introduce innovative irrigation techniques, such as
sprinkler & drip irrigation
Ensure maximum productivity per drop of water by
judicious use and best practices
Rationalize water allowances on various canal system
Optimize sediment flushing of reservoirs
Watershed management
Prepare long-term plan to counter challenges of Climate
Change33

34


