1 Industrial location in the Euro-Mediterranean area : Market access vs. production costs Corinne Bagoulla * Abstract : Integration could have significant impact on the location of industries. The purpose of this article is to offer an empirical assessment of the industrial location among countries of the euro-mediterranean area. These countries differ in productivity, wages and market potential. Our first aim is to investigate whether traditional and new theoretical forecasts can explain industrial location in such heterogeneous areas. The second aim of this paper is to examine the futur of low-technlogy industries implanted in the Euromed area. Will they be located in other more competitive regions or will they remain in the Euromed area to benefit from the easier access to the large european market ? Using a two-way panel data model, we estimate the geographical distribution of industries accross 16 countries, 25 sectors and 16 years. The relevance of traditionnal and recent theories depends on countries’ and industries’ characteristics. The location of demand matters for determining the “North’s” industrial specialisation and the location of high- technology industries. However, to explain the geographical distribution of low-techonology firms and to understand “South’s” specialisation, both approaches are relevant. Easy access to the european market can not keep low-technology industries in mediterranean countries, however it can allows them to diversify their industrial production. Keywords : integration, specialisation, concentration, economic geography, panel data, location * Laboratoire d’Economie de Nantes (LEN), Université de Nantes.
Transcript
1
Industrial location in the Euro-Mediterranean area :
Market access vs. production costs
Corinne Bagoulla*
Abstract : Integration could have significant impact on the location of industries. The
purpose of this article is to offer an empirical assessment of the industrial location among
countries of the euro-mediterranean area. These countries differ in productivity, wages and
market potential. Our first aim is to investigate whether traditional and new theoretical
forecasts can explain industrial location in such heterogeneous areas. The second aim of this
paper is to examine the futur of low-technlogy industries implanted in the Euromed area. Will
they be located in other more competitive regions or will they remain in the Euromed area to
benefit from the easier access to the large european market ?
Using a two-way panel data model, we estimate the geographical distribution of
industries accross 16 countries, 25 sectors and 16 years. The relevance of traditionnal and
recent theories depends on countries’ and industries’ characteristics. The location of demand
matters for determining the “North’s” industrial specialisation and the location of high-
technology industries. However, to explain the geographical distribution of low-techonology
firms and to understand “South’s” specialisation, both approaches are relevant. Easy access to
the european market can not keep low-technology industries in mediterranean countries,
however it can allows them to diversify their industrial production.
* Laboratoire d’Economie de Nantes (LEN), Université de Nantes.
2
3
1 Introduction
In the last few years, many free trade agreements have been negotiated between
unequally developed countries (the enlargement of the European union, the NAFTA1 and so
on). Since the middle of the Nineties, the European Union and the Mediterranean countries
have been engaged in a vast integration project seeking to create the establishment of a free
trade area by 2010.
Integration influences the spatial distribution of activities within integrated zones.
New theories of international trade as well as new approaches in economic geography
underline the tendency of industry to agglomerate on a vast market after a drop in
transportation costs (Krugman, 1980, 1991). Much of the literature suggests that economic
integration may lead to concentration and unequal regional development (Krugam, 1991;
Krugman and Venables, 1995). Empirical analyses seeking to confirm this phenomenon
(Brülhart and Traeger, 2005; Amiti, 1999) frequently consider Europe and the United States.
Few empirical articles have considered the distribution of activities in heterogeneous areas2.
However, in the case of North-South integration, differences in production costs between
countries influence the location of industries as does market size (Amiti, 2005; Epifani, 2005;
Strauss-Kahn, 2005). In the presence of cost advantages, firms tend to disperse when trade
costs achieve low values. Comparative advantages can also lead to the dispersion of
industries, with some sectors located in the North and others in the South (Ricci, 1999). So
what is the impact of North-South integration on the spatial distribution of industries?
The Euro-Mediterranean area is very heterogeneous and so constitutes an interesting
framework for this analysis. Following ‘North-South’ integration, firms will choose between
various possible locations. The comparatively small local market or insufficient labour 1 In 1994, Canada, the United States and Mexico launched the North American Free Trade Agreement (NAFTA)
and formed the world's largest free trade area. 2 Hanson (1998, 2005) studies the effects of trade liberalisation between Mexico and the United States.
4
productivity can slow industrial development in the ‘South’. Yet equally, low wages can
attract some sectors to the ‘South’. So, will there be a geographical concentration of all
industries in one localisation or will industries be dispersed across the integrated zone ?
Integration has important economic repercussions. The convergence of industrial
structures and incomes within this zone will depend on the spatial distribution of industries
and on countries’ specialisation choices (Bensidoun, Gaulier and Ünal-Kensenci, 2001).
Countries not only need to retain firms but also to privilege the establishment of high growth
potential industries.
First, the article propose a descriptive analysis of the spatial distribution of industries
in a large sample of countries belonging to the Euro-Mediterranean area. To do so,
comprehensive datasets need first to be constructed. No study has yet been devoted to such a
heterogeneous sample of countries.
One aim of the paper is then to investigate whether traditional and new theoretical
forecasts can explain the geographic distribution of industries observed in the descriptive
analysis. Unlike many other analyses, this question is addressed here using recent panel data
models.
The other aim of the paper is to anticipate the future of low-technology industries
implanted in the Euro-Mediterranean area. In the context of trade liberalisation, these firms
could be tempted to locate to more competitive countries (such as Asian countries for
example). However, easier access to the European market could also incite them to remain
located in Mediterranean countries.
This study differs from existing literature in several respects. Firstly, the paper studies
industrial location and specialisation in an area composed of highly heterogeneous countries.
They differ in terms of wages, productivity, and market size. Secondly, unlike other similar
approaches (Amiti, 1999), the location quotient is used to evaluate specialisation within this
5
area. This index means more information can be exploited. Three sets of observation are used
in the data (industries, countries, and year) instead of two as is more generally the case.
Finally, we use Fields’ decomposition method (Fields, 2003) to ascertain the relative
importance of each explicative variable in explaining the spatial distribution of industries.
The remainder of the paper is organised as follows : the next section gives a brief survey
of the recent theoretical and empirical literature on industrial agglomeration. In section 3,
various concentration indexes are used to evaluate the degree of geographical concentration of
industries in the Euro-Mediterranean area. Section 4 details the empirical models and the
econometric procedure. The results are discussed in section 5, then conclusions drawn in the
final section.
2 The underlying theory and the empirical literature
New models of international trade (Krugman, 1980; Krugman and Venables, 1990),
and more recently New Economic Geography models (NEG), have helped explain the link
between integration and the uneven distribution of activities. Theorists have made progress in
modelling location forces attributable not to spatial heterogeneity but to the interplay of
market forces and transport costs in homogeneous places.
In Krugman’s work (1980), the concentration of activities in a single location
following integration is explained by the presence of increasing returns to scale, a difference
in the market size of the countries and positive transport costs. By being close to a vast
market, firms benefit from high demand. Krugman (1980) also evokes ‘a home market effect’,
with countries being net exporters of goods for which there is keenest domestic demand.
In more recent NEG models, the degree of clustering of firms results from a trade-off
between several ‘centripetal’ and ‘centrifugal’ forces. In centre-periphery (CP) models
6
(Krugman, 1991; Fujita, Krugman and Venables, 1999), pecuniary externalities3 trigger the
endogenous agglomeration of activities. Following trade liberalisation, industries and workers
will concentrate and initiate the ‘circular causality process’ leading to the creation of a “core-
periphery” structure. In the vertical-linkage version of the CP model, the ‘input-output’
relationship between firms triggers the endogenous agglomeration process (Venables, 1996;
Krugman and Venables, 1995). Labour immobility, and the wage differential this generates,
constitute a dispersive force in the models. Very low transport costs induce firms to settle in
the periphery and so leads to income convergence between the areas. The authors thus
underline the U-shape relation between integration and convergence.
The complexity of the ‘core-periphery’ approaches and their incapacity to produce
clear analytical results gave rise to a new type of modelling. By proposing the ‘Footloose
capital’ model, Martin and Rogers (1995) cut both demand-link and cost-link circular
causality. In this approach, the mobile fixed cost (the capital) repatriates all of its earnings to
its country of origin. Thus capital concentration is not synonymous with the concentration of
workers (and of expenditure), and so the agglomeration is no longer self-reinforcing. Forslid
and Ottaviano (2003) and Forslid (1999) propose ‘the Footloose Entrepreneur model’ and
partially reintroduce the ‘cumulative agglomeration process’. The concentration of the mobile
factor (the ‘human capital’) generates demand-link and supply-link circular causality4.
The need to explain the difference in industrial structure between very similar
countries means that little attention has been paid to the interplay between comparative
advantages and agglomeration. However, there are a few exceptions. Krugman and Venables
(1990) consider a model in which countries differ both in terms of factor endowments and
their market size. Although in the first stage of trade liberalisation agglomerative forces work
against comparative advantage, each country ends up specialising in their comparative
3 Emanating from the link between supply and demand. 4 The process is indeed less systematic because only a part of the expenditure moves and follows the production.
7
advantage industry. Amiti (2005) embeds Heckscher-Ohlin features within a vertical-linkage
version of the CP model. Firms differ in factor intensities and choose to locate either in a
labour-abundant country or a capital-abundant country. She shows that lower trade costs can
generate an agglomeration of all upstream and downstream firms in one country. However for
some ranges of trade costs, labour-intensive industries may locate in capital-abundant
countries.
Forslid and Wooton (2003) and Strauss-Kahn (2005) analyse the tension between
agglomerative forces and a Ricardo-type comparative advantage. Forslid and Wooton (2003)
introduce technological differences in Krugman’s (1991) model. They show that if trade costs
are sufficiently low, comparative advantage favours the dispersion of industries. Strauss-Kahn
(2005) simultaneously integrates the vertical linkages and a difference in cost of production
factors between countries in an economic geography model. Whereas the agglomeration of
activities is observable for intermediate trade costs following integration, comparative
advantages and the need to satisfy demand induces firms to disperse. In these different
models, the location of industries is jointly determined by market access and differences in
production costs.
There is an extensive body of empirical literature that seeks to check these various
theoretical precepts. Numerous researchers have examined the data looking for evidence of
geographic concentration patterns in Europe, using sectoral output or employment data (Kim,
Ellison and Glaeser, 2002). It has proven difficult to distil strong stylised fact from this
research as studies differ quite strongly in the data and measures they employ. The majority of
these analyses suggest a slow increase in the concentration of European industrial geography.
However, some authors evoke a decreasing trend in geographic concentration (Aiginger and
Pfaffermayr, 2004; Midelfart-Knarvik et al, 2002).
8
These descriptive approaches have been complemented by an econometric analysis
(Amiti, 1999; Haaland, Midelfart Knarvik and Torstensson, 1999; Rosenthal and Strange,
2001). The authors have checked whether agglomeration (measured by concentration indexes)
is consistent with predictions of NEG models or other trade theories. These approaches
consist in regressing the indexes on proxy variables of trade costs, increasing returns and
vertical linkages, while controlling for other more traditional sources of agglomeration (factor
endowments, technology, etc.). Kim (1995) regresses Gini indexes calculated at various dates
(1880, 1914, 1947, 1967 and 1987) on a proxy for internal scale economies, resource intensity
variable and on industry and year fixed effects. His study shows the positive impact of scale
economies and so supports NEG models. Using a very similar approach, Amiti (1999) arrived
at the same conclusion. High-scale economy firms as well as a high proportion of
intermediate goods industries increased their geographical concentration between 1968 and
1990. On the contrary, Brülhart (2001a) finds no significant correlation between measures of
increasing returns and agglomeration whereas Haaland et al (1999) underline the negative
impact of scale economies on concentration.
A second empirical approach consists in comparing NEG models to traditional trade
theory by identifying the ‘home market effect’ on production mentioned by Krugman (1980).
According to new models, in the presence of trade costs very keen demand for a good can
cause producers to locate in the country concerned. Thus idiosyncratic demand for a good
generates an amplification effect on production which does not occur with constant returns to
scales5. Davis and Weinstein (1996, 1999, and 2003) identify ‘the home market effect’ thanks
to a strong correlation between supply and demand. To integrate this effect, they regress the
production of ‘goods’6 on a variable that deviates from rest-of-world demand patterns. Their
5 In traditional models, production increases at most proportionally with the rise in demand. 6 They use a 4-digit disaggregated classification of industries.
9
approach provides strong support for ‘home market effects’7. The ‘home market effect’ is also
identified in some studies thanks to the impact of countries' expenditure on export structure
(Hanson and Xiang, 2002).
Recent analyses of industrial location stress that, more than the presence of increasing
return to scale, it is “market potential” which determines industrial location. In NEG models,
the local factor prices are higher in large markets. Hanson (2005) studies the determination of
wages in the United States. By estimating wage equation, he shows that market potential
explains interregional wage differences. In another paper Hanson (1998) takes the example of
trade liberalisation in Mexico. He shows that distance from industry centres has a negative
effect on relative wages. Other authors have stressed the importance of inter-industrial links
as a factor of concentration in major markets. Head and Mayer (2004a) worked with a large
sample of Japanese firms established in European countries between 1984 and 1995. They
show that a higher market potential can result in a large increase in the probability that a firm
settle in a region.
Recent empirical analyses seek to illustrate precisely the ‘new theories’ by trying to
describe structural equations of the models (Head and Mayer, 2006). The contributions of
traditional theories are somewhat neglected. These orientations are largely justified. If theory
makes it possible to confirm the presence of industrial agglomeration, empirical studies do
not. It is difficult to attribute the concentration of industries to the presence of increasing
returns or to identify the specific causes of ‘the home market effect’ revealed by the data.
Moreover, these studies are based on data concerning comparatively homogeneous and
largely industrialised zones. It is thus less easy and less relevant to study comparative
advantages. With the exception of Hanson’s works based on Mexico, very few empirical
articles study the geographic location of industries in a heterogeneous area.
7 Note that the results from the 1996 and 1999 studies indicate that controlling for factors of production reject the
‘home market effect’.
10
In this paper, we propose to explain the spatial distribution of activities in some
countries of the Euro-Mediterranean area. In this case, cost advantages are decisive and
cannot be ignored. Similarly, it is relevant to take into account the context of imperfect
competition and differences in market size between Europe and Mediterranean countries (in
terms of income or market access). The geographical approach is also justified. The aim of
our analysis is not to test the relative relevance of various theories but rather to check if,
jointly, they allow for a better apprehension of the industrial fabric in the Euromed zone. Our
analysis thus follows on from that of Amiti (1999) or Rosenthal and Strange (2001).
3 The descriptive analysis
This section examines the industrial production pattern in some countries belonging to
the Euro-Mediterranean area. is used8. The dataset is from INDSTAT3 (2004), proposed by
UNIDO9. It consists of 16 countries, among which eight Northern European countries
(Austria, Denmark, Finland, France, Germany, Ireland, Sweden and the United Kingdom),
three Southern European countries (Greece, Italy and Spain), two acceding countries (Cyprus
and Hungary), and some Mediterranean countries (Jordan, Turkey and Egypt). The production
of 25 industries (SITC Revision 2, 3-digit level) is studied over the period 1985-2000. To
facilitate the interpretation of results, industries are classified according to their level of
technology10.
Before presenting some geographic concentration indexes, the evolution of production in
the sample of countries is first studied.
8 Data from all countries belonging to the Euro-mediterranean area is not available. Data concerning the
‘Northern Europe’ are almost complete. However, it would have been better to integrate some important
mediterranean and new member countries (Morocco, Tunisia, Poland and the Czech Repulic). 9 United Nation Industrial Development Organisation. 10 We use the classification suggested by Hatzichronoglou (1997) and presented in Appendix A, table A.1.
11
3.1 Evolution of production
It is necessary to underline the evolution of industrial production in our sample of
countries before studying the evolution of the concentration indexes. This analysis should
prevent any misinterpretation of these indexes.
Even if we note a rising trend in total production between 1985 and 200011, some
industries seem to have developed more than others. The evolution of each industry's
production share in total production makes it possible to underline their development in the
zone (appendix A, figure n°A.1, A.2,A.3, A.4).
It can first be noted that for most of the low-technology industries, there is a major
decrease in their share in total production. There has been a fall of more than 15 points for
food products, wearing apparel and footwear over the period 1985-2000. The proportion of
textile in total production also decreased of 41 points between 1985 and 2000. Wearing
apparel, footwear and textile are unskilled and labour-intensive industries. With trade
liberalisation, these sectors face ever greater international competition, in particular from
Asian countries. Even Mediterranean countries seem to have gradually lost their comparative
advantage in these sectors, explaining these results.
Swings observed in production of food products can be linked to this industry’s
initially high trade costs. During many years, these costs gave the ‘North’ a comparative
advantage in food production. Since the beginning of the nineties, trade liberalisation has led
to a slowdown in production in this sector, in particular in Northern Europe.
The share in total production of most medium-technology industries also fell, in
particular iron and steel (-44 points) and non-ferrous metal products (-26 points). All high-
technology sectors, except industrial chemicals, recorded an increase in their share in total
11 Total production increased by 125 % between 1985 and 2000.
12
production. This increase is particularly significant in transport equipment (+ 33 points) and
professional and scientific equipment (+ 46 points).
This study therefore suggests that production growth in our sample of countries mainly
occurred in high-technology industries, whilst production of many low-technology sectors
dramatically declined between 1985 and 2000. These important facts have to be considered
while analysing geographic concentration.
3.2 Spatial distribution of industries
In this paper, the spatial distribution of industries will be evaluated in different ways12.
First, the geographical concentration will be measured thanks to the entropy index13, for two
distinct years (1985 and 2000). In parrallel, the distribution of each industry in our sample of
countries is studied using the concentration ratio (table A.2, appendix A). Finally, the location
quotient allows countries’ specialisations to be identified. We define :
The location quotient14 : jt
ijtijt
CCL =
and the entropy index : ( )∑=j
ijtijtit LCE ln
With , it
ijtijt
XXC = ( the concentration ratio15) and
t
jtjt
XXC −=
ijtX is the production in industry i, country j and t.
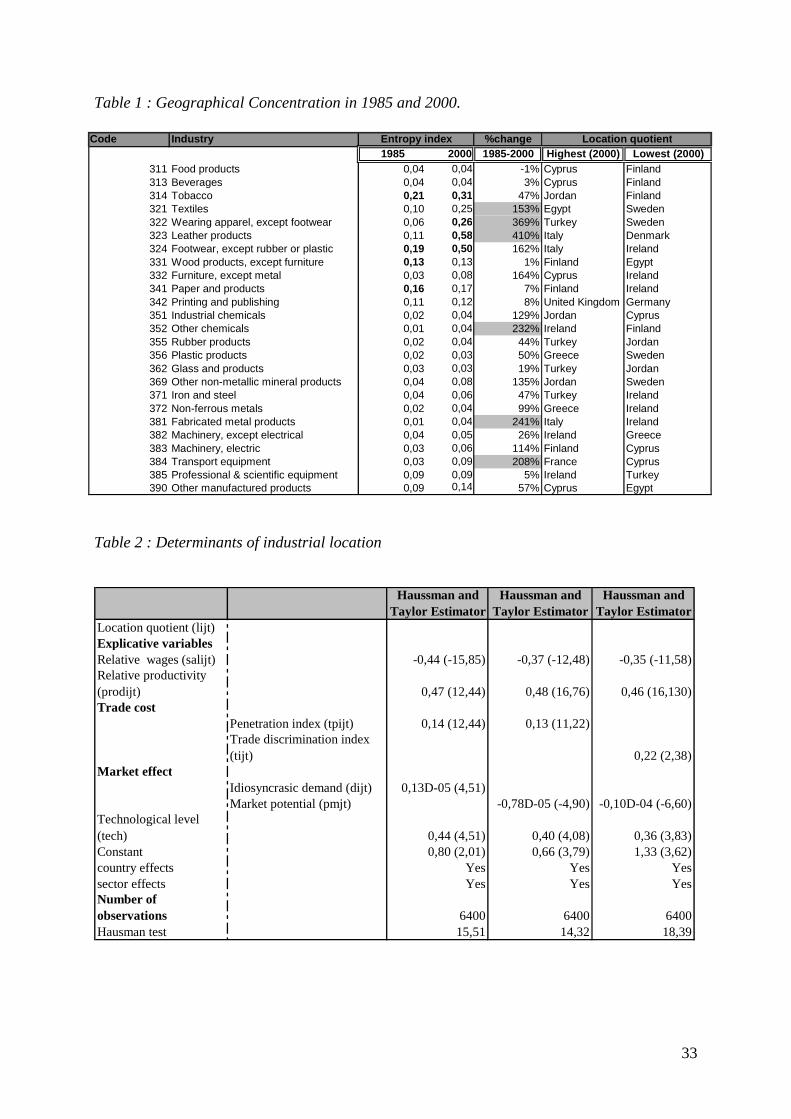
[ INSERT Table 1]
12 The measurement of geographical concentration has attracted interest in new economic geography literature.
See Combes, Mayer and Thisse ( 2006) for a comprehensive survey. 13 Others indexes have been calculed with no significant differences in the results. Unfortunately, the Ellison
and Glaeser (1999) index could not be used since sufficiently disaggregated data is not available. 14 The sector is said to be ‘located’ (or the country is said to be ‘specialised’) if the location quotient exceeds 1.
In this case, the share in the industry’s total production of the country studied exceeds the country’s share in total
production. 15 Note that this index largely depends on countries’ size. So, it is not the value of the ratio that is of interest, but
the variation in the distribution of each industrial sector between 1985 and 2000.
13
According to our results, the geographical concentration of industries intensified to
some degree between 1985 and 2000 (the concentration level increased for between 21 and 24
sectors). All the indexes reveal a significant and increasing concentration of many low-
technology sectors (in particular in textiles (321), wearing apparel (322), leather products
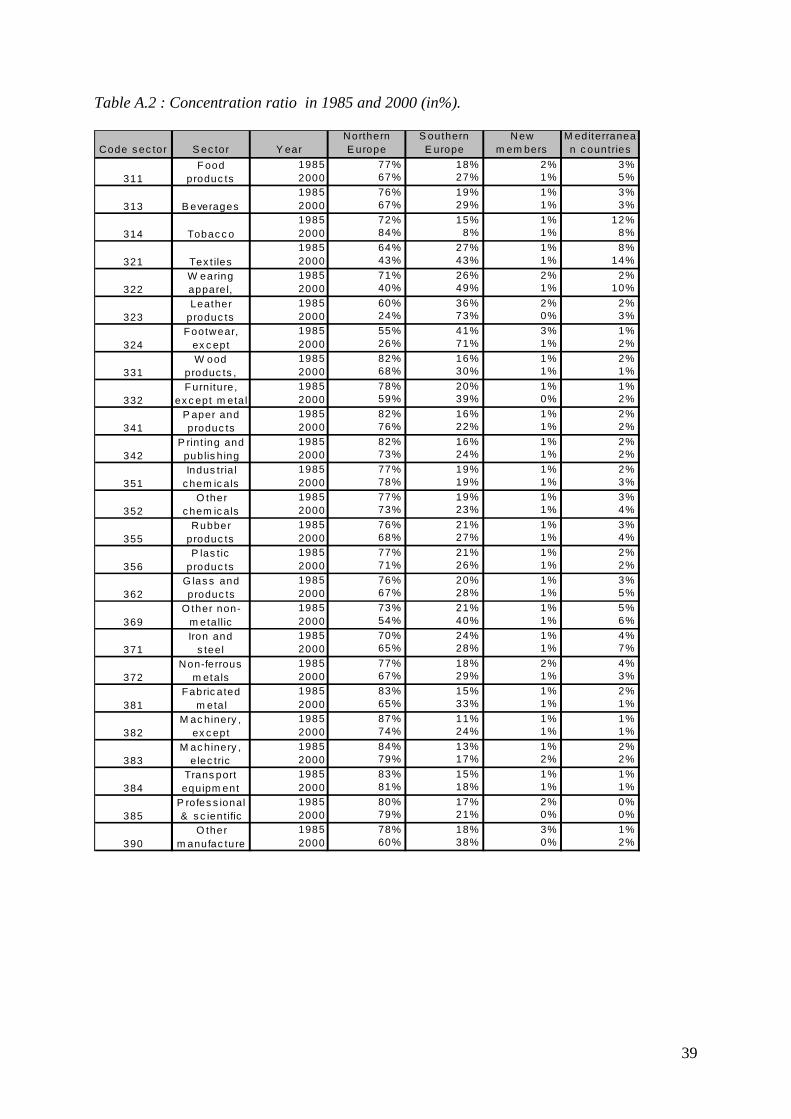
(323) and footwear (324)). The concentration ratio (table A.2, appendix A) shows a major
redistribution of textile production from Northern Europe to Southern Europe and
Mediterranean countries. Textile production (321) is now principally located in Egypt,
Turkey, Greece and Italy. The production of wearing apparel and leather products has also
relocated to the South. In these sectors, Northern Europe’s share of the total sectoral
production fell by more than 30 points between 1985 and 2000 (table A.2, appendix A). In
2000, wearing apparel (322) was mainly produced in Turkey, Cyprus, Greece, Italy and
Jordan. Its location in Mediterranean countries and in Southern Europe (in Spain and Italy)
rose significantly between 1985 and 2000. Leather products (323) are mainly implanted in
South Europe (in particular in Italy and Spain) and in Turkey. Footwear (324) is located in
Southern Europe (Italy, Spain and Greece), in new member states (Cyprus and Hungary) and
in Jordan. This sector also appears more and more concentrated in Italy and Jordan, whereas
its concentration ratio and the location quotient decrease significantly in Northern Europe and
new member countries.
The most widely distributed industries in the area studied are of an intermediate
technological level (fabricated metal products (381), plastic products (356), non-ferrous metal
products (372)).
Finally, some high-technology industries appear fairly localised (in particular,
transport equipment (384) and professional and scientific equipment (385)). These industries
are principally located in Northern European countries. Concentration ratios in these sectors
remain relatively stable between 1985 and 2000 (table A.2, appendix A). But, as shown in the
14
preceding section, production in these sectors has notably increased over this period. Thus, it
was largely northern Europe that benefited from this increase. However, these industries are
practically nonexistent in Mediterranean countries and new member states (Egypt, Jordan,
Cyprus, Turkey and even in Greece). Professional and scientific equipment (385) is present
mainly in Ireland, Denmark, Sweden, United Kingdom and France. The transport equipment
industry (384) is located mainly in France, Germany, the United Kingdom and Sweden.
The increasing specialisation and geographical concentration suggested by the results
can be partly explained by the significant heterogeneity of the sample of countries studied.
Low-technology industries are very concentrated because their production takes place in a
restricted number of countries (especially Mediterranean and South European countries).
Whereas Northern Europe and new member states have reduced their production in many
‘traditional’ industries (textile, wearing apparel), Mediterranean and South European
countries (Italy and Spain) have reinforced their specialisation in these sectors. At the same
time, low-technology industries are less and less present in many Euro-Mediterranean
countries due to international competition. High-technology industries are evenly distributed
because they are implanted in many North European countries, which make up a significant
part of our sample. In addition, Northern Europe significantly increased its specialisation in
these industries between 1985 and 2000. Medium-technology industries are dispersed, being
present in Europe, in new acceding countries and in some Mediterranean countries16.
Some limits need to be mentioned, principally the insufficient data available for the
studied countries. Only part of the Euro-Mediterranean area is analysed. The indices would
thus differ significantly were a larger sample of countries analysed. A similar remark also
applies to the level of sectoral disintegration considered, which is inadequate - the same sector
could include different products (which can differ in terms of their technological content). In
16 Note that because of differences in the sample of countries studied, our results can not be compared to those in
related literature (Amiti, 1999; Midelfart-Knarvik et al. 2002).
15
addition, it is not possible to take into account the fragmentation of the productive process in
many low-technology sectors.
After this descriptive analysis, the determinants of the spatial distribution of industries
in this zone will now be studied.
4 The empirical model
This section presents the model and the econometric procedure. There is comprehensive
theory which explains concentration but, as we have seen in the first section, different strands
can indicate which elements should be included in an empirical approach
4.1 The dependent variable
The location quotient is used to evaluate the geographical distribution of each
industrial sector in the sample of countries. This index has two main interests. First, three
levels of observation can be used (countries (j), sectors (i) and years (t)) instead of two as with
more classical indexes. The location quotient also corrects geographical concentration to
countries’ size effect. The indexe (Lijt ) compares the share of country j in the total production
of sector i to the share of this country in total production. It is used as the dependent variable
in the model.
∑ ∑∑
∑=
i i jijtijt
j ijtijtijt XX
XXL
/
/ (1)
where ijtX represents production in sector i, country j at t.
If it is greater than 1, then country j is relatively specialised in industry i (or industry i
is relatively located in country j).
4.2 Explicative variables
Relative wages
16
The low level of wages is one of the main factors responsible for the location of firms
in developing countries. Our variable compares the wage in each country to the average wage
in the considered industry. As we have seen in the descriptive analysis, Southern countries
accounted for higher location quotients. So, a negative relationship between wages and
industrial location can be expected.
it
ijtijt
wwSal = (2)
ijtw represents the wage per worker.
If low wages offer a clear advantage for developing countries, low wages ought to be
associated with low labour productivity. If some industries are seduced by low wages, others
attach greater importance to labour productivity (industry heterogeneity plays an important
part here). It thus seems essential to take these two effects into account when studying
industrial location.
Productivity
According to traditional trade theory, relative technological differences between
countries may give rise to comparative advantages and specialisation. Letting these
differences be reflected by gaps in labour productivity, defined as production per worker, the
index (Prodijt) may be computed:
=
t
t
jt
jt
it
it
ijt
ijt
ijt
EXEX
EXEX
odPr (3)
Were Eijt is employment in industry i in country j at period t.
This measure of relative productivity is inspired by Haaland et al.’s (1999) index17.
The numerator evaluates productivity in industry i in country j (ijt
ijt
EX ) relative to average
17 This index has also been used because of its low correlation with the wage variable.
17
labour productivity for this industry across countries ( )it
it
EX . The denominator represents labour
productivity in country j
jt
jt
EX relative to average productivity across countries and
industries
t
t
EX . The greater the cross countries differences in productivity in the industry i,
the higher the value of Prodijt. And therefore, the higher will be the degree of cross country
specialisation.
Market size effects
The market size is one of the main agglomeration factors mentioned in economic geography
models. Unlike traditional trade theory, new theories predict that demand bias in favour of a
particular good creates a large ‘home market effect for this good’. According to these
theories, differences in expenditure structure may determine production structure and industry
location. ‘Krugman’s market size effect’ has been represented in many empirical articles by
comparing domestic demand for a good to world demand for this good (Davis and Weinstein,
1999, 2003; Brülhart and Trionfetti, 2005). The measurement of the relative ‘idiosyncratic
demand’ (Dijt) used here is inspired by these different studies :
itijtijt DDD −= (4)
where ijtD is the demand (production minus exports) in country j for industrial good i at t. itD
is the total demand for the industry i in the area.
The market size effect is also illustrated by the market potential function (Pmjt),
initially proposed by Harris (1954). It illustrates the fact that the demand arising in a country
is not only deriving from local consumers but also from the demand originating from all
18
consumers in the countries surrounding. Different versions of the function have been used in
many empirical articles (Head and Mayer 2004a, 2004b) 18.
∑=' '
'
j jj
tjjt
dPIBPm λ (5)
djj’ is the geographical distance between country j and j’ , and λ is the distance parameter
(here equal to the value estimated by Hummel (1999), 0,92)19.
These two variables do not exactly measure the same thing. So, they are alternatively
introduced into the regressions. The market potential function evaluates the incomes of the
country j and of countries nearby (j’ ). Dijt measures the importance of the national demand
for each industry. It has then the advantage of integrating a sectoral level of observation.
Trade costs
Trade costs matter to traditional trade theories as well as to economic geography
approaches. Traditional theories predict a positive relationship between integration and
specialisation. New economic geography approaches emphasize a tension between production
costs and access to a large market. On the one hand, a better market access generate industrial
agglomeration. On the other hand, the larger the market, the higher the cost of immobile
factors. The relative strength of these effects in determining location depends on the level of
trade costs.
Unfortunately, precise data relating to trade costs is not available, so two distinct
indexes are used to study their effect on industrial location. First, trade openness has been
evaluated thanks to the relative penetration index (Tpijt):
( )t
it
jt
ijt
ijt
PIBM
PIBM
Tp
= (6)
18 The main difference between these versions and Harris’ (1954) fonction is that they do not consider constant
price indexes. 19 We have tested other values but with no significant differences in the final results.
19
Where Mijt representes country’s j imports of good i in t. This index evaluates the country j
relative trade openness in various industries.
Gaulier and Zignago (2002) has proposed an indirect way for measuring obstacles to
goods trade. The trade discrimination index is defined as the de facto inequality of access for
a good in a given market, which various foreign suppliers may experience. The presence of
obstacles to trade (tariff and non-tariff barriers) should lead to distortions in the geographic
spread of suplies. As a result, the greater the barriers, the more imports will be concentrated in
a small number of trading partners. And also, the more market share will be distorted
compared to a pro rata distribution based on the importance of suppliers on world market.
This index has been calculated for each sector, country and year so as to complete our
analysis. The distribution of trade flows is measured by the relative intensity indicator which
is the ratio of the observed trade flows to theoretical flows. The latter are determined by the
geographical distribution of total trade in the area according to the relative importance of
exporters and importers respectively. Discrimination is calculated as a weighted average of
the relative intensity factors. The trade discrimination indicator is also corrected for the
impact of geographical distances (and others ‘natural’ impediments to trade)20.
In this analysis, import discrimination reflects preference for particular countries in the
zone and so reveals some specific relationship between countries. It has been known that
many European countries have had special relationships with certain Mediterranean countries
for many years. These relationships could explain the production pattern in this area. The
index will permit us to identify such relationships.
The calculation of this index shows that European countries (Austria, Denmark, and
Sweden in particular) are more ‘open’ than Mediterranean countries (such as Egypt and
20 See Gaulier and Zignago (2002) for more details on the construction of this index.
20
Jordan) 21. It equally confirms that low-technology industries (textile, leather products and so
on) are more protected than high value-added sectors (for example, transport equipment).
The relative penetration index and the trade discrimination index are alternatively
introduced into the regressions to evaluate countries’ openness.
Characteristics of industries and countries
The dummy variable (Tech ) takes a value of 1 for low-technology industries and 0 for
medium or high-technology industries. This variable is based on the classification suggested
by Hatzichronoglou (1997). As seen in the descriptive analysis, location quotients are
particularly high in some ‘South’ countries which tend to be specialised in low-technology
industries. Therefore a postive relationship can be expected between this dummy variable and
the location quotient.
Finally, as integration into a large market could explain the firms’ location choice a
dummy variable is introduced to reflect membership of the European Union. Eu takes a value
of 1 if the country belongs to Europe, 0 if it does not.
According to theories, all variables presented in section 4.1.2 have an impact on
industrial location. The aim is to ascertain if those variables are the main variables explaining
specialisation in the sample of countries. To control for heterogeneity, country and sector
specific effects are also introduced in the models. Hence, the location of the industry i in the
country j and in the period t may be written as22 :
21 The indexes are presented in appendix A, table A.3 and A.4. 22 Note that this equation represents only one of the regressions tested (see section 4).
21
4.3 Data and measurement
To build the sample, production, wage and employment23 data from the INDSTAT3
(2004) database is used. The scale of observation can be disaggregated up to 16 countries24 3-
digit industrial categories (corresponding to 25 indutries) and 16 years (the period from 1985
to 2000). The CEPII database (‘Trade and Production’) provides trade data. Finally, data
relating to the distance between various countries comes from the ‘distances’ database built
by Mayer and Zignago (2005).
4.4 Specification and econometrical procedure
Several variables measure trade costs and market size. Their impacts on industrial
location are alternatively estimated in the regressions.
Several econometric specifications of the model have been tested. The database used
has three dimensions (observation by sector, country and year). The aim therefore is to make
use of all this information. Unfortunately, because of significant data volatility, three-effect
models cannot be proposed, hence two-way models are suggested. Models relating to the
whole sample are presented first. In these models, sector and country specific effects are
introduced to capture heterogeneity25. In order to bring greater precision to this first analysis,
to check for coefficient stability and to reduce the heterogeneity, the sample has been split by
region (North/South) and by industries’ technological levels (low-technology
industries/medium and high-technology sectors)26.
The ‘Northern countries’ sample is composed of eight countries belonging to the
European Union (Austria, Denmark, Finland, France, Germany, Ireland, Sweden and the
23 All expressed in current US dollars. 24 Which include Austria, Jordan, Cyprus, Egypt, Greece, Denmark, Finland, Ireland, Hungary, Sweden,
Turkey, Spain, the United Kingdom, France, Italy and Germany. 25 It was decided not to introduce time specific effects because the variance of the dependent variable is higher
by sector and country than by year. 26 Use is still made of the classification proposed by Hatzichronoglou (1997).
22
United Kingdom). Southern European countries (Italy, Greece and Spain) were integrated in
the ‘South’ sample. As seen in the descriptive analysis, those countries have similar
specialisation patterns to those of Mediterranean countries. It therefore seems more relevant to
include them in the ’South’ sample. However, to take European membership into account the
EU dummy variable is also introduced in the regression. The ‘South’ sample also includes
Mediterranean countries (Egypt, Jordan and Turkey) and new member states (Hungary and
Cyprus). Two-way models are assessed for each sub-sample with sector and country specific
effects.
The econometric procedure used is the same for each regression. Both fixed models and
random effects models are tested. The ‘Hausman test’ is used to test for orthogonality of the
random effects and the regressors (Green, 1997). When the random model is rejected, the
fixed effect model is relevant. However, when the regression deals with time-invariant and
sector-invariant (or country-invariant) variables, the Haussman and Taylor estimator is used
(instead of the fixed effet model). It permits to control for endogeneity and to estimate the
coefficients of time-invariant and sector-invariant (or country-invariant) variables.
The models have also been corrected for autocorrelation (by using an AR1model) and
for heteroscedasticity by using the ‘White method’27. However, these corrections have to be
done on one-way models. They have permitted us to check for the stability of the coefficients
after correction28.
As we have a few number of variable, it seems important to identify which of them
appear the most relevant to account for industrial location. So, the Fields’ (2003)
decomposition method has been used in the paper to decompose location inequality29. From a
log-income based levels calculation, Fields (2003) runs a standard semi-logarithmic income-
27 Note that the regression details are available from the author. 28 Only two-way regressions are presented in the paper. 29 Fields (2003) has proposed this methodology to decompose income inequality.
23
generating fonction. Than, he denotes the share of the log-variance of income that is
attribuable to each explanatory variable and measures also the fraction of the log-variance that
is explain by all of the variables. Finally, Fields (2003) calculates the relative factor inequality
weights and the corresponding percentage contributions for each explanatory factor30. In the
paper, this method is used to estimate how much of location inequality is accounted for each
explanatory factor.
We have used the same econometric procedure to analyse the production of low-
technolgy industries. The relative share these industries in the GDP of each Southern country
has been regressed on wages, penetration indexes, and on the access to the european market.
5 The determinants of industrial location in the Euro-
Mediterranean area: results and discussion
This section examines the forecasts of theoretical literature so as to determine which of
them most closely corresponds to the space distribution of industries in the sample of
countries used here. More precisely, the aim is to explain the two main features of the
industrial production pattern observed in section 3:
- The increase of geographic concentration and specialisation in the area. High-
technology industries are mainly concentrated in Northern Europe whereas low-
technology sectors are largely located in Southern Europe and Mediterranean
countries.
- Despite the decrease in low-technology industrial production, some countries (in
the ‘South’) are more and more specialised in those sectors. Will these industries
remain located in the Euro-Mediterranean area ?
30 See Fields (2003) for details on this methodology.
24
As above mentioned, the first part of our econometric analysis consists in explaining
the actual distribution of industries in our sample of countries. Then, we will devote attention
to the future of low-technology industries in the euro-mediterranean area.
5.1 Which factors explain the industrial location in our sample of countries ?
[INSERT Table 2]
The higher the wages, the lower the geographical concentration. In parallel, the higher
the productivity, the higher the geographical concentration. This confirms the descriptive
analysis. The most localised industrial sectors are mainly present in Southern countries, which
benefit from the lowest wages. Conversely, labour efficiency attracts industries in a market.
As has long been recognised by traditional trade theory, comparative advantages affect
countries’ specialisation pattern.
Results underline the positive impact of ‘idiosyncratic demand’ on industrial location.
This result confirms the relevance of economic geography theories. The higher the national
demand for a good, the more concentrated the industry is in this market. Results concerning
‘potential market’ effects are quite different. The larger a country is or the richer its
neighbours are, the less specialised the country is. Once again, the results mentioned in the
previous section are found here. Northern European countries have a larger market size (and
market potential) and a more diversified industrial fabric.
The study of the penetration index reveals that the greater a country's openness the
more concentrated industrial activities are. This result could also be related to a ‘size effect’,
since the smallest countries are very often more open. Taking into account the trade
discrimination index allows some different effects to be underlined. A positive and significant
relationship can be observed between discrimination and industrial specialisation. Industrial
location in this area could be explained by preferential trade relationships between countries.
25
Therefore, greater diversification in the origin of imports might generate a higher level of
diversification in a country’s industrial fabric.
Finally, the results show that industrial location is higher in low-technology industries.
Fixed effects analysis again confirms the descriptive study (appendix B, table B.1).
Industries’ fixed effects reveal a greater degree of location for the sectors dealing in tobacco,
textile, other non-metallic mineral products, wearing apparel, footwear, wood products and
food products. They are low-technology industries and are primarily present in the South.
Conversely, medium and high-technology sectors are relatively less located, as is the case for
transport equipment, machinery (electric and non-electric), and industrial chemicals. These
sectors are present in many Northern countries (Germany, France, the United Kingdom etc.).
Fixed country effects confirm that the location quotient is higher in Southern countries
(Cyprus, Jordan, Hungary, and Egypt) than in large Northern countries (France, Germany).
5.1.1 Sub-sample regressions
Splitting the sample by area and by the technology level of firms provides even more
information on the determinants of industries’ location choices. Note that the regressions
including the penetration index and the idiosyncrasic demand have not been presented here
because the signs of these variables’ coefficients remain stable whatever the sample studied.
When the analysis concerns only Northern countries or high-technology sectors31
(table 3), the link between wages and industrial location becomes positive but not always
significant. The level of wages does not seem to explain the specialisation of Northern
countries. Equally, the location of high-technology industries is more due to a high
productivity than to low wages32. In these sectors wages are generally high. On the contrary,
31 The regression including the penetration index and idiosynsic has not been reported because the relationship
between this variable and the location quotient remains stable whatever the sample studied. 32 This result can be connected to a theoretical forecast : technological spillovers might explain the geographical
concentration of high value-added industrial sectors.
26
Southern countries’ specialisation or high location quotient in low-technology industries are
explained by attractive wages.
[INSERT Table 3]
When the regression deals with Northern countries, market potential coefficients
remain negative but not very significant. Although the degree of specialisation is still higher
in ‘small’ countries, this is not as clear as when the entire sample is considered. The sign of
this variable changes when the sample concerns high-technology industries. Indeed, these
firms are for the most part located in Northern countries, which benefit from a higher market
potential (and larger market size).
Trade discrimination explains Southern countries’ specialisation and the location of
low-technology industries. The industrial landscape of this area is therefore in part the result
of specific commercial links between countries. As has been noted in many Femise reports
(2005), trade flows in the Euro-Mediterranean area reflect the adaptation of Mediterranean
production to European Union demand. However, the complementarity of some Southern
countries does not enable them to develop the structure of their specialisation. On the
contrary, this trade discrimination limits the specialisation of Northern countries and do not
explain location of high-technology industries.
Lastly, it can be noted that even if Southern European countries are included in the
‘South’ sample, these countries remain less specialised than the other Southern countries.
These results could be related to their membership of the European Union.
The principal results can be summarised in several points:
� On the one hand, countries with the highest location quotients are not the
largest. Market potential has a positive effect on firms’ location only if the
analysis concerns high-technology industries. On the other hand, the results
underline the dominant impact of idiosyncratic demand on industrial location.
27
� Firms are attracted by countries with the highest sectoral productivity and the
weakest wages. Production costs are therefore decisive in firms' location
choices, proving the relevance of traditional trade theories. However, lower
wages are not crucial for technological industries and do not explain the
specialisation of Northern countries.
� The most open countries have a less diversified industrial landscape and
concentrate their production in specific sectors in which they are relatively
powerful. In parallel, trade discrimination is generally a factor in geographical
concentration.
We can so conclude that economic geography theories, like traditional trade theories,
seem relevant in explaining specialisation in the sample of countries studied here.
However, economic geography theories are more relevant in understanding the location
of high-technology industries and the specialisation of Northern countries, whereas
traditional trade theories better explain the location of low-technology firms and the
specialisation of Southern countries. A large market and an high sectoral productivity
explain in high-technology industries’ location choice and could impact on Northern
countries’ specialisation pattern. On the contrary, Southern countries’ specialisation and
low-techonogy industries’ location are mainly the result of attractive production costs and
high trade discrimination.
5.1.2 The decomposition of location inequality
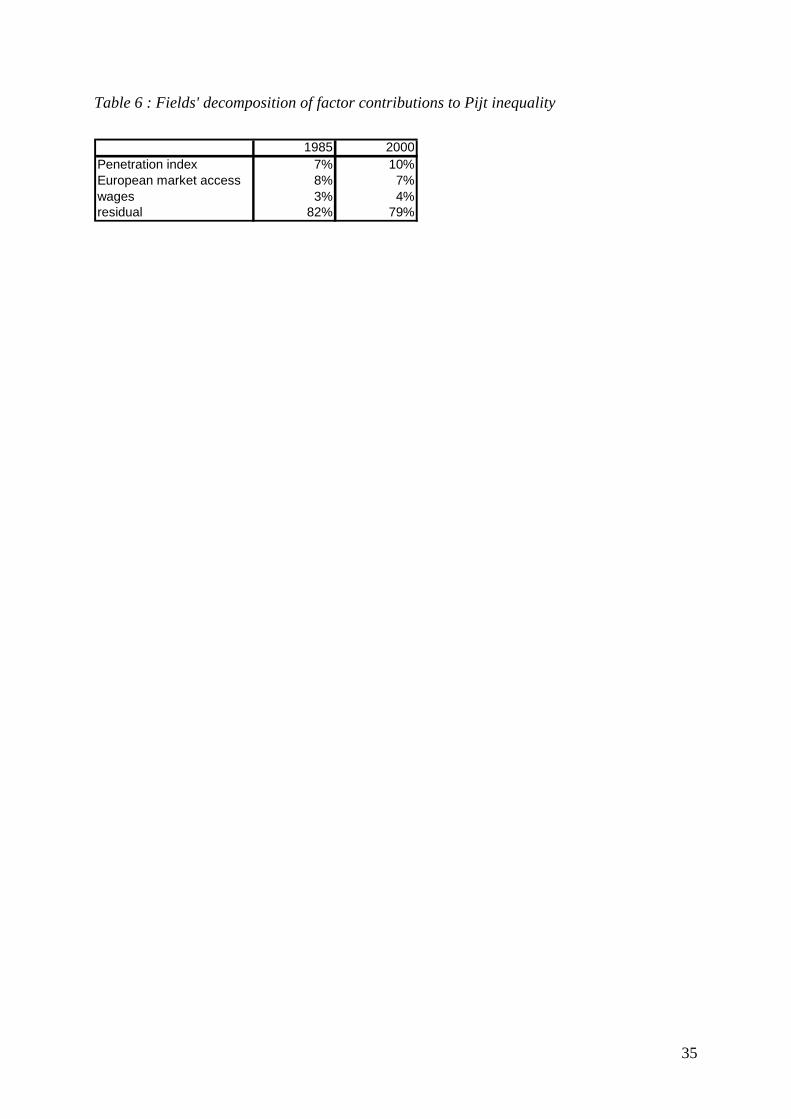
The Fields’ (2003) decomposition method also reveals that, after the residual (which is
very high), wages are the most important variable in accounting the level of inequality of
industrial location in 1985 and 2000 (table 4). We have also noticed that the respective
inequality weights of productivity, european membership and technological intensity increase
28
between 1985 and 2000. However, the importance of “market size” variables (market
potential and idiosyncrasic demand) appears moderate.
Finally, differences in specialization degrees are more in more due to the belonging of
the european market or to industries’ characteristics. Regarding the growing share of
residuals, we can also note that comparative advantages and access to a large market are
insuffisant to explain specialisation inequality.
[INSERT Table 4 ]
5.2 What is the futur of low-technology industries in the euro-mediterranean
area ?
In the first section of this paper, it was noted that the production of low-technology
industries decreased in the sample of countries used, even though some countries (in the
‘South’) are more and more specialised in those sectors. It could be possible that low-skill
industries remain implanted in this area because of the accessibility to the european market. If
it is not the case, these industries will be less and less located in the euro-mediterranean area
following the international trade liberalisation.
In this part, our aim is to understand which factors explain the production of low-
technology industries in the South. We are no longer interesting in countries’ relative
specialisation patterns. The location quotient is thus irrelevant here.
In this analysis, the dependent variable is the relative share of low-technology
industries (l) in the GDP of each Southern country (s)33. By using this variable it is possible to
focus on production (and not on specialisation) and correct it for countries’ size to avoid
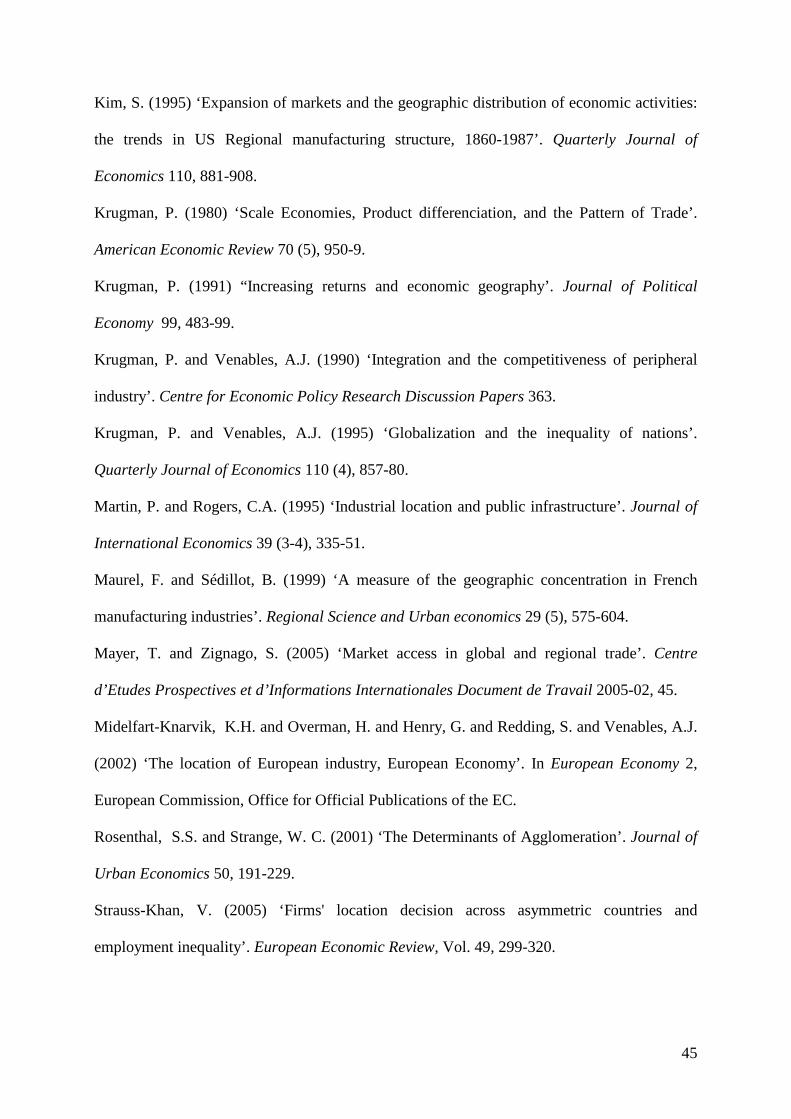
misinterpretation. Production (lstP ) is then regressed on the wages (lstSal ), the penetration
index ( lstTp ) and the access to the European market34( stA ) :
33 The database is then composed by 8 countries, 11 industries and 16 years. 34 The variables are presented in appendix C.
Random effects modelProduction (Plst)Explicative variables Relative wages (slst) -0,19D-06 (-3,26)Penetration index (tplst) -0,12 (-2,06)Access to the european market (ast) -0,12D-11 (-3,93)Constant 0,02 (4,0)Number of observations 1408country effects 89,85sector effects 1947,76Lagrange multiplier test 22104,55Hausman test 43,85**
35
Table 6 : Fields' decomposition of factor contributions to Pijt inequality