24
©2015 MasterCard. Proprietary and Confidential Industry Benchmarking Trends Metrics and Methods to Drive Program Growth ©2014 MasterCard. Proprietary and Confidential
| Date post: | 22-Mar-2018 |
| Category: |
Documents |
| Upload: | nguyenmien |
| View: | 215 times |
| Download: | 1 times |

©2015 MasterCard. Proprietary and Confidential
Industry Benchmarking Trends Metrics and Methods to Drive Program Growth
©2014 MasterCard. Proprietary and Confidential

©2015 MasterCard. Proprietary and Confidential
• Provide market level research and insights on
purchasing and travel card program trends
• Highlight role of virtual cards in Electronic Accounts
Payable (EAP) programs as key driver of growth
• Introduce key benchmarks for purchasing and
travel card programs
Presentation objectives
May 18, 2015
Page 2

©2015 MasterCard. Proprietary and Confidential Page 3
Check use for B2B payments is declining
rapidly in the US
• The drivers of electronic payments are:
– Cost savings
– Improved cash forecasting
– Fraud risk reduction
• The top barriers to the adoption of
electronic payments
– Convincing trade partners to
make/receive electronic payments
– Shortage of IT resources
– Lack of a standard format
– Lack of integration
Check use for business payments continues to decline in favor of electronic methods
* Source: 2013 Association of Financial (AFP) Professional Electronic Payments Survey May 18, 2015

©2015 MasterCard. Proprietary and Confidential
• B2B – Total
Purchasing Card
market expected to
grow 9% CAGR over
next 5 years, versus
11% CAGR for past 5
years.
• T&E – Corporate card
market expected to
grow 3% CAGR over
next 5 years, or at
same rate as past 5
years.
B2B and T&E card program growth
May 18, 2015
Page 4
$120 $131
$143 $157 $152
$138 $156
$164 $168 $173 $178 $184 $191 $198
Purchasing Card (B2B) Spending
Travel Card (T&E) Spending
3% 3%
11%
9%
Source: RPMG 2014 Purchasing Card Benchmark Survey Results

©2015 MasterCard. Proprietary and Confidential
May 18, 2015
B2B Payments
Page 5

©2015 MasterCard. Proprietary and Confidential Page 6
Within B2B, growth driven by Electronic Accounts Payable (EAP) usage
8%
17%
25%
35%
45%
9%
20%
30%
42%
54%
11%
24%
37%
53%
69%
0%
10%
20%
30%
40%
50%
60%
70%
80%
2014 2015 2016 2017 2018
Traditional Pcard
All Pcard Platforms
Electronic Accounts Payable
Spending in EAP accounts is expected grow by 69% by 2018 vs. 45% on traditional Purchasing card (plastic, cardless & ghost accounts)
May 18, 2015 Source: RPMG 2014 Purchasing Card Benchmark Survey Results
©2015 MasterCard. Proprietary and Confidential
May 18, 2015
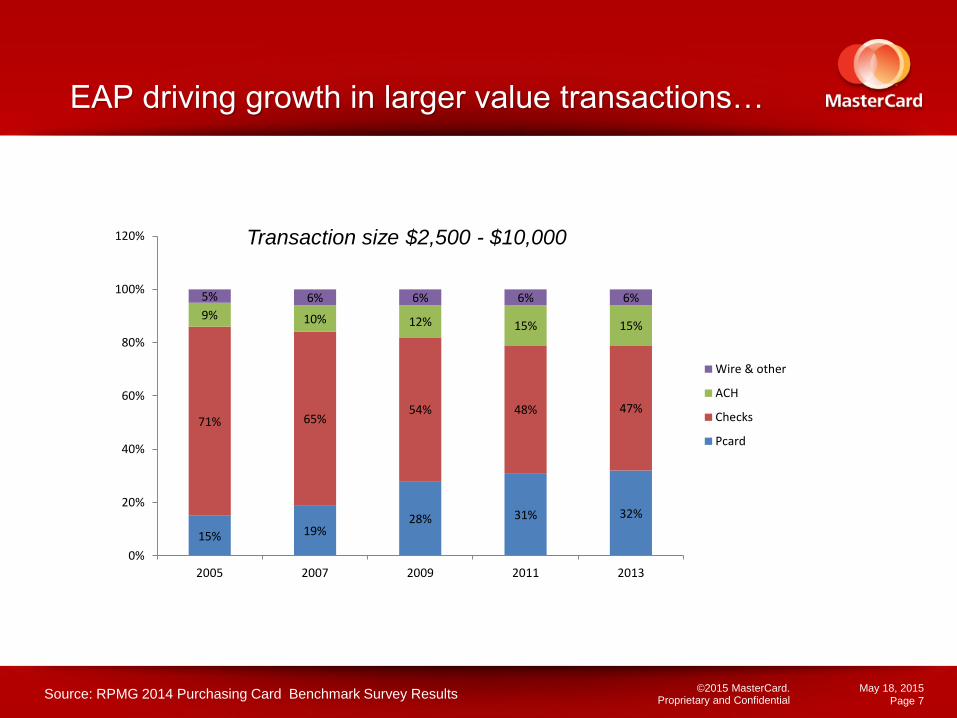
EAP driving growth in larger value transactions…
Page 7
15% 19% 28% 31% 32%
71% 65% 54% 48% 47%
9% 10% 12% 15% 15%
5% 6% 6% 6% 6%
0%
20%
40%
60%
80%
100%
120%
2005 2007 2009 2011 2013
Wire & other
ACH
Checks
Pcard
Transaction size $2,500 - $10,000
Source: RPMG 2014 Purchasing Card Benchmark Survey Results

©2015 MasterCard. Proprietary and Confidential
May 18, 2015
… and new categories of spend
Page 8 Source: RPMG 2014 Purchasing Card Benchmark Survey Results
©2015 MasterCard. Proprietary and Confidential
Program optimization continues to be a key trend for B2B expansion
1. Virtual accounts are moving from traditional use-cases to other
vertical opportunities
2. Increasing Supplier Acceptance of EAP payment is one of the
primary goals for companies looking to optimize their spend
3. Integration with players in the B2B payments ecosystem is
increasingly important to effectively tap into B2B payment flows
4. Optimization – B2B can be complex and more and more corporates
are seeking assistance to optimize their B2B payment programs
May 18, 2015
Page 9

©2015 MasterCard. Proprietary and Confidential
May 18, 2015
Program optimization steps – what actions Best Practice organizations take that matter most
Page 10
Key Purchasing Card benchmarks for
B2B programs:
1. Organizational metrics
2. Transaction capture and
cardholder spending activity
3. Percent of organizations using
Purchasing Card to pay for goods
and services
Source: RPMG 2014 Purchasing Card Benchmark Survey Results

©2015 MasterCard. Proprietary and Confidential
May 18, 2015
B2B Benchmarks
Page 11

©2015 MasterCard. Proprietary and Confidential
May 18, 2015
1. Organization metrics
Page 12
B2B benchmarks
Source: RPMG 2014 Purchasing Card Benchmark Survey Results

©2015 MasterCard. Proprietary and Confidential
May 18, 2015
2. Transaction capture and cardholder spending activity
Page 13
B2B benchmarks
Source: RPMG 2014 Purchasing Card Benchmark Survey Results

©2015 MasterCard. Proprietary and Confidential
May 18, 2015
3. Percent of organization using Purchasing Card to pay for goods and services
Page 14
Goods Services
B2B benchmarks
Source: RPMG 2014 Purchasing Card Benchmark Survey Results

©2015 MasterCard. Proprietary and Confidential
May 18, 2015
Travel Card
Page 15

©2015 MasterCard. Proprietary and Confidential
For travel card, best practice programs capture 37% more spend
81%
53%
7%
13%
4%
1%
5%
16%
3%
17%
Best Practice Needs Improvement
Company check, ACH, or cash advance
Employee pays with personal cash, check,or credit card
Prepaid travel cards, meeting cards, orother non-travel charge cards
Ghost and EAP accounts
Plastic corporate travel card account heldby employee
92% Captured on Card Products
67% Captured on Card Products
By moving “Needs Improvement” companies into “Best Practice” performers, a $40M T&E program could capture an additional $3.7M more on card on just air, lodging, and auto rental alone.*
May 18, 2015
Page 16
37% higher
Source: RPMG 2013 Travel Card Benchmark Survey Results, MasterCard Analysis

©2015 MasterCard. Proprietary and Confidential
May 18, 2015
Businesses should evaluate performance against Best Practice metrics for Travel Card programs
Page 17
Key Travel Card benchmarks for T&E programs:
1. Organizational metrics
2. Expense report processing metrics
3. Travel spend by payment method
4. Percentage of spend captured by category
5. Travel booking practices and integration levels
©2015 MasterCard. Proprietary and Confidential
May 18, 2015
Travel Card Benchmarks
Page 18

©2015 MasterCard. Proprietary and Confidential
May 18, 2015
1. Organizational metrics
Page 19
T&E benchmarks
Organization Statistics and Travel Card Program Performance Measures by "Best Practice" and "Needs Improvement"
Best Practice
Needs
Improvement
Percent
Difference
Organization Statistics
Number of employees 13,275 13,438 -1%
Annual sales revenue 5,782,543,281$ 5,900,129,467$ -2%
Annual travel budget 26,510,471$ 26,307,018$ 1%
Travel budget as % of sales revenue* 0.75% 0.76% -1%
Age of travel card program 9.84 9.05 9%
Program Performance Measures
Number of travel cards 3,030 1,465 107%
Percent of employees that travel on business more than
twice per year 25.7% 21.1% 22%
Card-to-employee ratio 22.8% 10.9% 109%
Average monthly travel card spending $3,569,629 $1,259,793 183%
Median monthly travel card spending $2,776,389 $767,500 262%
Monthly travel card transactions 17,798 6,958 156%
Monthly travel card spending per employee $269 $94 186%
Percent of travel spending captured on travel crds
(including plastic, ghost, and EAP) 92% 67% 37%
Annual travel card spending as a percent of sales
revenue* 1.39% 0.43% 223%* This is the "average" of the company ratios, and may be different when responses are summed to create a
group statistic
Source: RPMG 2013 Travel Card Benchmark Survey Results

©2015 MasterCard. Proprietary and Confidential
May 18, 2015
2. Expense report processing metrics
Page 20
Key Expense Report Processing Metrics by the Type of Expense Reporting Method in Use
Cycle Time (in
Days)
First Pass
Quality
Time (in
Minutes) to
Process
Expense
Report*
"End-to-End"
Process Cost
of Expense
Report
Expense Reporting Method
Paper-based expense report
processing 9.7 76% 72 $40.05
Electronic, pre-populated with travel
card data 8.9 81% 40 $22.88
Electronic, not pre-populated with
travel card data 8.9 82% 57 $32.29
Travel card statement used in place of
expense report 9.3 86% 51 $28.51
* Processing time includes (a) employee completion of an expense report (including identification an input of travel expense data and
attachment of appropriate receipts), (b) the combined time of all supervisory review(s) of expense report submitted, (c) clerical
processes to prepare an expense report for payment (including data input, verifying calculations, review/input of accounting codes,
and evaluation/reconciliation of invoices to expense report), and (d) clerical/accounting processes to reimburse employee and
reconcile payment to bank data.
Type of Expense Report Processing Method
Best PracticeNeeds
Improvement
Expense Reporting Method
Expense reports are completed
manually and submitted in paper format
10% 19%
Expense reports are electronic but not
pre-populated with travel card spending
data
8% 23%
Expense reports are electronic and pre-
populated with travel card spending
data
78% 54%
Traveler uses travel card spending
statements as the expense report1% 4%
Other 3% 0%
RPMG 2013 Travel Card Benchmark Survey, Exhibit 75
T&E benchmarks
Source: RPMG 2013 Travel Card Benchmark Survey Results

©2015 MasterCard. Proprietary and Confidential
May 18, 2015
3. Travel spend by payment method
Page 21
T&E benchmarks
Source: RPMG 2013 Travel Card Benchmark Survey Results

©2015 MasterCard. Proprietary and Confidential
May 18, 2015
4. Percentage of spend captured by category
Page 22
Pecentage of Spend by Category
Best PracticeNeeds
Improvement
Percentage of Total Spending withing Category
Paid with Travel Cards
Airfare 89% 77%
Lodging 85% 68%
Auto Rentals 85% 62%
% Using Travel Card Data to Obtain Discont On:
Airfare 74% 68%
Lodging 86% 80%
Auto Rentals 87% 83%
% of Organizations Reporting Travel Card Data as
"Important" or "Very Important" to the Discount
Obtained on:
Airfare 72% 40%
Lodging 68% 45%
Auto Rentals 74% 38%
RPMG 2013 Travel Card Benchmark Survey, Exhibit 68
T&E benchmarks
Source: RPMG 2013 Travel Card Benchmark Survey Results

©2015 MasterCard. Proprietary and Confidential
May 18, 2015
5. Travel booking practices and integration levels
Page 23
Travel Booking Practices and Level of Integration
Best PracticeNeeds
Improvement
Travel Booking Policies
Travel is booked through a specific
travel agent or with a travel agency
online booking tool
89% 84%
Travel is booked through a specific
consumer online booking tool1% 8%
Travel is booked directly with a
particular service provider3% 1%
Employees book their own travel
arrangements as they see fit7% 7%
Level of Integration between Booking
Software and Expense Reporting System
No integration 46% 59%
Low integration 8% 14%
Moderate integration 13% 5%
High integration 33% 22%
RPMG 2013 Travel Card Benchmark Survey, Exhibit 77
T&E benchmarks
Source: RPMG 2013 Travel Card Benchmark Survey Results

THANK YOU


