IIMB-WP N0. 475 1 WORKING PAPER NO: 475 INFLATION TARGETING IN INDIA: SELECT ISSUES Charan Singh RBI Chair Professor Economics & Social Science Indian Institute of Management Bangalore Bannerghatta Road, Bangalore – 5600 76 Ph: 080-26993818 [email protected]Year of Publication – November 2014
Transcript
IIMB-WP N0. 475
1
WORKING PAPER NO: 475
INFLATION TARGETING IN INDIA: SELECT ISSUES
Charan Singh RBI Chair Professor
Economics & Social Science Indian Institute of Management Bangalore Bannerghatta Road, Bangalore – 5600 76
1 RBI Chair Professor of Economics, IIM Bangalore. Views are personal. The author would like to thank Jafar Baig, Sriramjee Singh, Sharada Shimpi and Shara Bhattacharjee for their research assistance.
IIMB-WP N0. 475
3
Introduction
Inflation Targeting could be the next major policy measure adopted in India as the proposal is
under active consideration by the Reserve Bank of India (RBI) and the Government of India
(GOI). In recent years, there has been a debate on the monetary policy framework in the country,
basically anchored around the philosophy of adopting inflation targeting (IT) in India.
What is Inflation Targeting?
IT targets the inflation rate and not the price level and is distinct from monetary targeting and
interest rate targeting. IT regime assumes that price stability is explicitly the mandate; a
quantitative target for inflation is publicly announced; monetary policy is based on an inflation
forecast; there is transparency in monetary operations; and that accountability mechanism is in
place (Roger, 2010; Hammond, 2012).
Evolution of Inflation Targeting
The key policy objective of central banking is price stability, and the concept of giving it a
numerical precision was considered very modern after monetary and exchange rate targeting had
failed in the 1980s. The hunt for a better target led to experimentation with a “checklist” of
economic indicators by Australia in mid-1980s and explicit squeezing of inflations rate by New
Zealand by late eighties (Singleton, 2011). After some trials and initial success, the IT regime was
formally inaugurated in March 1990 in New Zealand with the negotiation of the first Policy
Targets Agreement between the Government and the central bank. Historically, some countries, of
which a few at the push of the International Monetary Fund (IMF), switched to IT after the
successful adoption by New Zealand (1990), Canada (1991), and UK (1992). The spread of IT was
contagious and according to Mahadeva and Sterne (2000), 54 countries had adopted IT by 1998.
And, by 2004, according to Rose (2007) formal inflation targeting was in place in a number of
countries making up one-quarter of world economy. The situation changed after the recent
financial crisis and rethinking of the economic strategies that went wrong before 2008 compelling
many economists and policy makers to conclude that the role of economic blinkers that IT imposed
on the policy makers cannot be ignored (Frankel, 2012). Marcus (2014)2 observed that application
of IT in an emerging country like South Africa faced many challenges - opposition of the trade 2 Governor, South African Reserve Bank, in a speech at Pretoria, October 30, 2014.
IIMB-WP N0. 475
4
union; disagreement on limits of transparency; arguments whether IT regime was sufficient to
ensure price stability; and finally, questions of the level of targets. It probably is for similar reasons
that none of the countries have adopted IT after 2008, except Japan in 2013 but with a different
motivation.
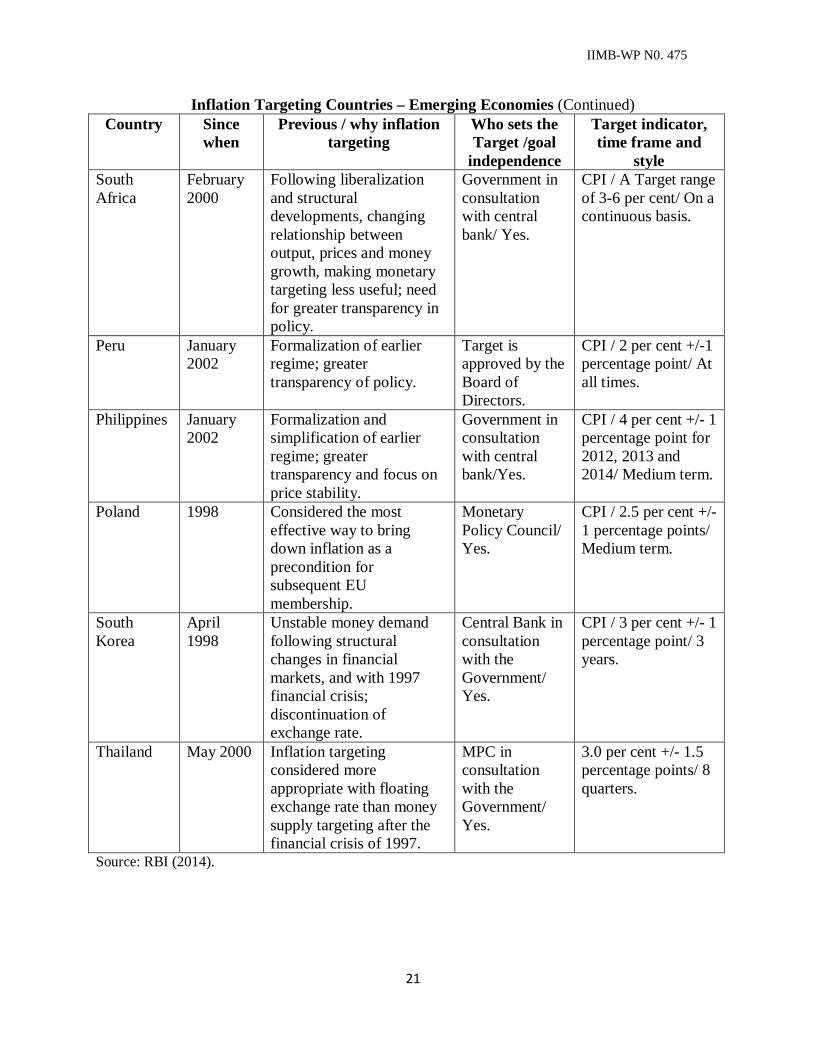
The price indices used for inflation targeting, the target band for inflation, the horizon and the
speed of approach to inflation targeting and the penalty for not adhering to the target is different
for different countries even if analysed amongst the advanced and emerging countries (Annex I
and II). Most of the countries use CPI (Consumer Price Index) as the index for targeting inflation
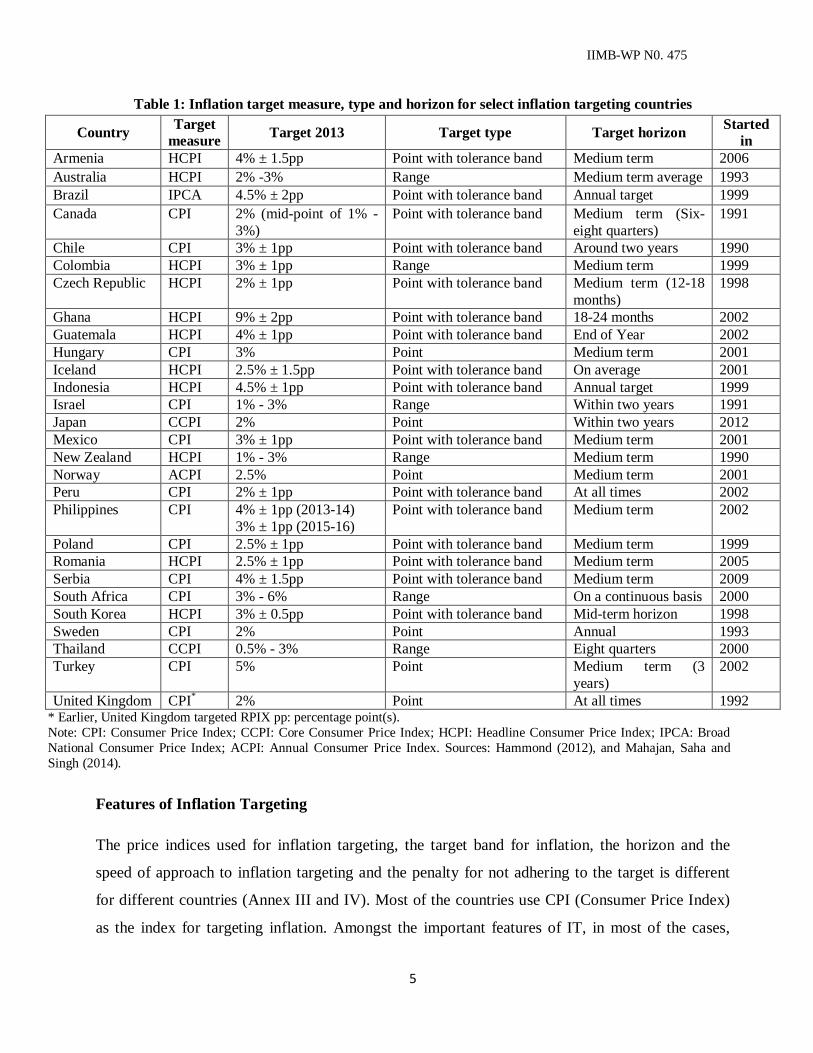
(Table 1). Also, the target horizon is about two to three years.
IIMB-WP N0. 475
5
Table 1: Inflation target measure, type and horizon for select inflation targeting countries
Country Target measure Target 2013 Target type Target horizon Started
in Armenia HCPI 4% ± 1.5pp Point with tolerance band Medium term 2006 Australia HCPI 2% -3% Range Medium term average 1993 Brazil IPCA 4.5% ± 2pp Point with tolerance band Annual target 1999 Canada CPI 2% (mid-point of 1% -
3%) Point with tolerance band Medium term (Six-
eight quarters) 1991
Chile CPI 3% ± 1pp Point with tolerance band Around two years 1990 Colombia HCPI 3% ± 1pp Range Medium term 1999 Czech Republic HCPI 2% ± 1pp Point with tolerance band Medium term (12-18
months) 1998
Ghana HCPI 9% ± 2pp Point with tolerance band 18-24 months 2002 Guatemala HCPI 4% ± 1pp Point with tolerance band End of Year 2002 Hungary CPI 3% Point Medium term 2001 Iceland HCPI 2.5% ± 1.5pp Point with tolerance band On average 2001 Indonesia HCPI 4.5% ± 1pp Point with tolerance band Annual target 1999 Israel CPI 1% - 3% Range Within two years 1991 Japan CCPI 2% Point Within two years 2012 Mexico CPI 3% ± 1pp Point with tolerance band Medium term 2001 New Zealand HCPI 1% - 3% Range Medium term 1990 Norway ACPI 2.5% Point Medium term 2001 Peru CPI 2% ± 1pp Point with tolerance band At all times 2002 Philippines CPI 4% ± 1pp (2013-14)
3% ± 1pp (2015-16) Point with tolerance band Medium term 2002
Poland CPI 2.5% ± 1pp Point with tolerance band Medium term 1999 Romania HCPI 2.5% ± 1pp Point with tolerance band Medium term 2005 Serbia CPI 4% ± 1.5pp Point with tolerance band Medium term 2009 South Africa CPI 3% - 6% Range On a continuous basis 2000 South Korea HCPI 3% ± 0.5pp Point with tolerance band Mid-term horizon 1998 Sweden CPI 2% Point Annual 1993 Thailand CCPI 0.5% - 3% Range Eight quarters 2000 Turkey CPI 5% Point Medium term (3
years) 2002
United Kingdom CPI* 2% Point At all times 1992 * Earlier, United Kingdom targeted RPIX pp: percentage point(s). Note: CPI: Consumer Price Index; CCPI: Core Consumer Price Index; HCPI: Headline Consumer Price Index; IPCA: Broad National Consumer Price Index; ACPI: Annual Consumer Price Index. Sources: Hammond (2012), and Mahajan, Saha and Singh (2014).
Features of Inflation Targeting
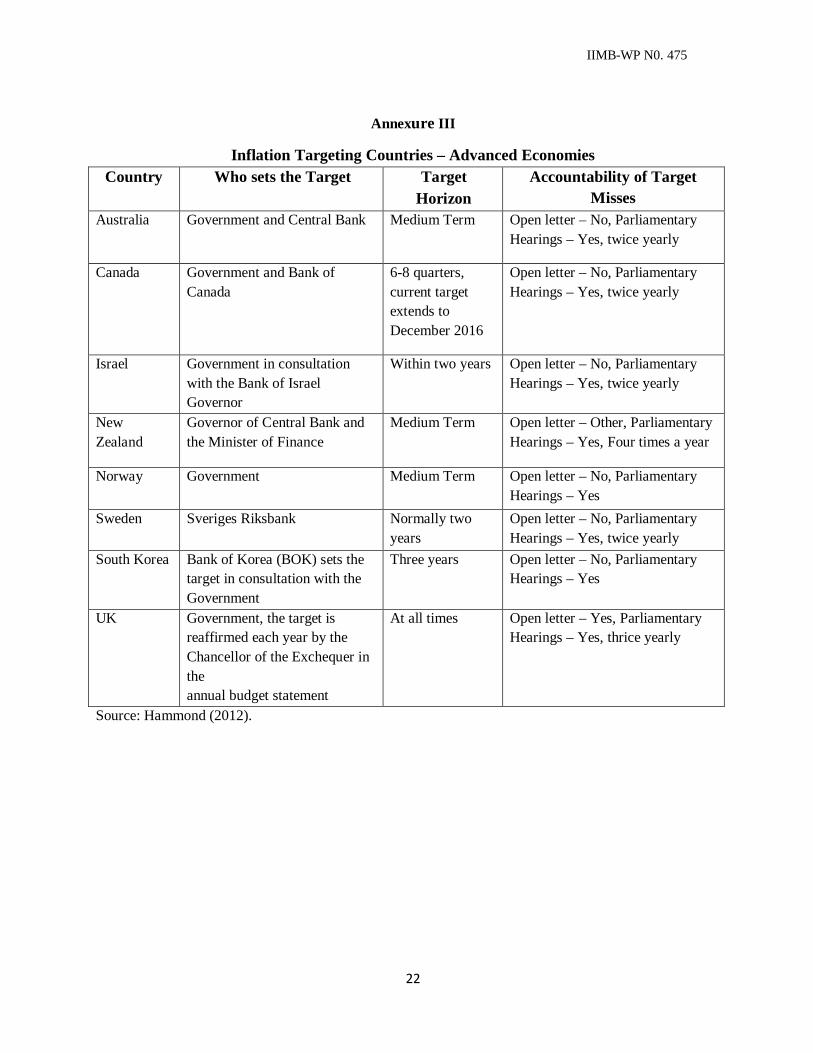
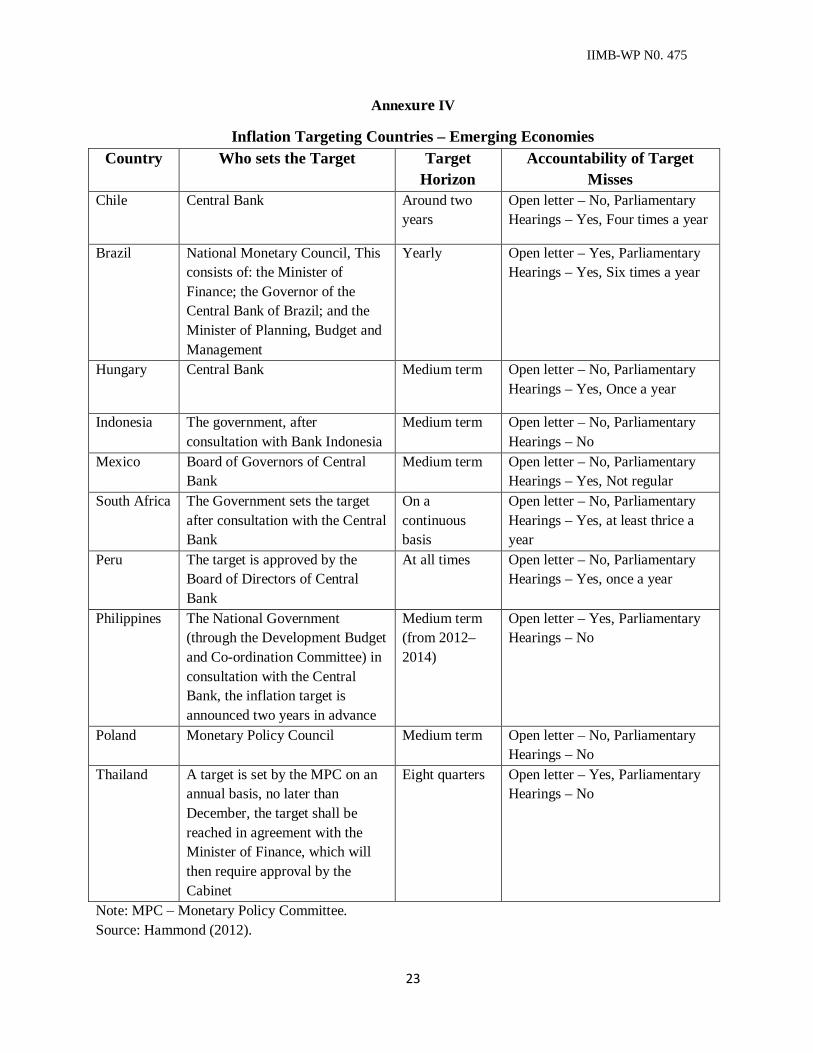
The price indices used for inflation targeting, the target band for inflation, the horizon and the
speed of approach to inflation targeting and the penalty for not adhering to the target is different
for different countries (Annex III and IV). Most of the countries use CPI (Consumer Price Index)
as the index for targeting inflation. Amongst the important features of IT, in most of the cases,
IIMB-WP N0. 475
6
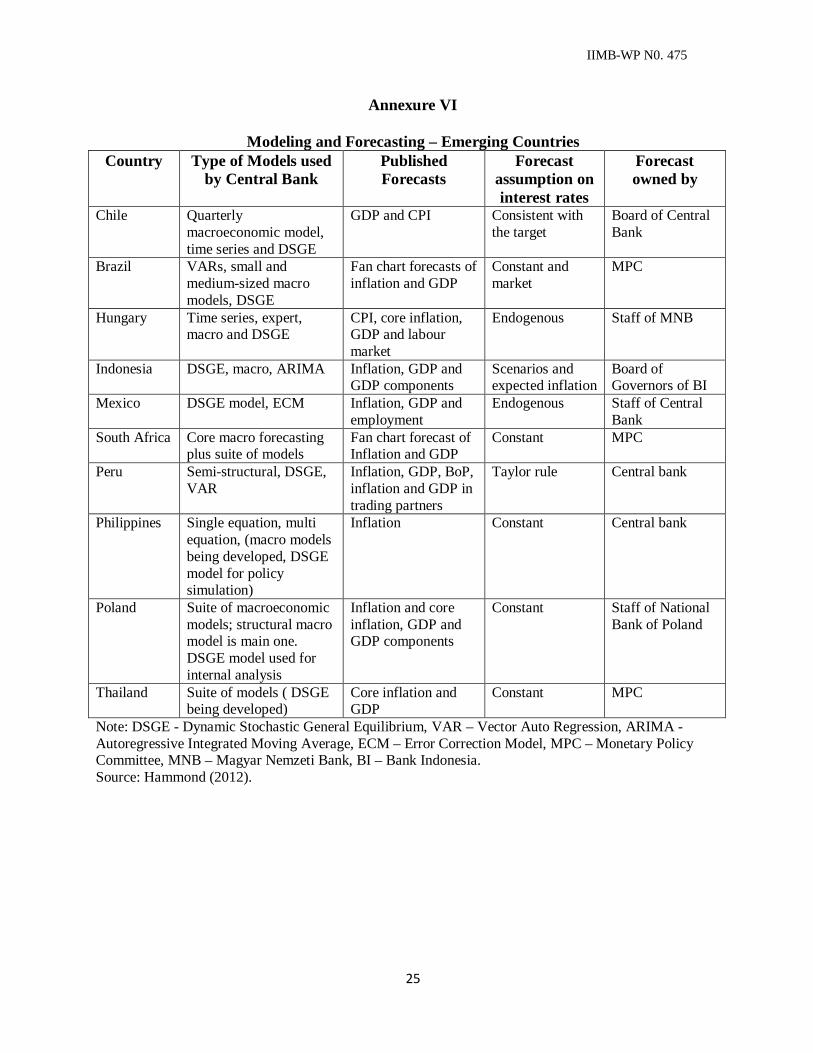
target horizon for operation is six to eight quarters and in some cases, even three years. In most of
the cases, sophisticated models like dynamic stochastic general equilibrium (DSGE) models,
autoregressive time series models and semi-structural models are used taking into account
quarterly data (Annex V and VI). To inspire confidence in the market, in almost all the cases,
forecasts are regularly and transparently disseminated along with the assumptions.
Experience with Inflation Targeting
Inflation targeting ushered in transparency and accountability in the monetary policy framework
but was criticized by Keynesians and monetarists for causing unemployment and monetary
brutalism (Davidson, 2006). Another common criticism was that it ignored asset prices (Singleton,
2011). Also, most damaging was the fact that there was no conclusive proof that IT resulted in
lower and less variable rates of inflation (Ball and Sheridan, 2003; Borio and Filardo, 2007). In
fact, in advanced countries, it emerged that IT and non-IT countries conduct monetary policy in a
similar way – applying the Taylor Rule (TR), named after the famous Professor John Taylor of
Stanford University. Also, interest rate adjustments are attempted by the central bank based
implicitly on TR which implies calculation and forecast of output gap and deviations of inflation
from the stipulated target. The estimation and forecast of output gap, and interest rate path involve
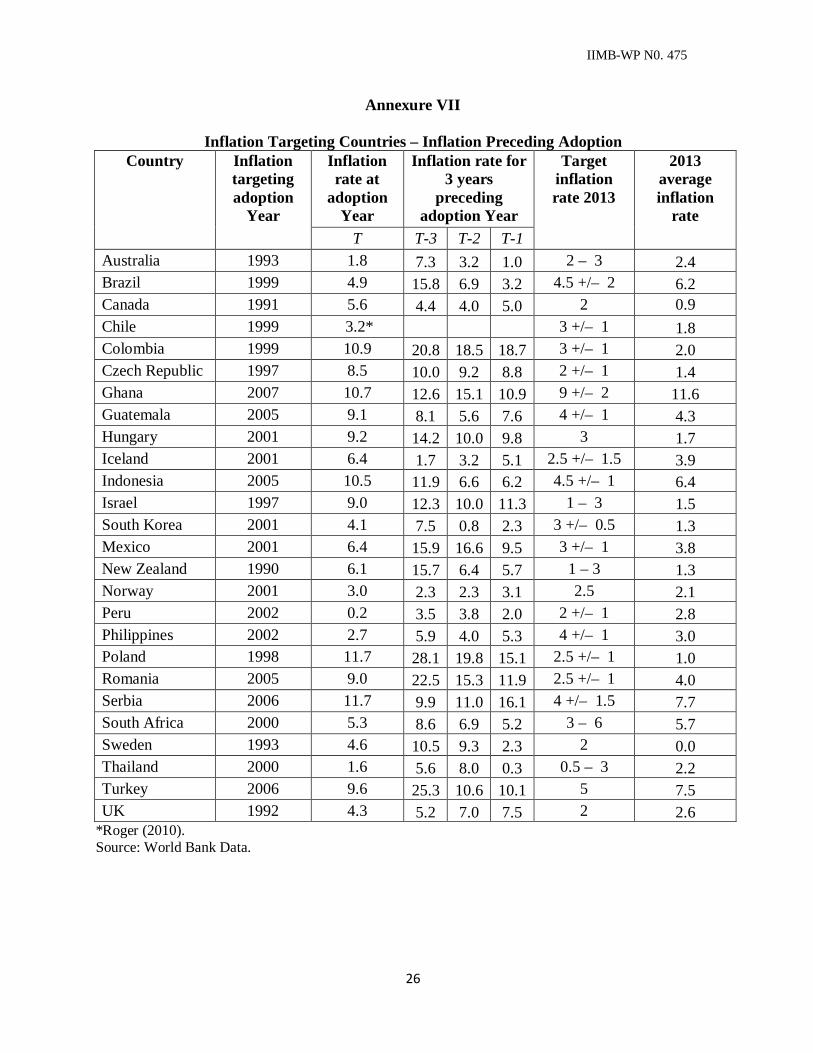
use of many sophisticated econometric tools. Thus, adoption of IT was necessary as the level of
inflation was higher than normally expected in most of the countries in the years before adoption
(Annex VII). Marcus (2014) on reviewing the experience of South Africa cautions that IT involves
many contentious issues especially when applied to emerging markets which are distinct from
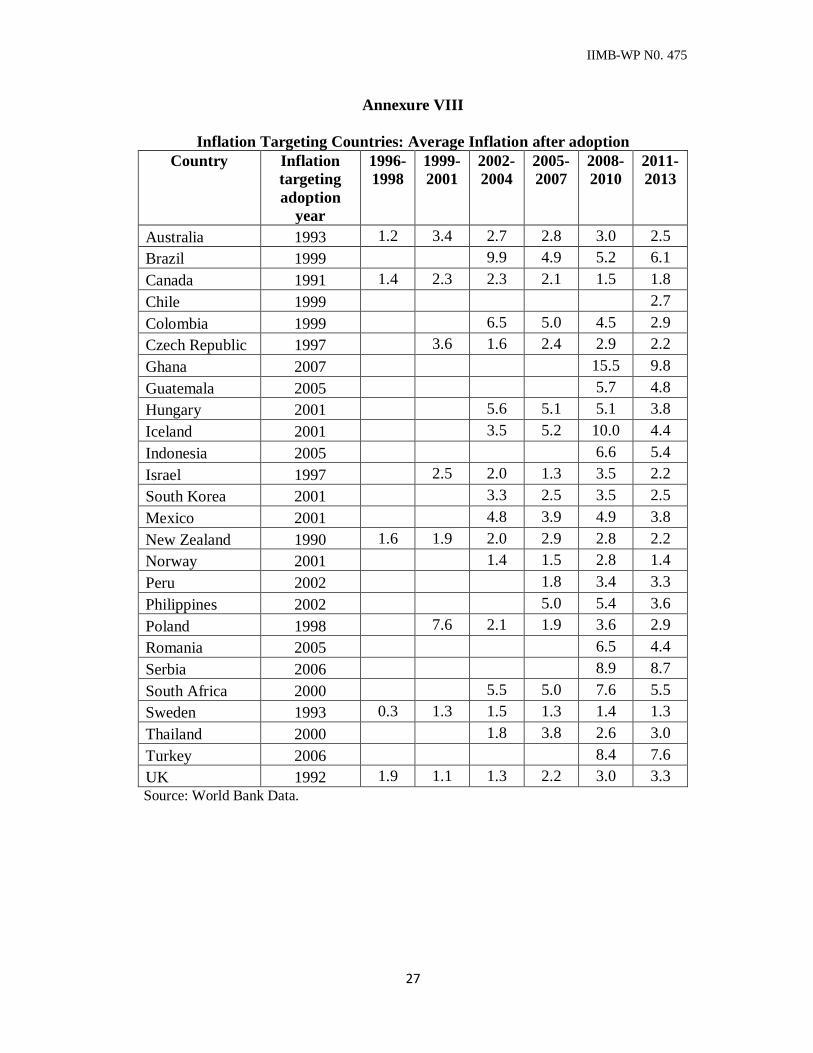
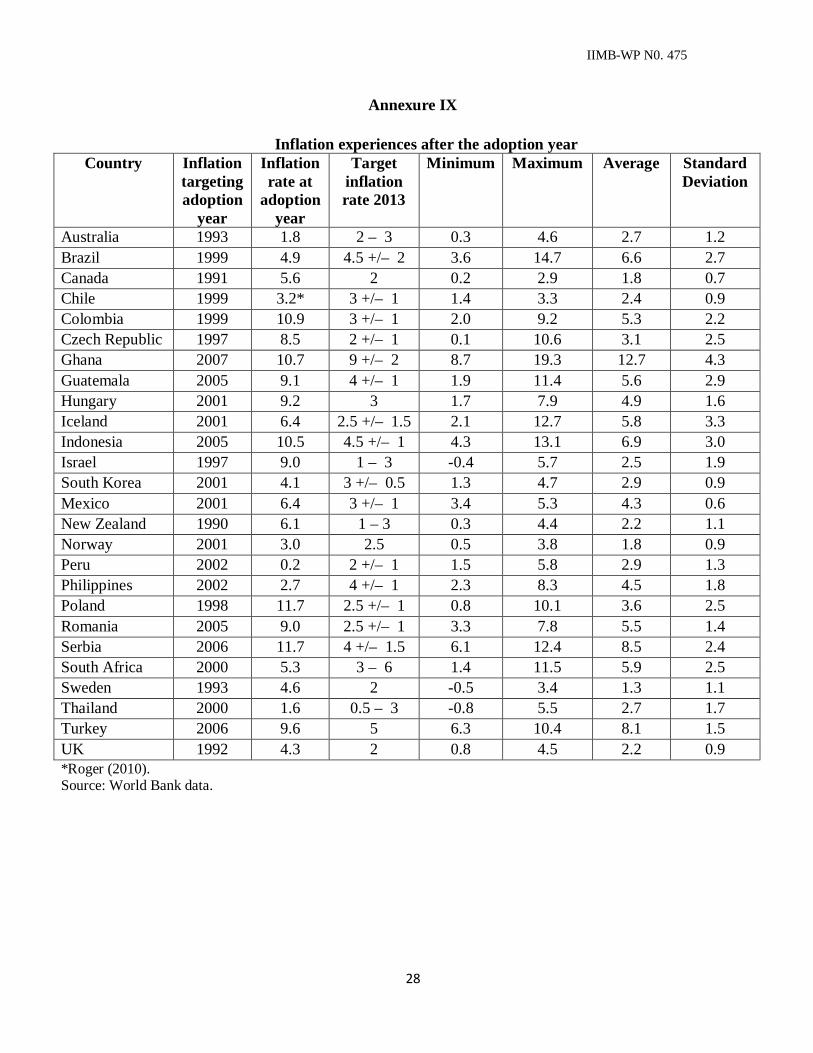
those faced by advanced countries. In fact, in most of the cases, targeters did not benefit much
from the adoption of IT as statistical analysis reveals that inflation has been volatile in most of the
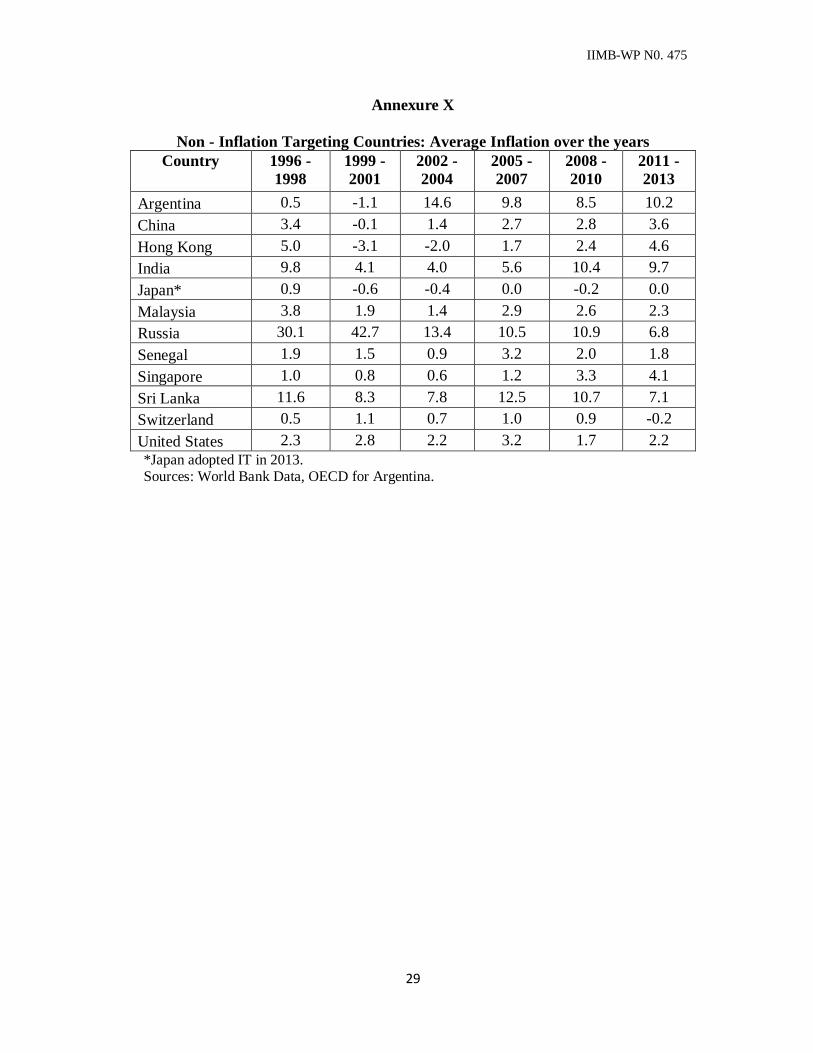
countries even after adoption of IT (Annex VIII and IX). Also, inflation has not been very high in
most of the countries which did not adopt IT (Annex X).
Inflation targeting and India
The argumentative Indians have been debating the adoption of IT for nearly two decades. In
different publications of the RBI (1996; 1997) the issue of IT was discussed. Again, in 1999, a
general discussion on inflation targeting in India started after the L. K. Jha Memorial lecture by the
Governor of the Reserve Bank of New Zealand in 1999 on how New Zealand’s experience with IT
IIMB-WP N0. 475
7
can be relevant for developing countries (Brash, 1999). Further, a number of Committees set up by
the RBI (2000), GoI (2007) and Planning Commission (2009) also recommended the
implementation of IT. The debate received a fresh impetus when Rajan (2013), in his first speech
as RBI Governor, again emphasized the importance of low and stable inflation for Indian monetary
policy and thereafter, in January 2014 the Expert Committee of the RBI to Revise and Strengthen
the Monetary Policy Framework (RSMPF) submitted the report recommending adoption of IT by
January 2016 with headline CPI as a nominal anchor.
India does not have an implicit IT regime but generally, in policy making, general price level was
an important consideration given the living standards, size of informal sector and incidence of
poverty. Therefore, India has always been a low inflation country compared to other countries,
especially amongst emerging and developing countries. In India, inflation measured by a
traditional measure of Wholesale Price Index, started before independence, has been generally less
than 9 percent and if measured by the Consumer Price Index (industrial workers) less than 10
percent (Mahajan, Saha and Singh, 2014).
The application of IT could be riddled with many difficulties (Reddy, 1999; Jalan, 2000; Gupta
and Sengupta, 2014). The most important consideration in India is supply side constrains that
contribute to inflationary pressures, especially for food items and fuel. A related aspect is lack of
critical appreciation of supply constraints. To illustrate, recently, when onion prices were shooting
up, an influential segment of population was happily concluding that farmers, an important vote
bank, are the beneficiaries. The recognition of causes and economic implications of such “onion”
episodes is lacking in policy making. In India, where still about two-third of agriculture is
dependent on rain, and suitable supply-chain is lacking, supply side factors would continue to play
a significant role in food prices.
In view of the fact that food prices are dependent on monsoons, the ensuing climate change is
expected to put pressure on the food prices. In addition, food prices have been stubborn in recent
years and are also impacted by the minimum support prices (MSP) of food grains which despite
having risen significantly in recent years, are under pressure for further revisions on account of
rising cost of farm equipment (Sonna et al., 2014; Gupta and Siddiqui, 2014). The Food Security
Act, 2013, (FSA) which has assured food availability to nearly 80 crore people in the country are
also expected to distort food prices. FSA has already begun to change the cropping pattern
IIMB-WP N0. 475
8
implying that though land area under food grains would increase that for other agricultural
products including onion and vegetables would decline. This is in addition to shrinking land use
for agriculture on account of expanding urbanization. Further, in India, given the demographic
factors, increasing demand for protein-rich food would cause persistent pressure on food items. In
view of the size of demand in the country, imports could only be an expensive alternative, if any.
Geo-political situation like sanctions by Western countries against Russia would also imply that
such demand for vegetables, fruits and protein rich food could be diverted to India.
In the CPI, weight of food is high, illustratively, 47.58 per cent for the combined, 35.80 per cent
for urban and 56.58 per cent for rural CPI. In addition, food prices were also impacted by fuel
prices, and the weight for fuel and light is 9.49 per cent in combined CPI, 10.42 per cent in rural
and 8.40 per cent in urban CPI. Thus, weights of food and fuel account for more than 57 per cent
of CPI-Combined and 67 per cent for CPI-Rural. Hence, the pressure to contain the overall price
level in combined headline CPI would be significantly large for non-food and non-fuel items.
Inflation targeting in such regime would imply that when food prices increase, the prices of
manufactured, services, housing and other miscellaneous items would need to decline.
Moreover, in India the arguments against inflation are constantly neglecting the demographic
aspect. In this context, there has been some good research from Japan. Shirakawa (2012) argues
that the economic profession does not make a distinction between the qualities of population in
their models of economic growth. The behavior of the ageing population is different from the
young population, as is their productivity and consumption pattern, which impacts the current
account, reflecting the savings-investment gap in the economy. The "spending wave" hypothesis is
associated with young population and Shirakawa (2012) refers to empirical studies correlating
inflation with population growth rate in 24 advanced countries. Bullard, Garriga and Waller (2012)
find that a young population generates high inflation and ageing population places downward
pressure on inflation. Ikeda and Saito (2012) using a dynamic general equilibrium model report
that ageing lowers real interest rates in the economy, implying lowering of inflation. Finally,
Nishimura (2011), argued that in Japan, the US, and some other countries, asset markets are
correlated to the working age population, and that bubbles coincide with turning points in
demographic trends.
IIMB-WP N0. 475
9
Blanchard, Dell’ Ariccia and Mauro (2010) has been advising countries to raise their inflation
targets, because targets that are set too low impact employment and growth. In traditional
economic theory, there is a trade-off in employment and inflation. In a well-documented recent
research, Dholakia (2014) demonstrates that such a trade-off does exist in India too. In India, given
that unemployment rate, especially amongst the youth is very high, in a young demographic
country, the key aspiration of every family, is employment for the willing individual.
Marcus (2014) observes that policy makers are not independent of the economy or society that
they live in, and therefore a number of factors have to be taken into consideration while taking
decisions. Economics cannot be isolated from general well-being of the society. The Census data
released in July 2014 showed that unemployment in the country especially amongst the youth was
very high, averaging nearly 20 percent for the age group of 15 to 24 years. In some states like
Chhattisgarh, Madhya Pradesh, West Bengal, Rajasthan, Himachal Pradesh, and Jammu and
Kashmir, unemployment rate was above 25 percent.
In the political economy literature, the central banker has to be conservative in approach with a
basic aim to target the inflation rate. But also, it is necessary to signal to the market and analysts
that the central bank and the government are in alignment on major economic issues. In fact, the
issue of tolerance level of inflation in India needs a review to meaningfully anchor inflationary
expectations. In India, 92 percent of the population was less than 60 years in 2010, compared to
about 80 percent in advanced countries like Australia, Canada, New Zealand and the UK.
Similarly, the proportion of people below 14 years was higher than 30 percent in India, compared
to less than 20 percent in the above mentioned countries. Therefore, considerations like growth and
employment are important for India.
Modernising the Monetary Policy Framework
The monetary policy framework that has been successfully followed in India and was hailed by the
world during the great recession is the Multiple Indicator Approach (MIA). It may be mentioned
that India was a pioneer in crafting the MIA after the South East Asian Crisis (SEAC) in 1997-98
and constantly monitored various factors before undertaking any monetary policy decision. These
variables, besides inflation, include indicators pertaining to external, financial, banking and real
sector. Thus, monetary policy under the MIA had a human face and was not mechanically tied to a
IIMB-WP N0. 475
10
single numerical value. MIA involves lots of hard work as the RBI had always to be carefully
watching various parameters to steer the economy away from any crisis. Consequently, Indian
economy was able to stave off the SEAC and great recession.
The Finance Minister in his maiden Union Budget speech in July 2014 had observed that “it is also
essential to have a modern monetary policy framework to meet the challenge of an increasingly
complex economy. Government will, in close consultation with the RBI, put in place such a
framework.” The objective of monetary policy varies in different countries. In the UK, objective of
monetary policy is to deliver price stability, implying low inflation and, subject to that, to support
the government’s economic objectives including those for growth and employment. In the US,
monetary policy has two basic goals: to promote maximum sustainable output and employment,
and to promote stable prices. In India, according to the RBI Act, 1934, the objectives of the
Reserve Bank are "...to regulate the issue of Bank notes and the keeping of reserves with a view to
securing monetary stability in India and generally to operate the currency and credit system of the
country to its advantage." The formulation, framework and institutional architecture of monetary
policy in India have evolved over time around these objectives – maintaining price stability,
ensuring adequate flow of credit to sustain growth, and securing financial stability.
The monetary policy framework can be modernized by a number of initiatives which are
successfully followed in other countries. In the UK, every month, Agent’s Summary compiled by
the Bank of England’s (BoE’s) 12 agents following discussions with 700 businesses is published to
assist the monetary policy makers in conjunction with intelligence from other sources. Similarly, in
the US, Beige Book, published eight times per year, is based on anecdotal information on current
economic conditions collected by each of the Fed Reserve Banks in their respective districts
through reports and interviews with key business contacts, economists, market experts, and other
sources. The Beige Book is an important source of real time market intelligence for the Fed’s Open
market Committee (FOMC).
Another key component of modern monetary policy is Monetary Policy Committee (MPC) which
consists of members from within the central bank and experts in the country. An advanced country
like the non-inflation targeting USA has twelve members while the UK has nine members. In the
UK, the external members of the MPC are appointed for 3 years by the Chancellor and such
appointments of independent members are designed to ensure that the MPC benefits from expertise
IIMB-WP N0. 475
11
in the area of economics and monetary policy. In India, GOI (2013) and RBI (2014) have also
recommended setting up of the MPC. In general, the MPC is not only expected to be accountable
for the monetary policy decisions that are taken but also bring to the discussion, thinking and
expertise on various aspects of the diverse economy. In absence of the ‘Beige Book’ or ‘Agents
Reports’, containing regional development on near-real time basis, a larger number of MPC
members, with diverse domain expertise, would be a truly representative group and lend credibility
in monetary policy decisions.
Transparency, clear communication and forward guidance are other pillars of modern monetary
policy framework. To enhance transparency in operations, the US Fed prepares a quarterly report
on balance sheet developments in addition to semi-annual reports to the Congress discussing the
conduct of monetary policy and the future prospects along with a testimony from the Fed Reserve
Board Chair. In the UK, minutes of the MPC meetings, with the voting pattern are also released to
public within a fortnight.
The standard practice in the advanced countries is to disseminate research and models that are
being used for forecasting. Since monetary policy takes time to act on output and inflation,
sometimes more than two years, a forward looking assessment is essential. These forecasts are
generally prepared by help of large macroeconometric models. Since adopting IT in October 1992,
BoE has been placing quarterly inflation report in the public domain detailing the BoE’s
assessment of inflation and growth along with methodology of computing fan charts, and
assumptions and models used in forecasting. The inflation report helps to share the BoE’s thinking
with the public, explaining the reasons for the decision. India, a developing and a vast country,
with weak financial markets, and large inequalities of income and industrial development does not
have an effective transmission mechanism of monetary policy.
The other aspect is management of internal debt in which the RBI’s important role could conflict
with its pursuit of the objectives of monetary policy.3 The monetary policy of the RBI partly aims
to provide adequate liquidity and maintain an appropriate interest rate environment (RBI, 2014). In
India, in recent years, interest rates of gilt-edged government securities were substantially lower
and generally steady despite market turbulence than the average lending rate of commercial banks.
3 In the context of the US, the debate is presented in Powell (2014) and Greenwood et al. (2014).
IIMB-WP N0. 475
12
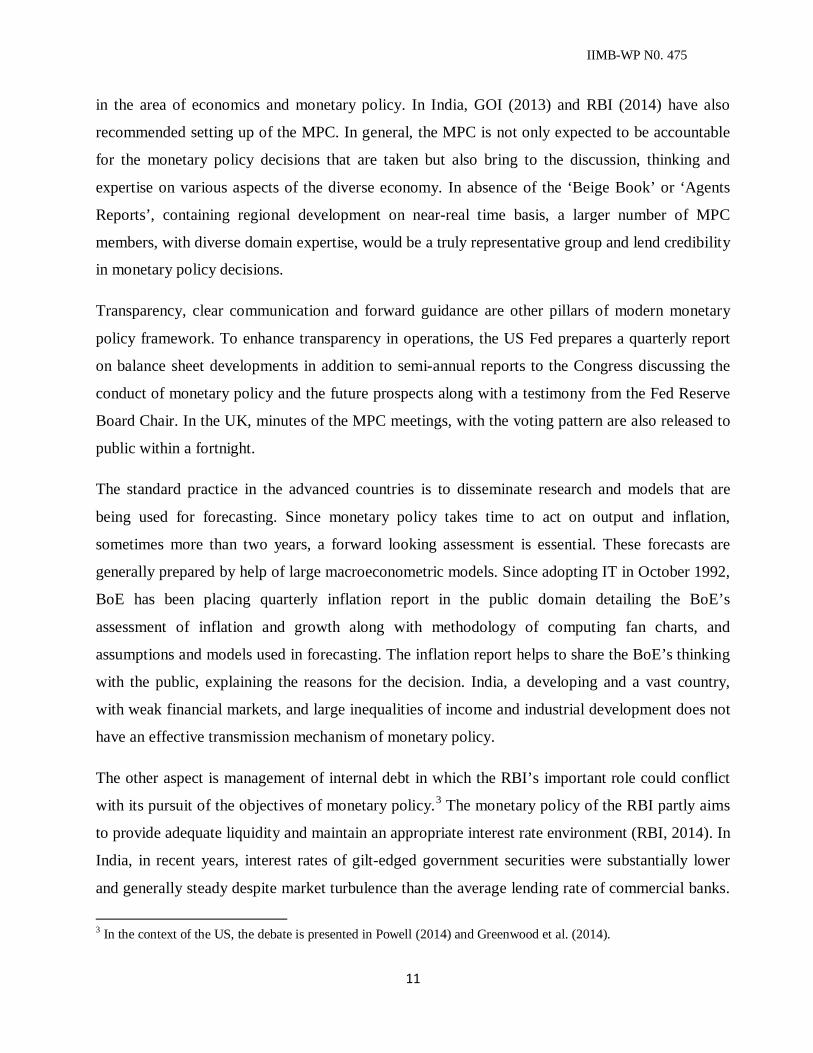
This could be interpreted to imply that RBI makes efforts to ensure government borrowings are at
lower rates of interest which can be substantiated by the fact that there is convergence in yields of
the government securities and OMO auctions (Graph 1).
Graph-1 Weighted Average cut-off yield
Source: RSMPF, RBI (2014).
RBI (2014) acknowledges that open market operations (OMOs) have largely become one-sided in
recent years and resulted in expanding reserve money and indirectly monetising fiscal deficit.
Hence, the recommendation that OMOs should be delinked from fiscal operations and “should not
be used for managing yields on government securities” in RSMPF. This observation indeed is a
grim reminder of the era of ad hoc Treasury Bills which reigned supreme from 1974 to 1993,
camouflaging the actual implications of fiscal deficits. Generally, separation of debt from
monetary management enhances credibility and independence necessary to pursue an inflation
target, which is still uncertain in India.
In a similar context, a statistical analysis of the yield in government securities reveals that there is
a dip during the time of floatation of new securities. Table 2 captures the movements in the yield
of the government securities market. The G-Sec data have been collected from the website of
Clearing Corporation of India Ltd. (CCIL) and information regarding the floatation dates of
government securities with various maturity periods has been obtained from the Reserve Bank of
India. The bonds with 5, 10, 15 and 30 years of maturity period have been selected as the
benchmark maturity years. To calculate the dip in the interest rates, a formula of t-2 has been
applied i.e. two days before each floatation day (date of auction) of various benchmark years have
7.0
7.5
8.0
8.5
9.0
9.5
10.0OMO Auction First Primary Auction subsequent to OMO
IIMB-WP N0. 475
13
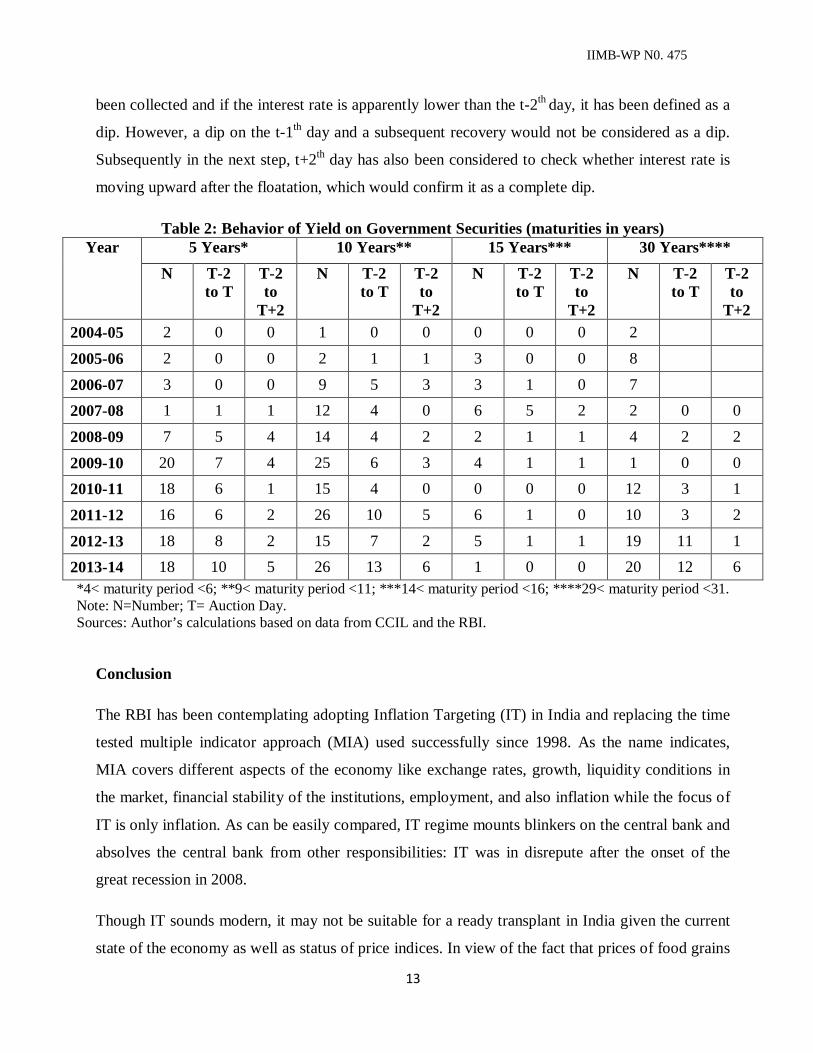
been collected and if the interest rate is apparently lower than the t-2th day, it has been defined as a
dip. However, a dip on the t-1th day and a subsequent recovery would not be considered as a dip.
Subsequently in the next step, t+2th day has also been considered to check whether interest rate is
moving upward after the floatation, which would confirm it as a complete dip.
Table 2: Behavior of Yield on Government Securities (maturities in years) Year 5 Years* 10 Years** 15 Years*** 30 Years****
2012-13 18 8 2 15 7 2 5 1 1 19 11 1 2013-14 18 10 5 26 13 6 1 0 0 20 12 6 *4< maturity period <6; **9< maturity period <11; ***14< maturity period <16; ****29< maturity period <31. Note: N=Number; T= Auction Day. Sources: Author’s calculations based on data from CCIL and the RBI.
Conclusion
The RBI has been contemplating adopting Inflation Targeting (IT) in India and replacing the time
tested multiple indicator approach (MIA) used successfully since 1998. As the name indicates,
MIA covers different aspects of the economy like exchange rates, growth, liquidity conditions in
the market, financial stability of the institutions, employment, and also inflation while the focus of
IT is only inflation. As can be easily compared, IT regime mounts blinkers on the central bank and
absolves the central bank from other responsibilities: IT was in disrepute after the onset of the
great recession in 2008.
Though IT sounds modern, it may not be suitable for a ready transplant in India given the current
state of the economy as well as status of price indices. In view of the fact that prices of food grains
IIMB-WP N0. 475
14
are fixed by non-economic and political reasons, adopting inflation target would only distort the
market mechanism.
The important issue in India is lack of sophisticated econometric models in public domain and
non-availability of reliable data for obtaining these forecasts on series like gross domestic product,
inflation rates and employment. In India, such data, not even unreliable data, exists. Therefore,
making policy decisions which impact long term decisions based on scantily available data could
have perilous consequences.
In view of the young population of India, probably priorities in India are higher employment and
growth and not just low inflation. There needs to be an extensive behavioral study on new
tolerance levels of inflation, if any, in India, segregating the effect of food and non-food inflation,
and the trade-off between growth and inflation. There will be some who may be mainly concerned
about food inflation while many may be tolerant to inflation but not to unemployment. To
conclude, demographic dividend in the country is not being appropriately used and as employment
brings in responsibility, obligation and sense of belonging in any employee, higher employment is
not only helpful in growth but also ensures that social unrest is minimized. The demographic
pressure on employment is expected to increase further.
The models to establish threshold levels of inflation in India, and the sacrifice ratio should be
discussed in public domain so as to inspire confidence in the numbers that are being proposed as a
target.
Therefore, the period of transition from MIP to a new framework, if any, would need to be
carefully managed, by wide-spread consultations, healthy debate, informed public opinion and
appropriate sequencing. Changes in monetary policy framework deserve a focussed attention and
well chalked out strategy to be successful.
IIMB-WP N0. 475
15
References
Ball, L. and N. Sheridan (2003), “Does Inflation Targeting Matter”, NBER Working Paper No. 9577, NBER, Cambridge. Bhattacharya, R. and Patnaik, I. (2014), “Monetary Policy analysis in an inflation targeting framework in emerging economies: The case of India”, NIPFP, February. Blanchard, O., Dell’Ariccia, G and Mauro, P. (2010), “Rethinking Macroeconomic Policy”, IMF SPN/10/03. Brash, D. (1999), “Inflation Targeting: Is New Zealand’s Experience Relevant to Developing Countries?”, L.K. Jha Memorial Lecture, June. Borio, C. and A. Filardo. (2007), “Globalisation and Inflation”, BIS Working Papers No. 227. Bullard, J., Garriga, C. and Waller, J, C. (2012), “Demographics, Redistribution, and Optimal Inflation”, Federal Reserve Bank of St. Louis. Davidson, P. (2006), “Can, or Should, a Central Bank Inflation Target?”, Journal of Post Keynesian Economics, Vol. 28, No.4, pp 689-703. Dholakia, R. (2014), “Cost and Benefit of Disinflation Policy in India”, Economic and Political Weekly, Vol. XLIX, No. 28, July. Frankel, J. (2012), “The Death of Inflation Targeting”, Project-syndicate, May. GOI (2007), “Report of the High Powered Expert Committee on Making Mumbai an International Financial Centre” (Chairman: Percy Mistry). GOI (2013), “Report of the Financial Sector Legislative Reforms Commission” (Chairman: B.N. Srikrishna), Vol. I, March. Greenwood, R., Hanson, S. G., Rudolph, J. S. and Summers, L. H. (2014) “Government Debt Management at the Zero Lower Bound”, Working paper No. 5, Hutchins Center of Fiscal and Monetary Policy, Brookings. Gupta, A.S. and Sengupta, R. (2014), “Is India Ready for Inflation Targeting?”, June. Gupta, K. and Siddiqui, F. (2014), “Salient Features of Measuring, Interpreting and addressing Indian Inflation”, ICRIER Working Paper 279, July. Hammond, G. (2012), “State of the art of the inflation targeting”, Bank of England CCBS Handbook No. 29, February.
IIMB-WP N0. 475
16
Ikeda, D. and Saito, M. (2012), “The Effects of Demographic Changes on the Real Interest Rate in Japan”, Bank of Japan Working Paper Series, No. 12-E-3. Jalan, B. (2000), “Summary of Welcome Remarks”, Eleventh C.D. Deshmukh Memorial Lecture, December. Mahadeva, L. and Sterne, G. (eds.) (2000), “Monetary Policy Frameworks in a global context”, London: Routledge. Mahajan S, Saha, S.K. and Singh, C. (2014), “Inflation Targeting in India”, February. Marcus, G. (2014), “Fourteen Years of Inflation Targeting in South Africa and the Challenge of a Changing Mandate”, October. Nishimura, G.K. (2011), “Population Ageing, Macroeconomic Crisis and Policy Changes”, Bank of Japan. OECD, “Database”. Powell, J. H. (2014), Remarks of “Government Debt Management at the Zero Lower Bound”, Bank for international Settlements, Basel. Planning Commission (2009), “A Hundred Small Steps: Report of the Committee on Financial Sector Reforms” (Chairman: Raghuram G. Rajan), August. Rajan, R. (2013), “Statement by Dr. Raghuram Rajan on Taking Office”, RBI, September. Rajan, R. (2014), “Fighting Inflation”, Inaugural Speech, FIMMDA-PDAI Annual Conference, Mumbai, February. RBI (1996), “Report on Currency and finance”, Vol. I. RBI (1997), “Report of the Committee on Capital Account Convertibility” (Chairman: S.S. Tarapore), May. RBI (2000), “Report of the Advisory Group on Transparency in Monetary and Financial Policies” (Chairman: M. Narasimham), September. RBI (2002), “Growth, Inflation and The Conduct of Monetary Policy”, Publication report, January. RBI (2004), “Monetary Policy and Inflation: Report on Currency and Finance”, Publication Report, December. RBI (2014), “Report of the Expert Committee to Revise and Strengthen the Monetary Policy Framework” (Chairman: Urijit R. Patel), January.
IIMB-WP N0. 475
17
Reddy, Y.V. (1999),”Inflation in India: Status and Issues”, Speech, Centre for Economic and Social Studies, Hyderabad, August. Roger, S. (2010), “Inflation Targeting Turns 20”, Finance and Development”, Vol. 47, No. 1, March.
Rose, A.K. (2007), “A Stable International Monetary System Emerges: Bretton Woods, Reversed”, Journal of International Money and Finance. Shirakawa, M. (2012), “Demographic Changes and Macroeconomic Performances: Japanese Experiences”, Bank of Japan. Singleton, J. (2006), “Central Banking in the British ‘dominions’, 1930-2000”, Asia-Pacific Economic and Business History Conference, February. Singleton, J. (2011), “Central Banking in the Twentieth Century”, Cambridge University Press, pp 241- 258, UK. Sonna, T., Joshi, H., Sebastian, A. and Sharma, U. (2014), “Analytics of Food Inflation in India”, RBI Working Paper, October. World Bank, “Database”.
IIMB-WP N0. 475
18
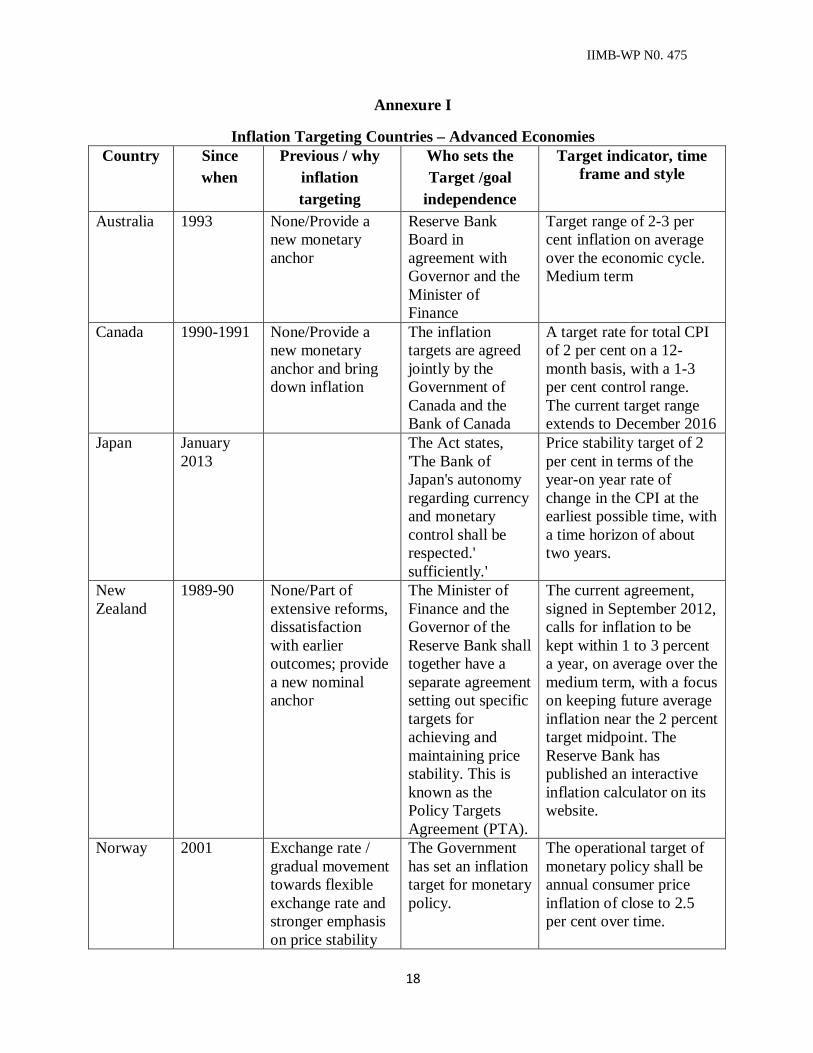
Annexure I
Inflation Targeting Countries – Advanced Economies Country Since
when Previous / why
inflation targeting
Who sets the Target /goal
independence
Target indicator, time frame and style
Australia 1993 None/Provide a new monetary anchor
Reserve Bank Board in agreement with Governor and the Minister of Finance
Target range of 2-3 per cent inflation on average over the economic cycle. Medium term
Canada 1990-1991 None/Provide a new monetary anchor and bring down inflation
The inflation targets are agreed jointly by the Government of Canada and the Bank of Canada
A target rate for total CPI of 2 per cent on a 12-month basis, with a 1-3 per cent control range. The current target range extends to December 2016
Japan January 2013
The Act states, 'The Bank of Japan's autonomy regarding currency and monetary control shall be respected.' sufficiently.'
Price stability target of 2 per cent in terms of the year-on year rate of change in the CPI at the earliest possible time, with a time horizon of about two years.
New Zealand
1989-90 None/Part of extensive reforms, dissatisfaction with earlier outcomes; provide a new nominal anchor
The Minister of Finance and the Governor of the Reserve Bank shall together have a separate agreement setting out specific targets for achieving and maintaining price stability. This is known as the Policy Targets Agreement (PTA).
The current agreement, signed in September 2012, calls for inflation to be kept within 1 to 3 percent a year, on average over the medium term, with a focus on keeping future average inflation near the 2 percent target midpoint. The Reserve Bank has published an interactive inflation calculator on its website.
Norway 2001 Exchange rate / gradual movement towards flexible exchange rate and stronger emphasis on price stability
The Government has set an inflation target for monetary policy.
The operational target of monetary policy shall be annual consumer price inflation of close to 2.5 per cent over time.
IIMB-WP N0. 475
19
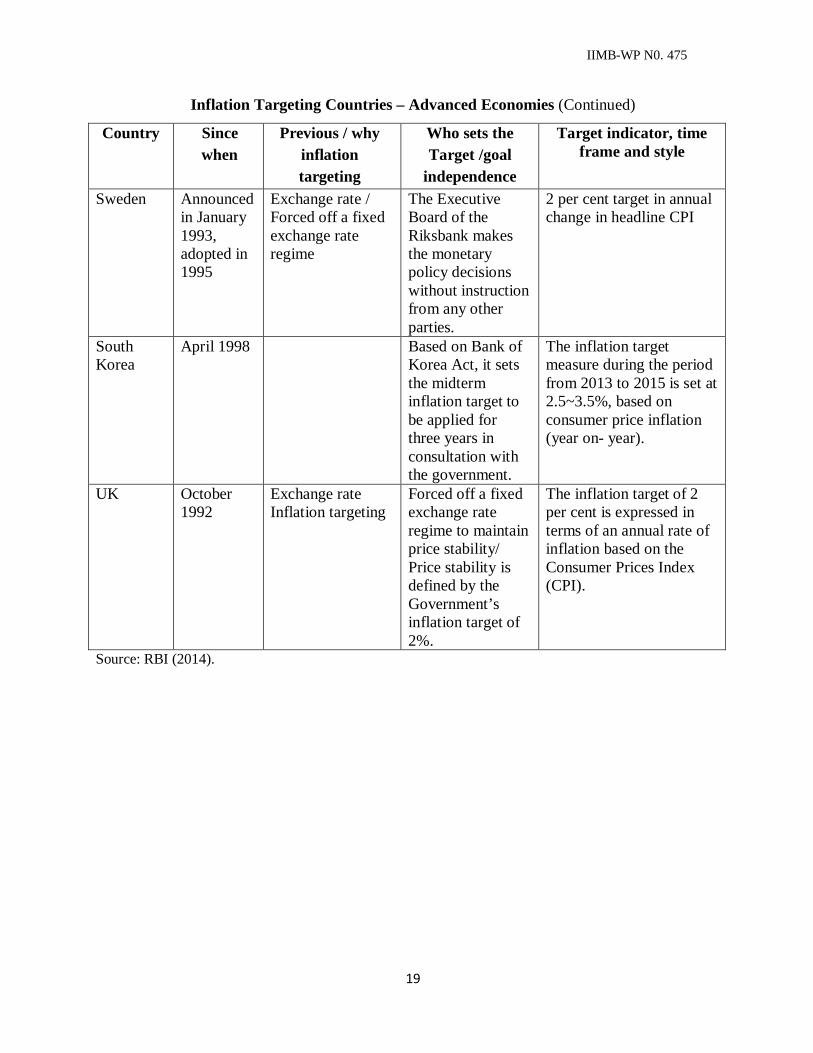
Inflation Targeting Countries – Advanced Economies (Continued)
Country Since when
Previous / why inflation targeting
Who sets the Target /goal
independence
Target indicator, time frame and style
Sweden Announced in January 1993, adopted in 1995
Exchange rate / Forced off a fixed exchange rate regime
The Executive Board of the Riksbank makes the monetary policy decisions without instruction from any other parties.
2 per cent target in annual change in headline CPI
South Korea
April 1998 Based on Bank of Korea Act, it sets the midterm inflation target to be applied for three years in consultation with the government.
The inflation target measure during the period from 2013 to 2015 is set at 2.5~3.5%, based on consumer price inflation (year on- year).
UK October 1992
Exchange rate Inflation targeting
Forced off a fixed exchange rate regime to maintain price stability/ Price stability is defined by the Government’s inflation target of 2%.
The inflation target of 2 per cent is expressed in terms of an annual rate of inflation based on the Consumer Prices Index (CPI).
Source: RBI (2014).
IIMB-WP N0. 475
20
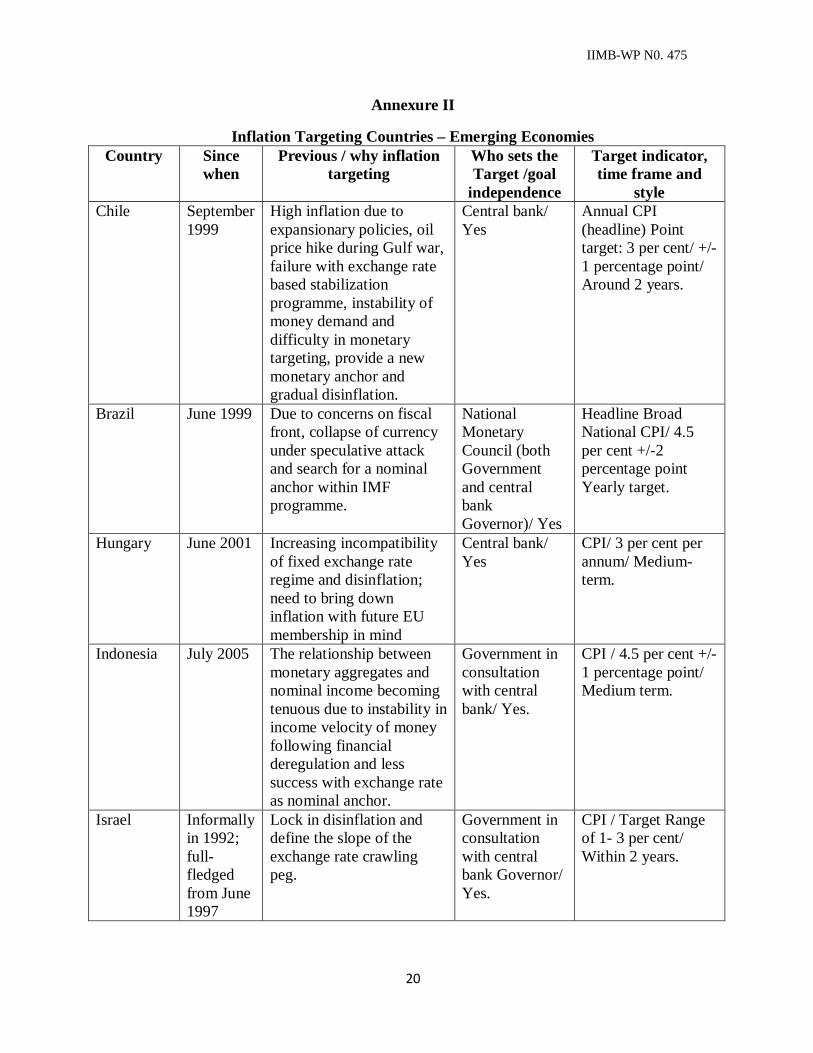
Annexure II
Inflation Targeting Countries – Emerging Economies Country Since
when Previous / why inflation
targeting Who sets the Target /goal
independence
Target indicator, time frame and
style Chile September
1999 High inflation due to expansionary policies, oil price hike during Gulf war, failure with exchange rate based stabilization programme, instability of money demand and difficulty in monetary targeting, provide a new monetary anchor and gradual disinflation.
Central bank/ Yes
Annual CPI (headline) Point target: 3 per cent/ +/-1 percentage point/ Around 2 years.
Brazil June 1999 Due to concerns on fiscal front, collapse of currency under speculative attack and search for a nominal anchor within IMF programme.
National Monetary Council (both Government and central bank Governor)/ Yes
Headline Broad National CPI/ 4.5 per cent +/-2 percentage point Yearly target.
Hungary June 2001 Increasing incompatibility
of fixed exchange rate regime and disinflation; need to bring down inflation with future EU membership in mind
Central bank/ Yes
CPI/ 3 per cent per annum/ Medium-term.
Indonesia July 2005 The relationship between monetary aggregates and nominal income becoming tenuous due to instability in income velocity of money following financial deregulation and less success with exchange rate as nominal anchor.
Government in consultation with central bank/ Yes.
CPI / 4.5 per cent +/- 1 percentage point/ Medium term.
Israel Informally in 1992; full-fledged from June 1997
Lock in disinflation and define the slope of the exchange rate crawling peg.
Government in consultation with central bank Governor/ Yes.
CPI / Target Range of 1- 3 per cent/ Within 2 years.
IIMB-WP N0. 475
21
Inflation Targeting Countries – Emerging Economies (Continued) Country Since
when Previous / why inflation
targeting Who sets the Target /goal
independence
Target indicator, time frame and
style South Africa
February 2000
Following liberalization and structural developments, changing relationship between output, prices and money growth, making monetary targeting less useful; need for greater transparency in policy.
Government in consultation with central bank/ Yes.
CPI / A Target range of 3-6 per cent/ On a continuous basis.
Peru January 2002
Formalization of earlier regime; greater transparency of policy.
Target is approved by the Board of Directors.
CPI / 2 per cent +/-1 percentage point/ At all times.
Philippines January 2002
Formalization and simplification of earlier regime; greater transparency and focus on price stability.
Government in consultation with central bank/Yes.
CPI / 4 per cent +/- 1 percentage point for 2012, 2013 and 2014/ Medium term.
Poland 1998 Considered the most effective way to bring down inflation as a precondition for subsequent EU membership.
Monetary Policy Council/ Yes.
CPI / 2.5 per cent +/- 1 percentage points/ Medium term.
South Korea
April 1998
Unstable money demand following structural changes in financial markets, and with 1997 financial crisis; discontinuation of exchange rate.
Central Bank in consultation with the Government/ Yes.
CPI / 3 per cent +/- 1 percentage point/ 3 years.
Thailand May 2000 Inflation targeting considered more appropriate with floating exchange rate than money supply targeting after the financial crisis of 1997.
MPC in consultation with the Government/ Yes.
3.0 per cent +/- 1.5 percentage points/ 8 quarters.
Source: RBI (2014).
IIMB-WP N0. 475
22
Annexure III
Inflation Targeting Countries – Advanced Economies Country Who sets the Target Target
Horizon Accountability of Target
Misses Australia Government and Central Bank Medium Term Open letter – No, Parliamentary
Hearings – Yes, twice yearly
Canada Government and Bank of Canada
6-8 quarters, current target extends to December 2016
Open letter – No, Parliamentary Hearings – Yes, twice yearly
Israel Government in consultation with the Bank of Israel Governor
Within two years Open letter – No, Parliamentary Hearings – Yes, twice yearly
New Zealand
Governor of Central Bank and the Minister of Finance
Medium Term Open letter – Other, Parliamentary Hearings – Yes, Four times a year
Norway Government Medium Term Open letter – No, Parliamentary Hearings – Yes
Sweden Sveriges Riksbank
Normally two years
Open letter – No, Parliamentary Hearings – Yes, twice yearly
South Korea Bank of Korea (BOK) sets the target in consultation with the Government
Three years Open letter – No, Parliamentary Hearings – Yes
UK Government, the target is reaffirmed each year by the Chancellor of the Exchequer in the annual budget statement
At all times Open letter – Yes, Parliamentary Hearings – Yes, thrice yearly
Source: Hammond (2012).
IIMB-WP N0. 475
23
Annexure IV
Inflation Targeting Countries – Emerging Economies Country Who sets the Target Target
Horizon Accountability of Target
Misses Chile Central Bank Around two
years Open letter – No, Parliamentary Hearings – Yes, Four times a year
Brazil National Monetary Council, This consists of: the Minister of Finance; the Governor of the Central Bank of Brazil; and the Minister of Planning, Budget and Management
Yearly Open letter – Yes, Parliamentary Hearings – Yes, Six times a year
Hungary Central Bank Medium term Open letter – No, Parliamentary Hearings – Yes, Once a year
Indonesia The government, after consultation with Bank Indonesia
Medium term Open letter – No, Parliamentary Hearings – No
Mexico Board of Governors of Central Bank
Medium term Open letter – No, Parliamentary Hearings – Yes, Not regular
South Africa The Government sets the target after consultation with the Central Bank
On a continuous basis
Open letter – No, Parliamentary Hearings – Yes, at least thrice a year
Peru The target is approved by the Board of Directors of Central Bank
At all times Open letter – No, Parliamentary Hearings – Yes, once a year
Philippines The National Government (through the Development Budget and Co-ordination Committee) in consultation with the Central Bank, the inflation target is announced two years in advance
Medium term (from 2012–2014)
Open letter – Yes, Parliamentary Hearings – No
Poland Monetary Policy Council Medium term Open letter – No, Parliamentary Hearings – No
Thailand A target is set by the MPC on an annual basis, no later than December, the target shall be reached in agreement with the Minister of Finance, which will then require approval by the Cabinet
Eight quarters Open letter – Yes, Parliamentary Hearings – No
Modeling and Forecasting – Advanced Countries Country Type of Models used
by Central Bank Published Forecasts
Forecast assumption on interest rates
Forecast owned by
Australia DSGE plus small models and single equations
GDP, inflation and core inflation
Market or Constant
RBA
Canada Suite of DSGE plus macro models
GDP, inflation and core inflation
Endogenous Governing Council of BoC
Israel Suite of models Fan chart forecasts for inflation and key policy rate. Range forecast for GDP
Forward-looking policy reaction function — endogenous
Staff of BoI
New Zealand
Calibrated gaps model is main forecasting model. Suite of alternative models.
GDP, inflation and interest rate projections
Endogenous MPC
Norway DSGE models and a suite of forecasting models for ‘nowcasting’
Key policy rate, output gap, CPI and core inflation
Endogenous Governor of Norges Bank
Sweden Time series model, indicator models, structural models (eg-DSGE)
GDP, CPI, core inflation and the repo rate
Endogenous Board of Governors
South Korea Dynamic Projection Model, DSGE model
Inflation and GDP Market Central bank
UK Statistical and theoretical. Main forecasting model is DSGE
Inflation and GDP Market rates MPC
Note: DSGE - Dynamic Stochastic General Equilibrium, RBA – Reserve Bank of Australia, BoI – Bank of Israel, Nowcasting – Forecasting recent values, MPC – Monetary Policy Committee. Source: Hammond (2012).
IIMB-WP N0. 475
25
Annexure VI
Modeling and Forecasting – Emerging Countries Country Type of Models used
by Central Bank Published Forecasts
Forecast assumption on interest rates
Forecast owned by
Chile Quarterly macroeconomic model, time series and DSGE
GDP and CPI Consistent with the target
Board of Central Bank
Brazil VARs, small and medium-sized macro models, DSGE
Fan chart forecasts of inflation and GDP
Constant and market
MPC
Hungary Time series, expert, macro and DSGE
CPI, core inflation, GDP and labour market
Endogenous Staff of MNB
Indonesia DSGE, macro, ARIMA Inflation, GDP and GDP components
Scenarios and expected inflation
Board of Governors of BI
Mexico DSGE model, ECM Inflation, GDP and employment
Endogenous Staff of Central Bank
South Africa Core macro forecasting plus suite of models
Fan chart forecast of Inflation and GDP
Constant MPC
Peru Semi-structural, DSGE, VAR
Inflation, GDP, BoP, inflation and GDP in trading partners
Taylor rule Central bank
Philippines Single equation, multi equation, (macro models being developed, DSGE model for policy simulation)
Inflation Constant Central bank
Poland Suite of macroeconomic models; structural macro model is main one. DSGE model used for internal analysis
Inflation and core inflation, GDP and GDP components
Constant Staff of National Bank of Poland
Thailand Suite of models ( DSGE being developed)
Core inflation and GDP
Constant MPC
Note: DSGE - Dynamic Stochastic General Equilibrium, VAR – Vector Auto Regression, ARIMA - Autoregressive Integrated Moving Average, ECM – Error Correction Model, MPC – Monetary Policy Committee, MNB – Magyar Nemzeti Bank, BI – Bank Indonesia. Source: Hammond (2012).
IIMB-WP N0. 475
26
Annexure VII
Inflation Targeting Countries – Inflation Preceding Adoption Country Inflation