91
Workshop on Inflation Targeting Prague, Czech Republic September 14–15, 1998
Workshopon
Inflation Targeting
Prague, Czech RepublicSeptember 14–15, 1998
© Czech National Bank, 1999
Address: Public Relations Department
Na Příkopě 28
115 03 Praha 1
Telephone: 420 2 2441 3022
Internet: http://www.cnb.cz
Fax: 420 2 2441 3070
All rights reserved.
Reproduction for educational and non-commercial purposes permitted provided that the source is acknowledged.

EditorAndrew P. Fisher
Published byThe Czech National Bank
Public Relations Dept.1999
Workshop on Inflation Targeting
Foreword 1
1 Pursuing Price Stability: Evidence from the United Kingdom 2 and Other Inflation-Targeters Andrew Haldane – The Bank of England
2 The Czech Approach to Inflation Targeting 18 Miroslav Hrnčíř & Kateřina Šmídková – The Czech National Bank
3 Forecasting in a Central Bank 39 Lavan Mahadeva – The Bank of England
4 The Western Experience with a Strategy of Inflation Targeting 51 David A. Mayes – The Bank of Finland
5 Inflation Forecasting Using a Small Macro-Economic Model 79 Emil Stavrev – The Czech National Bank
Panel Discussion 88
Abbreviations 101

1
FOREWORD
On September 14–15, 1998, the Czech National Bank, in cooperation with the Bank of England, held a
two day workshop on Inflation Targeting.
The aim of this workshop was to bring together Czech and foreign experts so that they could present
their knowledge and experience in the area of inflation targeting and discuss the problems and complex issues
involved.
We are pleased to say that the workshop was a success. The informal atmosphere allowed participants
and guests to discuss and share ideas and, in turn, suggest solutions geared to the more efficient implementation
of inflation targeting.
We would like to thank the following speakers for their expertise and contribution during the
workshop:
Andrew Haldane – The Bank of England
Miroslav Hrnčíř – The Czech National Bank
Leonardo Leiderman – The Bank of Israel
Lavan Mahadeva – The Bank of England
David Mayes – The Bank of Finland
Emil Stavrev – The Czech National Bank
Kateřina Šmídková – The Czech National Bank
Zdeněk Tůma – The European Bank for Reconstruction and Development
Due to the invaluable information presented at the workshop, we thought that it would be appropriate as
well as useful to publish the proceedings in book form.
The Czech National Bank, therefore, has the pleasure of presenting this publication, containing the lectures and
discussions that took place during the workshop.
We hope that it will be a practical source of information and inspiration for all of those interested in the
theory and practice of inflation targeting.
Miroslav Hrnčíř Kateřina Šmídková
2
Pursuing Price-StabilityEvidence from the United Kingdom
and Other Inflation-Targeters
Andrew Haldane
1 Introduction
2 The Institutional Framework for Inflation-Targeting
3 Specification of the Inflation Target
4 Dealing with Monetary Transmission Lags
5 Dealing with Uncertainty
6 Dealing with Output
7 Transparency
8 Dealing with the Exchange Rate
9 Summary
3
1 Introduction
The inflation-targeting countries now number eight:
in chronological order, New Zealand, Canada, Australia, the
United Kingdom, Sweden, Finland, Spain and now the
Czech Republic (see, for example, Haldane (1995),
Leiderman and Svensson (1995), Lowe (1997)). The longest
duration of an inflation-targeting regime is eight or nine
years in the case of New Zealand. That may sound short. But
to take the United Kingdom as an example, inflation-
targeting has already proved to be the most durable of the
monetary frameworks put in place in the post-Bretton
Woods era. The same is true in New Zealand and Canada.
The pool of inflation-targeting countries may well
swell further. For example, in Norway and Israel, a
combination strategy of exchange-rate-cum-inflation
targeting is currently being pursued. More recently in these
countries the policy focus has shifted towards inflation-
control, as both countries have introduced greater flexibility
into their exchange rate arrangements. And both countries
now publish Inflation Reports – as in all the other inflation-
targeting countries – to monitor and forecast inflation
developments.
In the euro-area (of which Finland and Spain are
now a part), a combination strategy – this time monetary-
cum-inflation targeting – is being pursued. And in the
United States there is an active debate on the merits of
shifting from the dual objectives embodied in the
Humphrey-Hawkins Act to a single price-stability objective
(see Bernanke, Mishkin, Laubach, Posen (1999)). With
exchange rate pegs in South-East Asia and Brazil having
recently been dislodged, one option for these countries
would also be the pursuit of an inflation target. So in the
medium term, experience with an inflation target may
broaden as well as deepen.
This paper considers a range of issues which are
central to the design of an inflation-targeting regime. It
discusses these from the particular perspective of the United
Kingdom. But it also attempts to discuss the approaches to
these problems which have been undertaken by the other
inflation-targeters; and how these approaches may need to
be different in a transitional economy such as the Czech
Republic.
The particular issues the paper discusses are: the
institutional framework for monetary policy; specification of
the inflation target; dealing with monetary transmission lags;
dealing with (in particular inflation) uncertainties; dealing
with output objectives, in particular following supply
shocks; transparency about monetary policymaking; and
dealing with the exchange rate. All of these have direct
relevance to the Czech Republic, as it builds up experience
of operating within an inflation-targeting framework.
2 The Institutional Framework for Inflation-Targeting
There seems to be an increasing consensus across
central banks about the necessary institutional conditions for
the effective pursuit of price-stability. One such necessary
condition is a degree of operational autonomy on the part of
the central bank in the course of setting monetary policy.
The Czech National Bank has for some time had a relatively
high degree of de jure independence. But in the United
Kingdom, such autonomy has only recently been granted
and enshrined in statute in the Bank of England Act 1998.
This Act confers instrument-independence on the Bank of
England, though the goals of policy continue to be set by the
government. There is, in the jargon, goal-dependence but
instrument independence. Among these goals, price-stability
is given primacy.
Monetary policy decisions in the UK are made on a
regular monthly cycle by a nine-person Monetary Policy
Committee (MPC). The MPC comprises 5 “insiders” to the
Bank of England (the Governor, two Deputy Governors and
two of the Bank’s Executive Directors) and 4 “outsiders”,
with prior technical expertise in the monetary policy area.
Seven of the nine members are appointed by government,
two by the Bank itself. The minutes of the MPC’s monthly
4
deliberations are published, with a two week lag.1 The
minutes disclose the voting patterns of each of the individual
MPC members. The discussion in the minutes is
unattributed, though it provides a detailed account of the
analysis discussed by the MPC in the course of reaching its
decision.
Though operationally independent in their choice
of the interest rate, the MPC is held to account for its views
in a variety of ways: through the published minutes of their
monthly meetings; through published quarterly Inflation
Reports; through appearances by MPC members before
Parliamentary committees (including after the publication of
Inflation Report); through the Bank writing “Open Letters”
to the Chancellor in the event of the inflation target being
breached by one percentage point in either direction
(discussed further below); and through an “override” (of the
Bank’s interest rate decisions) clause, which allows the
Chancellor to exercise interest rate control “in extreme
economic circumstances”.
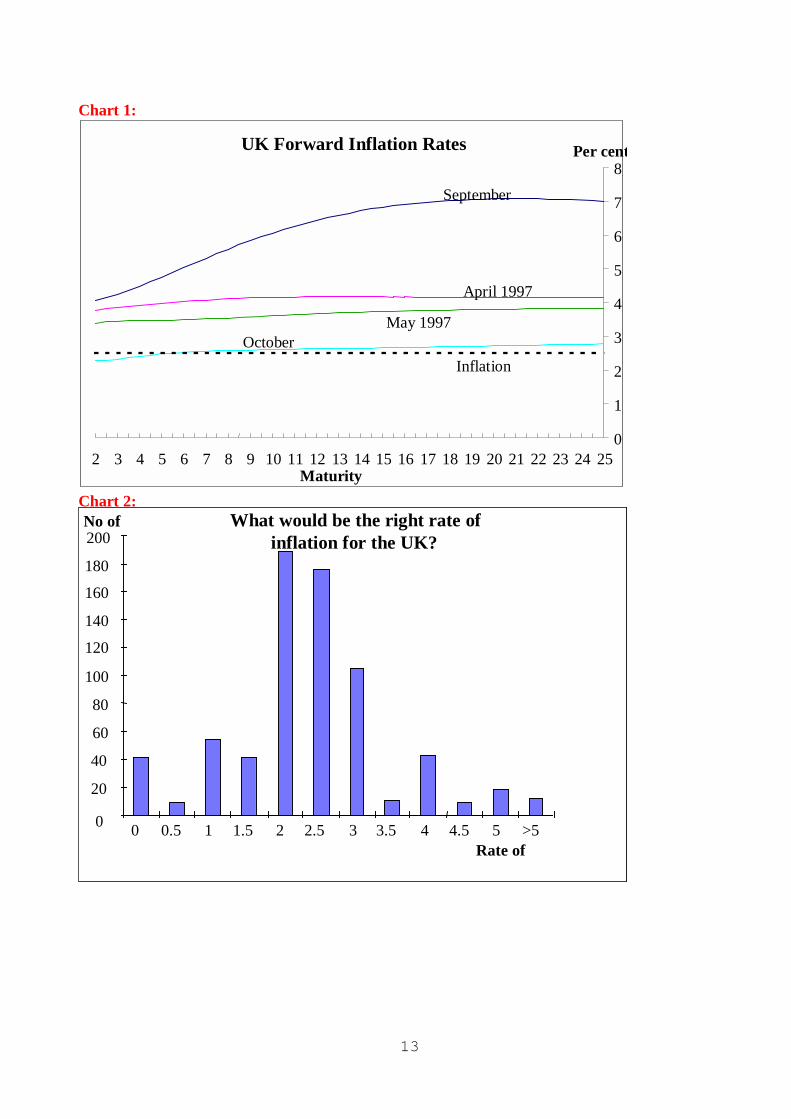
This institutional architecture, and the inflation-
targeting regime more generally, seem to have yielded some
tangible benefits, measured in term of inflation expectations
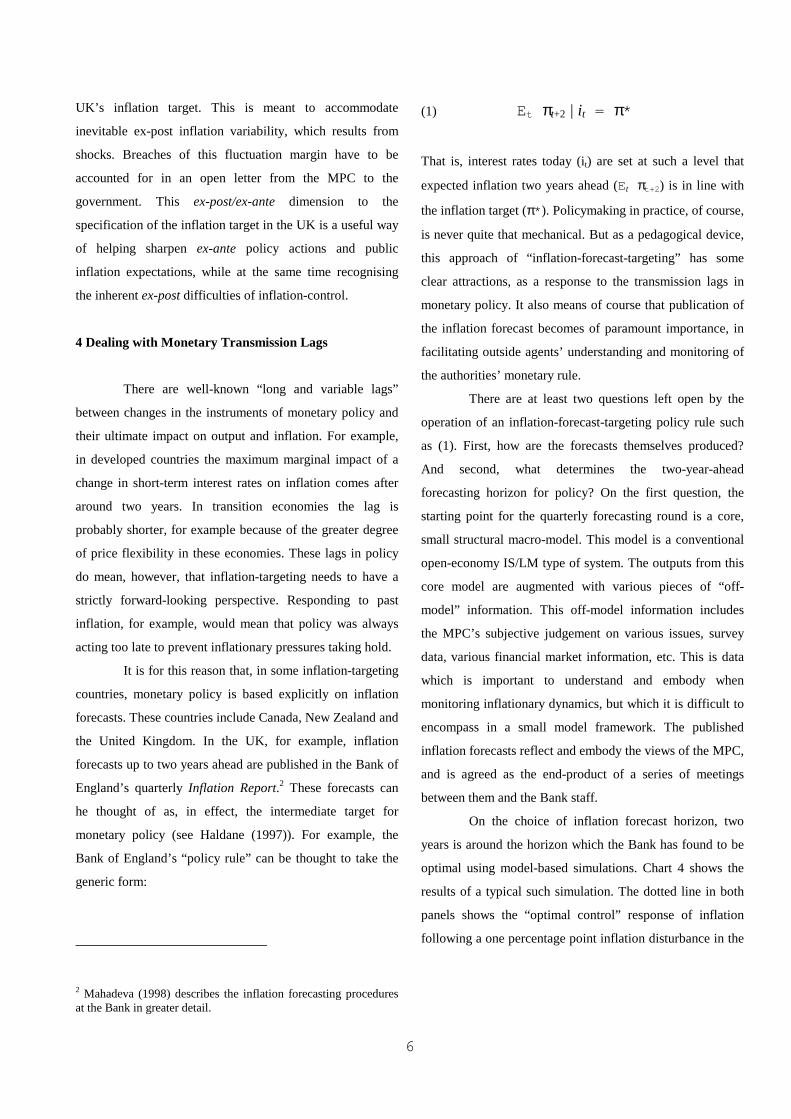
relative to target (credibility, crudely defined). Chart 1
shows a set of term structures of inflation expectations on a
variety of dates, derived from nominal and real bond yields
in the United Kingdom. Immediately following the UK’s
exit from the ERM in September 1992, inflation
expectations were between 5% and 7% at maturities 10 to
20 years ahead – well above the inflation target at the time
of 1–4%. By April 1997, five years into the regime, inflation
expectation had ratcheted down to just over 4%. The
announcement of operational independence in May 1997
caused a further fall in inflation expectation across all
maturities. And by June of 1998, inflation expectations at all
maturities were around the UK’s 2.5% inflation target. This
1 Up until October 1988, the minutes were published with a 5–6
week lag.
gradual improvement in the credibility of the inflation-
targeting framework seems in no small measure to have been
enhanced by the institutional arrangements for the monetary
policymaking in the UK.
Many of these institutional arrangements can also
be found among the inflation-targeters, including in the
Czech Republic. There are some differences in that the
Czech National Bank has goal as well as instrument
independence. But there is no international consensus on
whether or not goal-independence is desirable. The
euro-area operates with one model, which includes goal
independence; others, including the UK, operate with
another.
Looked at from a UK perspective, however, goal-
dependence can in some circumstances have some merits.
First, it ensures that a degree of democratic accountability is
exercised over the central bank. And second, it can in some
circumstances usefully help deflect criticism of the central
banks’ policy actions. Provided the central banks’ policies
and priorities are well-attuned to those of the public,
however, neither of these advantages need necessarily be
significant.
3 Specification of the Inflation Target
In the UK, the numerical value of the inflation
target is affirmed on an annual basis by the government. The
price-stability objective is enshrined in statute, however, and
the target itself is timeless. Currently, the UK has a point
target of 2.5%. This raises two technical questions about the
specification of the target: why 2.5%?; and why a point
target?
The reasons for choosing 2.5% are manifold. First,
there are well-known measurement biases in the UK’s CPI,
as there are in all other countries. In the UK, we estimate
these biases to be around 1% on an annual basis
(Cunningham 1995), again in line with other developed
countries. Second, an inflation rate of 2–3% is in line with
the current inflation norm in other developed countries,
including in the other inflation-targeters. Third, and
5
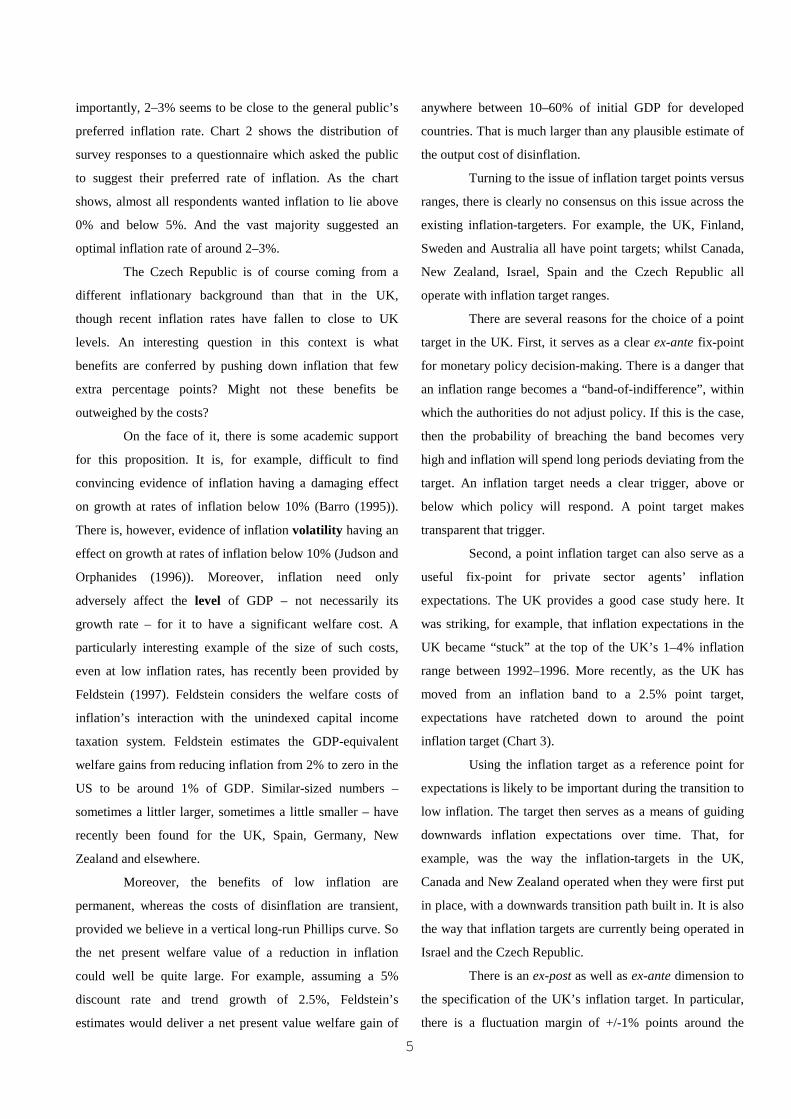
importantly, 2–3% seems to be close to the general public’s
preferred inflation rate. Chart 2 shows the distribution of
survey responses to a questionnaire which asked the public
to suggest their preferred rate of inflation. As the chart
shows, almost all respondents wanted inflation to lie above
0% and below 5%. And the vast majority suggested an
optimal inflation rate of around 2–3%.
The Czech Republic is of course coming from a
different inflationary background than that in the UK,
though recent inflation rates have fallen to close to UK
levels. An interesting question in this context is what
benefits are conferred by pushing down inflation that few
extra percentage points? Might not these benefits be
outweighed by the costs?
On the face of it, there is some academic support
for this proposition. It is, for example, difficult to find
convincing evidence of inflation having a damaging effect
on growth at rates of inflation below 10% (Barro (1995)).
There is, however, evidence of inflation volatility having an
effect on growth at rates of inflation below 10% (Judson and
Orphanides (1996)). Moreover, inflation need only
adversely affect the level of GDP – not necessarily its
growth rate – for it to have a significant welfare cost. A
particularly interesting example of the size of such costs,
even at low inflation rates, has recently been provided by
Feldstein (1997). Feldstein considers the welfare costs of
inflation’s interaction with the unindexed capital income
taxation system. Feldstein estimates the GDP-equivalent
welfare gains from reducing inflation from 2% to zero in the
US to be around 1% of GDP. Similar-sized numbers –
sometimes a littler larger, sometimes a little smaller – have
recently been found for the UK, Spain, Germany, New
Zealand and elsewhere.
Moreover, the benefits of low inflation are
permanent, whereas the costs of disinflation are transient,
provided we believe in a vertical long-run Phillips curve. So
the net present welfare value of a reduction in inflation
could well be quite large. For example, assuming a 5%
discount rate and trend growth of 2.5%, Feldstein’s
estimates would deliver a net present value welfare gain of
anywhere between 10–60% of initial GDP for developed
countries. That is much larger than any plausible estimate of
the output cost of disinflation.
Turning to the issue of inflation target points versus
ranges, there is clearly no consensus on this issue across the
existing inflation-targeters. For example, the UK, Finland,
Sweden and Australia all have point targets; whilst Canada,
New Zealand, Israel, Spain and the Czech Republic all
operate with inflation target ranges.
There are several reasons for the choice of a point
target in the UK. First, it serves as a clear ex-ante fix-point
for monetary policy decision-making. There is a danger that
an inflation range becomes a “band-of-indifference”, within
which the authorities do not adjust policy. If this is the case,
then the probability of breaching the band becomes very
high and inflation will spend long periods deviating from the
target. An inflation target needs a clear trigger, above or
below which policy will respond. A point target makes
transparent that trigger.
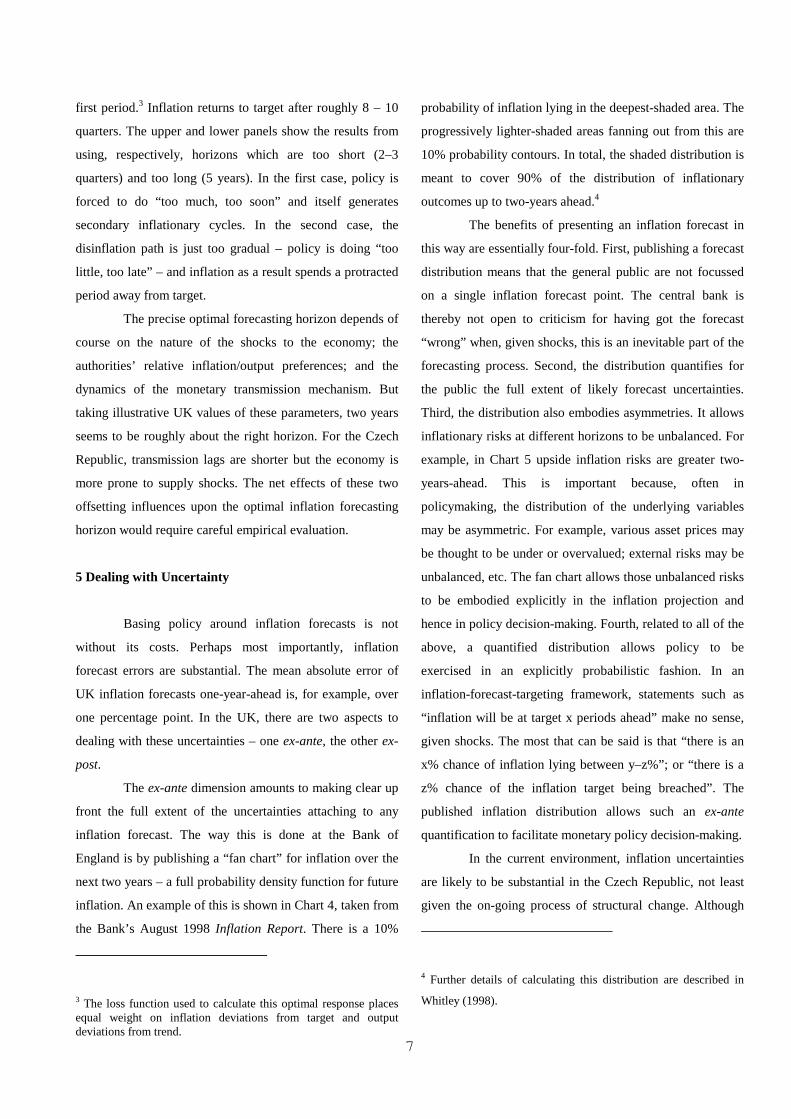
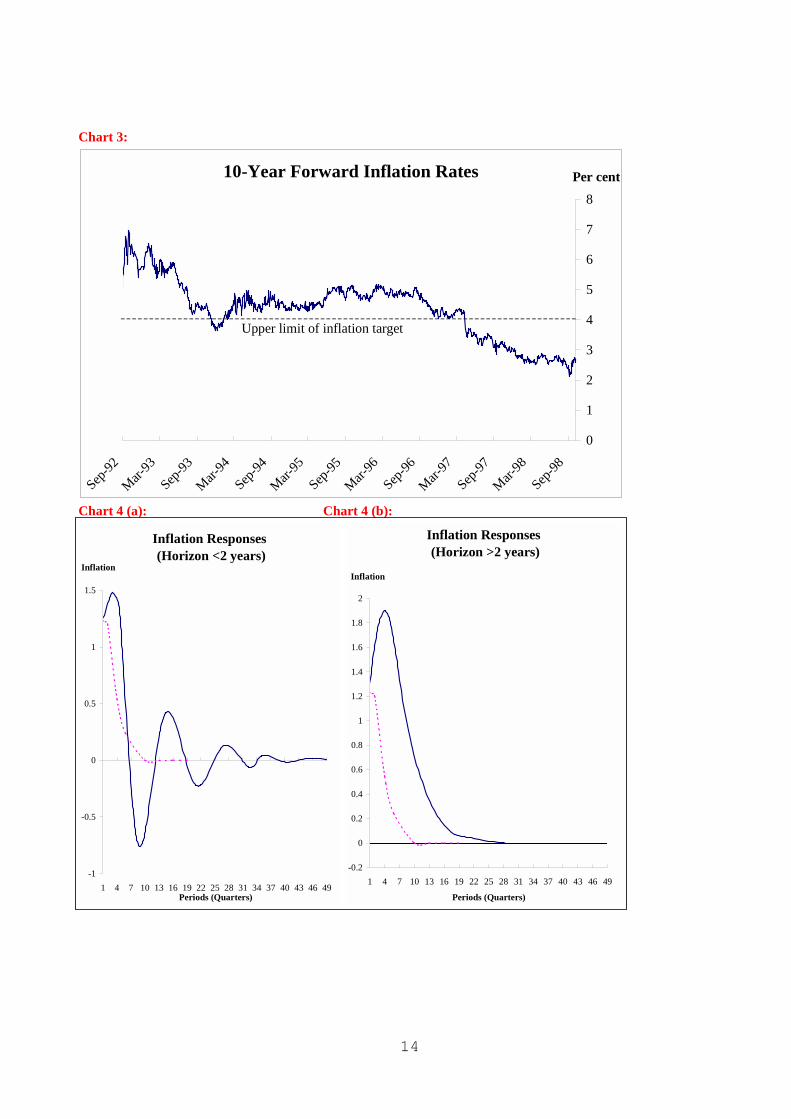
Second, a point inflation target can also serve as a
useful fix-point for private sector agents’ inflation
expectations. The UK provides a good case study here. It
was striking, for example, that inflation expectations in the
UK became “stuck” at the top of the UK’s 1–4% inflation
range between 1992–1996. More recently, as the UK has
moved from an inflation band to a 2.5% point target,
expectations have ratcheted down to around the point
inflation target (Chart 3).
Using the inflation target as a reference point for
expectations is likely to be important during the transition to
low inflation. The target then serves as a means of guiding
downwards inflation expectations over time. That, for
example, was the way the inflation-targets in the UK,
Canada and New Zealand operated when they were first put
in place, with a downwards transition path built in. It is also
the way that inflation targets are currently being operated in
Israel and the Czech Republic.
There is an ex-post as well as ex-ante dimension to
the specification of the UK’s inflation target. In particular,
there is a fluctuation margin of +/-1% points around the
6
UK’s inflation target. This is meant to accommodate
inevitable ex-post inflation variability, which results from
shocks. Breaches of this fluctuation margin have to be
accounted for in an open letter from the MPC to the
government. This ex-post/ex-ante dimension to the
specification of the inflation target in the UK is a useful way
of helping sharpen ex-ante policy actions and public
inflation expectations, while at the same time recognising
the inherent ex-post difficulties of inflation-control.
4 Dealing with Monetary Transmission Lags
There are well-known “long and variable lags”
between changes in the instruments of monetary policy and
their ultimate impact on output and inflation. For example,
in developed countries the maximum marginal impact of a
change in short-term interest rates on inflation comes after
around two years. In transition economies the lag is
probably shorter, for example because of the greater degree
of price flexibility in these economies. These lags in policy
do mean, however, that inflation-targeting needs to have a
strictly forward-looking perspective. Responding to past
inflation, for example, would mean that policy was always
acting too late to prevent inflationary pressures taking hold.
It is for this reason that, in some inflation-targeting
countries, monetary policy is based explicitly on inflation
forecasts. These countries include Canada, New Zealand and
the United Kingdom. In the UK, for example, inflation
forecasts up to two years ahead are published in the Bank of
England’s quarterly Inflation Report.2 These forecasts can
he thought of as, in effect, the intermediate target for
monetary policy (see Haldane (1997)). For example, the
Bank of England’s “policy rule” can be thought to take the
generic form:
2 Mahadeva (1998) describes the inflation forecasting proceduresat the Bank in greater detail.
(1) Et πt+2 | it = π*
That is, interest rates today (it) are set at such a level that
expected inflation two years ahead (Et πt+2) is in line with
the inflation target (π*). Policymaking in practice, of course,
is never quite that mechanical. But as a pedagogical device,
this approach of “inflation-forecast-targeting” has some
clear attractions, as a response to the transmission lags in
monetary policy. It also means of course that publication of
the inflation forecast becomes of paramount importance, in
facilitating outside agents’ understanding and monitoring of
the authorities’ monetary rule.
There are at least two questions left open by the
operation of an inflation-forecast-targeting policy rule such
as (1). First, how are the forecasts themselves produced?
And second, what determines the two-year-ahead
forecasting horizon for policy? On the first question, the
starting point for the quarterly forecasting round is a core,
small structural macro-model. This model is a conventional
open-economy IS/LM type of system. The outputs from this
core model are augmented with various pieces of “off-
model” information. This off-model information includes
the MPC’s subjective judgement on various issues, survey
data, various financial market information, etc. This is data
which is important to understand and embody when
monitoring inflationary dynamics, but which it is difficult to
encompass in a small model framework. The published
inflation forecasts reflect and embody the views of the MPC,
and is agreed as the end-product of a series of meetings
between them and the Bank staff.
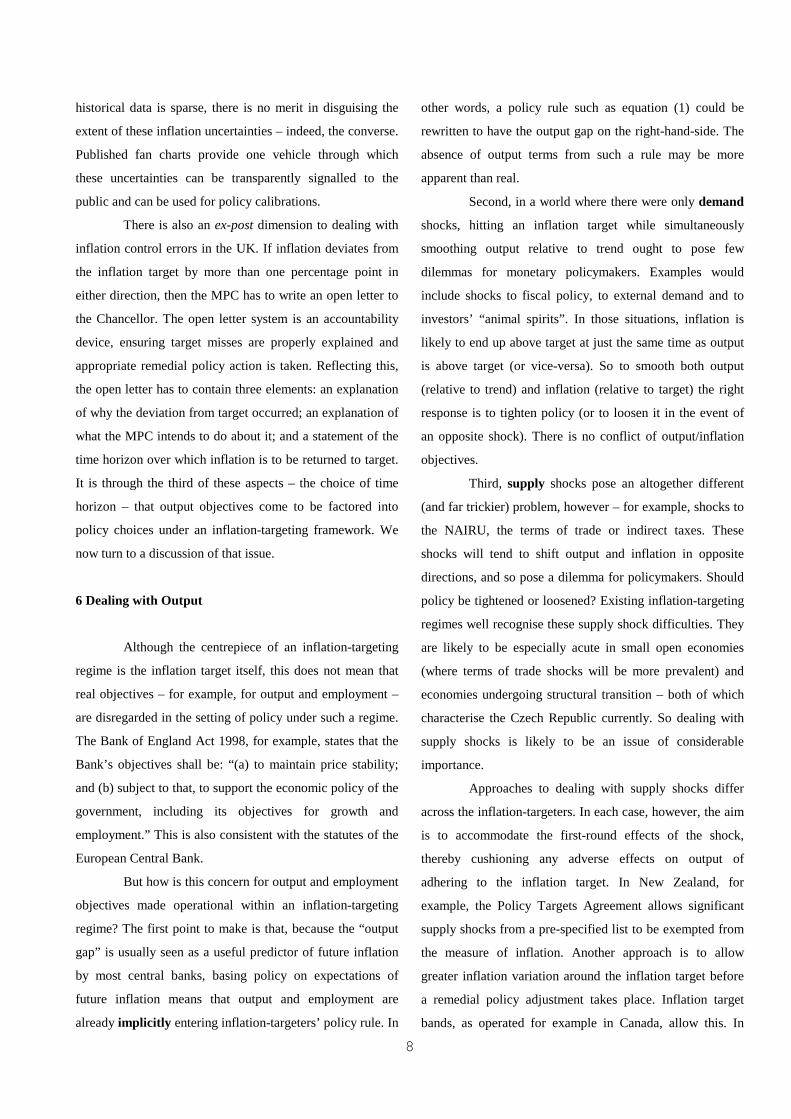
On the choice of inflation forecast horizon, two
years is around the horizon which the Bank has found to be
optimal using model-based simulations. Chart 4 shows the
results of a typical such simulation. The dotted line in both
panels shows the “optimal control” response of inflation
following a one percentage point inflation disturbance in the
7
first period.3 Inflation returns to target after roughly 8 – 10
quarters. The upper and lower panels show the results from
using, respectively, horizons which are too short (2–3
quarters) and too long (5 years). In the first case, policy is
forced to do “too much, too soon” and itself generates
secondary inflationary cycles. In the second case, the
disinflation path is just too gradual – policy is doing “too
little, too late” – and inflation as a result spends a protracted
period away from target.
The precise optimal forecasting horizon depends of
course on the nature of the shocks to the economy; the
authorities’ relative inflation/output preferences; and the
dynamics of the monetary transmission mechanism. But
taking illustrative UK values of these parameters, two years
seems to be roughly about the right horizon. For the Czech
Republic, transmission lags are shorter but the economy is
more prone to supply shocks. The net effects of these two
offsetting influences upon the optimal inflation forecasting
horizon would require careful empirical evaluation.
5 Dealing with Uncertainty
Basing policy around inflation forecasts is not
without its costs. Perhaps most importantly, inflation
forecast errors are substantial. The mean absolute error of
UK inflation forecasts one-year-ahead is, for example, over
one percentage point. In the UK, there are two aspects to
dealing with these uncertainties – one ex-ante, the other ex-
post.
The ex-ante dimension amounts to making clear up
front the full extent of the uncertainties attaching to any
inflation forecast. The way this is done at the Bank of
England is by publishing a “fan chart” for inflation over the
next two years – a full probability density function for future
inflation. An example of this is shown in Chart 4, taken from
the Bank’s August 1998 Inflation Report. There is a 10%
3 The loss function used to calculate this optimal response placesequal weight on inflation deviations from target and outputdeviations from trend.
probability of inflation lying in the deepest-shaded area. The
progressively lighter-shaded areas fanning out from this are
10% probability contours. In total, the shaded distribution is
meant to cover 90% of the distribution of inflationary
outcomes up to two-years ahead.4
The benefits of presenting an inflation forecast in
this way are essentially four-fold. First, publishing a forecast
distribution means that the general public are not focussed
on a single inflation forecast point. The central bank is
thereby not open to criticism for having got the forecast
“wrong” when, given shocks, this is an inevitable part of the
forecasting process. Second, the distribution quantifies for
the public the full extent of likely forecast uncertainties.
Third, the distribution also embodies asymmetries. It allows
inflationary risks at different horizons to be unbalanced. For
example, in Chart 5 upside inflation risks are greater two-
years-ahead. This is important because, often in
policymaking, the distribution of the underlying variables
may be asymmetric. For example, various asset prices may
be thought to be under or overvalued; external risks may be
unbalanced, etc. The fan chart allows those unbalanced risks
to be embodied explicitly in the inflation projection and
hence in policy decision-making. Fourth, related to all of the
above, a quantified distribution allows policy to be
exercised in an explicitly probabilistic fashion. In an
inflation-forecast-targeting framework, statements such as
“inflation will be at target x periods ahead” make no sense,
given shocks. The most that can be said is that “there is an
x% chance of inflation lying between y–z%”; or “there is a
z% chance of the inflation target being breached”. The
published inflation distribution allows such an ex-ante
quantification to facilitate monetary policy decision-making.
In the current environment, inflation uncertainties
are likely to be substantial in the Czech Republic, not least
given the on-going process of structural change. Although
4 Further details of calculating this distribution are described in
Whitley (1998).
8
historical data is sparse, there is no merit in disguising the
extent of these inflation uncertainties – indeed, the converse.
Published fan charts provide one vehicle through which
these uncertainties can be transparently signalled to the
public and can be used for policy calibrations.
There is also an ex-post dimension to dealing with
inflation control errors in the UK. If inflation deviates from
the inflation target by more than one percentage point in
either direction, then the MPC has to write an open letter to
the Chancellor. The open letter system is an accountability
device, ensuring target misses are properly explained and
appropriate remedial policy action is taken. Reflecting this,
the open letter has to contain three elements: an explanation
of why the deviation from target occurred; an explanation of
what the MPC intends to do about it; and a statement of the
time horizon over which inflation is to be returned to target.
It is through the third of these aspects – the choice of time
horizon – that output objectives come to be factored into
policy choices under an inflation-targeting framework. We
now turn to a discussion of that issue.
6 Dealing with Output
Although the centrepiece of an inflation-targeting
regime is the inflation target itself, this does not mean that
real objectives – for example, for output and employment –
are disregarded in the setting of policy under such a regime.
The Bank of England Act 1998, for example, states that the
Bank’s objectives shall be: “(a) to maintain price stability;
and (b) subject to that, to support the economic policy of the
government, including its objectives for growth and
employment.” This is also consistent with the statutes of the
European Central Bank.
But how is this concern for output and employment
objectives made operational within an inflation-targeting
regime? The first point to make is that, because the “output
gap” is usually seen as a useful predictor of future inflation
by most central banks, basing policy on expectations of
future inflation means that output and employment are
already implicitly entering inflation-targeters’ policy rule. In
other words, a policy rule such as equation (1) could be
rewritten to have the output gap on the right-hand-side. The
absence of output terms from such a rule may be more
apparent than real.
Second, in a world where there were only demand
shocks, hitting an inflation target while simultaneously
smoothing output relative to trend ought to pose few
dilemmas for monetary policymakers. Examples would
include shocks to fiscal policy, to external demand and to
investors’ “animal spirits”. In those situations, inflation is
likely to end up above target at just the same time as output
is above target (or vice-versa). So to smooth both output
(relative to trend) and inflation (relative to target) the right
response is to tighten policy (or to loosen it in the event of
an opposite shock). There is no conflict of output/inflation
objectives.
Third, supply shocks pose an altogether different
(and far trickier) problem, however – for example, shocks to
the NAIRU, the terms of trade or indirect taxes. These
shocks will tend to shift output and inflation in opposite
directions, and so pose a dilemma for policymakers. Should
policy be tightened or loosened? Existing inflation-targeting
regimes well recognise these supply shock difficulties. They
are likely to be especially acute in small open economies
(where terms of trade shocks will be more prevalent) and
economies undergoing structural transition – both of which
characterise the Czech Republic currently. So dealing with
supply shocks is likely to be an issue of considerable
importance.
Approaches to dealing with supply shocks differ
across the inflation-targeters. In each case, however, the aim
is to accommodate the first-round effects of the shock,
thereby cushioning any adverse effects on output of
adhering to the inflation target. In New Zealand, for
example, the Policy Targets Agreement allows significant
supply shocks from a pre-specified list to be exempted from
the measure of inflation. Another approach is to allow
greater inflation variation around the inflation target before
a remedial policy adjustment takes place. Inflation target
bands, as operated for example in Canada, allow this. In
9
both of these cases, the intention is to allow short-run
accommodation of the supply shock – not aiming to offset
the shock’s first-round effects on inflation – while at the
same time ensuring inflation expectations remain anchored
over the medium term.
A third approach to supply shock accommodation,
and the one employed in the UK, is to allow the flexibility
built into the inflation forecast horizon: that is, by allowing
inflation to return to target over a longer horizon when large
supply shocks strike. This allows for a more graduated, and
hence accommodative, policy stance, smoothing the path of
output relative to potential at the same time as the path of
inflation relative to target. Simulation work at the Bank of
England has shown that, by judicious choice of the forecast
horizon, inflation-forecast-targeting regimes can achieve as
much by way of output smoothing as policy rules which
target output explicitly (Batini and Haldane (1998)). The
vehicle through which the Bank of England exercises this
leverage over the inflation target horizon is the open letter
system. Reflecting its concerns about the profile for output
as well as inflation, the Bank of England publishes a “fan
chart” for output growth as well as inflation.
A key message for the Czech Republic, however, is
that a concern for output objectives is safest when inflation
is already close to its medium-term target. There is less
scope for accommodation of inflation shocks during the
process of disinflationary transition to price-stability. In
these circumstances, positive inflationary impulses which
are not offset risk damaging credibility and stoking-up
inflationary expectations. The same is not, however, true of
negative inflation shocks which lower inflation. During the
disinflationary process, these negative shocks should be
fully accommodated and locked-in. In other words, during
disinflationary transition, shocks should be dealt with
“opportunistically” – the favourable shock presenting an
opportunity which ought to be seized through
accommodation, but the unfavourable one not being
accommodated.
This situation seems to characterise well the current
one in the Czech Republic. The favourable shocks which
have pushed inflation down to near its target for the year
2000 should not be reversed. This would inflict an
unnecessary further disinflation on the economy, with its
attendant costs. Instead such favourable shocks should be
gratefully pocketed, and policy set such that lower inflation
expectations become locked-in. Once these lower inflation
expectations are locked in, there is then greater scope for
monetary policy to smooth out the effects of supply shocks
on output/employment, perhaps using some of the
institutional mechanisms highlighted above.
7 Transparency
A defining feature of inflation-targeting regimes is
the extent of their transparency. In some ways this is also a
necessary feature, because the policy rule under this regime
– equation (1) – is undoubtedly a complex one. For
example, without publication of the inflation forecast and
some notion of its origin, it would be difficult for the public
to monitor whether monetary policymakers were adhering to
the rule. Credibility may be damaged. That is one reason
why inflation forecasts are explicitly published in the UK
and New Zealand.
There are a variety of other ways in which
monetary policy transparency is enhanced in the UK. The
minutes of the monthly MPC meetings are now published
with a two week lag; and the Bank’s Inflation Report is
produced on a quarterly cycle. The latter contains the
Bank’s projections for inflation and output growth. These
publications give an insight into the analysis underlying the
Bank’s inflation outlook; and the way in which this analysis
in turn affects the distribution of future inflation and,
ultimately, the MPC’s decision-making. This is a degree of
policy transparency probably unparalleled in monetary
history. And though the UK is perhaps at one end of the
transparency spectrum, it is significant that all the
inflation-targeting central banks – indeed, some
non-inflation targeters too, such as Norway and Israel – are
also now publishing inflation or monetary policy reports on
10
a regular cycle. The Czech Republic is the latest of the
Inflation Report recruits.
It is worth considering some of the benefits that
enhanced transparency confers. There are both internal and
external benefits. Internally, the act of exposing policy
analysis to outside scrutiny acts as a powerful incentive to
ensure this analysis is of the highest possible standard. It
exposes internal thinking to a powerful external discipline.
Externally, transparency serves as a useful accountability
device – a political-economy benefit. It also, however,
delivers macroeconomic benefits. For example, it increases
the degree of predictability of the authorities’ reaction
function and hence ought to help stabilise the yield curve.
To understand this latter benefit, imagine a world
in which the policymakers’ policy rule was perfectly
predictable and the authorities’ inflation target was
fully-credible.
We would then see the yield curve moving around in
response to macroeconomic “news”, to the extent that such
news affected the central banks’ inflation forecast and hence
the settings of its policy instrument. But we would not
expect to see any response from the yield curve in response
to monetary policy changes. These policy changes would
contain no extra information; they would be perfectly
anticipated because the policy rule was fully transparent.
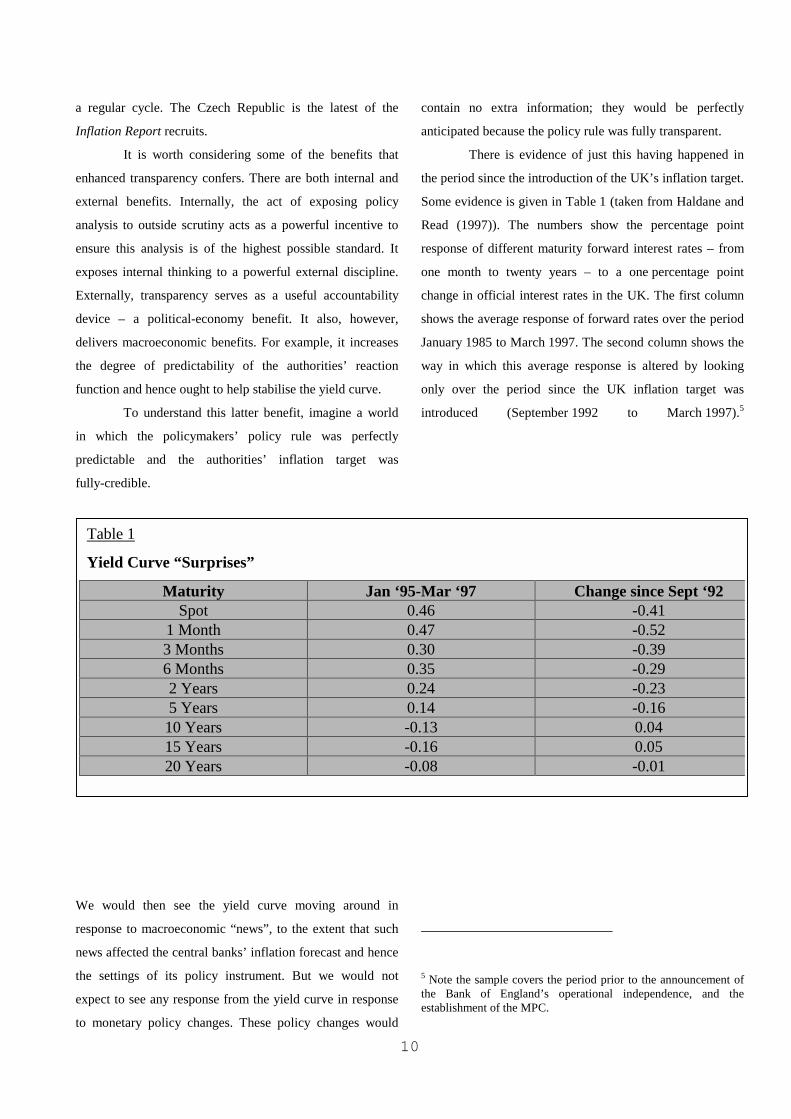
There is evidence of just this having happened in
the period since the introduction of the UK’s inflation target.
Some evidence is given in Table 1 (taken from Haldane and
Read (1997)). The numbers show the percentage point
response of different maturity forward interest rates – from
one month to twenty years – to a one percentage point
change in official interest rates in the UK. The first column
shows the average response of forward rates over the period
January 1985 to March 1997. The second column shows the
way in which this average response is altered by looking
only over the period since the UK inflation target was
introduced (September 1992 to March 1997).5
5 Note the sample covers the period prior to the announcement ofthe Bank of England’s operational independence, and theestablishment of the MPC.
Table 1
Yield Curve “Surprises”
Maturity Jan ‘95-Mar ‘97 Change since Sept ‘92Spot 0.46 -0.41
1 Month 0.47 -0.523 Months 0.30 -0.396 Months 0.35 -0.292 Years 0.24 -0.235 Years 0.14 -0.1610 Years -0.13 0.0415 Years -0.16 0.0520 Years -0.08 -0.01
11
Two points are significant. First, the response of
the yield curve to official rate changes is significant along
the entire yield curve (a * indicates significance at 95%),
with a response which is around one third at the short end
and which is negative at the long end. Second, however,
these responses have been (statistically significantly)
damped following the introduction of the inflation target and
its accompanying transparency reforms. Policy “surprises”
have been fewer in the transparent, inflation-targeting
regime. This is evidence of one tangible macroeconomic
benefit of greater transparency – greater stability in the yield
curve. It goes some way towards explaining the drive
towards greater openness among all central banks over
recent years – including, significantly, the Czech National
Bank.
8 Dealing with the Exchange Rate
The inflation-targeting countries are all architypical
small, open economies. This means that they inevitably face
difficult questions about how best to respond to movements
in the exchange rate, given its important influence on
inflation and output dynamics. This is particularly the case
in as open an economy as the Czech Republic. There are
broadly two approaches which inflation-targeting central
banks have used to analyse the effects of exchange rate
movements on monetary conditions.
The first is the construction of Monetary
Conditions Indices (MCI), weighting together interest and
exchange rate movements, with weights depending upon
their relative importance for output/inflation dynamics. Such
indices have been widely used by the Reserve Bank of New
Zealand and the Bank of Canada. The Bank of Canada, for
example, has a “desired” path for monetary conditions –
consistent with their inflation target – and compares the
actual MCI with this when deciding whether to tighten or
loosen the monetary stance.
The second approach is what we might call the
“spot-the-shock” approach. This is the approach used in the
UK. It begins by asking the question: what shock caused the
exchange rate to move? For example, was it temporary or
permanent? Was it caused by domestic or foreign
developments? Are these shocks real or monetary in nature?
The reason for asking these questions is that different shocks
may have very different implications for monetary
conditions and hence for the setting of monetary policy.
Perhaps the best way of illustrating this approach is
with an example. Between August 1996 and the middle of
1998, sterling rose by over 20%. Why? Did it simply reflect
the effect of the (relative) tightening of UK monetary policy
over the period – a temporary effect? Or was the shift due to
something structural and hence more permanent in nature?
One means of identifying the “monetary” component of
exchange rate movements is to look at relative yield curve
movements. Using the uncovered interest parity theorem, it
is possible to calculate how much of a given exchange rate
change is induced by relative yield curve news (see Bridgen,
Martin and Salmon (1997)). An example of this type of
exercise, from August 1996 onwards, is shown in Chart 6.
The light line shows the cumulative actual change in the
exchange rate; the darker lines, the range of appreciation
that can be explained by relative yield curve movements –
“monetary news” – on the assumption that uncovered
interest parity holds. As is clear, monetary shocks do not
seem capable of explaining more than 2–3% of the 20%
appreciation.
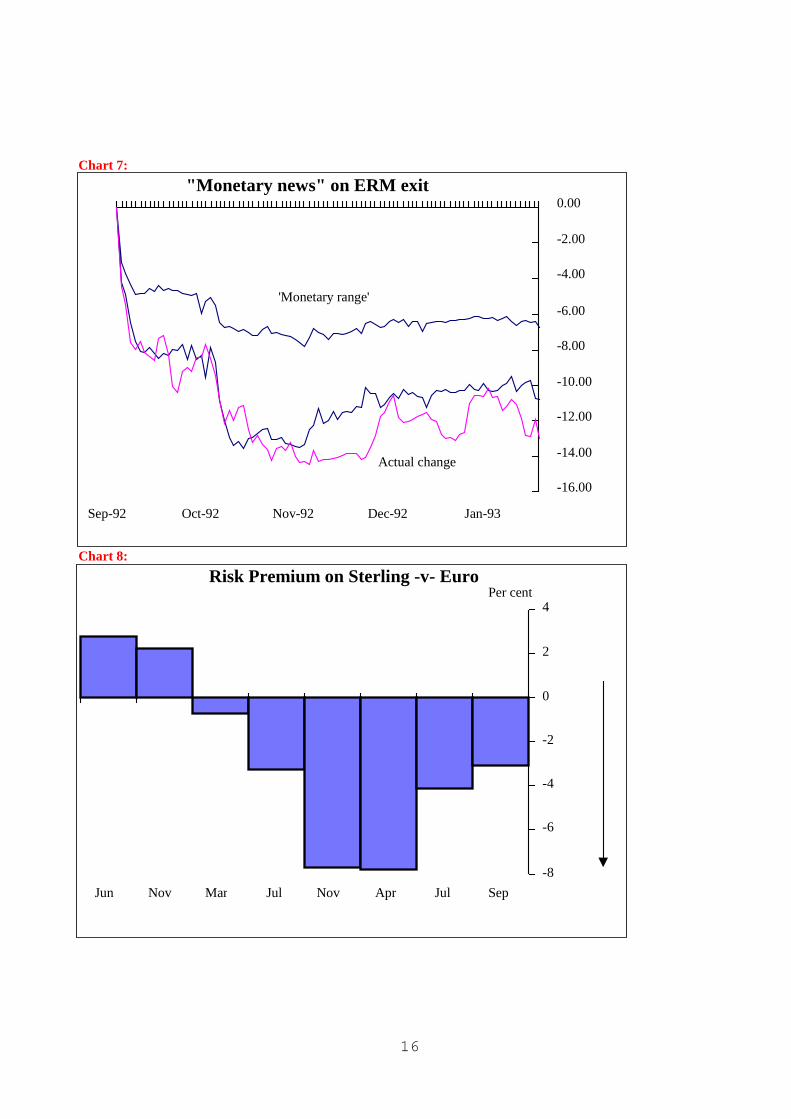
The fault could of course lie with assumption of
uncovered interest parity. But the same technique has been
shown to account for a substantial proportion of previous
large exchange rate movements. Chart 7, for example, shows
the movement in sterling following its exit from the
European Exchange Rate Mechanism (ERM) in September
1992. Movements in relative interest rates – monetary
shocks – plausibly accounted for most of the 10%
depreciation in that instance.
But if most of sterling’s appreciation between 1996
and mid-1998 was not sourced in monetary policy, what was
its source? Another possible explanation was a fall in the
sterling risk premium – for example, resulting from EMU
uncertainties which affected the EU countries against whom
12
sterling appreciated most strongly. Again, some calculations
can be conducted using the uncovered interest parity
condition and survey-based measures of exchange rate
expectations. Chart 8 illustrates. The estimated risk premium
on sterling assets versus a synthetic euro asset (comprising
France, Germany and Italy) went from being positive in
mid-1996 to strongly negative at the end of 1996 and
through 1997. This is consistent with part of sterling’s
appreciation being driven by a lowering of its perceived
riskiness relative to other euro currencies in the run-up to
EMU. Towards the end of the sample, as EMU uncertainty
abated, the estimated risk premium rose again – and sterling
fell.
A third potential factor behind sterling’s
appreciation was a real exchange rate shift – for example,
some exogenous improvement in the demand for UK
exports. Historical variance compositions from structural
VARs suggested this too may have been part of the
explanation. Such an explanation has very different
implications, however, for the evaluation of monetary
conditions. First, the shift is then more likely to be
permanent, or at least persistent. And second, it implies that
sterling’s appreciation need not be as damaging for
competitiveness and hence for output, since it represents a
rise in the equilibrium real exchange rate.
This example serves to illustrate some of the merits
of the “spotting the shocks” approach, when feeding the
exchange rate through a macro-model and generating
quantified inflation forecasts. Indeed, without an
appreciation and understanding of these shocks, a
mechanical feeding through of the exchange rate is likely to
prove misleading. This applies with particular force in very
open economies, like the Czech Republic.
9 Summary
This paper has discussed some of the technical
issues which arise when operating monetary policy
according to an explicit inflation target. It has also discussed
the approaches which some inflation-targeting central banks
– and the Bank of England in particular – have taken to
dealing with these issues. Some of these approaches, if not
the issues themselves, are new and there is scope for
developing them further – not least when applying them to
transitional economies such as the Czech Republic.
None of these technical issues would, however,
preclude the effective use of an inflation-targeting regime by
a transitional economy. Indeed, the flexibility, transparency
and clarity of such a regime means that it would seem to be
well suited to transitional economies. For these reasons, we
might expect further recruits to the inflation-targeting club
looking forward.
13
Chart 1:
Chart 2:
UK Forward Inflation Rates
0
1
2
3
4
5
6
7
8
2 3 4 5 6 7 8 9 10 11 12 13 14 15 16 17 18 19 20 21 22 23 24 25Maturity
Per cent
September
April 1997
May 1997October
Inflation
No of
Rate of
0
20
40
60
80
100
120
140
160
180
200
0 0.5 1 1.5 2 2.5 3 3.5 4 4.5 5 >5
What would be the right rate ofinflation for the UK?

14
Chart 3:
Chart 4 (a): Chart 4 (b):
10-Year Forward Inflation Rates
0
1
2
3
4
5
6
7
8
Sep-92
Mar-93
Sep-93
Mar-94
Sep-94
Mar-95
Sep-95
Mar-96
Sep-96
Mar-97
Sep-97
Mar-98
Sep-98
Per cent
Upper limit of inflation target
Inflation Responses (Horizon <2 years)
-1
-0.5
0
0.5
1
1.5
1 4 7 10 13 16 19 22 25 28 31 34 37 40 43 46 49Periods (Quarters)
Inflation
Inflation Responses (Horizon >2 years)
-0.2
0
0.2
0.4
0.6
0.8
1
1.2
1.4
1.6
1.8
2
1 4 7 10 13 16 19 22 25 28 31 34 37 40 43 46 49
Periods (Quarters)
Inflation
15
Chart 5: Inflation Forecasts
Chart 6:
1 9 9 4 9 5 9 6 9 7 9 8 9 9 2 0 0 00
1
2
3
4
5
6I n c r e a s e in p r ic e s o n a y e a r e a r lie r
-5
0
5
10
15
20
25
30
Aug-96 Dec-96 Apr-97 Aug-97 Jan-98 May-98
Actual change
'Monetary range'
"Monetary News" and Sterling's Appreciation
16
Chart 7:
Chart 8:
-16.00
-14.00
-12.00
-10.00
-8.00
-6.00
-4.00
-2.00
0.00
Sep-92 Oct-92 Nov-92 Dec-92 Jan-93
Actual change
'Monetary range'
"Monetary news" on ERM exit
Risk Premium on Sterling -v- Euro
-8
-6
-4
-2
0
2
4
Jun Nov Mar Jul Nov Apr Jul Sep
Per cent
17
References
Barro, R (1995), “Inflation and Economic Growth”, Bankof England Quarterly Bulletin,Vol 35, 166-176.
Batini N and Haldane A G (1999), “Forward-lookingRules for Monetary Policy”, Bank of England WorkingPaper No.92.
Bernanke B, Laubach T, Mishkin F and Posen A (1999),“Inflation Targeting”
Brigden A, Martin B and Salmon C (1998),“Decomposing Exchange Rate Movements According to theUncovered Interest Rate parity Condition”, Bank of EnglandQuarterly Bulletin, Vol 37, No. 4, 377-389.
Cunningham A W F (1996), “Measurement Biases in PriceIndices: An Application to the UK’s RPI”, Bank of EnglandWorking Paper No.47.
Feldstein M (1996), “The Costs and Benefits of Going fromLow Inflation to Price Stability”, NBER Working PaperNo.5469.
Haldane A G (1995), Targeting Inflation, Bank of England.
Haldane A G (1995), “On Inflation Targeting in the UnitedKingdom”, Scottish Journal of Political Economy, Vol 45,1-32.
Haldane A G and Read V (1999), “Monetary PolicySurprises and the Yield Curve”, Bank of England WorkingPaper, forthcoming.
Judson R, and Orphanides A (1996), “Inflation, Volatilityand Growth”, Board of Governors of the Federal ReserveSystem Finance and Economics Discussion Paper No. 96-119.
Leiderman L and Svensson L (1995), Inflation Targets,Centre for Economic Policy Research.
Lowe P (1997), Monetary Policy and Inflation Targeting,Reserve Bank of Australia.
Mahadeva L (1998), “Forecasting in the Central Bank”,mimeo, Bank of England.
Whitley J D (1998), “The Inflation Report Projections:Understanding the Fan Chart”, Bank of England QuarterlyBulletin, Vol 38, No.1, 30-37.
18
The Czech Approach to Inflation Targeting
Miroslav Hrnčíř and Kateřina Šmídková1
1 Introducing Inflation Targeting in the Czech Republic
2 The Decision-Making Process: January – July 1998
3 Is a Transitional Country a "Good" Inflation Targeter?
Appendix: Basic Indicator
1 We would like to thank Dana Rottová for her technical support during this project.
19
1 Introducing Inflation Targeting
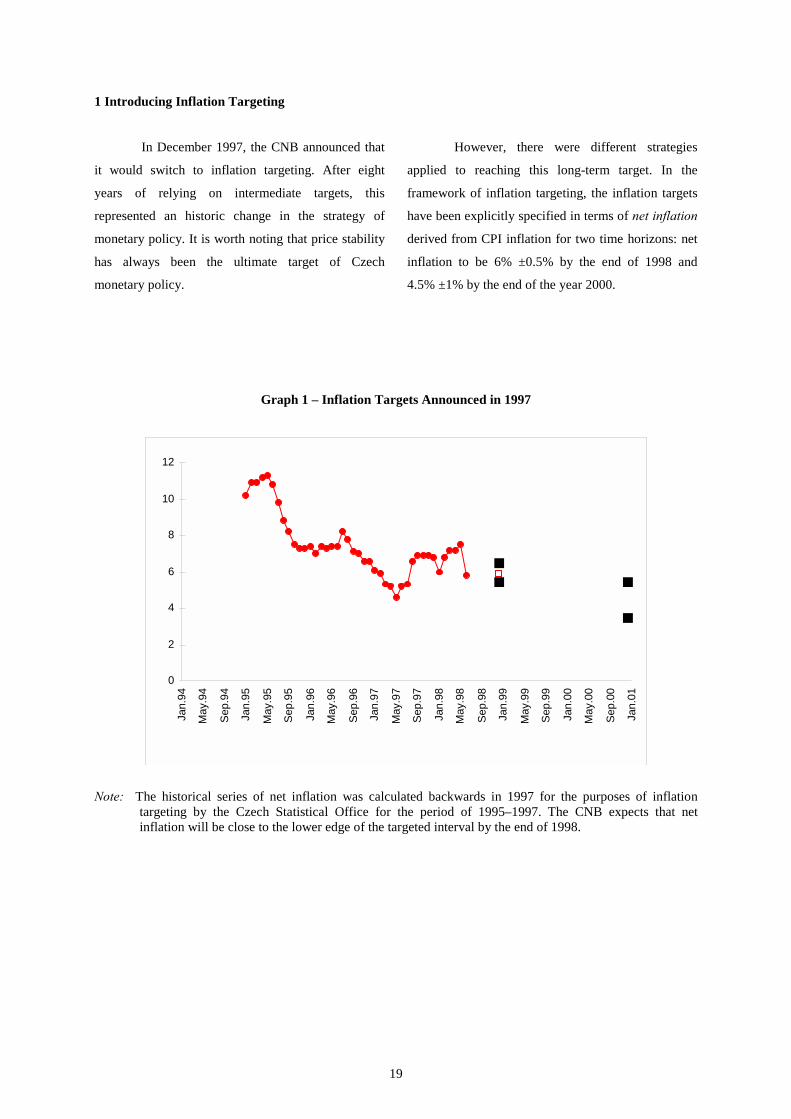
In December 1997, the CNB announced that
it would switch to inflation targeting. After eight
years of relying on intermediate targets, this
represented an historic change in the strategy of
monetary policy. It is worth noting that price stability
has always been the ultimate target of Czech
monetary policy.
However, there were different strategies
applied to reaching this long-term target. In the
framework of inflation targeting, the inflation targets
have been explicitly specified in terms of net inflation
derived from CPI inflation for two time horizons: net
inflation to be 6% ±0.5% by the end of 1998 and
4.5% ±1% by the end of the year 2000.
Graph 1 – Inflation Targets Announced in 1997
0
2
4
6
8
10
12
Jan.
94
May
.94
Sep.
94
Jan.
95
May
.95
Sep.
95
Jan.
96
May
.96
Sep.
96
Jan.
97
May
.97
Sep.
97
Jan.
98
May
.98
Sep.
98
Jan.
99
May
.99
Sep.
99
Jan.
00
May
.00
Sep.
00
Jan.
01
Note: The historical series of net inflation was calculated backwards in 1997 for the purposes of inflationtargeting by the Czech Statistical Office for the period of 1995–1997. The CNB expects that netinflation will be close to the lower edge of the targeted interval by the end of 1998.
20
1.1 A Short History
The stability of the Czech koruna has been
the ultimate monetary policy target of the CNB
according to bank law since the very beginning of the
bank’s existence2. In 1993, the Czech Republic had
reached the halfway mark in the transitional process
and in the process of disinflation. As a consequence, it
was necessary to derive the strategy of monetary
policy from some concept of medium-term stability.
During 1993–1997, before switching to inflation
targeting, the CNB had used three strategies. All three
were based on working with intermediate targets and
were to a significant extent affected by the transitional
process.
2 As a consequence of the dissolution of Czechoslovakia,the Czech National Bank was established on January 1,1993 and became the successor to the State Bank ofCzechoslovakia.
For example, instruments were being
changed quite often as financial markets progressed
from an embryonic stage of development to more
advanced stages.
The first strategy was used in 1993–1995.
The koruna was pegged to a basket of currencies, and
the money supply was used as a complementary
intermediate target. Each year, the targeted interval
was announced for money supply annual growth
together with a forecast of CPI inflation that was
projected in accordance with both intermediate
targets. Table 1 shows that in these years, the CNB
was aiming at slow disinflation.
Table 1. Targets and Inflation Forecasts: 1993–1997
Forecast of
CPI Inflation
(in %)
Intermediate Target: Money
Supply Growth
(in %)
Intermediate Target:
Exchange Rate Peg
Operational Targets/
Instruments
1993 15 (18) complementary
16 ±1 (21)
”92” peg
band 0.5%
Monetary base
1994 10 (10) complementary
13.5 ±1.5 (22)
”92” peg
band 0.5%
Free reserves
1995 9 (9) complementary
15.5 ±1.5 (19)
”92” peg
band 0.75%
Free reserves with
over-writing rule
1996 9 (9) 15 ±2
(8)
”92” peg
band 7.5%
Short-term rates
REPO rate
1997 8 (9) 10 ±2
(10)
”92” peg
band 7.5%
May: koruna floats
Short-term rates
REPO rate
Note: The overview of intermediate, operational targets/instruments and inflation forecasts is based on Annual Reports bythe CNB and the annual monetary documents prepared for each year in December of the previous year. Although sometargets were modified during the year, we do not report the modifications here for the sake of simplicity. For example, in1994 due to capital inflow, the target for money supply growth was modified upwards, but the growth exceeded the upperlimit. The actual values of respective variables are in parentheses. The actual CPI inflation deviated from the forecast intwo periods when monetary policy decisions were subject to transitional uncertainty. In 1993, the VAT reform was anexogenous shock with the impact on CPI inflation higher than anticipated. In 1997, exchange rate turbulence andsubsequent exchange rate depreciation were the causes of deviation.
21
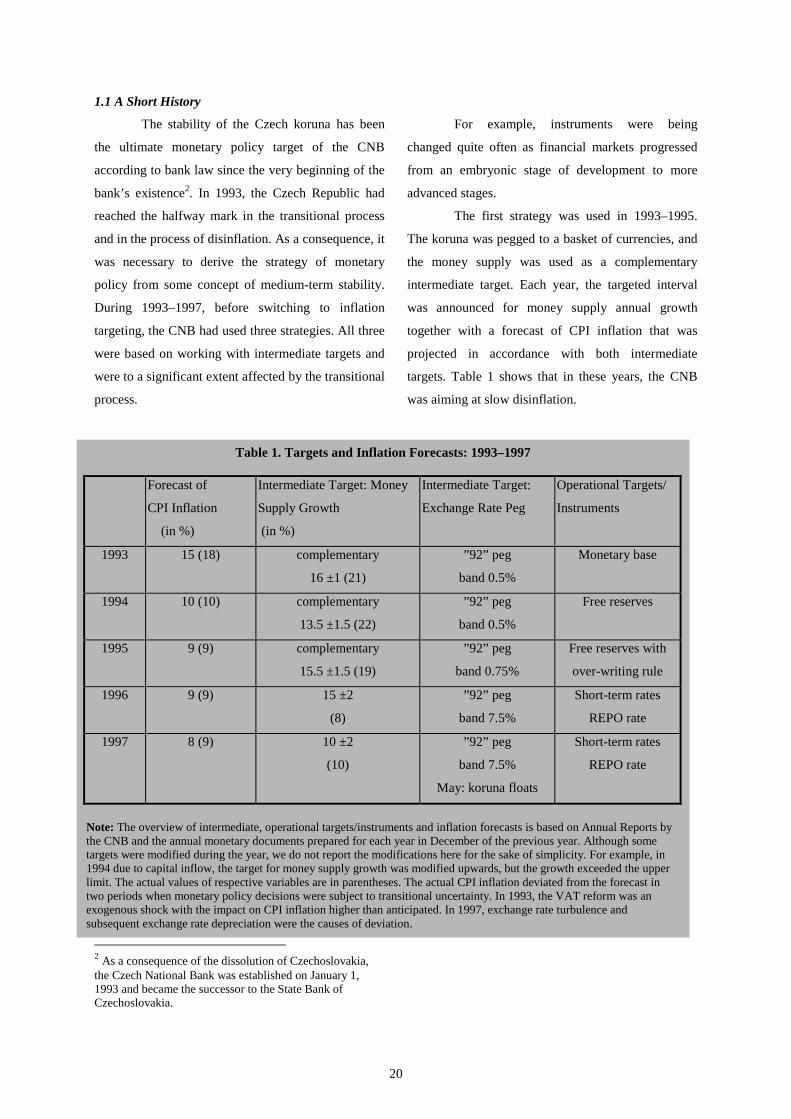
In the first years of transition, the pegged
exchange rate provided a nominal anchor for the
Czech economy and was a key intermediate target for
the CNB. Due to the low degree of koruna
convertibility, it was possible to work with the money
supply as well. This complementary intermediate
target was important since due to embryonic financial
markets, the only available operational targets were
quantitative ones. Also, the target for money supply
had its important signalling role, because the credit
limits were characteristic features of the previous
stages of transition.
In the period of 1993–1995, two operational
targets were used simultaneously (monetary base, free
reserves), and these targets were compatible with
money supply targeting. The main reason for working
with volume targets was that the financial markets
were in an embryonic stage of development and were
too thin to give reliable information on prices. In
1995, when markets became more advanced, the
combined operational target was used for free
reserves with the over-writing rule for maximum
value of the short-term money market rate. The
strategy of monetary policy was changed for the first
time in 1996. As a response to large capital inflows,
financial market developments and liberalisation of
capital account transactions, the relative importance
of intermediate targets was altered. The koruna was
still pegged to a basket, but bands were much wider,
and intervention on the foreign exchange market
became rare. The target for money supply growth
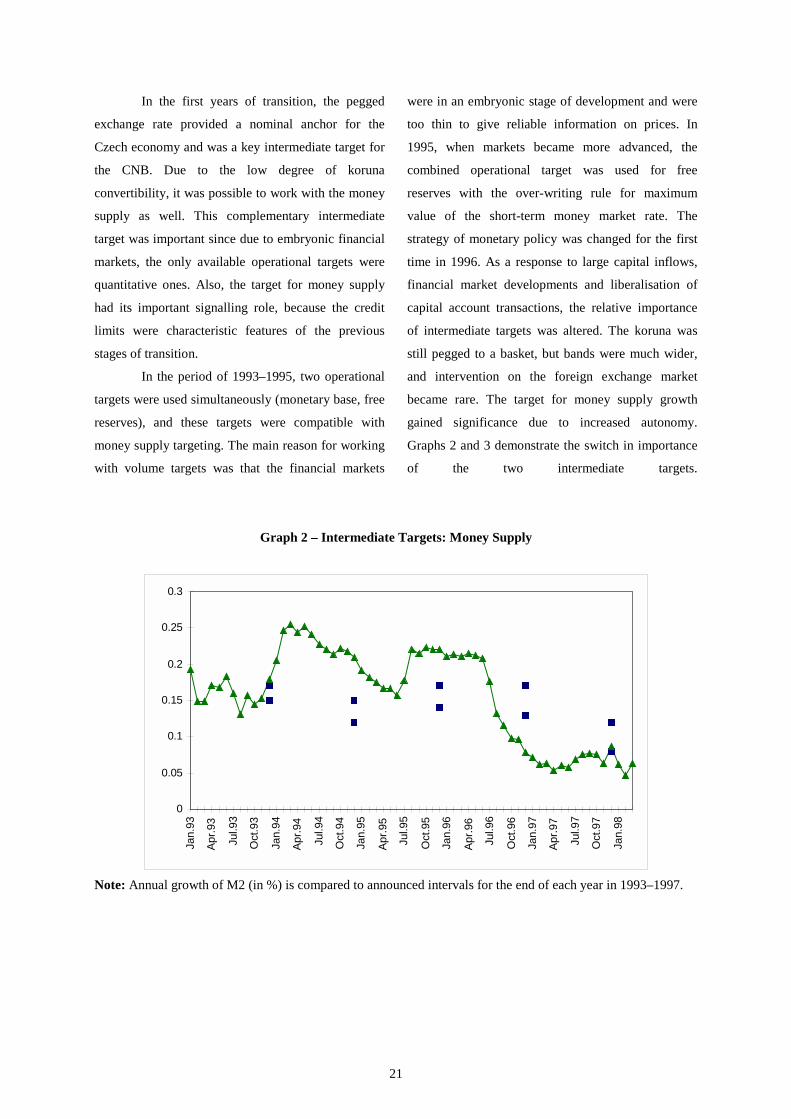
gained significance due to increased autonomy.
Graphs 2 and 3 demonstrate the switch in importance
of the two intermediate targets.
Graph 2 – Intermediate Targets: Money Supply
0
0.05
0.1
0.15
0.2
0.25
0.3
Jan.
93
Apr.9
3
Jul.9
3
Oct
.93
Jan.
94
Apr.9
4
Jul.9
4
Oct
.94
Jan.
95
Apr.9
5
Jul.9
5
Oct
.95
Jan.
96
Apr.9
6
Jul.9
6
Oct
.96
Jan.
97
Apr.9
7
Jul.9
7
Oct
.97
Jan.
98
Note: Annual growth of M2 (in %) is compared to announced intervals for the end of each year in 1993–1997.
22
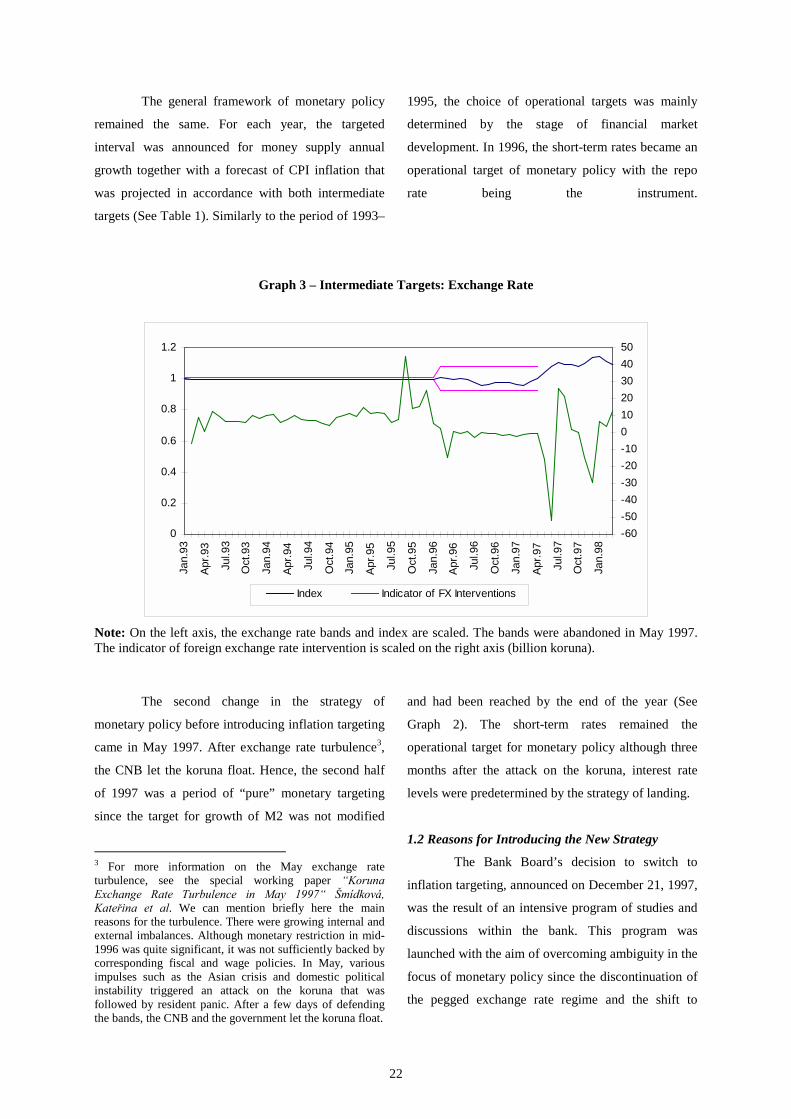
The general framework of monetary policy
remained the same. For each year, the targeted
interval was announced for money supply annual
growth together with a forecast of CPI inflation that
was projected in accordance with both intermediate
targets (See Table 1). Similarly to the period of 1993–
1995, the choice of operational targets was mainly
determined by the stage of financial market
development. In 1996, the short-term rates became an
operational target of monetary policy with the repo
rate being the instrument.
Graph 3 – Intermediate Targets: Exchange Rate
0
0.2
0.4
0.6
0.8
1
1.2
Jan.
93
Apr.9
3
Jul.9
3
Oct
.93
Jan.
94
Apr.9
4
Jul.9
4
Oct
.94
Jan.
95
Apr.9
5
Jul.9
5
Oct
.95
Jan.
96
Apr.9
6
Jul.9
6
Oct
.96
Jan.
97
Apr.9
7
Jul.9
7
Oct
.97
Jan.
98
-60-50-40-30-20-1001020304050
Index Indicator of FX Interventions
Note: On the left axis, the exchange rate bands and index are scaled. The bands were abandoned in May 1997.The indicator of foreign exchange rate intervention is scaled on the right axis (billion koruna).
The second change in the strategy of
monetary policy before introducing inflation targeting
came in May 1997. After exchange rate turbulence3,
the CNB let the koruna float. Hence, the second half
of 1997 was a period of “pure” monetary targeting
since the target for growth of M2 was not modified
3 For more information on the May exchange rateturbulence, see the special working paper “KorunaExchange Rate Turbulence in May 1997“ Šmídková,Kateřina et al. We can mention briefly here the mainreasons for the turbulence. There were growing internal andexternal imbalances. Although monetary restriction in mid-1996 was quite significant, it was not sufficiently backed bycorresponding fiscal and wage policies. In May, variousimpulses such as the Asian crisis and domestic politicalinstability triggered an attack on the koruna that wasfollowed by resident panic. After a few days of defendingthe bands, the CNB and the government let the koruna float.
and had been reached by the end of the year (See
Graph 2). The short-term rates remained the
operational target for monetary policy although three
months after the attack on the koruna, interest rate
levels were predetermined by the strategy of landing.
1.2 Reasons for Introducing the New Strategy
The Bank Board’s decision to switch to
inflation targeting, announced on December 21, 1997,
was the result of an intensive program of studies and
discussions within the bank. This program was
launched with the aim of overcoming ambiguity in the
focus of monetary policy since the discontinuation of
the pegged exchange rate regime and the shift to
23
managed floating at the end of May 1997 left the
central bank without a transparent nominal anchor for
its policy. Arguments in favour of the adopted
decision are explained in the following paragraphs.
Firstly, the key issue has become the challenge of
securing effective control over the formation of
inflation expectations. Though the Czech Republic
was the first transition economy in the region to
achieve one-digit inflation in terms of CPI in 1994,
some inflation inertia prevailed, and CPI inflation has
fluctuated around 9 – 10% since then. Moreover, in
late 1997 a new inflation episode had begun to
develop. The outlook for the first months of 1998
signalled the acceleration of inflation well above one-
digit levels for the first time since 1994.
In the aftermath of exchange rate turbulence,
not only did the economy lose its nominal exchange
rate anchor of the past eight years, but the experience
suggested that the previous strategies were not
effective enough to reduce inflation expectations in
the changing conditions of the successive transitional
stages. In particular, the wage negotiations continued
to be based on a double-digit assumption4 despite the
fact that the koruna was pegged to the basket of DEM
and USD with no change in central parity up until
May 1997. The parallel intermediary target, the
money supply in terms of M2, was also met in 1997.
The conclusion followed that those frameworks were
not capable nor credible enough to affect the
expectations, and therefore, could not secure the
continuation of the disinflation process.
The strategy of inflation targeting offered an
attractive alternative. Unlike previous non-binding
annual forecasts, inflation targeting implies the
unambiguous declaration of the disinflationary path
and explicit quantitative targets of the disinflation
process as a public commitment of the CNB.
Disinflation became not only a prime objective, but
4 In 1993, growth of average nominal wage was 25%, in1994 17%, 1995 18%, 1996 14% and 1997 12%.
also a direct objective of monetary policy.
Accordingly, economic agents were provided with a
new medium-term nominal anchor on which they
could base their expectations and decision-making
processes. This new nominal anchor also supplied
economic agents with a longer time horizon than
annual forecasts. Moreover, given the solid reputation
of the CNB and its independence, this anchor was
likely to be more credible than the previous forecasts.
Secondly, the intermediary targets, i.e. the
pegged exchange rate and monetary aggregates
showed increased inconsistency with the underlying
conditions of an advanced stage of financial openness.
In its relatively flexible version of a horizontal band
of ±7.5%, though, the pegged exchange rate regime
proved to be non-sustainable and lost credibility
during the exchange rate turbulence in May 1997. The
option to reintroduce this peg seemed therefore
entirely unfeasible, especially due to two features: (i)
the open capital account and liberalised financial
markets made massive capital flows possible (both
inflows and outflows) which started to dominate
exchange rate developments especially in the short
run, and (ii) the process of relative price adjustments
especially in the segment of still administered prices,
such as energy prices for households, rents, transport
tariffs and utility prices, was targeted to continue in
the forthcoming period.
Accordingly, the option of importing low
inflation from abroad via the pegged exchange rate
regime could not be expected to be sustainable. The
risk of large external imbalances parallel to the
developments of 1996 and 1997 would be rather high.
The managed float alternative, on the other hand,
provided for the flexibility of timely, smooth
corrections. In the case of increasing major
imbalances, the exchange rate movements would
signal inconsistency in the policies. The flexible
24
character of the exchange rate arrangement was
necessary in a regime of inflation targeting.
As for monetary aggregates and the monetary
transmission mechanism, the previous experience had
revealed some limitations and weaknesses. The links
between money supply (M2) and price developments
(CPI inflation) as well as between the intermediate
target (M2) and controlled interest rates (REPO rates)
did not prove to be predictable nor sufficiently stable.
In addition to the constraints observed elsewhere, the
conditions of an economy in transition made their
application even less reliable. This was due, in
particular, to (i) a sequence of price shocks related to
transition (corrections of administered prices, tax
reforms) which distorted the link between the money
supply and price developments, (ii) the institutional
features of financial markets going through profound
changes within a relatively short time span. This
refers also to the operational targets and instruments
of monetary policy. In principle, monetary
transmission switched from quantities to prices, and
(iii) the emergence of new financial assets, as well as
new types of transactions and new market players
making the demand for money function very unstable.
The behaviour of commercial banks, for example, was
subject to far-reaching changes in their regulation, in
the impact of privatisation as well as in the
macroeconomic environment.
Consequently, monetary targeting itself
could hardly secure a reliable basis for the medium-
term disinflation strategy. Inflation targeting, on the
other hand, provided a framework integrating a
number of relevant economic indicators (including
money supply as an important one). The common
focus and the organising criterion for their assessment
contributed to the final goal of disinflation.
Thirdly, inflation targeting has provided a
scheme for filtering out exogenous price shocks from
“standard” inflationary pressures. The adopted
concept of net inflation excluded regulated or
administered prices as well as the effects of indirect
taxes on the prices of the remaining goods and
services. Accordingly, net inflation allowed monetary
policy to accommodate the primary inflation impulses
of transitional shocks such as corrections of
administered prices. On the other hand, this
framework allowed the central bank to react to their
secondary inflationary effects and to prevent a
spillover to price level increases.
1. 3 Implementation
In December 1997, the CNB defined its
inflation targets in terms of net inflation with the aim
of excluding transitional price shocks such as price
corrections (sometimes also called price deregulation)
and changes in taxes. The net inflation index was
calculated backwards for the purposes of inflation
targeting by the Czech Statistical Office. The
consumer basket defined for the purposes of the CPI
was adjusted for items with regulated prices and
prices affected by other administrative measures.
According to this definition, the net inflation index
represents approximately 82% of the consumer price
index (it covers 663 of the 754 price items).
The list of items excluded from the total
consumer price index was as follows: (i) prices
regulated by the Ministry of Finance (e.g. electricity)
and prices regulated by local authorities (e.g. taxis) -
weight in CPI, 7.4%, (ii) items with semi-regulated
prices (e.g. postal service) - weight in CPI, 6% (iii)
fees (e.g. TV and radio fees) - weight in CPI, 4.4%. It
is worth noting that the index of net inflation can
change from year to year due to this definition if there
is a change in government strategy. For example, in
1997 taxis became a sector regulated by local
authorities. Hence, the prices of taxis were excluded
from the net inflation index.
In the next step, the growth rate was
calculated for this reduced index and the inflation rate
was modified in order to exclude the impact of
25
changes in indirect taxes (e.g. tobacco tax) or the
impact of changes in subsidies. This means that items
whose prices change due to tax changes remained a
part of the net inflation index, however, the influence
of tax changes was eliminated from net inflation.
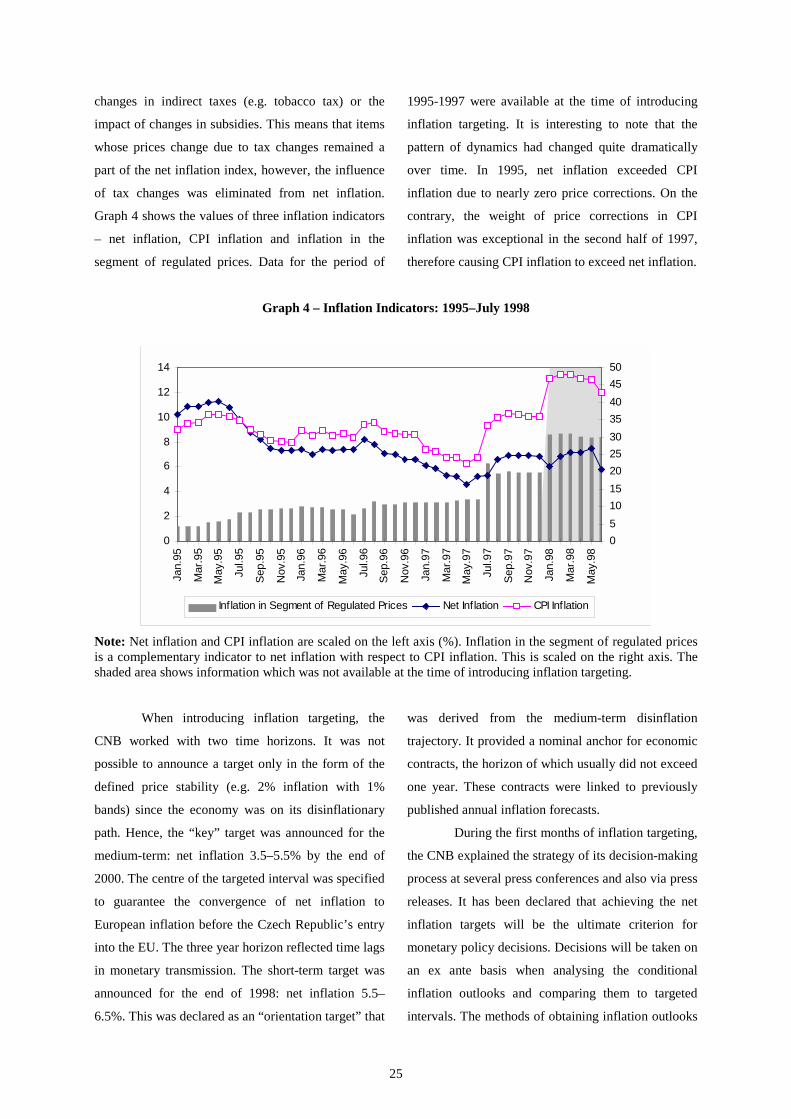
Graph 4 shows the values of three inflation indicators
– net inflation, CPI inflation and inflation in the
segment of regulated prices. Data for the period of
1995-1997 were available at the time of introducing
inflation targeting. It is interesting to note that the
pattern of dynamics had changed quite dramatically
over time. In 1995, net inflation exceeded CPI
inflation due to nearly zero price corrections. On the
contrary, the weight of price corrections in CPI
inflation was exceptional in the second half of 1997,
therefore causing CPI inflation to exceed net inflation.
Graph 4 – Inflation Indicators: 1995–July 1998
0
2
4
6
8
10
12
14
Jan.
95
Mar
.95
May
.95
Jul.9
5
Sep.
95
Nov
.95
Jan.
96
Mar
.96
May
.96
Jul.9
6
Sep.
96
Nov
.96
Jan.
97
Mar
.97
May
.97
Jul.9
7
Sep.
97
Nov
.97
Jan.
98
Mar
.98
May
.98
05101520253035404550
Inflation in Segment of Regulated Prices Net Inflation CPI Inflation
Note: Net inflation and CPI inflation are scaled on the left axis (%). Inflation in the segment of regulated pricesis a complementary indicator to net inflation with respect to CPI inflation. This is scaled on the right axis. Theshaded area shows information which was not available at the time of introducing inflation targeting.
When introducing inflation targeting, the
CNB worked with two time horizons. It was not
possible to announce a target only in the form of the
defined price stability (e.g. 2% inflation with 1%
bands) since the economy was on its disinflationary
path. Hence, the “key” target was announced for the
medium-term: net inflation 3.5–5.5% by the end of
2000. The centre of the targeted interval was specified
to guarantee the convergence of net inflation to
European inflation before the Czech Republic’s entry
into the EU. The three year horizon reflected time lags
in monetary transmission. The short-term target was
announced for the end of 1998: net inflation 5.5–
6.5%. This was declared as an “orientation target” that
was derived from the medium-term disinflation
trajectory. It provided a nominal anchor for economic
contracts, the horizon of which usually did not exceed
one year. These contracts were linked to previously
published annual inflation forecasts.
During the first months of inflation targeting,
the CNB explained the strategy of its decision-making
process at several press conferences and also via press
releases. It has been declared that achieving the net
inflation targets will be the ultimate criterion for
monetary policy decisions. Decisions will be taken on
an ex ante basis when analysing the conditional
inflation outlooks and comparing them to targeted
intervals. The methods of obtaining inflation outlooks
26
have been described. The CNB would evaluate both
sets of economic indicators5 as well as rely on model
simulations. The following decision scheme was
specified: should the inflation outlook deviate from
the inflation target, an adjustment of the operational
target (repo rate) will be considered.
Inflation targeting has been reflected in the
CNB’s approach to the general public. In order to
increase transparency, the CNB has started
publicising the minutes of the board meetings on
internet two weeks after a meeting is held with a
fairly detailed description of the discussion as well as
the reasoning behind monetary policy decisions. At
the end of the quarter, the CNB started producing
inflation reports that focus on price and monetary
developments, inform about real economy and
external sector developments and include an inflation
outlook together with an explanation of monetary
measures.
2 The Decision-Making Process:
January–July 1998
Let us now describe the decision-making
process in the first seven months of inflation targeting
in the Czech Republic. Following this, we will
summarise some important features of the process.
Our source of information has been the Minutes of the
Board Meetings on monetary policy issues. The
minutes are officially publicised each month, two
weeks after the meeting is held.
5 A set of indicators is formulated in such a way as to coverthe main components of inflationary influences, i.e. demandand cost factors, as well as factors related to inflationexpectations. The set of indicators includes: specificconsumer price indices which cover various items ofinflation and indicate inflation expectations; producer priceindices indicating cost-related inflationary pressure;exchange rate indices; a complex of indicatorscharacterising monetary development, specifically monetaryaggregates and interest rates; a group of indicatorsexpressing the mutual relationship between supply anddemand (from which it will be possible to derive demandpressures); indicators of labour market and wagedevelopment.
In January 1998, the repo rate was left
unchanged. During the first month of inflation
targeting, the majority of available information was
from December. Despite numerous uncertainties, the
inflation outlook was in compliance with the inflation
target for the end of 1998. However, a high trade
deficit in December and the consequences of the
Asian crisis were viewed as a potential impulse for
weakening the exchange rate. Also, the January price
deregulation together with the expected consequences
of regular January re-pricing increased the probability
that the inflation outlook would be closer to the upper
limit of the targeted interval. It was evident that in the
first months of 1998, net inflation would increase due
to past developments.
In February, the repo rate was again
unchanged. However, this time there were two
alternatives considered (the other being to raise the
repo rate). On the one hand, in this month, the
inflation outlook started signalling that net inflation
would be in the upper part of the targeted interval by
the end of 1998. On the other, an agreement was
reached that the decision on raising the repo rate
should not be based on the unexpectedly high month-
on-month increase in prices. The inflation outlook
was modified upwards due to the previously
underestimated scope of both the January re-pricing
effect and the impact of deregulation on net inflation.
An implication for future monetary policy decisions
was that inflation expectations should be considered
as a very important transmission channel and that
there could be increased probability of their
acceleration.
In March, by a majority vote, the repo rate
was increased by 0.25% to 15%. The newly available
February data on inflation confirmed that the risks of
higher inflation in the future might outweigh the
favourable trends in the economy. Various price
indices signalled that without an adequate policy
27
response, net inflation might exceed the upper limit of
the targeted interval in December 1998. Moreover, the
available CPI forecasts for the end of 1998
(announced by various institutions) suggested that
targeted net inflation should be in the middle of this
interval rather than approaching its upper band in
order to compensate for the higher than expected CPI
inflation. The hypothesis of the potential for
accelerating expectations formulated during a
previous meeting was confirmed by the upward slope
of the interest yield curve. According to the slope,
inflation expectations exceeded the targeted values. It
was said during the discussion that, although the
observed exchange rate development supported a
gradual reduction in inflation, it would not be
desirable to shift the weight of the monetary
transmission mechanism from an interest rate channel
to an exchange rate channel. Consequently, the
modest repo rate increase was mainly designed to
affect the economy via the expectation channel.
In April, the repo rate remained unchanged.
The inflation outlook for net inflation at the end of
1998 had moved back to the targeted interval. There
was new information on the reduction of annualised
trade and current account deficits as well as the
closing of the gap between productivity and wage
increases that was accompanied with the appreciation
of the koruna. Also, imported deflation of input prices
was reflected in domestic inflation development. At
the same time, inflation expectations started
decelerating.
In May, the repo rate had again remained
unchanged. Similarly to the previous month, the
newly available information was favourable. The
inflation outlook was in accordance with the targeted
interval for the end of 1998. However, it was agreed
that to some extent this was the result of external
factors. Firstly, the part of slower inflation was
imported via input prices (mainly raw materials) that
were purely exogenous. Secondly, the situation on
both domestic and international financial markets
caused the koruna to appreciate. On the one hand, this
was partially an endogenous process linked to
improving the domestic economic fundamentals. On
the other hand, this was a consequence of exogenous
factors since crises on some emerging markets made
the koruna relatively more attractive to foreign
investors. Since the above-listed external factors were
viewed as temporary, this exogenous slowed-down in
inflation was called “borrowed disinflation”.
In July, the repo rate was cut from 15% to
14.5%. According to the inflation outlook, net
inflation was likely to be close to the lower band of
the targeted interval by the end of 1998. The newly
set repo rate was consistent with the medium-term
target for 2000. It was stressed that the latest koruna
appreciation was not a reason for cutting rates and
that the exchange rate would not be directly affected
by this monetary policy decision. The economic
situation was characterised by a lower risk premium
and a fall in inflation expectations. These were likely
to slowly decelerate because of “borrowed
disinflation”. Also, one of the main factors – the
impact of price deregulation – would have a different
impact in July from the one in January since the
composition of prices that were subject to changes
was different and the impact on net inflation would be
smaller due to an income effect.
After describing the decision-making
process, the main features can then be summarised.
First, all decisions were discussed strictly in the
framework of inflation targeting. There was no
conflict of targets revealed during the discussions.
The repo rate’s level was clearly linked to the
inflation target and the inflation outlook. When the
inflation outlook signalled a deviation of net inflation
from the targeted interval at the end of 1998, the repo
rate was changed. It is interesting to note that
decisions were symmetrical since the repo rate was
increased when the outlook signalled overshooting of
28
the targeted interval and cut when the outlook
signalled undershooting.
Secondly, three periods of the introduction of
inflation targeting can be identified. Until March,
although the economic fundamentals such as the trade
deficit or consumption improved, inflation
expectations were not in line with the disinflationary
path due to the backward-looking approach as well as
to the re-pricing effect, the secondary impact of
deregulation and increased exchange rate uncertainty.
Up until July, the situation stabilised as expectations
were formed more by economic fundamentals. Since
July, expectations have been on a disinflationary path
to some extent due to the impact of external factors.
Thirdly, it is important to note that the time horizon of
the decision-making process did not change, because
the weight of the targeted interval for the medium-
term had increased gradually. At the same time, the
uncertainty linked with external factors forming
inflation increased. The problem of “borrowed
disinflation” that helped in forming inflation
expectations gained importance since external factors
could be reversed in the medium-term and destabilise
expectations once again.
3 Is a Transitional Country a “Good” Inflation
Targeter?
The Czech Republic was the first economy in
transition to adopt a regime of inflation targeting as
the explicit framework for its monetary policy. Two
important questions therefore arise. First, in the Czech
case, do underlying conditions which still have
specific features of transition allow for the effective
implementation of inflation targeting? Second, what
are the possible reactions to some transitional
challenges within the framework of inflation
targeting?
3.1 The Necessary Conditions for Effective
Implementation
The first important issue is the emphasis that society
puts on price and currency stability. If the priority of
stability is high, the central bank’s strategy as a whole
is supported. The Czech experience suggests that the
koruna has enjoyed remarkable stability in the course
of past developments. After World War I, the
currency of the newly formed Czechoslovak Republic
was the only one in the region which had avoided
hyperinflation. The relatively modest monetary
overhang was a favourable feature of the
macroeconomic situation also in the post World War
II era. And again, since the start of transition, unlike
most other countries in the region which sooner or
later adjusted their framework to the requirements of
external balance and external competitiveness6, the
priority attached to domestic price stability has
remained a distinguishing feature of the Czech
transitional strategy7.
The conclusion follows that price and
currency stability are highly respected and supported
by society, and therefore have been “built into” Czech
economic development and policies. This seems to be
the underlying factor which is of utmost importance
for the feasibility and sustainability of the inflation
targeting regime in the Czech case. In situations
where acceleration of economic activity and the
disinflation process are discussed in terms of a short-
run trade-off issue, the arguments of price stability
can find public support.
6 For example, Hungary and Poland used crawling-pegregimes. Under this scheme, the objective of monetarypolicy is not unambiguous since the process of disinflationcan conflict with the external balance.7 Two types of nominal anchors were drawn upon in thecourse of the transition years in order to affect domesticstability. In the initial stages, this was the exchange ratenominal anchor. Despite persistent real appreciation, thekoruna peg to the basket was maintained with unchangedcentral parity and the horizontal band over the whole periodof January 1991 to May 1997. In the aftermath of exchangerate turbulence, the priority of domestic stability continuedvia the adoption of inflation targeting.
29
The second important factor is the
institutional and economic pre-conditions of the
inflation targeting regime. The first institutional
requirement to be satisfied was evidently the
capability of the central bank to conduct its monetary
policy with a fairly high degree of independence. This
pre-condition for the adoption of inflation targeting
was, without a doubt, in place. According to the
Constitution and central bank law, the Czech National
Bank (CNB) is independent of the government and
has sole responsibility for the conduct of monetary
policy. And even more importantly, in the course of
the entire transition, this independence was put into
practice and demonstrated in the domain of both
instruments and goals.
The second prerequisite, related to the real
independence of the central bank, was fiscal
discipline. With extensive public borrowing from the
banking system (involving substantial increases in
public debt, with shallow financial markets not being
able to absorb the placement of debt instruments and
high dependence on revenues from seigniorage),
monetary policy would not be in a position to secure
the meeting of disinflation targets. In this type of
situation inflationary pressures of a fiscal origin
would develop, the effectiveness of policies for
attaining nominal targets would be undermined, and
the central bank would be forced to follow an
increasingly accommodative monetary policy. In the
case of the Czech economy, the principle of a
balanced budget policy was followed throughout the
past period, and the public sector borrowing
requirement remained moderate. Nevertheless, the
revealed “hidden debt” of transformation institutions
inflated the previous officially declared debt level.
There are other institutional factors that relate to the
issue of inflation targeting. Specifically, a certain
level in the development of financial markets is
required. With a floating exchange rate, there is a
need for a well-developed foreign exchange market
that is complex enough to cushion the short-term
volatility of capital flows. Also, instruments reducing
exchange rate uncertainty should be available to
economic agents. Moreover, if inflation targeting is
introduced before major changes on financial markets
take place, extensive structural breaks would make it
difficult to create inflation forecasts or outlooks. Last
but not least, it is very important that at the initial
stage of introducing the strategy, external factors such
as import prices do not damage the credibility of the
new framework via significant shock. In the Czech
case, the external factors sent favourable impulses and
helped set inflation expectations on the disinflationary
path.
3.2 Inflation Targeting as a Disinflation Strategy
The Czech approach to inflation targeting has
been influenced by the necessity to distinguish
between the long-term objective in the form of price
stability and the medium-term target of disinflation.
Obviously, no threshold inflation rate could be
defined as a prerequisite for a viable shift to inflation
targeting. Nevertheless, the experience from other
countries suggested that this regime had not been
introduced in times of high or moderate inflation.
Moreover, most countries switched to inflation
targeting only after inflation was under control and on
a decreasing path. As a rule, the CPI index had one-
digit values and in the majority of cases, the central
bank was faced with the problem of reducing inflation
fluctuations rather than the problem of disinflation.
In the Czech case, the inflation level fluctuated
around ten per cent8 with some inertia for several
consecutive years. This level, though moderate, was
higher than in other countries when shifting to
8 There were three detectable inflation episodes. In 1993,the inflation impulse was created by the VAT reform. In1995, the impact of capital inflow on demand started toaffect inflation. In 1997, the exchange rate turbulence andthe consequent depreciation of the koruna were significantfactors in the development of inflation.
30
inflation targeting. Moreover, an acceleration of the
inflation rate was envisaged for the first months of
1998, and market expectations for the future rate of
inflation seemed quite unstable with little confidence
from the public that the disinflation process would be
reinstituted in the foreseeable future.
Under these circumstances, despite an
unfavourable outlook or rather, because of that
outlook, the CNB Board did not want to wait to take a
clear stand on price stability as the main objective of
monetary policy. The public commitment to the
explicit disinflation target and the related resolute
policy stance were aimed at reversing expectations
and at reassuring the markets and the public. Given
the situation of increased political uncertainty,
highlighted by the resignation of the government, the
independent central bank commitment to sound,
transparent long-term goals seemed to be of utmost
importance, irrespective of the potential swings in
political power.
The design of inflation targets has reflected
the above-analysed problems. In December, the
public announcement of switching to inflation
targeting reassured the public that monetary policy is
devoted to providing price stability. By specifying the
two targets for the short-term and medium-term
horizon, the CNB also declared that monetary policy
will aim at disinflation in a horizon that is relevant for
negotiated contracts. This made the objective of price
stability more “actual” since previous strategies did
not declare any time horizon for reaching the
European level of inflation. Hence, the channel of
inflation expectations through which monetary policy
affects economic decisions has become more
efficient. Moreover, the new strategy probably
changed as well the mode in which expectations are
formed, from an adaptive mode to one that was more
forward-looking. This has been a very important
achievement. Should wages be negotiated under a
strictly backward-looking mode of expectations, the
costs of disinflation would be much higher and the
risk of reappearance of the external imbalance would
increase.
3.3 Transitional Challenges
The Czech experience in the first eight
months of inflation targeting revealed two important
challenges for policy makers. It has been necessary to
deal with transitional shocks to prices and the
consequences of having an emerging financial market.
Let us describe the problem of price shocks first since
it enters both the decision-making process as well as
the process of target specification. Countries that are
inflation targeters usually deal with the problem of
price shocks by modifying the CPI index or by
declaring “caveats”. Central banks do not commit
themselves to influencing CPI inflation as a whole.
Both methods are used to distinguish inflation from
primary exogenous shocks to prices in order to avoid
a counter-productive reaction of monetary policy.
During transition, this problem is more
complex since this reform carries with it a sequence
of exogenous price shocks such as tax reform or the
so-called deregulation scheme in which relative prices
in previously regulated sectors are gradually
corrected. As a result, there is a trade-off for policy
makers. On the one hand, if the CPI index is modified
in order to minimise the risk of a counter-productive
reaction of monetary policy or the risk of missing the
target, it is necessary to add to standard caveats the
expected transitional shocks during transition. In this
case, the new index used for specification of the target
could become irrelevant to economic decisions since
the share of excluded categories is high and CPI
inflation might diverge from the targeted inflation9.
9 As was shown in Graph 4, two types of divergence arepossible. During a period of small-scale deregulation, inwhich inflation in the segment of regulated prices was lowerthan inflation in the remaining price segments, net inflationexceeded CPI inflation. Large-scale deregulation caused theCPI to exceed net inflation. Since the scheme ofderegulation was usually announced on an annual basis and
31
Consequently, the transmission channel through
expectations is significantly weakened.
On the other hand, if only standard caveats
are used, the targeted inflation is more likely to
converge to CPI inflation and contracts would be
linked to the target. However, during transition the
excluded shocks would be quite significant as shown
in Graph 4. Consequently, there would be three
possible reactions of monetary policy: (i) to
compromise on the slope of the disinflationary path
and derive its slope from a deregulation scheme with
all the disadvantages (e.g. large fluctuations around
the disinflation trend caused by changes in
government strategy), (ii) to compromise on the
credibility of the target itself and allow for missing it
in the case of large-scale deregulation, (iii) to rely on
the substitution effect between regulated and non-
regulated price segments and to accept the costs of
non-accommodated supply price shocks.
In the Czech case, the first alternative has
been evaluated as less costly. However, the CNB did
not use many caveats explicitly when defining net
inflation, because net inflation filters out some
standard shocks such as the impact of indirect taxes.
The majority of excluded items are those in the
segment of regulated prices. Hence, one can classify
net inflation as a “transitional” concept, and it is
likely that in the medium-term, after major
deregulation steps are completed, the two inflation
rates would converge. Not only is the existence of a
deregulation scheme and implied uncertainty a
limiting factor when defining the target, it has
consequences for the decision-making process as
well. As the summary of the minutes of the meeting
shows, it has been very difficult to predict the
spillover effect from the segment of regulated prices
was conditioned with political stability, there has beenuncertainty for both the scope and the direction of thedivergence. Moreover, the index of net inflation itself issubject to uncertainty since the government cantheoretically redefine the segment of regulated pricessignificantly.
to net inflation due to the unavailability of historical
data as well as structural breaks.
The second important challenge for policy
makers has been the problem of the existence of
emerging financial markets. It is important to note
that in the Czech case, the pegged exchange rate
played the role of a nominal anchor for the entire
period of 1990–1997. In May 1997, the peg was
discontinued, and a more flexible regime in the form
of managed floating was introduced. This shift was
consistent with the requirements of the inflation
targeting regime since it is feasible to target domestic
inflation only in the context of a flexible exchange
rate, otherwise conflicts of commitments to different
targeted variables are likely to arise and the
effectiveness of inflation targeting is undermined.
The shift to a floating exchange rate
notwithstanding, the policy approach to the role of the
exchange rate in the new setting remained an issue.
Given the small size and the significant openness of
the Czech economy, the exchange rate has had a
remarkably large and direct impact on the CPI. At the
same time, capital flows, much larger and more
volatile than trade flows, have increasingly dominated
short-term exchange rate developments. Moreover, in
a transition economy with still relatively thin markets,
wide interest rate differentials and a volatile risk
premium, the exchange rate response to various
shocks, new economic and political data and to
changing perceptions of investors is much more
volatile and occasionally even erratic in nature. In the
given circumstances, some issues related to the
exchange rate within the framework of inflation
targeting required clarification – for example, policy
stance.
On the one hand, the level of the exchange
rate can neither be an explicit nor implicit objective of
monetary policy. This is because the control of the
exchange rate level is neither feasible in the existing
conditions nor consistent with the inflation targeting
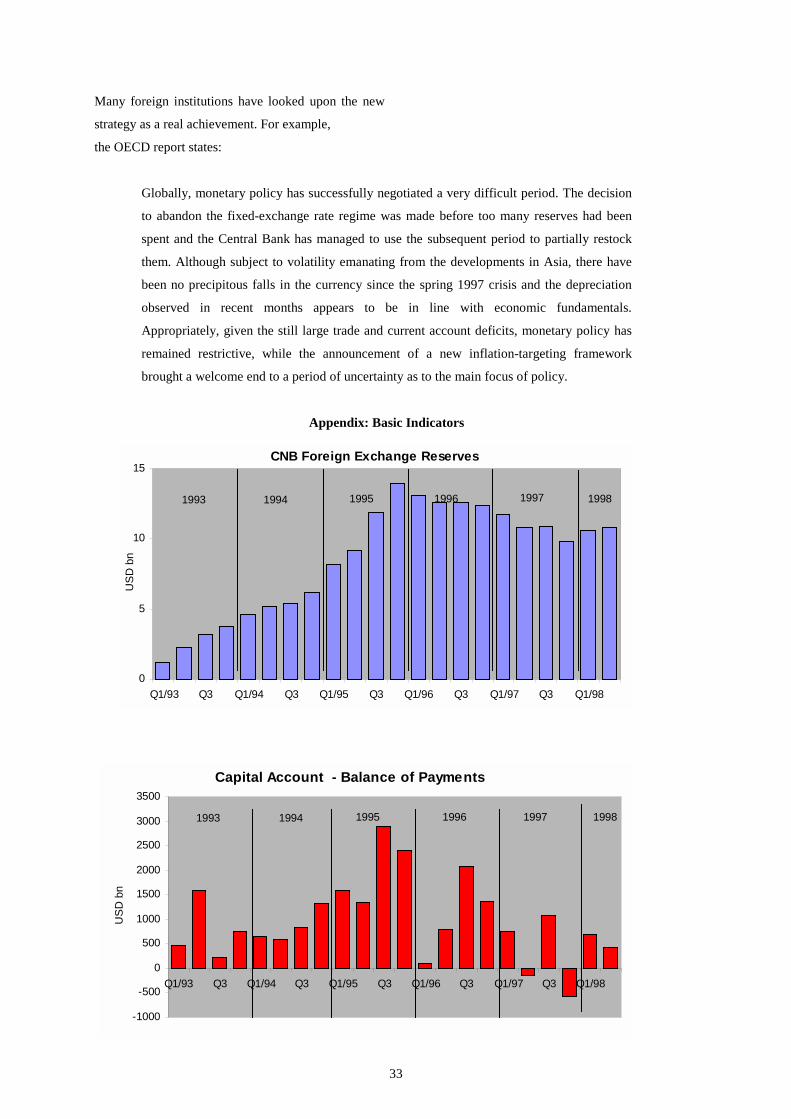
32
framework. Accordingly, problems of external
imbalances must be coped with within a broader
framework of macroeconomic policies and their
combination. The foreign exchange interventions aim
at smoothing the moves from one exchange rate level
to another and at reducing the volatility and erratic
responses in the exposed but still relatively thin
koruna foreign exchange market. On the other hand,
for a small, open economy, movements in the
exchange rate are a significant factor that enters the
decision-making process of the central bank.
Subsequently, foreign investors tend to guess the
reaction function of the central bank and use the
implicit bands to reduce foreign exchange risk when
speculating on the foreign exchange market.
3.4 Transparency Gain
An important advantage of the shift to
inflation targeting was related to the increased
transparency of monetary policy. Transparency, in
fact, has improved in both specifying the target and
decision-making. As far as target specification is
concerned, the adoption of an inflation targeting
regime introduced a clear-cut focus for monetary
policy. It has been a move from ambiguous
specification of the disinflationary path to explicit
specification of the slope of the path as well as the
time horizons.
Moreover, in comparison to the previous
situation with two parallel intermediary targets and
non-binding inflation forecasts, the potential conflict
of criteria that could emerge as a result of various
imbalances has been removed. For example, when
using two parallel intermediate targets in periods of
capital inflow, it was not easy to determine which
target should gain more importance in the decision-
making process. Excessive monetary growth and an
excessive current account deficit put monetary policy
into a position in which only one parallel target could
be achieved. With the inflation target, the importance
of various indicators has been unambiguously
(although implicitly) determined by their weight in
the transmission scheme from interest rate to inflation
outlook.
The second important improvement has been
an increase in the transparency of the decision-making
process itself. The policy steps of the central bank
have become smoother and more predictable since
with a clearly defined scheme of targets and
instruments, the policy rule was now unambiguous.
Also, the decision-making process was made
transparent due to publicising the minutes of the
meetings. By the same token, this process is more
exposed to the reactions of professional economists
and the general public.
This gained transparency and accountability
of monetary policy proved to be beneficial. It has had
a positive impact on staff efforts and performance
within the bank. It has contributed as well to a better
understanding of the problem and to increased and
more diversified public involvement. Also, it
provided a clear framework for discussions about
monetary policy since the target has been defined
clearly and the commitment to ensuring disinflation
has been explicit. There has been no conflict with
other targets such as the external balance. One of the
most important benefits has been the successful
formation of expectations that have reduced the costs
of the disinflation process. Also, an increase in the
credibility of monetary policy has reduced the costs of
external financing due to lowered risk premium.
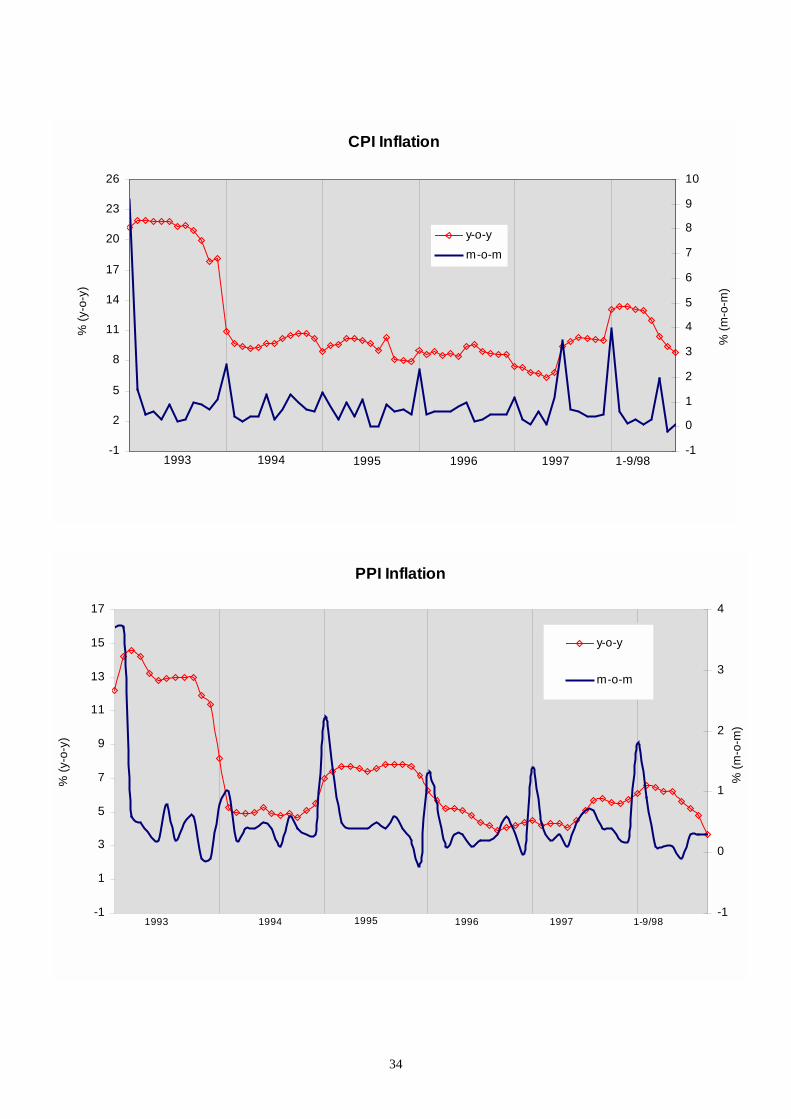
33
Many foreign institutions have looked upon the new
strategy as a real achievement. For example,
the OECD report states:
Globally, monetary policy has successfully negotiated a very difficult period. The decision
to abandon the fixed-exchange rate regime was made before too many reserves had been
spent and the Central Bank has managed to use the subsequent period to partially restock
them. Although subject to volatility emanating from the developments in Asia, there have
been no precipitous falls in the currency since the spring 1997 crisis and the depreciation
observed in recent months appears to be in line with economic fundamentals.
Appropriately, given the still large trade and current account deficits, monetary policy has
remained restrictive, while the announcement of a new inflation-targeting framework
brought a welcome end to a period of uncertainty as to the main focus of policy.
Appendix: Basic Indicators
Capital Account - Balance of Payments
-1000
-500
0
500
1000
1500
2000
2500
3000
3500
Q1/93 Q3 Q1/94 Q3 Q1/95 Q3 Q1/96 Q3 Q1/97 Q3 Q1/98
USD
bn
1993 1994 1995 1996 1997 1998
CNB Foreign Exchange Reserves
0
5
10
15
Q1/93 Q3 Q1/94 Q3 Q1/95 Q3 Q1/96 Q3 Q1/97 Q3 Q1/98
USD
bn
1993 1994 1995 1996 1997 1998
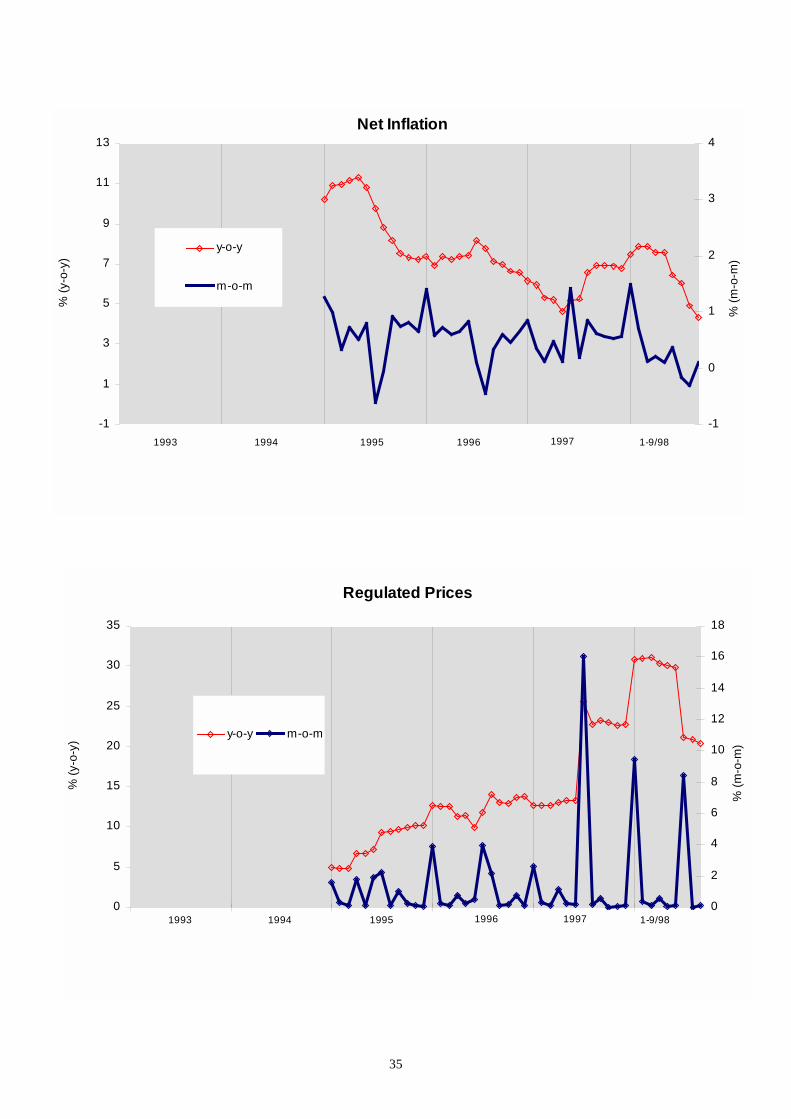
34
CPI Inflation
-1
2
5
8
11
14
17
20
23
26
% (y
-o-y
)
-1
0
1
2
3
4
5
6
7
8
9
10
% (m
-o-m
)
y-o-ym-o-m
1993 1994 1995 1996 1997 1-9/98
PPI Inflation
-1
1
3
5
7
9
11
13
15
17
% (y
-o-y
)
-1
0
1
2
3
4
% (m
-o-m
)
y-o-y
m-o-m
1993 1994 1995 1996 1997 1-9/98
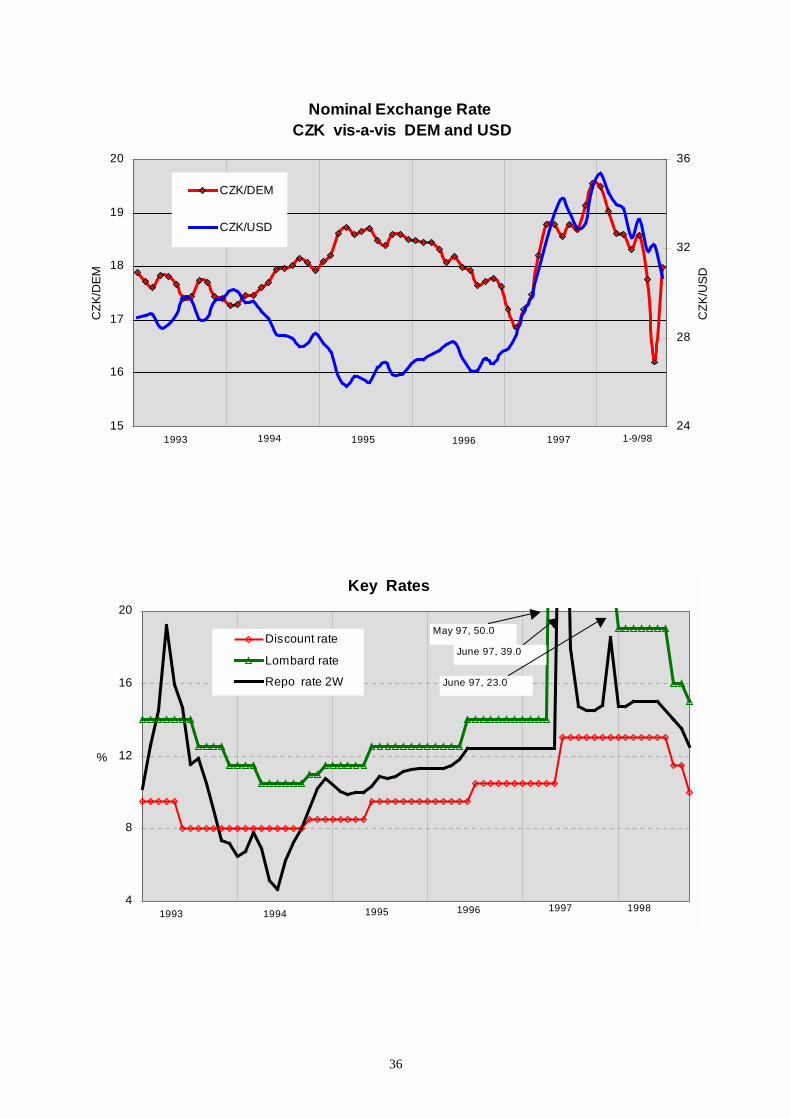
35
Net Inflation
-1
1
3
5
7
9
11
13
% (y
-o-y
)
-1
0
1
2
3
4
% (m
-o-m
)
y-o-y
m-o-m
1993 1994 1995 1996 1997 1-9/98
Regulated Prices
0
5
10
15
20
25
30
35
% (y
-o-y
)
0
2
4
6
8
10
12
14
16
18
% (m
-o-m
)y-o-y m-o-m
1993 1994 1995 1996 1997 1-9/98
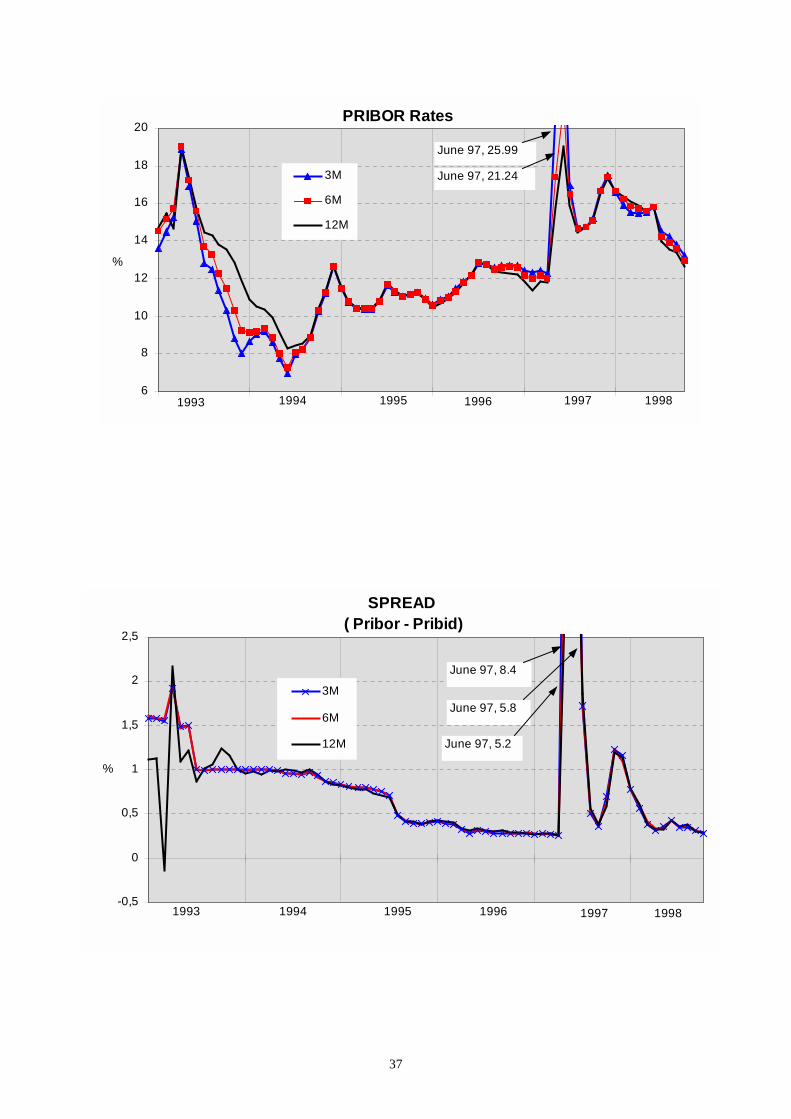
36
Nominal Exchange RateCZK vis-a-vis DEM and USD
15
16
17
18
19
20
CZK
/DEM
24
28
32
36
CZK
/USD
CZK/DEM
CZK/USD
1993 1994 1995 1996 1997 1-9/98
Key Rates
4
8
12
16
20
%
Discount rate
Lombard rate
Repo rate 2W
1993 1994 1995 1996 1997 1998
May 97, 50.0
June 97, 39.0
June 97, 23.0
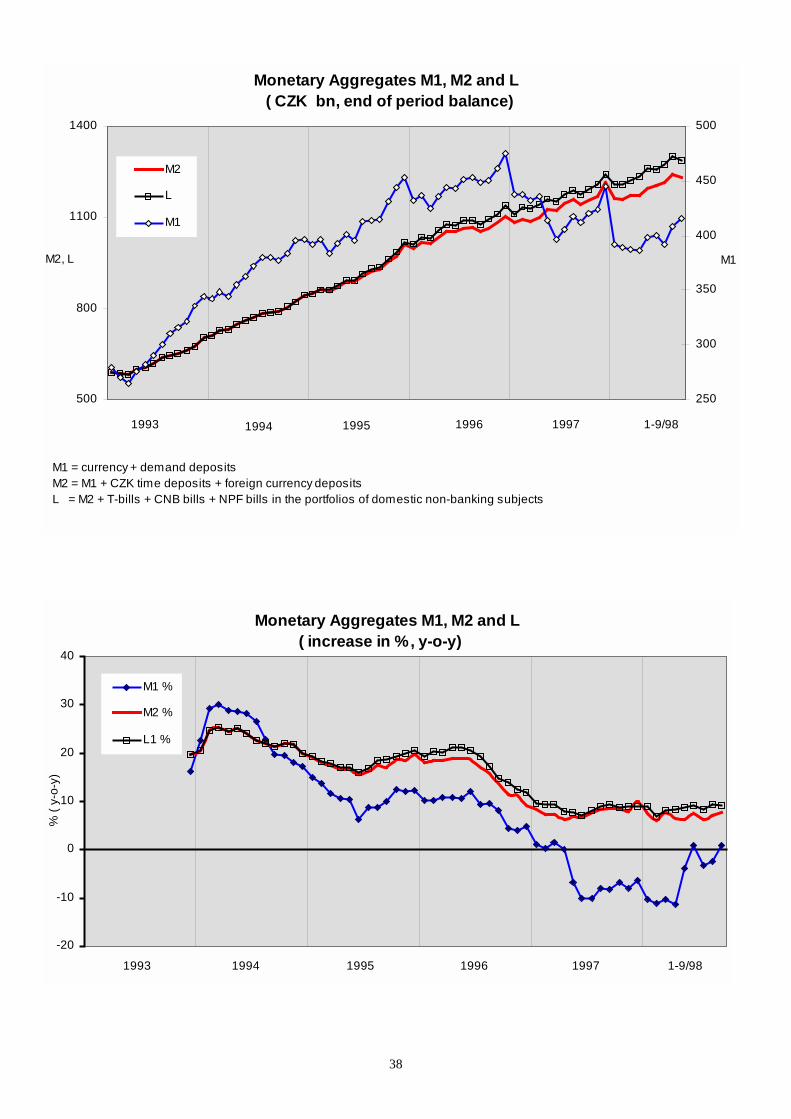
37
PRIBOR Rates
6
8
10
12
14
16
18
20
%
3M
6M
12M
1993 1994 1995 1996 1997 1998
June 97, 25.99
June 97, 21.24
SPREAD ( Pribor - Pribid)
-0,5
0
0,5
1
1,5
2
2,5
%
3M
6M
12M
1993 1994 1995 1996 1997 1998
June 97, 8.4
June 97, 5.8
June 97, 5.2

38
Monetary Aggregates M1, M2 and L ( CZK bn, end of period balance)
500
800
1100
1400
M2, L
250
300
350
400
450
500
M1
M2
L
M1
1993 1994 1995 1996 1997 1-9/98
M1 = currency + demand depositsM2 = M1 + CZK time deposits + foreign currency depositsL = M2 + T-bills + CNB bills + NPF bills in the portfolios of domestic non-banking subjects
Monetary Aggregates M1, M2 and L ( increase in %, y-o-y)
-20
-10
0
10
20
30
40
% (
y-o-
y)
M1 %
M2 %
L1 %
1993 1994 1995 1996 1997 1-9/98
39
Forecasting in a Central Bank1
Lavan Mahadeva
1 Introduction
2 Why is it difficult to Forecast?
3 What else do we want from a forecast?
4 The central bank’s forecast also depends on
the structure of the economy and the
intermediate target
5 What would be the best modelling strategy to
follow?
6 Conclusions
1 This article is preliminary and should not be quoted without permission. The views in this paper are solely those of theauthor.
40
1 Introduction
In the past decade, an increasing number of central
banks have been granted control of their countries’
monetary policy2. But even if these central banks are
more committed to price stability than their
predecessors as monetary policy makers, we still
observe that monetary policy is subject to much
imprecision. A central bank’s policy instruments have
to filter from the money markets through to other
financial and goods markets of the economy before
they exercise their full effect on the ultimate and most
important goal: inflation. Policy effects are uncertain
and can even take years to be realized. During this
horizon, many other relevant changes are likely to
affect prices and the central bank must classify as well
as quantify future developments. For example, the
first-round effects of an improvement in productivity
may not merit a response whereas as an expected
increase in nominal earnings growth (above the rate of
labour productivity growth) may need to be offset by a
tighter monetary policy. Because they are constrained
to operate over an uncertain horizon, central banks,
like all monetary policy makers, have to explicitly or
implicitly make a forecast (Budd 1998(I), Blinder
(1998)). In this article, I discuss central bank
forecasting and try to distinguish it from forecasting
for other purposes. With more definition, I also
discuss how forecasting varies between central banks
depending on how the forecast contributes to the
policy process3.
2 The central banker as god, The Economist, November 14th
1998, pages 25–29.3 Much of the material for this article refers to theexperience of the Bank of England with forecasting andinflation forecast targeting. More details of the role of theforecast in the Bank of England monetary policy process canbe found in Britton, Fisher and Whitley (1998), Budd(1998(II)) , Budd (1998(I) and other articles in theNovember 1998 Economic Journal’s Policy Forum on TheNew Monetary Policy Framework in the UK, Haldane(1997), Vickers (1998) and Whitley (1997).
2 Why is it Difficult to Forecast? Because of
Structural Breaks
Any discussion of macroeconomic forecasting should
be conscious that it is much maligned for its
usefulness in the face of sizeable inaccuracies. In
order to understand what this means for forecasting,
we need to first understand what causes
macroeconomic forecast errors.
Clements and Hendry (1995) decompose the
error at any point in the future forecast into:
Structural Breaks: Errors due to changes in the true
Data Generating Process (let’s say in the true
parameters and intercepts) which occur outside the
sample (that was available when the forecast was
made).
Model Mis-specification: Errors that were made
because the model was not specified correctly within
the sample.
Estimation Uncertainty: Errors due to uncertain
econometric estimates of the parameters and
intercepts within the sample.
Initial Condition Mis-measurement: Errors due to mis-
measured data on the variables within a sample (for
example revised data).
Error Accumulation: Errors due to past errors not
averaging to zero.
Intuitively, if not formally (see Wallis and
Whitley (1991)), structural breaks and mis-
specification seem to be the main sources of error
among these categories. One reason why forecast
errors from structural breaks are large is that many
structural breaks lead to non-zero or even non-
stationary errors in the forecast. For example, a break
in the parameter describing the rate of technical
progress of the economy – and many commentators
felt that this could have recently happened to the US
economy – can lead to non-stationary forecast errors
as it multiplies a time trend.
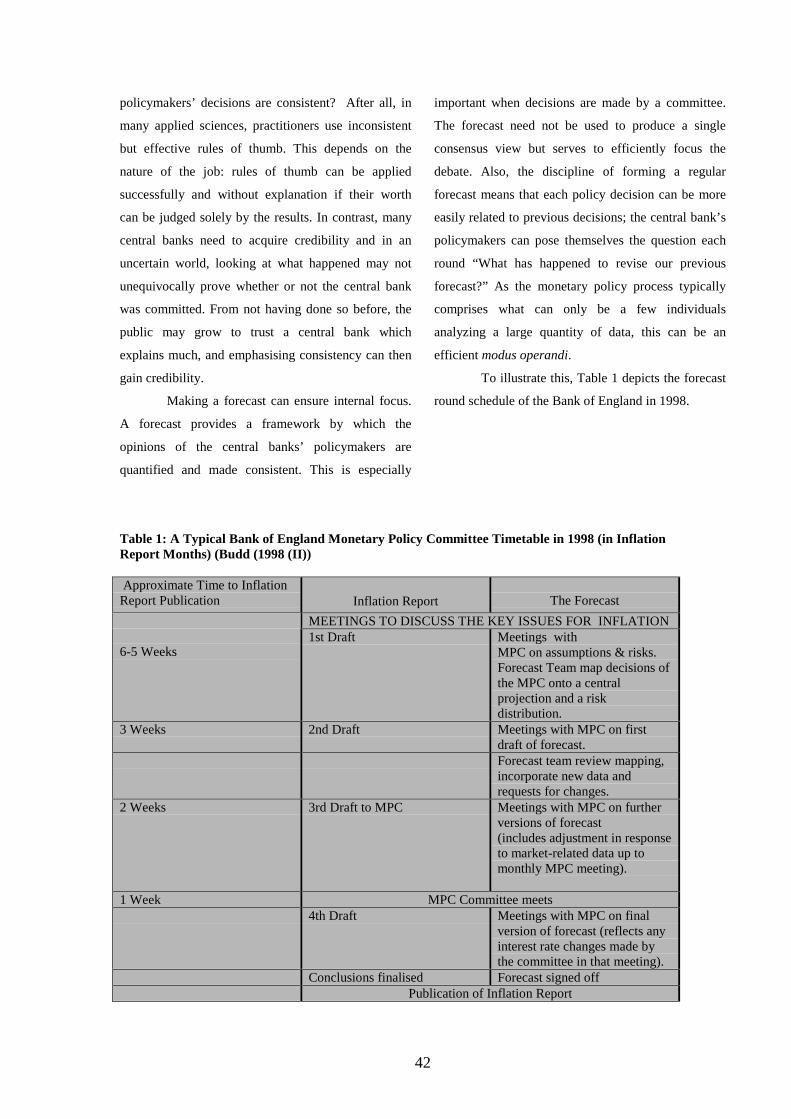
41
I would like to argue that in practice, errors
arising from mis-specification are difficult to separate
from those due to the model being prone to out-of-
sample structural breaks. Despite efforts to develop a
judgement-free methodology to select models, finding
a tractable formalisation of the economy in-sample to
forecast out of sample always involves a great deal of
arbitrary choice (about the lag length, functional form,
variables and so on). Part of this choice will be over
selecting a model that is robust to future structural
breaks. Many structural breaks are typically preceded
by some in-sample evidence (see for example Hendry
and Ericsson’s (1991) discussion of financial
innovation in the UK and the US). For example a
more flexible nominal wage culture will first be
visible in some sectors of the economy before
becoming gregarious. With the sectoral evidence in
hand, a correctly specified model that would be robust
to more flexible economy-wide wage-setting could
have been developed ex-ante. But reaching the
conclusion that would be correct after the event
depends on having chosen one particular
interpretation of the sectoral wage behaviour from
what could be many plausible alternatives. Thus, as in
this example, in practice it is difficult to distinguish
errors due to mis-specifying the model to those arising
from structural breaks and so, I shall refer to both as
structural breaks.
So forecasting is a seemingly insurmountable
enterprise precisely because our economies are
continually subject to changes in the true data
generating process. But given that the central bank has
to make a forecast under these conditions, I will turn
to what is the best strategy to follow. Before that
though, it is necessary to lay out the other possible
constraints for a central bank’s forecast.
3 What else do we want from a forecast? To help
with transparency and acquiring credibility
A central bank may also publish its forecasts
of inflation to guide the expectations of the public. In
many economies, centralized wage negotiations and
widespread indexation mean that the central bank has
to set out its stall as to the future course of inflation.
But more generally, wage and price setters as well as
participants in the financial markets need to believe
that monetary policy will stabilize inflation before
inflation will be stabilized (or at least stabilized
without less employment and output costs than
otherwise). The purpose of an externally explicit
forecast is then not only to accurately predict future
events but also to help make monetary policy more
transparent and acquire credibility.
A forecast can do this in several ways:
– By making its forecast explicit, policy
makers explain their thought processes. They are not
just explaining what the current state of the economy
is, they are giving some guide as to what they think
could happen in the future (possibly whilst being
explicit about the associated uncertainty) and
moreover explaining how policy is set to respond.
Comparing the current forecast with past forecasts
means that the policy makers can explain why policy
has been revised and, crucially, where the past
mistakes in policy came from. The framework of a
forecast helps the public follow the central bank in
identifying what’s happening to the economy and
judging the appropriate policy response so that they
are closer to understanding that that monetary policy
makers are committed to their objectives.
– An explicit forecast disciplines the central bank to
make sure that the understanding of the economy on
which its policy is predicated is consistent. This is
because creating a forecast means that the central bank
has to quantify its interpretations. As a simple
example, intuitions about future consumption,
investment, government spending, stockbuilding and
the balance of payments have to be squared against a
forecast of GNP. Why is it so important that the
42
policymakers’ decisions are consistent? After all, in
many applied sciences, practitioners use inconsistent
but effective rules of thumb. This depends on the
nature of the job: rules of thumb can be applied
successfully and without explanation if their worth
can be judged solely by the results. In contrast, many
central banks need to acquire credibility and in an
uncertain world, looking at what happened may not
unequivocally prove whether or not the central bank
was committed. From not having done so before, the
public may grow to trust a central bank which
explains much, and emphasising consistency can then
gain credibility.
Making a forecast can ensure internal focus.
A forecast provides a framework by which the
opinions of the central banks’ policymakers are
quantified and made consistent. This is especially
important when decisions are made by a committee.
The forecast need not be used to produce a single
consensus view but serves to efficiently focus the
debate. Also, the discipline of forming a regular
forecast means that each policy decision can be more
easily related to previous decisions; the central bank’s
policymakers can pose themselves the question each
round “What has happened to revise our previous
forecast?” As the monetary policy process typically
comprises what can only be a few individuals
analyzing a large quantity of data, this can be an
efficient modus operandi.
To illustrate this, Table 1 depicts the forecast
round schedule of the Bank of England in 1998.
Table 1: A Typical Bank of England Monetary Policy Committee Timetable in 1998 (in InflationReport Months) (Budd (1998 (II))
Approximate Time to InflationReport Publication Inflation Report The Forecast
MEETINGS TO DISCUSS THE KEY ISSUES FOR INFLATION
6-5 Weeks1st Draft Meetings with
MPC on assumptions & risks.Forecast Team map decisions ofthe MPC onto a centralprojection and a riskdistribution.
3 Weeks 2nd Draft Meetings with MPC on firstdraft of forecast.Forecast team review mapping,incorporate new data andrequests for changes.
2 Weeks 3rd Draft to MPC Meetings with MPC on furtherversions of forecast(includes adjustment in responseto market-related data up tomonthly MPC meeting).
1 Week MPC Committee meets4th Draft Meetings with MPC on final
version of forecast (reflects anyinterest rate changes made bythe committee in that meeting).
Conclusions finalised Forecast signed offPublication of Inflation Report
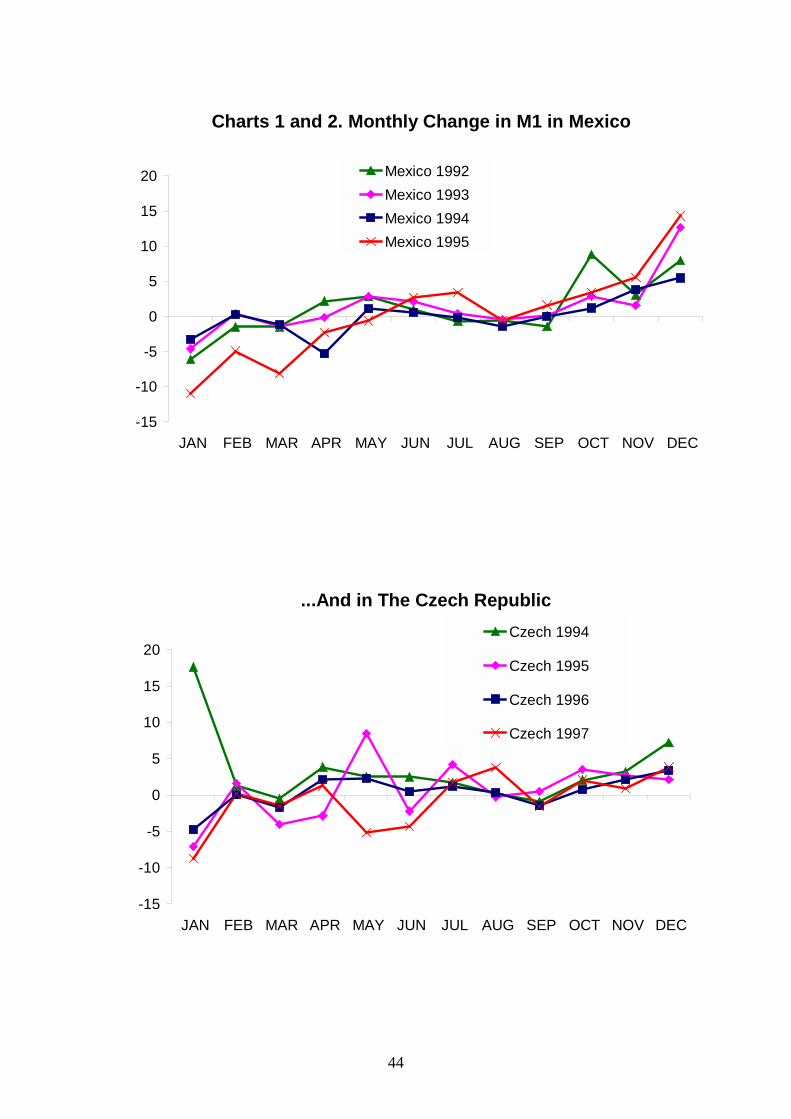
43
The table demonstrates how the forecast
in the Bank of England interacts with the
Monetary Policy Committee decision and the
Inflation Report. What it also illustrates is that
putting together the forecast in a central bank
need not just be a one-off mechanistic process, it
can involve iterative rounds of communication,
discussion and consistency checks.
4 The central bank’s forecast also depends on
the structure of the economy and the
intermediate target
How the forecast is carried out will also
depend on the nature of the transmission
mechanism. For example, an important reason
why the Bank of England forecasts inflation up
to two years ahead is “there is believed to be a
lag of about two years between a change in
interest rates and its major effect on inflation.4” If
there are less wage and price contracts that are
fixed in nominal terms, then the horizon over
which the central bank can operate may be much
shorter. Ceteris paribus, forecasting to guide and
explain monetary policy becomes in this sense an
easier exercise. But also important are the
uncertainties associated with monetary policies
that may be greater in economies with less-
developed financial markets.
4 Budd (1998 (II))
A central bank’s forecast also depends
on its monetary policy regime. Fixing the
exchange rate means that credibility is associated
with its effort to keep the exchange rate within a
band. The public and financial markets are to
understand that adhering to the exchange rate
regime will bring about price stability, and as
long as the central bank is successful in that,
there is less onus on the central bank having to be
explicit about its forecast for inflation.
Similarly targeting money aggregates
that are closely related to the central bank
instruments could suggest that forecasting the
target variable is a much simpler exercise. But
that depends on the scale of the shocks that affect
the target. Charts 2 and 3 plot the percentage
monthly increase in M1 in Mexico and the Czech
Republic for a sample of years during the 1990s.
The charts show that there are some potential
intermediate targets (in particular narrow money
aggregates) which can be relatively difficult to
forecast5.
5 See also Goodhart (1994) ”the public’s demand forcash…is both strongly seasonal and somewhatunpredictable.”
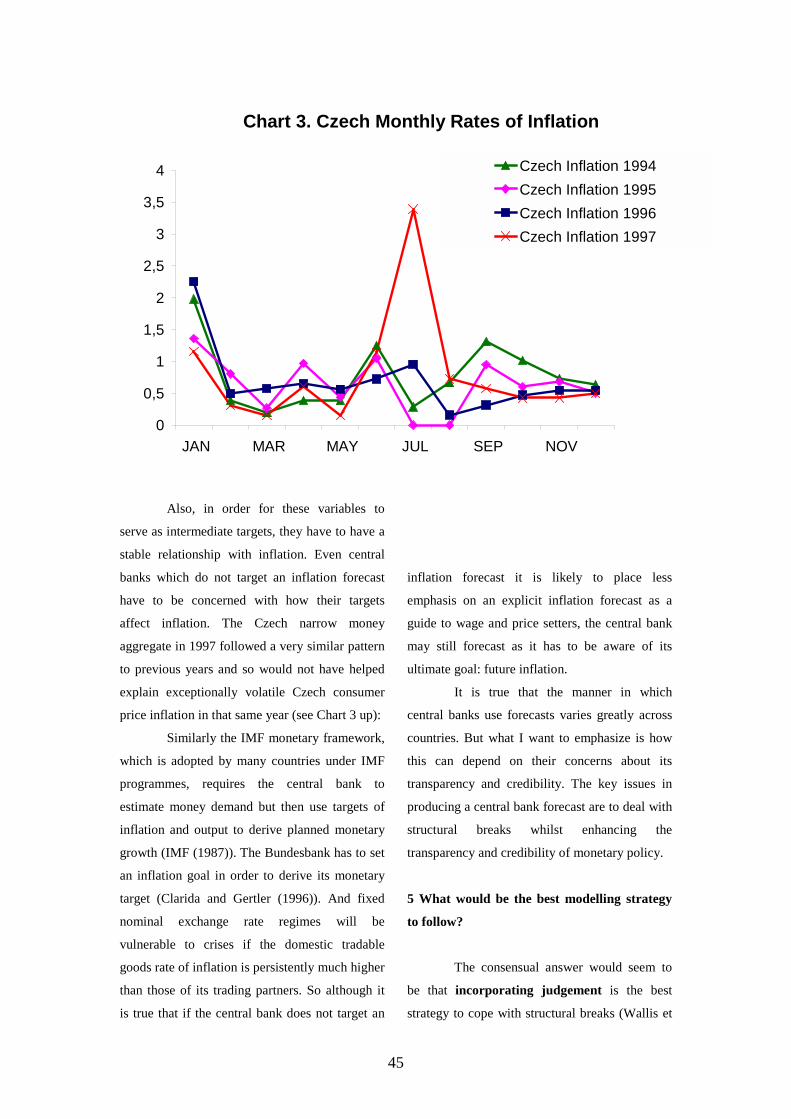
44
Charts 1 and 2. Monthly Change in M1 in Mexico
-15
-10
-5
0
5
10
15
20
JAN FEB MAR APR MAY JUN JUL AUG SEP OCT NOV DEC
Mexico 1992Mexico 1993Mexico 1994 Mexico 1995
...And in The Czech Republic
-15
-10
-5
0
5
10
15
20
JAN FEB MAR APR MAY JUN JUL AUG SEP OCT NOV DEC
Czech 1994
Czech 1995
Czech 1996
Czech 1997
45
Also, in order for these variables to
serve as intermediate targets, they have to have a
stable relationship with inflation. Even central
banks which do not target an inflation forecast
have to be concerned with how their targets
affect inflation. The Czech narrow money
aggregate in 1997 followed a very similar pattern
to previous years and so would not have helped
explain exceptionally volatile Czech consumer
price inflation in that same year (see Chart 3 up):
Similarly the IMF monetary framework,
which is adopted by many countries under IMF
programmes, requires the central bank to
estimate money demand but then use targets of
inflation and output to derive planned monetary
growth (IMF (1987)). The Bundesbank has to set
an inflation goal in order to derive its monetary
target (Clarida and Gertler (1996)). And fixed
nominal exchange rate regimes will be
vulnerable to crises if the domestic tradable
goods rate of inflation is persistently much higher
than those of its trading partners. So although it
is true that if the central bank does not target an
inflation forecast it is likely to place less
emphasis on an explicit inflation forecast as a
guide to wage and price setters, the central bank
may still forecast as it has to be aware of its
ultimate goal: future inflation.
It is true that the manner in which
central banks use forecasts varies greatly across
countries. But what I want to emphasize is how
this can depend on their concerns about its
transparency and credibility. The key issues in
producing a central bank forecast are to deal with
structural breaks whilst enhancing the
transparency and credibility of monetary policy.
5 What would be the best modelling strategy
to follow?
The consensual answer would seem to
be that incorporating judgement is the best
strategy to cope with structural breaks (Wallis et
Chart 3. Czech Monthly Rates of Inflation
0
0,5
1
1,5
2
2,5
3
3,5
4
JAN MAR MAY JUL SEP NOV
Czech Inflation 1994Czech Inflation 1995Czech Inflation 1996Czech Inflation 1997
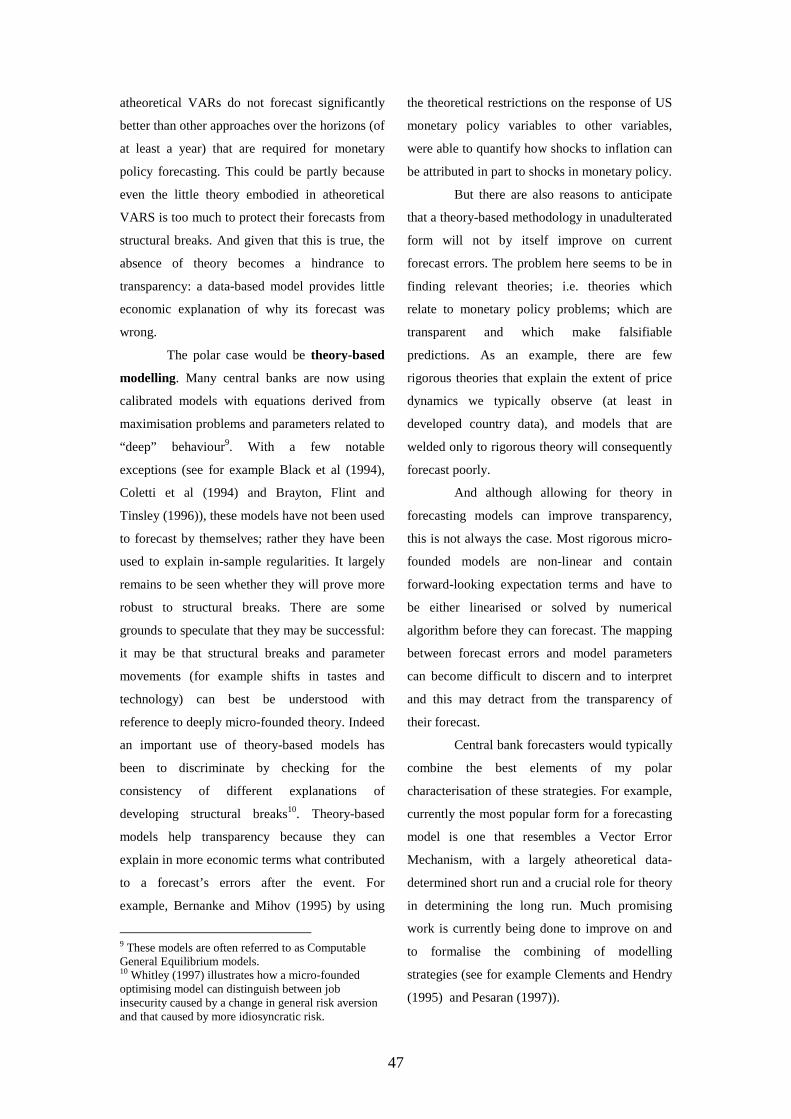
46
al (1986), (1987), Hendry and Clements (1994)).
To formalise this, we can define using judgement
as adjusting the forecast to incorporate off-model
information. There are many potential sources of
information that cannot be costlessly
endogenised into the model but can nevertheless
still be validly taken account of in the forecast
(for example survey-based information and the
results of other models). There are many ways of
technically carrying out these adjustments. But in
principle, this should depend on what off-model
information is available and what is the source of
the model’s potential forecast error that it is
meant to offset. For example Clements and
Hendry (1994) show that using the information
from past forecast errors (leading the forecast
back to track) can be effective against the
structural breaks that produce autoregressive
forecast error.
The opposite strategy to incorporating
judgement would be to explicitly endogenise
more behaviour into a model in an effort to
predict the structural break: make the model
larger. For example, further disaggregation can,
under certain conditions, help predict structural
breaks. In order to understand this with an
example, let’s assume that the increasing role of
services in the UK economy is mis-measured by
aggregate GDP and that the service industry is
more inflationary than the rest of the economy.
Then, disaggregating services from the rest of the
economy in a model will improve its forecasting
performance by predicting how the fundamental
shift in UK output patterns affects inflation.
But our experience of the large
macroeconometric models of the 1970s6 is that
their forecast errors were similarly dominated by
structural breaks. The lack of success of larger
models could in part be attributed to a lack of
parsimony; a more extensive parameterization
can incorporate redundant information. In our
service sector example, this disaggregation
would only have been usefully incorporated if
both the assumptions about mis-measurement
and differing behaviour were valid in the
future7,8.
And whilst a large model’s forecasting
performance may not be significantly better, its
forecasting errors can be more difficult to
explain. In this sense, large models can be less
transparent for policy making. We can conclude
that judgement could be a valid strategy if we
believe that there is much useful information that
can only be endogenised at the cost of
overwhelming complexity; this would follow if
we recognize that any one model, especially if it
is to be transparent, can at best be a stylised
description of the economy.
Another dichotomy that we can make in
modelling strategy would be between atheoretical
and theory-based forecasting. The idea behind
the atheoretical-based forecasting is to use a
model which is as compatible with as many
theories as possible and so immune to the risk
that any one theory will be wrong. Data-based
macroeconomic forecasting typically employs
atheoretical VARs that impose only the
minimum of linearity, a lag length and a choice
of relevant variables. But the evidence is that
6 In the UK in the mid 1970s, macroeconometricforecasting models were documented as involvingfrom 500 – 1000 equations (Whitley (1997)).7 Julius (1998) sets out what the service sector couldactually mean for UK monetary policy.8 Analysing sectoral behaviour can still be useful formonetary policy even if a changing sectoralcomposition contains no direct implications ofinflation. This is because it may indicate the presenceof a structural change (for example a rise in the long-run rate of productivity growth) which also affectsinflation. Under these circumstances, thedisaggregated analysis can contribute some useful off-model information to affect the forecast.
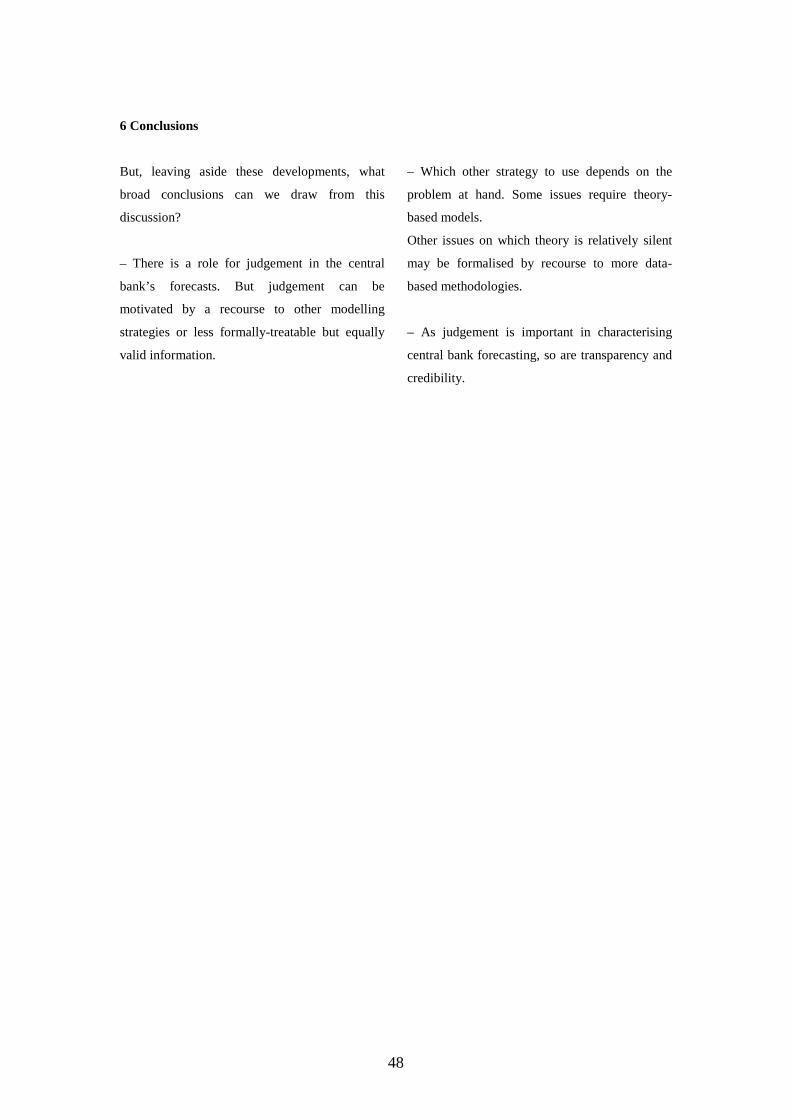
47
atheoretical VARs do not forecast significantly
better than other approaches over the horizons (of
at least a year) that are required for monetary
policy forecasting. This could be partly because
even the little theory embodied in atheoretical
VARS is too much to protect their forecasts from
structural breaks. And given that this is true, the
absence of theory becomes a hindrance to
transparency: a data-based model provides little
economic explanation of why its forecast was
wrong.
The polar case would be theory-based
modelling. Many central banks are now using
calibrated models with equations derived from
maximisation problems and parameters related to
“deep” behaviour9. With a few notable
exceptions (see for example Black et al (1994),
Coletti et al (1994) and Brayton, Flint and
Tinsley (1996)), these models have not been used
to forecast by themselves; rather they have been
used to explain in-sample regularities. It largely
remains to be seen whether they will prove more
robust to structural breaks. There are some
grounds to speculate that they may be successful:
it may be that structural breaks and parameter
movements (for example shifts in tastes and
technology) can best be understood with
reference to deeply micro-founded theory. Indeed
an important use of theory-based models has
been to discriminate by checking for the
consistency of different explanations of
developing structural breaks10. Theory-based
models help transparency because they can
explain in more economic terms what contributed
to a forecast’s errors after the event. For
example, Bernanke and Mihov (1995) by using
9 These models are often referred to as ComputableGeneral Equilibrium models.10 Whitley (1997) illustrates how a micro-foundedoptimising model can distinguish between jobinsecurity caused by a change in general risk aversionand that caused by more idiosyncratic risk.
the theoretical restrictions on the response of US
monetary policy variables to other variables,
were able to quantify how shocks to inflation can
be attributed in part to shocks in monetary policy.
But there are also reasons to anticipate
that a theory-based methodology in unadulterated
form will not by itself improve on current
forecast errors. The problem here seems to be in
finding relevant theories; i.e. theories which
relate to monetary policy problems; which are
transparent and which make falsifiable
predictions. As an example, there are few
rigorous theories that explain the extent of price
dynamics we typically observe (at least in
developed country data), and models that are
welded only to rigorous theory will consequently
forecast poorly.
And although allowing for theory in
forecasting models can improve transparency,
this is not always the case. Most rigorous micro-
founded models are non-linear and contain
forward-looking expectation terms and have to
be either linearised or solved by numerical
algorithm before they can forecast. The mapping
between forecast errors and model parameters
can become difficult to discern and to interpret
and this may detract from the transparency of
their forecast.
Central bank forecasters would typically
combine the best elements of my polar
characterisation of these strategies. For example,
currently the most popular form for a forecasting
model is one that resembles a Vector Error
Mechanism, with a largely atheoretical data-
determined short run and a crucial role for theory
in determining the long run. Much promising
work is currently being done to improve on and
to formalise the combining of modelling
strategies (see for example Clements and Hendry
(1995) and Pesaran (1997)).
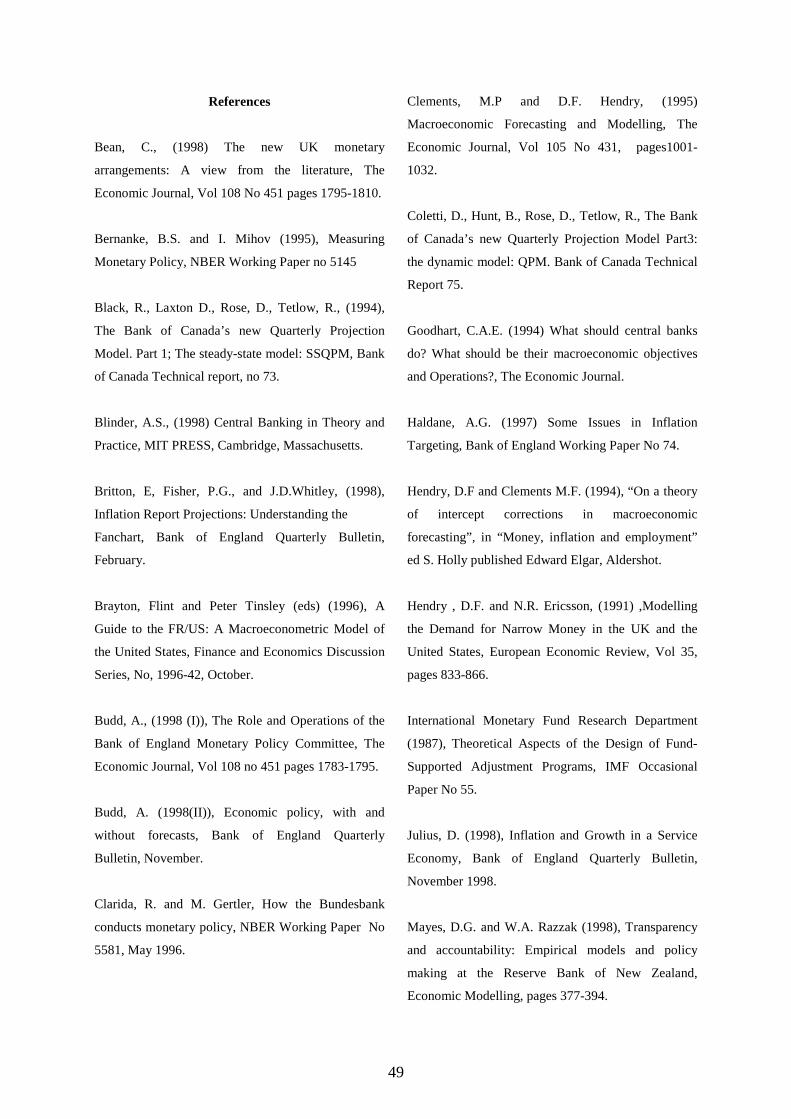
48
6 Conclusions
But, leaving aside these developments, what
broad conclusions can we draw from this
discussion?
– There is a role for judgement in the central
bank’s forecasts. But judgement can be
motivated by a recourse to other modelling
strategies or less formally-treatable but equally
valid information.
– Which other strategy to use depends on the
problem at hand. Some issues require theory-
based models.
Other issues on which theory is relatively silent
may be formalised by recourse to more data-
based methodologies.
– As judgement is important in characterising
central bank forecasting, so are transparency and
credibility.
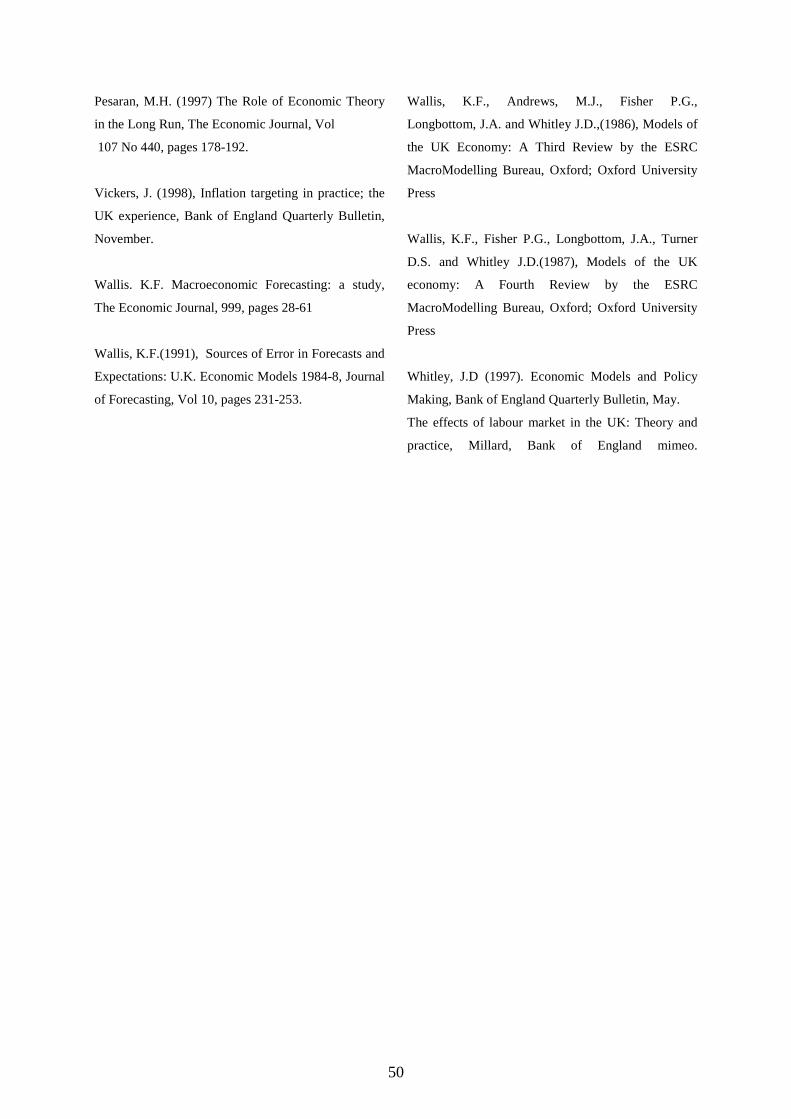
49
References
Bean, C., (1998) The new UK monetary
arrangements: A view from the literature, The
Economic Journal, Vol 108 No 451 pages 1795-1810.
Bernanke, B.S. and I. Mihov (1995), Measuring
Monetary Policy, NBER Working Paper no 5145
Black, R., Laxton D., Rose, D., Tetlow, R., (1994),
The Bank of Canada’s new Quarterly Projection
Model. Part 1; The steady-state model: SSQPM, Bank
of Canada Technical report, no 73.
Blinder, A.S., (1998) Central Banking in Theory and
Practice, MIT PRESS, Cambridge, Massachusetts.
Britton, E, Fisher, P.G., and J.D.Whitley, (1998),
Inflation Report Projections: Understanding the
Fanchart, Bank of England Quarterly Bulletin,
February.
Brayton, Flint and Peter Tinsley (eds) (1996), A
Guide to the FR/US: A Macroeconometric Model of
the United States, Finance and Economics Discussion
Series, No, 1996-42, October.
Budd, A., (1998 (I)), The Role and Operations of the
Bank of England Monetary Policy Committee, The
Economic Journal, Vol 108 no 451 pages 1783-1795.
Budd, A. (1998(II)), Economic policy, with and
without forecasts, Bank of England Quarterly
Bulletin, November.
Clarida, R. and M. Gertler, How the Bundesbank
conducts monetary policy, NBER Working Paper No
5581, May 1996.
Clements, M.P and D.F. Hendry, (1995)
Macroeconomic Forecasting and Modelling, The
Economic Journal, Vol 105 No 431, pages1001-
1032.
Coletti, D., Hunt, B., Rose, D., Tetlow, R., The Bank
of Canada’s new Quarterly Projection Model Part3:
the dynamic model: QPM. Bank of Canada Technical
Report 75.
Goodhart, C.A.E. (1994) What should central banks
do? What should be their macroeconomic objectives
and Operations?, The Economic Journal.
Haldane, A.G. (1997) Some Issues in Inflation
Targeting, Bank of England Working Paper No 74.
Hendry, D.F and Clements M.F. (1994), “On a theory
of intercept corrections in macroeconomic
forecasting”, in “Money, inflation and employment”
ed S. Holly published Edward Elgar, Aldershot.
Hendry , D.F. and N.R. Ericsson, (1991) ,Modelling
the Demand for Narrow Money in the UK and the
United States, European Economic Review, Vol 35,
pages 833-866.
International Monetary Fund Research Department
(1987), Theoretical Aspects of the Design of Fund-
Supported Adjustment Programs, IMF Occasional
Paper No 55.
Julius, D. (1998), Inflation and Growth in a Service
Economy, Bank of England Quarterly Bulletin,
November 1998.
Mayes, D.G. and W.A. Razzak (1998), Transparency
and accountability: Empirical models and policy
making at the Reserve Bank of New Zealand,
Economic Modelling, pages 377-394.

50
Pesaran, M.H. (1997) The Role of Economic Theory
in the Long Run, The Economic Journal, Vol
107 No 440, pages 178-192.
Vickers, J. (1998), Inflation targeting in practice; the
UK experience, Bank of England Quarterly Bulletin,
November.
Wallis. K.F. Macroeconomic Forecasting: a study,
The Economic Journal, 999, pages 28-61
Wallis, K.F.(1991), Sources of Error in Forecasts and
Expectations: U.K. Economic Models 1984-8, Journal
of Forecasting, Vol 10, pages 231-253.
Wallis, K.F., Andrews, M.J., Fisher P.G.,
Longbottom, J.A. and Whitley J.D.,(1986), Models of
the UK Economy: A Third Review by the ESRC
MacroModelling Bureau, Oxford; Oxford University
Press
Wallis, K.F., Fisher P.G., Longbottom, J.A., Turner
D.S. and Whitley J.D.(1987), Models of the UK
economy: A Fourth Review by the ESRC
MacroModelling Bureau, Oxford; Oxford University
Press
Whitley, J.D (1997). Economic Models and Policy
Making, Bank of England Quarterly Bulletin, May.
The effects of labour market in the UK: Theory and
practice, Millard, Bank of England mimeo.
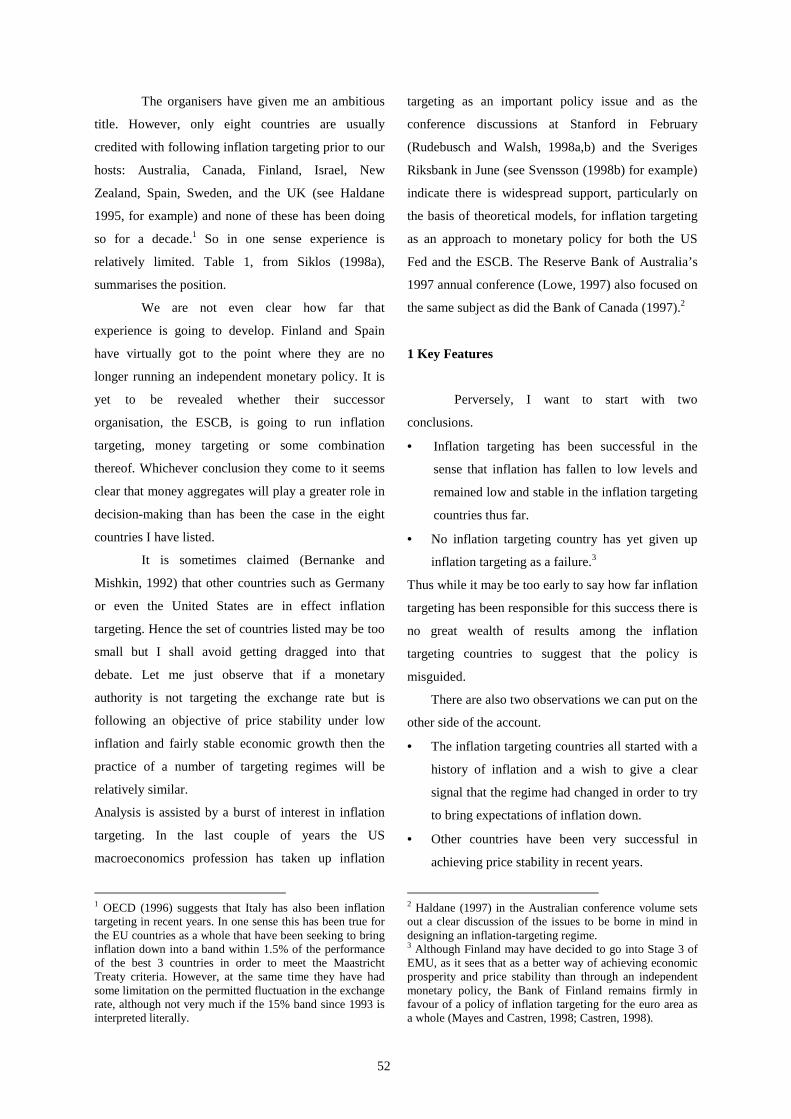
51
The Western Experience with a Strategy of Inflation Targeting
David A. Mayes
1 Key Features
2 Measuring Credibility
3 Institutional Arrangements
4 Inflation Bands
5 Communication
6 Forecasting
7 Concluding Remarks
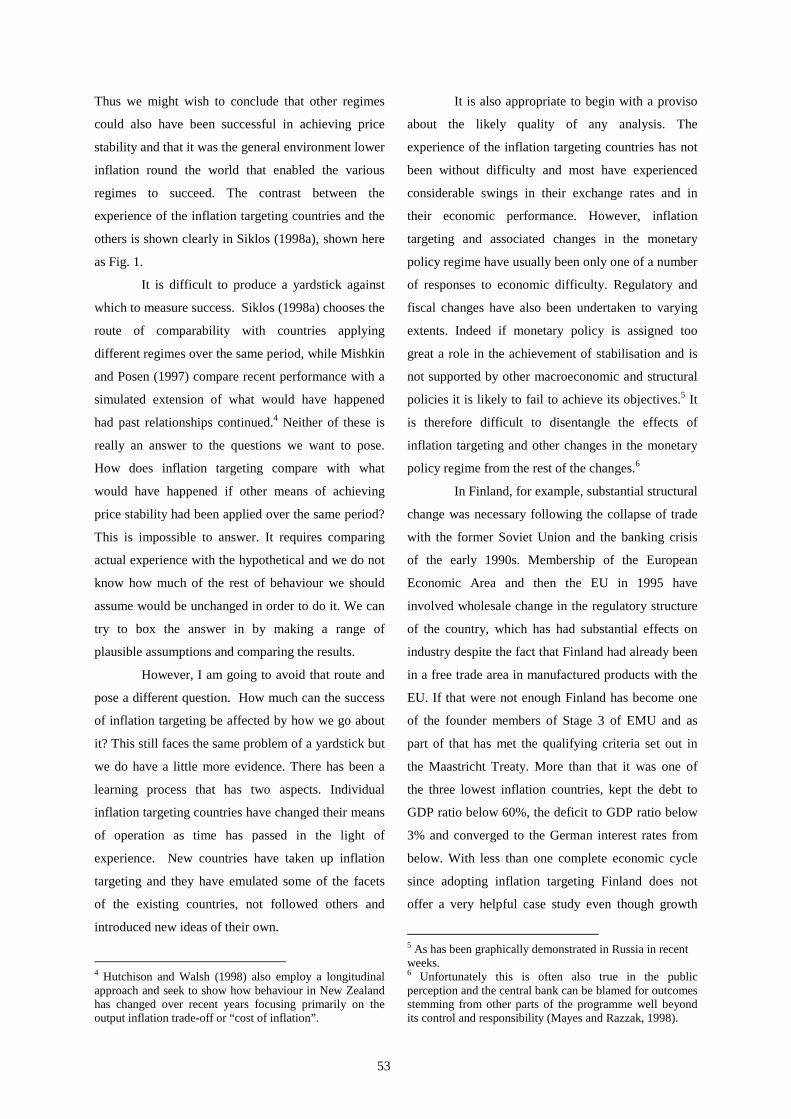
52
The organisers have given me an ambitious
title. However, only eight countries are usually
credited with following inflation targeting prior to our
hosts: Australia, Canada, Finland, Israel, New
Zealand, Spain, Sweden, and the UK (see Haldane
1995, for example) and none of these has been doing
so for a decade.1 So in one sense experience is
relatively limited. Table 1, from Siklos (1998a),
summarises the position.
We are not even clear how far that
experience is going to develop. Finland and Spain
have virtually got to the point where they are no
longer running an independent monetary policy. It is
yet to be revealed whether their successor
organisation, the ESCB, is going to run inflation
targeting, money targeting or some combination
thereof. Whichever conclusion they come to it seems
clear that money aggregates will play a greater role in
decision-making than has been the case in the eight
countries I have listed.
It is sometimes claimed (Bernanke and
Mishkin, 1992) that other countries such as Germany
or even the United States are in effect inflation
targeting. Hence the set of countries listed may be too
small but I shall avoid getting dragged into that
debate. Let me just observe that if a monetary
authority is not targeting the exchange rate but is
following an objective of price stability under low
inflation and fairly stable economic growth then the
practice of a number of targeting regimes will be
relatively similar.
Analysis is assisted by a burst of interest in inflation
targeting. In the last couple of years the US
macroeconomics profession has taken up inflation
1 OECD (1996) suggests that Italy has also been inflationtargeting in recent years. In one sense this has been true forthe EU countries as a whole that have been seeking to bringinflation down into a band within 1.5% of the performanceof the best 3 countries in order to meet the MaastrichtTreaty criteria. However, at the same time they have hadsome limitation on the permitted fluctuation in the exchangerate, although not very much if the 15% band since 1993 isinterpreted literally.
targeting as an important policy issue and as the
conference discussions at Stanford in February
(Rudebusch and Walsh, 1998a,b) and the Sveriges
Riksbank in June (see Svensson (1998b) for example)
indicate there is widespread support, particularly on
the basis of theoretical models, for inflation targeting
as an approach to monetary policy for both the US
Fed and the ESCB. The Reserve Bank of Australia’s
1997 annual conference (Lowe, 1997) also focused on
the same subject as did the Bank of Canada (1997).2
1 Key Features
Perversely, I want to start with two
conclusions.
• Inflation targeting has been successful in the
sense that inflation has fallen to low levels and
remained low and stable in the inflation targeting
countries thus far.
• No inflation targeting country has yet given up
inflation targeting as a failure.3
Thus while it may be too early to say how far inflation
targeting has been responsible for this success there is
no great wealth of results among the inflation
targeting countries to suggest that the policy is
misguided.
There are also two observations we can put on the
other side of the account.
• The inflation targeting countries all started with a
history of inflation and a wish to give a clear
signal that the regime had changed in order to try
to bring expectations of inflation down.
• Other countries have been very successful in
achieving price stability in recent years.
2 Haldane (1997) in the Australian conference volume setsout a clear discussion of the issues to be borne in mind indesigning an inflation-targeting regime.3 Although Finland may have decided to go into Stage 3 ofEMU, as it sees that as a better way of achieving economicprosperity and price stability than through an independentmonetary policy, the Bank of Finland remains firmly infavour of a policy of inflation targeting for the euro area asa whole (Mayes and Castren, 1998; Castren, 1998).
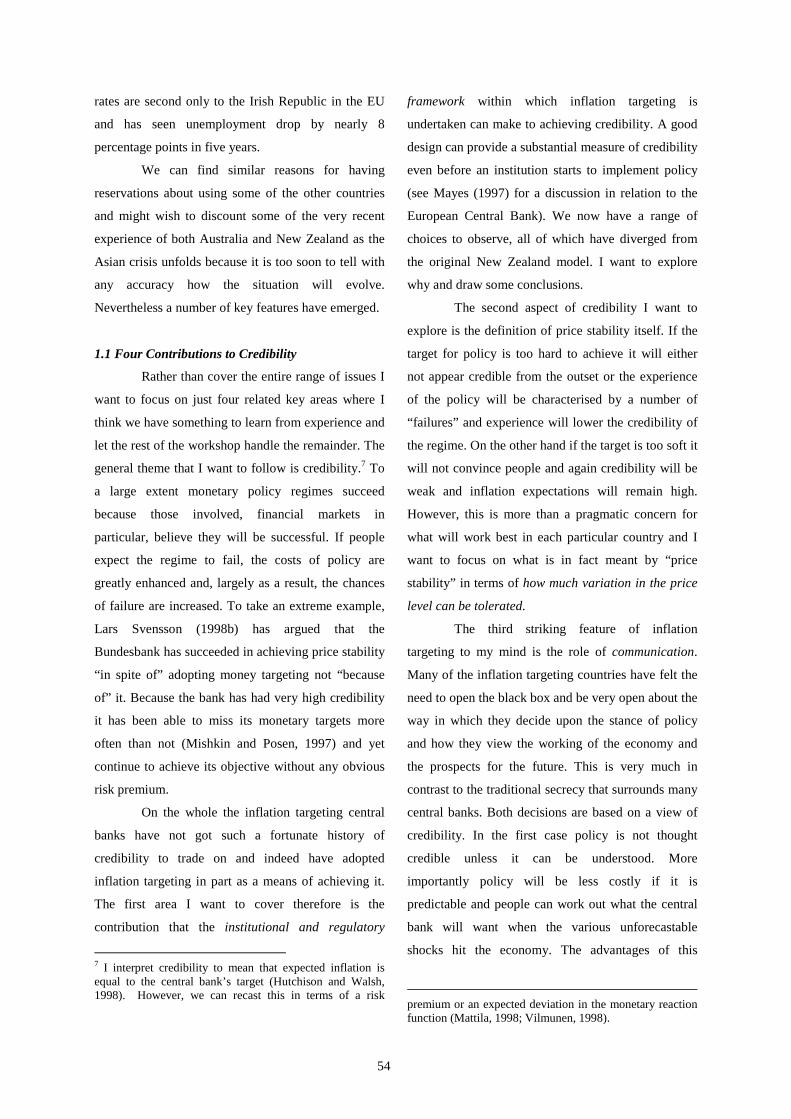
53
Thus we might wish to conclude that other regimes
could also have been successful in achieving price
stability and that it was the general environment lower
inflation round the world that enabled the various
regimes to succeed. The contrast between the
experience of the inflation targeting countries and the
others is shown clearly in Siklos (1998a), shown here
as Fig. 1.
It is difficult to produce a yardstick against
which to measure success. Siklos (1998a) chooses the
route of comparability with countries applying
different regimes over the same period, while Mishkin
and Posen (1997) compare recent performance with a
simulated extension of what would have happened
had past relationships continued.4 Neither of these is
really an answer to the questions we want to pose.
How does inflation targeting compare with what
would have happened if other means of achieving
price stability had been applied over the same period?
This is impossible to answer. It requires comparing
actual experience with the hypothetical and we do not
know how much of the rest of behaviour we should
assume would be unchanged in order to do it. We can
try to box the answer in by making a range of
plausible assumptions and comparing the results.
However, I am going to avoid that route and
pose a different question. How much can the success
of inflation targeting be affected by how we go about
it? This still faces the same problem of a yardstick but
we do have a little more evidence. There has been a
learning process that has two aspects. Individual
inflation targeting countries have changed their means
of operation as time has passed in the light of
experience. New countries have taken up inflation
targeting and they have emulated some of the facets
of the existing countries, not followed others and
introduced new ideas of their own.
4 Hutchison and Walsh (1998) also employ a longitudinalapproach and seek to show how behaviour in New Zealandhas changed over recent years focusing primarily on theoutput inflation trade-off or “cost of inflation”.
It is also appropriate to begin with a proviso
about the likely quality of any analysis. The
experience of the inflation targeting countries has not
been without difficulty and most have experienced
considerable swings in their exchange rates and in
their economic performance. However, inflation
targeting and associated changes in the monetary
policy regime have usually been only one of a number
of responses to economic difficulty. Regulatory and
fiscal changes have also been undertaken to varying
extents. Indeed if monetary policy is assigned too
great a role in the achievement of stabilisation and is
not supported by other macroeconomic and structural
policies it is likely to fail to achieve its objectives.5 It
is therefore difficult to disentangle the effects of
inflation targeting and other changes in the monetary
policy regime from the rest of the changes.6
In Finland, for example, substantial structural
change was necessary following the collapse of trade
with the former Soviet Union and the banking crisis
of the early 1990s. Membership of the European
Economic Area and then the EU in 1995 have
involved wholesale change in the regulatory structure
of the country, which has had substantial effects on
industry despite the fact that Finland had already been
in a free trade area in manufactured products with the
EU. If that were not enough Finland has become one
of the founder members of Stage 3 of EMU and as
part of that has met the qualifying criteria set out in
the Maastricht Treaty. More than that it was one of
the three lowest inflation countries, kept the debt to
GDP ratio below 60%, the deficit to GDP ratio below
3% and converged to the German interest rates from
below. With less than one complete economic cycle
since adopting inflation targeting Finland does not
offer a very helpful case study even though growth
5 As has been graphically demonstrated in Russia in recentweeks.6 Unfortunately this is often also true in the publicperception and the central bank can be blamed for outcomesstemming from other parts of the programme well beyondits control and responsibility (Mayes and Razzak, 1998).
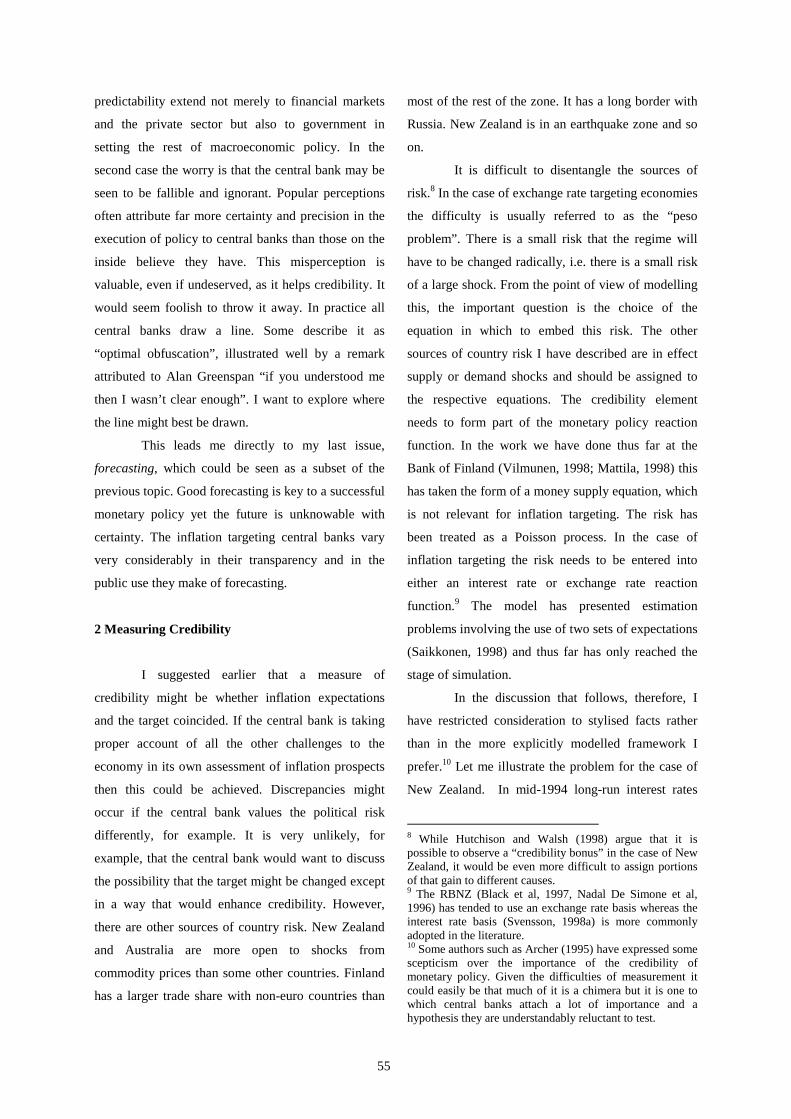
54
rates are second only to the Irish Republic in the EU
and has seen unemployment drop by nearly 8
percentage points in five years.
We can find similar reasons for having
reservations about using some of the other countries
and might wish to discount some of the very recent
experience of both Australia and New Zealand as the
Asian crisis unfolds because it is too soon to tell with
any accuracy how the situation will evolve.
Nevertheless a number of key features have emerged.
1.1 Four Contributions to Credibility
Rather than cover the entire range of issues I
want to focus on just four related key areas where I
think we have something to learn from experience and
let the rest of the workshop handle the remainder. The
general theme that I want to follow is credibility.7 To
a large extent monetary policy regimes succeed
because those involved, financial markets in
particular, believe they will be successful. If people
expect the regime to fail, the costs of policy are
greatly enhanced and, largely as a result, the chances
of failure are increased. To take an extreme example,
Lars Svensson (1998b) has argued that the
Bundesbank has succeeded in achieving price stability
“in spite of” adopting money targeting not “because
of” it. Because the bank has had very high credibility
it has been able to miss its monetary targets more
often than not (Mishkin and Posen, 1997) and yet
continue to achieve its objective without any obvious
risk premium.
On the whole the inflation targeting central
banks have not got such a fortunate history of
credibility to trade on and indeed have adopted
inflation targeting in part as a means of achieving it.
The first area I want to cover therefore is the
contribution that the institutional and regulatory
7 I interpret credibility to mean that expected inflation isequal to the central bank’s target (Hutchison and Walsh,1998). However, we can recast this in terms of a risk
framework within which inflation targeting is
undertaken can make to achieving credibility. A good
design can provide a substantial measure of credibility
even before an institution starts to implement policy
(see Mayes (1997) for a discussion in relation to the
European Central Bank). We now have a range of
choices to observe, all of which have diverged from
the original New Zealand model. I want to explore
why and draw some conclusions.
The second aspect of credibility I want to
explore is the definition of price stability itself. If the
target for policy is too hard to achieve it will either
not appear credible from the outset or the experience
of the policy will be characterised by a number of
“failures” and experience will lower the credibility of
the regime. On the other hand if the target is too soft it
will not convince people and again credibility will be
weak and inflation expectations will remain high.
However, this is more than a pragmatic concern for
what will work best in each particular country and I
want to focus on what is in fact meant by “price
stability” in terms of how much variation in the price
level can be tolerated.
The third striking feature of inflation
targeting to my mind is the role of communication.
Many of the inflation targeting countries have felt the
need to open the black box and be very open about the
way in which they decide upon the stance of policy
and how they view the working of the economy and
the prospects for the future. This is very much in
contrast to the traditional secrecy that surrounds many
central banks. Both decisions are based on a view of
credibility. In the first case policy is not thought
credible unless it can be understood. More
importantly policy will be less costly if it is
predictable and people can work out what the central
bank will want when the various unforecastable
shocks hit the economy. The advantages of this
premium or an expected deviation in the monetary reactionfunction (Mattila, 1998; Vilmunen, 1998).
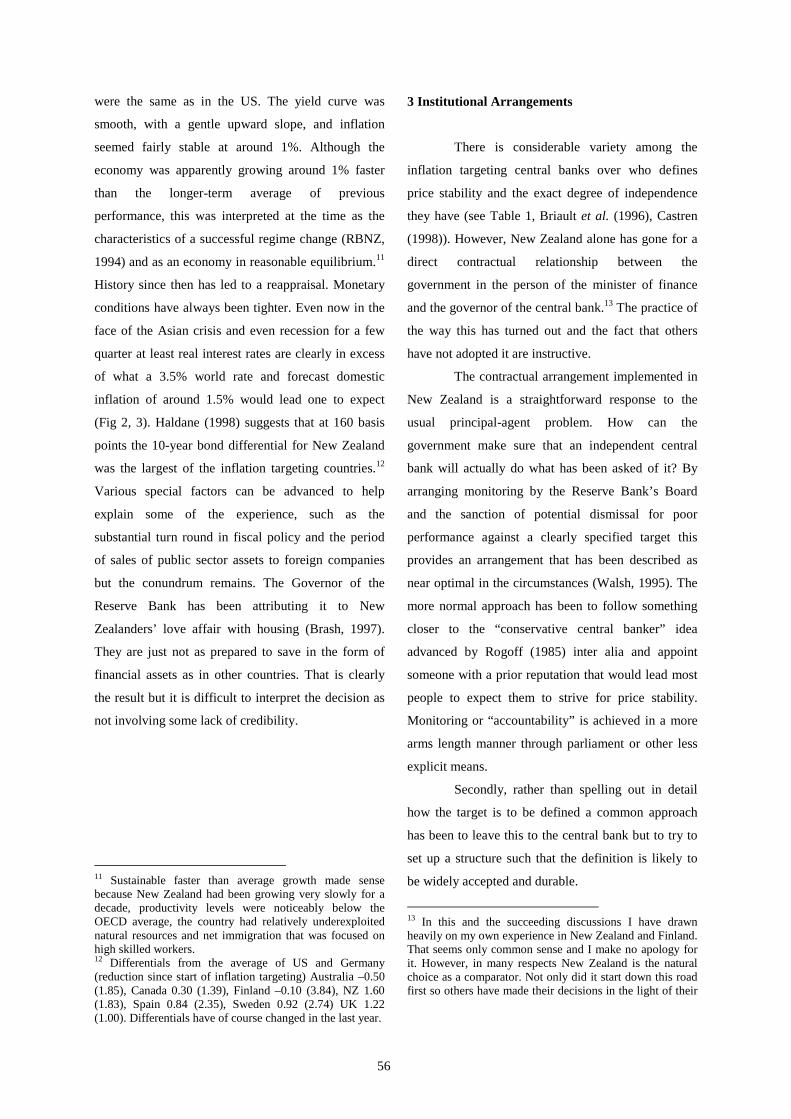
55
predictability extend not merely to financial markets
and the private sector but also to government in
setting the rest of macroeconomic policy. In the
second case the worry is that the central bank may be
seen to be fallible and ignorant. Popular perceptions
often attribute far more certainty and precision in the
execution of policy to central banks than those on the
inside believe they have. This misperception is
valuable, even if undeserved, as it helps credibility. It
would seem foolish to throw it away. In practice all
central banks draw a line. Some describe it as
“optimal obfuscation”, illustrated well by a remark
attributed to Alan Greenspan “if you understood me
then I wasn’t clear enough”. I want to explore where
the line might best be drawn.
This leads me directly to my last issue,
forecasting, which could be seen as a subset of the
previous topic. Good forecasting is key to a successful
monetary policy yet the future is unknowable with
certainty. The inflation targeting central banks vary
very considerably in their transparency and in the
public use they make of forecasting.
2 Measuring Credibility
I suggested earlier that a measure of
credibility might be whether inflation expectations
and the target coincided. If the central bank is taking
proper account of all the other challenges to the
economy in its own assessment of inflation prospects
then this could be achieved. Discrepancies might
occur if the central bank values the political risk
differently, for example. It is very unlikely, for
example, that the central bank would want to discuss
the possibility that the target might be changed except
in a way that would enhance credibility. However,
there are other sources of country risk. New Zealand
and Australia are more open to shocks from
commodity prices than some other countries. Finland
has a larger trade share with non-euro countries than
most of the rest of the zone. It has a long border with
Russia. New Zealand is in an earthquake zone and so
on.
It is difficult to disentangle the sources of
risk.8 In the case of exchange rate targeting economies
the difficulty is usually referred to as the “peso
problem”. There is a small risk that the regime will
have to be changed radically, i.e. there is a small risk
of a large shock. From the point of view of modelling
this, the important question is the choice of the
equation in which to embed this risk. The other
sources of country risk I have described are in effect
supply or demand shocks and should be assigned to
the respective equations. The credibility element
needs to form part of the monetary policy reaction
function. In the work we have done thus far at the
Bank of Finland (Vilmunen, 1998; Mattila, 1998) this
has taken the form of a money supply equation, which
is not relevant for inflation targeting. The risk has
been treated as a Poisson process. In the case of
inflation targeting the risk needs to be entered into
either an interest rate or exchange rate reaction
function.9 The model has presented estimation
problems involving the use of two sets of expectations
(Saikkonen, 1998) and thus far has only reached the
stage of simulation.
In the discussion that follows, therefore, I
have restricted consideration to stylised facts rather
than in the more explicitly modelled framework I
prefer.10 Let me illustrate the problem for the case of
New Zealand. In mid-1994 long-run interest rates
8 While Hutchison and Walsh (1998) argue that it ispossible to observe a “credibility bonus” in the case of NewZealand, it would be even more difficult to assign portionsof that gain to different causes.9 The RBNZ (Black et al, 1997, Nadal De Simone et al,1996) has tended to use an exchange rate basis whereas theinterest rate basis (Svensson, 1998a) is more commonlyadopted in the literature.10 Some authors such as Archer (1995) have expressed somescepticism over the importance of the credibility ofmonetary policy. Given the difficulties of measurement itcould easily be that much of it is a chimera but it is one towhich central banks attach a lot of importance and ahypothesis they are understandably reluctant to test.
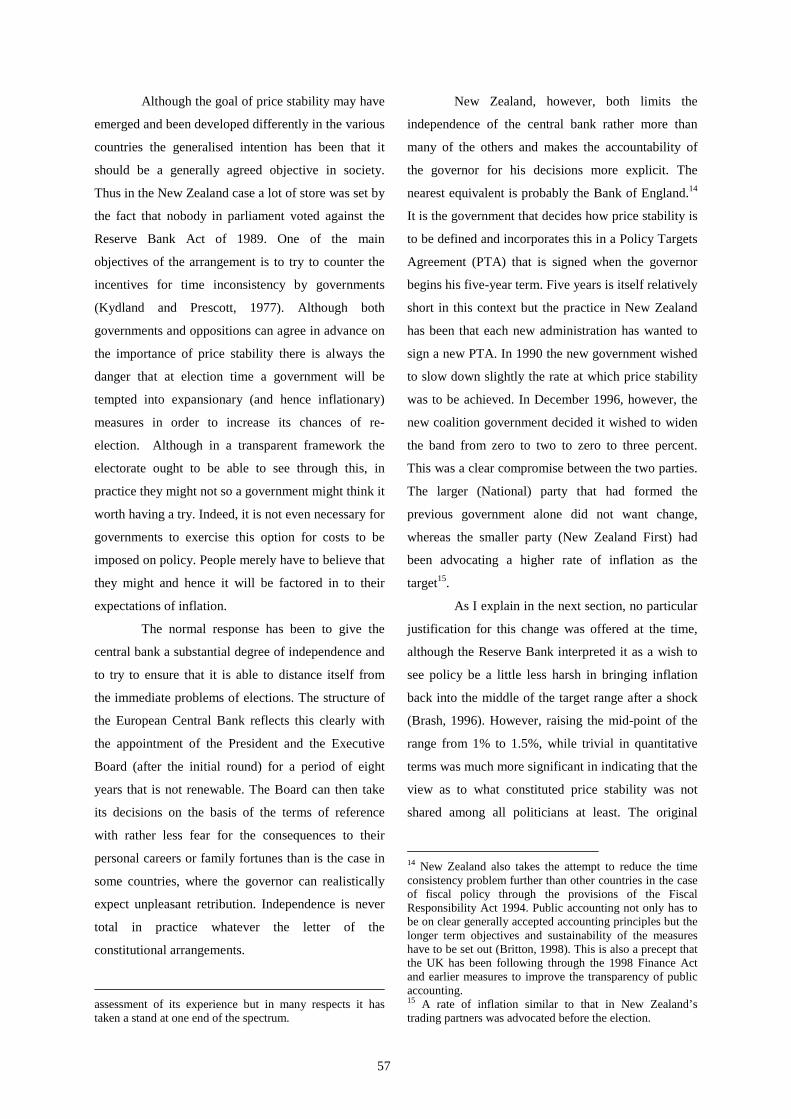
56
were the same as in the US. The yield curve was
smooth, with a gentle upward slope, and inflation
seemed fairly stable at around 1%. Although the
economy was apparently growing around 1% faster
than the longer-term average of previous
performance, this was interpreted at the time as the
characteristics of a successful regime change (RBNZ,
1994) and as an economy in reasonable equilibrium.11
History since then has led to a reappraisal. Monetary
conditions have always been tighter. Even now in the
face of the Asian crisis and even recession for a few
quarter at least real interest rates are clearly in excess
of what a 3.5% world rate and forecast domestic
inflation of around 1.5% would lead one to expect
(Fig 2, 3). Haldane (1998) suggests that at 160 basis
points the 10-year bond differential for New Zealand
was the largest of the inflation targeting countries.12
Various special factors can be advanced to help
explain some of the experience, such as the
substantial turn round in fiscal policy and the period
of sales of public sector assets to foreign companies
but the conundrum remains. The Governor of the
Reserve Bank has been attributing it to New
Zealanders’ love affair with housing (Brash, 1997).
They are just not as prepared to save in the form of
financial assets as in other countries. That is clearly
the result but it is difficult to interpret the decision as
not involving some lack of credibility.
11 Sustainable faster than average growth made sensebecause New Zealand had been growing very slowly for adecade, productivity levels were noticeably below theOECD average, the country had relatively underexploitednatural resources and net immigration that was focused onhigh skilled workers.12 Differentials from the average of US and Germany(reduction since start of inflation targeting) Australia –0.50(1.85), Canada 0.30 (1.39), Finland –0.10 (3.84), NZ 1.60(1.83), Spain 0.84 (2.35), Sweden 0.92 (2.74) UK 1.22(1.00). Differentials have of course changed in the last year.
3 Institutional Arrangements
There is considerable variety among the
inflation targeting central banks over who defines
price stability and the exact degree of independence
they have (see Table 1, Briault et al. (1996), Castren
(1998)). However, New Zealand alone has gone for a
direct contractual relationship between the
government in the person of the minister of finance
and the governor of the central bank.13 The practice of
the way this has turned out and the fact that others
have not adopted it are instructive.
The contractual arrangement implemented in
New Zealand is a straightforward response to the
usual principal-agent problem. How can the
government make sure that an independent central
bank will actually do what has been asked of it? By
arranging monitoring by the Reserve Bank’s Board
and the sanction of potential dismissal for poor
performance against a clearly specified target this
provides an arrangement that has been described as
near optimal in the circumstances (Walsh, 1995). The
more normal approach has been to follow something
closer to the “conservative central banker” idea
advanced by Rogoff (1985) inter alia and appoint
someone with a prior reputation that would lead most
people to expect them to strive for price stability.
Monitoring or “accountability” is achieved in a more
arms length manner through parliament or other less
explicit means.
Secondly, rather than spelling out in detail
how the target is to be defined a common approach
has been to leave this to the central bank but to try to
set up a structure such that the definition is likely to
be widely accepted and durable.
13 In this and the succeeding discussions I have drawnheavily on my own experience in New Zealand and Finland.That seems only common sense and I make no apology forit. However, in many respects New Zealand is the naturalchoice as a comparator. Not only did it start down this roadfirst so others have made their decisions in the light of their
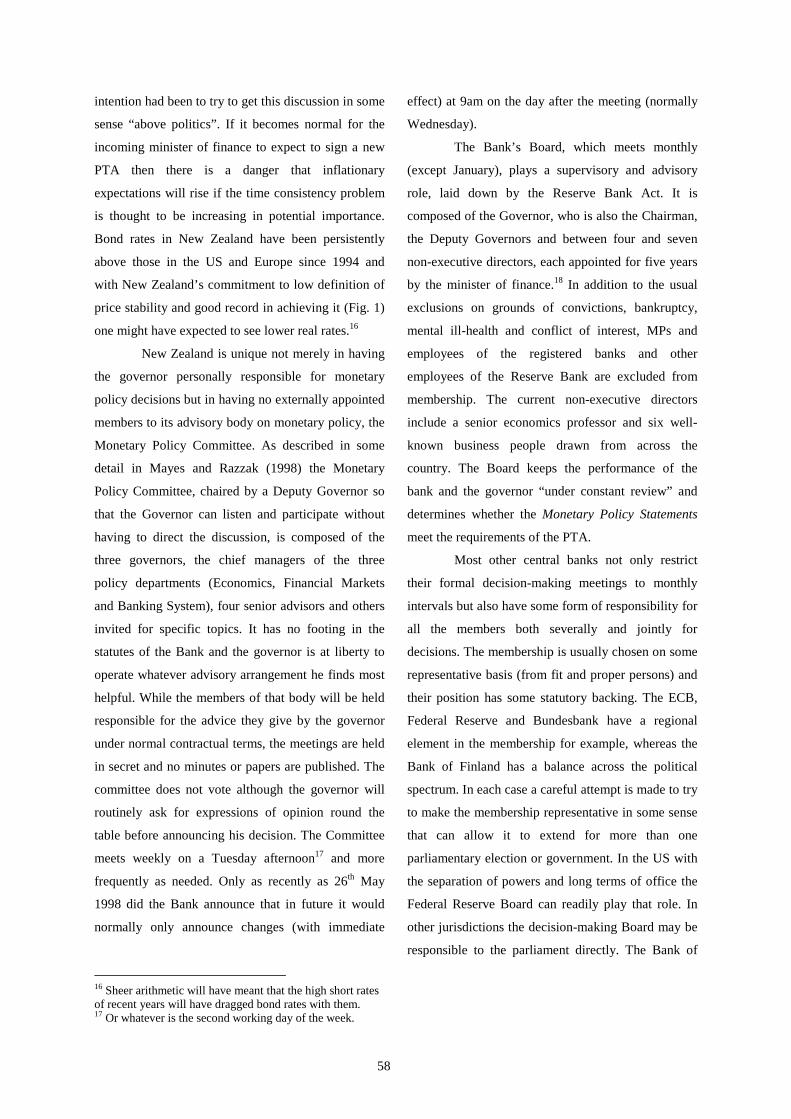
57
Although the goal of price stability may have
emerged and been developed differently in the various
countries the generalised intention has been that it
should be a generally agreed objective in society.
Thus in the New Zealand case a lot of store was set by
the fact that nobody in parliament voted against the
Reserve Bank Act of 1989. One of the main
objectives of the arrangement is to try to counter the
incentives for time inconsistency by governments
(Kydland and Prescott, 1977). Although both
governments and oppositions can agree in advance on
the importance of price stability there is always the
danger that at election time a government will be
tempted into expansionary (and hence inflationary)
measures in order to increase its chances of re-
election. Although in a transparent framework the
electorate ought to be able to see through this, in
practice they might not so a government might think it
worth having a try. Indeed, it is not even necessary for
governments to exercise this option for costs to be
imposed on policy. People merely have to believe that
they might and hence it will be factored in to their
expectations of inflation.
The normal response has been to give the
central bank a substantial degree of independence and
to try to ensure that it is able to distance itself from
the immediate problems of elections. The structure of
the European Central Bank reflects this clearly with
the appointment of the President and the Executive
Board (after the initial round) for a period of eight
years that is not renewable. The Board can then take
its decisions on the basis of the terms of reference
with rather less fear for the consequences to their
personal careers or family fortunes than is the case in
some countries, where the governor can realistically
expect unpleasant retribution. Independence is never
total in practice whatever the letter of the
constitutional arrangements.
assessment of its experience but in many respects it hastaken a stand at one end of the spectrum.
New Zealand, however, both limits the
independence of the central bank rather more than
many of the others and makes the accountability of
the governor for his decisions more explicit. The
nearest equivalent is probably the Bank of England.14
It is the government that decides how price stability is
to be defined and incorporates this in a Policy Targets
Agreement (PTA) that is signed when the governor
begins his five-year term. Five years is itself relatively
short in this context but the practice in New Zealand
has been that each new administration has wanted to
sign a new PTA. In 1990 the new government wished
to slow down slightly the rate at which price stability
was to be achieved. In December 1996, however, the
new coalition government decided it wished to widen
the band from zero to two to zero to three percent.
This was a clear compromise between the two parties.
The larger (National) party that had formed the
previous government alone did not want change,
whereas the smaller party (New Zealand First) had
been advocating a higher rate of inflation as the
target15.
As I explain in the next section, no particular
justification for this change was offered at the time,
although the Reserve Bank interpreted it as a wish to
see policy be a little less harsh in bringing inflation
back into the middle of the target range after a shock
(Brash, 1996). However, raising the mid-point of the
range from 1% to 1.5%, while trivial in quantitative
terms was much more significant in indicating that the
view as to what constituted price stability was not
shared among all politicians at least. The original
14 New Zealand also takes the attempt to reduce the timeconsistency problem further than other countries in the caseof fiscal policy through the provisions of the FiscalResponsibility Act 1994. Public accounting not only has tobe on clear generally accepted accounting principles but thelonger term objectives and sustainability of the measureshave to be set out (Britton, 1998). This is also a precept thatthe UK has been following through the 1998 Finance Actand earlier measures to improve the transparency of publicaccounting.15 A rate of inflation similar to that in New Zealand’strading partners was advocated before the election.
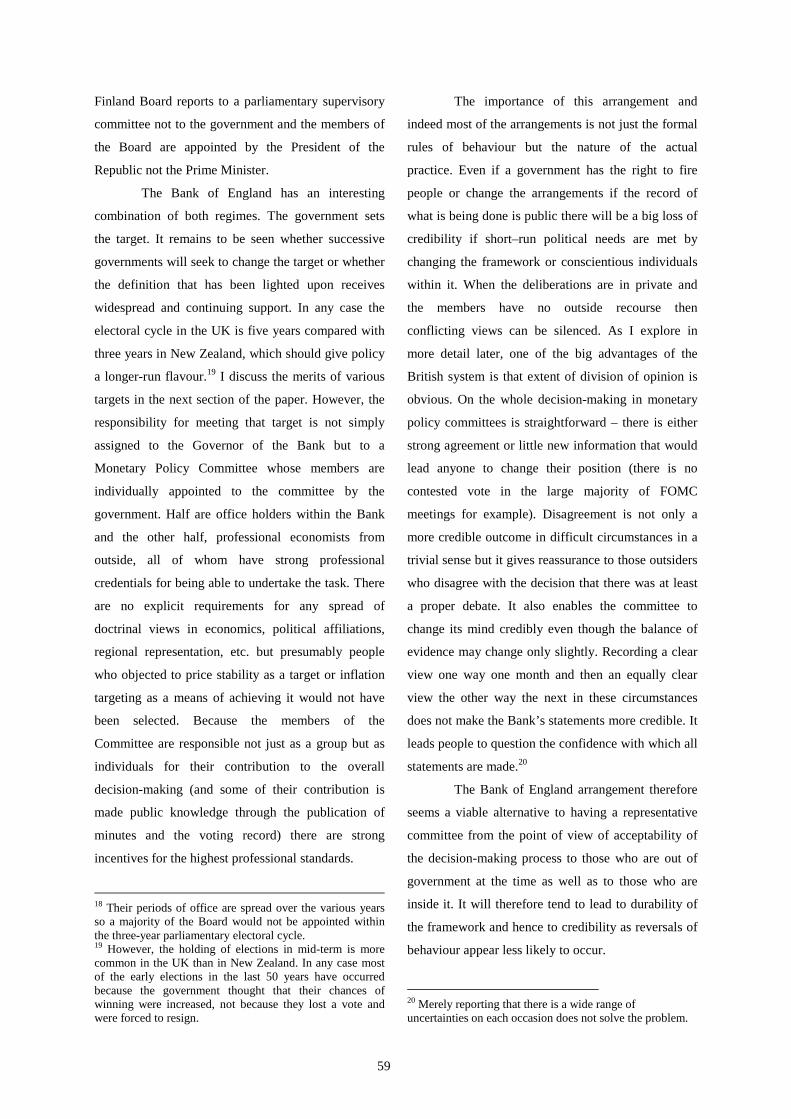
58
intention had been to try to get this discussion in some
sense “above politics”. If it becomes normal for the
incoming minister of finance to expect to sign a new
PTA then there is a danger that inflationary
expectations will rise if the time consistency problem
is thought to be increasing in potential importance.
Bond rates in New Zealand have been persistently
above those in the US and Europe since 1994 and
with New Zealand’s commitment to low definition of
price stability and good record in achieving it (Fig. 1)
one might have expected to see lower real rates.16
New Zealand is unique not merely in having
the governor personally responsible for monetary
policy decisions but in having no externally appointed
members to its advisory body on monetary policy, the
Monetary Policy Committee. As described in some
detail in Mayes and Razzak (1998) the Monetary
Policy Committee, chaired by a Deputy Governor so
that the Governor can listen and participate without
having to direct the discussion, is composed of the
three governors, the chief managers of the three
policy departments (Economics, Financial Markets
and Banking System), four senior advisors and others
invited for specific topics. It has no footing in the
statutes of the Bank and the governor is at liberty to
operate whatever advisory arrangement he finds most
helpful. While the members of that body will be held
responsible for the advice they give by the governor
under normal contractual terms, the meetings are held
in secret and no minutes or papers are published. The
committee does not vote although the governor will
routinely ask for expressions of opinion round the
table before announcing his decision. The Committee
meets weekly on a Tuesday afternoon17 and more
frequently as needed. Only as recently as 26th May
1998 did the Bank announce that in future it would
normally only announce changes (with immediate
16 Sheer arithmetic will have meant that the high short ratesof recent years will have dragged bond rates with them.17 Or whatever is the second working day of the week.
effect) at 9am on the day after the meeting (normally
Wednesday).
The Bank’s Board, which meets monthly
(except January), plays a supervisory and advisory
role, laid down by the Reserve Bank Act. It is
composed of the Governor, who is also the Chairman,
the Deputy Governors and between four and seven
non-executive directors, each appointed for five years
by the minister of finance.18 In addition to the usual
exclusions on grounds of convictions, bankruptcy,
mental ill-health and conflict of interest, MPs and
employees of the registered banks and other
employees of the Reserve Bank are excluded from
membership. The current non-executive directors
include a senior economics professor and six well-
known business people drawn from across the
country. The Board keeps the performance of the
bank and the governor “under constant review” and
determines whether the Monetary Policy Statements
meet the requirements of the PTA.
Most other central banks not only restrict
their formal decision-making meetings to monthly
intervals but also have some form of responsibility for
all the members both severally and jointly for
decisions. The membership is usually chosen on some
representative basis (from fit and proper persons) and
their position has some statutory backing. The ECB,
Federal Reserve and Bundesbank have a regional
element in the membership for example, whereas the
Bank of Finland has a balance across the political
spectrum. In each case a careful attempt is made to try
to make the membership representative in some sense
that can allow it to extend for more than one
parliamentary election or government. In the US with
the separation of powers and long terms of office the
Federal Reserve Board can readily play that role. In
other jurisdictions the decision-making Board may be
responsible to the parliament directly. The Bank of
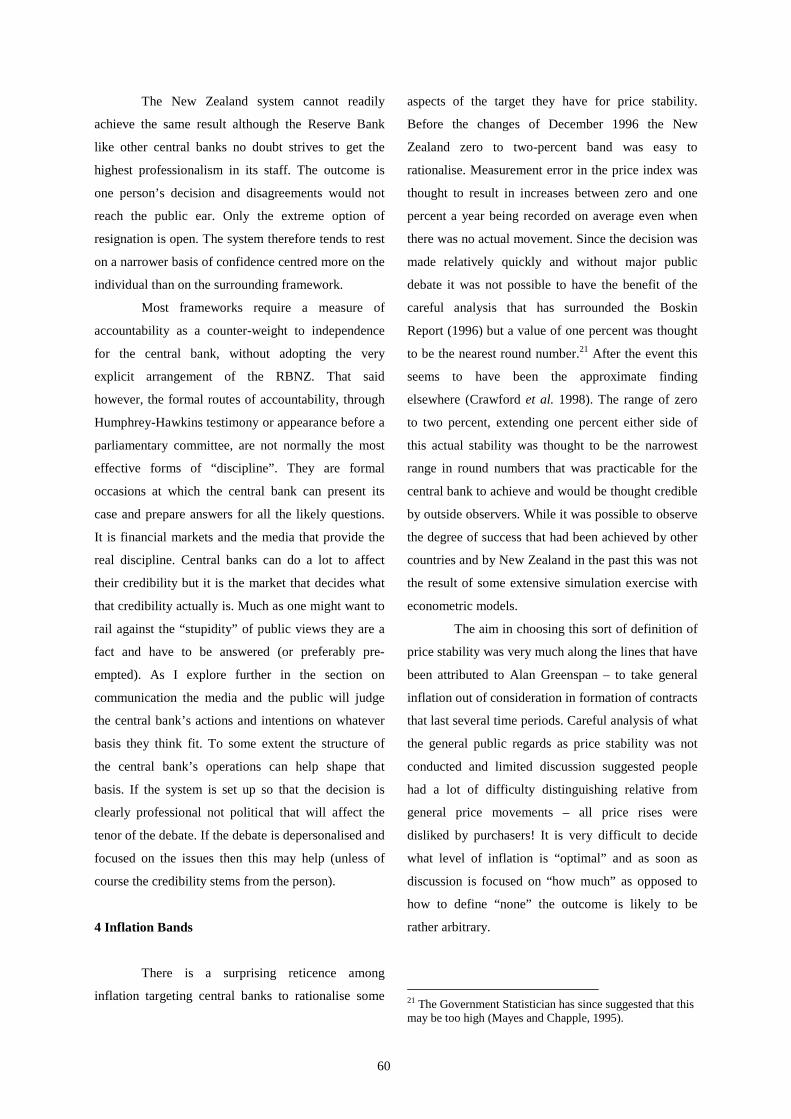
59
Finland Board reports to a parliamentary supervisory
committee not to the government and the members of
the Board are appointed by the President of the
Republic not the Prime Minister.
The Bank of England has an interesting
combination of both regimes. The government sets
the target. It remains to be seen whether successive
governments will seek to change the target or whether
the definition that has been lighted upon receives
widespread and continuing support. In any case the
electoral cycle in the UK is five years compared with
three years in New Zealand, which should give policy
a longer-run flavour.19 I discuss the merits of various
targets in the next section of the paper. However, the
responsibility for meeting that target is not simply
assigned to the Governor of the Bank but to a
Monetary Policy Committee whose members are
individually appointed to the committee by the
government. Half are office holders within the Bank
and the other half, professional economists from
outside, all of whom have strong professional
credentials for being able to undertake the task. There
are no explicit requirements for any spread of
doctrinal views in economics, political affiliations,
regional representation, etc. but presumably people
who objected to price stability as a target or inflation
targeting as a means of achieving it would not have
been selected. Because the members of the
Committee are responsible not just as a group but as
individuals for their contribution to the overall
decision-making (and some of their contribution is
made public knowledge through the publication of
minutes and the voting record) there are strong
incentives for the highest professional standards.
18 Their periods of office are spread over the various yearsso a majority of the Board would not be appointed withinthe three-year parliamentary electoral cycle.19 However, the holding of elections in mid-term is morecommon in the UK than in New Zealand. In any case mostof the early elections in the last 50 years have occurredbecause the government thought that their chances ofwinning were increased, not because they lost a vote andwere forced to resign.
The importance of this arrangement and
indeed most of the arrangements is not just the formal
rules of behaviour but the nature of the actual
practice. Even if a government has the right to fire
people or change the arrangements if the record of
what is being done is public there will be a big loss of
credibility if short–run political needs are met by
changing the framework or conscientious individuals
within it. When the deliberations are in private and
the members have no outside recourse then
conflicting views can be silenced. As I explore in
more detail later, one of the big advantages of the
British system is that extent of division of opinion is
obvious. On the whole decision-making in monetary
policy committees is straightforward – there is either
strong agreement or little new information that would
lead anyone to change their position (there is no
contested vote in the large majority of FOMC
meetings for example). Disagreement is not only a
more credible outcome in difficult circumstances in a
trivial sense but it gives reassurance to those outsiders
who disagree with the decision that there was at least
a proper debate. It also enables the committee to
change its mind credibly even though the balance of
evidence may change only slightly. Recording a clear
view one way one month and then an equally clear
view the other way the next in these circumstances
does not make the Bank’s statements more credible. It
leads people to question the confidence with which all
statements are made.20
The Bank of England arrangement therefore
seems a viable alternative to having a representative
committee from the point of view of acceptability of
the decision-making process to those who are out of
government at the time as well as to those who are
inside it. It will therefore tend to lead to durability of
the framework and hence to credibility as reversals of
behaviour appear less likely to occur.
20 Merely reporting that there is a wide range ofuncertainties on each occasion does not solve the problem.

60
The New Zealand system cannot readily
achieve the same result although the Reserve Bank
like other central banks no doubt strives to get the
highest professionalism in its staff. The outcome is
one person’s decision and disagreements would not
reach the public ear. Only the extreme option of
resignation is open. The system therefore tends to rest
on a narrower basis of confidence centred more on the
individual than on the surrounding framework.
Most frameworks require a measure of
accountability as a counter-weight to independence
for the central bank, without adopting the very
explicit arrangement of the RBNZ. That said
however, the formal routes of accountability, through
Humphrey-Hawkins testimony or appearance before a
parliamentary committee, are not normally the most
effective forms of “discipline”. They are formal
occasions at which the central bank can present its
case and prepare answers for all the likely questions.
It is financial markets and the media that provide the
real discipline. Central banks can do a lot to affect
their credibility but it is the market that decides what
that credibility actually is. Much as one might want to
rail against the “stupidity” of public views they are a
fact and have to be answered (or preferably pre-
empted). As I explore further in the section on
communication the media and the public will judge
the central bank’s actions and intentions on whatever
basis they think fit. To some extent the structure of
the central bank’s operations can help shape that
basis. If the system is set up so that the decision is
clearly professional not political that will affect the
tenor of the debate. If the debate is depersonalised and
focused on the issues then this may help (unless of
course the credibility stems from the person).
4 Inflation Bands
There is a surprising reticence among
inflation targeting central banks to rationalise some
aspects of the target they have for price stability.
Before the changes of December 1996 the New
Zealand zero to two-percent band was easy to
rationalise. Measurement error in the price index was
thought to result in increases between zero and one
percent a year being recorded on average even when
there was no actual movement. Since the decision was
made relatively quickly and without major public
debate it was not possible to have the benefit of the
careful analysis that has surrounded the Boskin
Report (1996) but a value of one percent was thought
to be the nearest round number.21 After the event this
seems to have been the approximate finding
elsewhere (Crawford et al. 1998). The range of zero
to two percent, extending one percent either side of
this actual stability was thought to be the narrowest
range in round numbers that was practicable for the
central bank to achieve and would be thought credible
by outside observers. While it was possible to observe
the degree of success that had been achieved by other
countries and by New Zealand in the past this was not
the result of some extensive simulation exercise with
econometric models.
The aim in choosing this sort of definition of
price stability was very much along the lines that have
been attributed to Alan Greenspan – to take general
inflation out of consideration in formation of contracts
that last several time periods. Careful analysis of what
the general public regards as price stability was not
conducted and limited discussion suggested people
had a lot of difficulty distinguishing relative from
general price movements – all price rises were
disliked by purchasers! It is very difficult to decide
what level of inflation is “optimal” and as soon as
discussion is focused on “how much” as opposed to
how to define “none” the outcome is likely to be
rather arbitrary.
21 The Government Statistician has since suggested that thismay be too high (Mayes and Chapple, 1995).
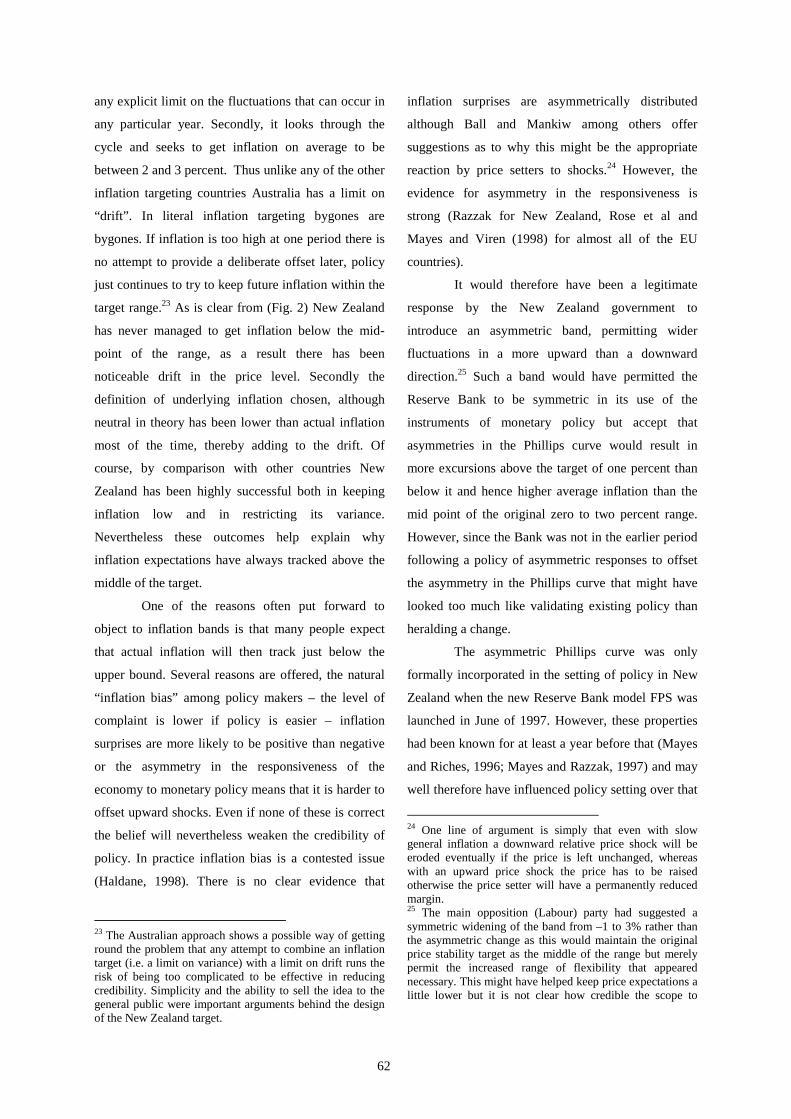
61
Much of the subsequent discussion has been
ex-post rationalisation. The lower limit of zero was
not especially influenced by concerns of asymmetry
in wage bargaining. The conclusion that in practice
nominal wages received are sufficiently flexible
downwards came later (Cassino, 1995).22 In a very
open economy in which primary products play a key
role, downward as well as upward movements in
prices and incomes are a common experience.
Similarly, in a small open economy with a floating
exchange rate, concerns over downward flexibility of
nominal interest rates were discounted.
It was felt intuitively obvious by politicians
that everybody normally thought of the CPI when
discussing inflation and hence wider concerns of what
index was appropriate from the point of view of
welfare did not feature strongly in the discussion.
Much greater effort was expended on the appropriate
response of the central bank to shocks and to a
problem that was particularly acute in the New
Zealand CPI, namely that changes in interest rates had
a substantial and immediate effect through house
prices and credit charges. Hence tightening monetary
conditions in the face of impending inflationary
pressure would itself tend to raise the price level,
albeit temporarily.
Since the appropriate treatment of supply
shocks is the subject of a separate paper at this
workshop I shall not pursue this further, except to
note that it is the appropriate explanation of this area
that has been the main subject of change in successive
PTAs. It is only with the most recent PTA, signed on
the reappointment of the Governor for a third five-
year term in December 1997, that the phraseology
could be finally tidied up. Up till that point the
Reserve Bank had gone to great lengths to focus
22 Although it is unusual for the nominal wage rates for anyindividual continuing in the same job without technicalchange to fall, there is sufficient scope for turnover in thelabour market, variation in hours and technical change forthis to be little hindrance when large changes are notrequired.
people’s attention on “underlying inflation”, which it
defined as the inflation rate after allowing for the
“caveats” or permitted exclusions under the PTA.
Now fortunately it has been possible to focus on a
CPIX very much akin to the RPIX used in the UK
target and to have that produced, independently, by
Statistics New Zealand as a headline number.
There have been outside model-based
assessments of the minimum plausible bandwidth that
the RBNZ could achieve (Turner, 1997) and similar
analyses have been applied to other countries (Amano
et al. 1998 for Canada and de Brouwer and O’Regan,
1998 for Australia). Ironically these have suggested
that the possible band is wider than has actually been
achieved. One reason for being able to adhere to a
narrow band, shown clearly in the case of Canada, is
that the bandwidth falls if forward-looking
expectations and a monetary policy reaction function
are included in the model. The second is that the
estimates are based on data for the past and the
introduction of inflation targeting could itself be
expected to increase credibility and hence reduce
fluctuations in inflation in response to shocks.
There tends to be suspicion when a central
bank either calculates the target series itself or seeks
to alter an existing series, even though the Bank itself
will be thoroughly convinced of its integrity and lay
its methodology open to outside scrutiny (as in the
case of the RBNZ). There has been debate in
Australia, where the Reserve Bank excludes about
half of the items in the CPI in its definition of
underlying inflation (Edey, 1998). However, a key
feature that governs the acceptability of these
exclusions is whether the resultant series diverges
from the CPI in the long run. In the Australian case
(Wilkinson, 1995) it is clear that there is no such
divergence.
Australia provides an interesting counter
example to many of the definitions of price stability
that have been used. In the first place it does not place
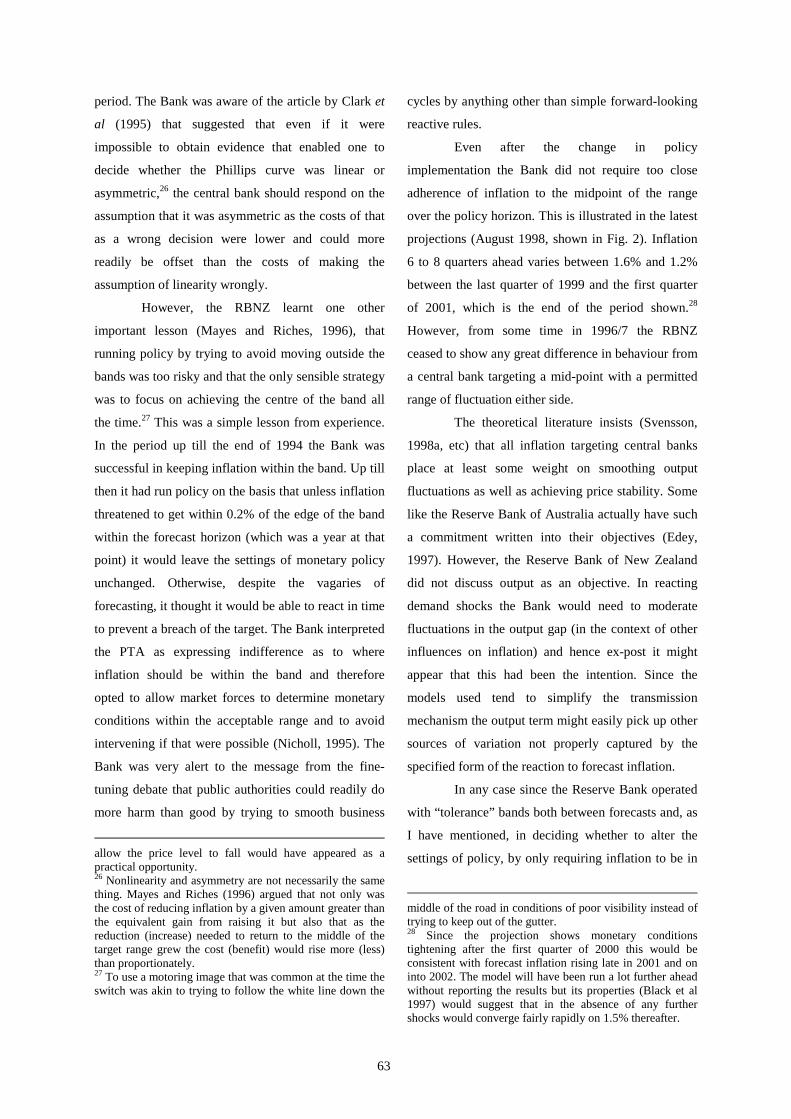
62
any explicit limit on the fluctuations that can occur in
any particular year. Secondly, it looks through the
cycle and seeks to get inflation on average to be
between 2 and 3 percent. Thus unlike any of the other
inflation targeting countries Australia has a limit on
“drift”. In literal inflation targeting bygones are
bygones. If inflation is too high at one period there is
no attempt to provide a deliberate offset later, policy
just continues to try to keep future inflation within the
target range.23 As is clear from (Fig. 2) New Zealand
has never managed to get inflation below the mid-
point of the range, as a result there has been
noticeable drift in the price level. Secondly the
definition of underlying inflation chosen, although
neutral in theory has been lower than actual inflation
most of the time, thereby adding to the drift. Of
course, by comparison with other countries New
Zealand has been highly successful both in keeping
inflation low and in restricting its variance.
Nevertheless these outcomes help explain why
inflation expectations have always tracked above the
middle of the target.
One of the reasons often put forward to
object to inflation bands is that many people expect
that actual inflation will then track just below the
upper bound. Several reasons are offered, the natural
“inflation bias” among policy makers – the level of
complaint is lower if policy is easier – inflation
surprises are more likely to be positive than negative
or the asymmetry in the responsiveness of the
economy to monetary policy means that it is harder to
offset upward shocks. Even if none of these is correct
the belief will nevertheless weaken the credibility of
policy. In practice inflation bias is a contested issue
(Haldane, 1998). There is no clear evidence that
23 The Australian approach shows a possible way of gettinground the problem that any attempt to combine an inflationtarget (i.e. a limit on variance) with a limit on drift runs therisk of being too complicated to be effective in reducingcredibility. Simplicity and the ability to sell the idea to thegeneral public were important arguments behind the designof the New Zealand target.
inflation surprises are asymmetrically distributed
although Ball and Mankiw among others offer
suggestions as to why this might be the appropriate
reaction by price setters to shocks.24 However, the
evidence for asymmetry in the responsiveness is
strong (Razzak for New Zealand, Rose et al and
Mayes and Viren (1998) for almost all of the EU
countries).
It would therefore have been a legitimate
response by the New Zealand government to
introduce an asymmetric band, permitting wider
fluctuations in a more upward than a downward
direction.25 Such a band would have permitted the
Reserve Bank to be symmetric in its use of the
instruments of monetary policy but accept that
asymmetries in the Phillips curve would result in
more excursions above the target of one percent than
below it and hence higher average inflation than the
mid point of the original zero to two percent range.
However, since the Bank was not in the earlier period
following a policy of asymmetric responses to offset
the asymmetry in the Phillips curve that might have
looked too much like validating existing policy than
heralding a change.
The asymmetric Phillips curve was only
formally incorporated in the setting of policy in New
Zealand when the new Reserve Bank model FPS was
launched in June of 1997. However, these properties
had been known for at least a year before that (Mayes
and Riches, 1996; Mayes and Razzak, 1997) and may
well therefore have influenced policy setting over that
24 One line of argument is simply that even with slowgeneral inflation a downward relative price shock will beeroded eventually if the price is left unchanged, whereaswith an upward price shock the price has to be raisedotherwise the price setter will have a permanently reducedmargin.25 The main opposition (Labour) party had suggested asymmetric widening of the band from –1 to 3% rather thanthe asymmetric change as this would maintain the originalprice stability target as the middle of the range but merelypermit the increased range of flexibility that appearednecessary. This might have helped keep price expectations alittle lower but it is not clear how credible the scope to
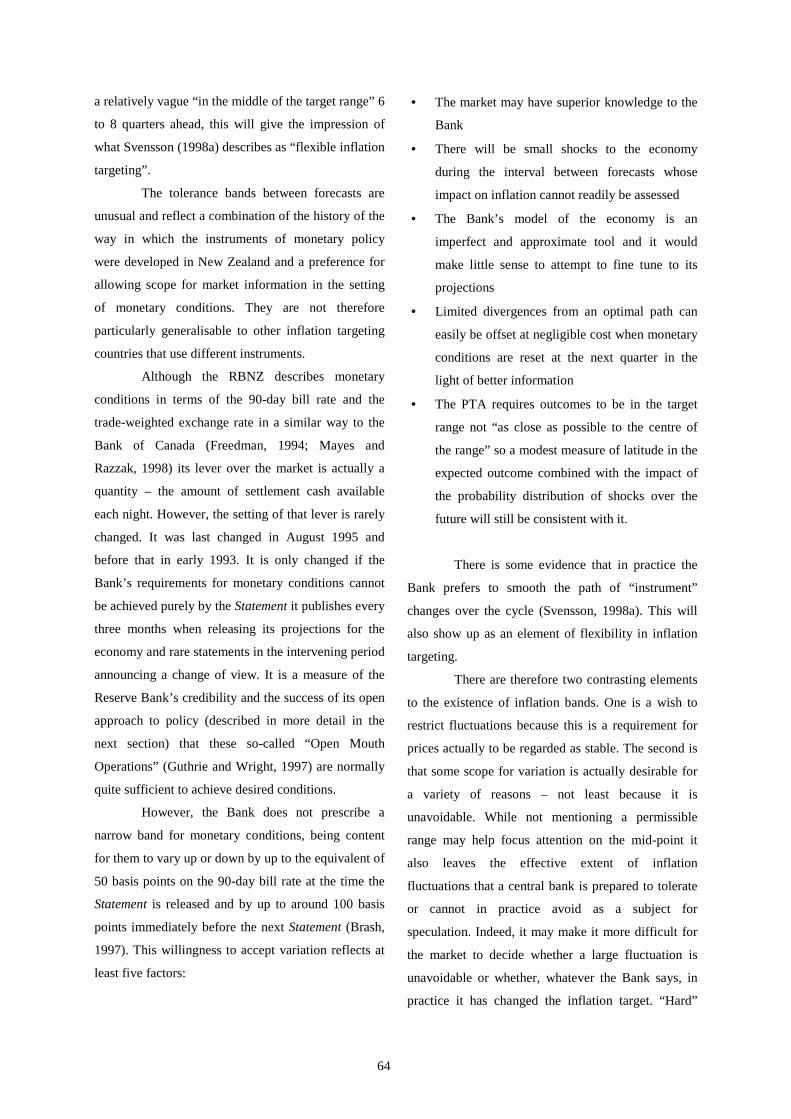
63
period. The Bank was aware of the article by Clark et
al (1995) that suggested that even if it were
impossible to obtain evidence that enabled one to
decide whether the Phillips curve was linear or
asymmetric,26 the central bank should respond on the
assumption that it was asymmetric as the costs of that
as a wrong decision were lower and could more
readily be offset than the costs of making the
assumption of linearity wrongly.
However, the RBNZ learnt one other
important lesson (Mayes and Riches, 1996), that
running policy by trying to avoid moving outside the
bands was too risky and that the only sensible strategy
was to focus on achieving the centre of the band all
the time.27 This was a simple lesson from experience.
In the period up till the end of 1994 the Bank was
successful in keeping inflation within the band. Up till
then it had run policy on the basis that unless inflation
threatened to get within 0.2% of the edge of the band
within the forecast horizon (which was a year at that
point) it would leave the settings of monetary policy
unchanged. Otherwise, despite the vagaries of
forecasting, it thought it would be able to react in time
to prevent a breach of the target. The Bank interpreted
the PTA as expressing indifference as to where
inflation should be within the band and therefore
opted to allow market forces to determine monetary
conditions within the acceptable range and to avoid
intervening if that were possible (Nicholl, 1995). The
Bank was very alert to the message from the fine-
tuning debate that public authorities could readily do
more harm than good by trying to smooth business
allow the price level to fall would have appeared as apractical opportunity.26 Nonlinearity and asymmetry are not necessarily the samething. Mayes and Riches (1996) argued that not only wasthe cost of reducing inflation by a given amount greater thanthe equivalent gain from raising it but also that as thereduction (increase) needed to return to the middle of thetarget range grew the cost (benefit) would rise more (less)than proportionately.27 To use a motoring image that was common at the time theswitch was akin to trying to follow the white line down the
cycles by anything other than simple forward-looking
reactive rules.
Even after the change in policy
implementation the Bank did not require too close
adherence of inflation to the midpoint of the range
over the policy horizon. This is illustrated in the latest
projections (August 1998, shown in Fig. 2). Inflation
6 to 8 quarters ahead varies between 1.6% and 1.2%
between the last quarter of 1999 and the first quarter
of 2001, which is the end of the period shown.28
However, from some time in 1996/7 the RBNZ
ceased to show any great difference in behaviour from
a central bank targeting a mid-point with a permitted
range of fluctuation either side.
The theoretical literature insists (Svensson,
1998a, etc) that all inflation targeting central banks
place at least some weight on smoothing output
fluctuations as well as achieving price stability. Some
like the Reserve Bank of Australia actually have such
a commitment written into their objectives (Edey,
1997). However, the Reserve Bank of New Zealand
did not discuss output as an objective. In reacting
demand shocks the Bank would need to moderate
fluctuations in the output gap (in the context of other
influences on inflation) and hence ex-post it might
appear that this had been the intention. Since the
models used tend to simplify the transmission
mechanism the output term might easily pick up other
sources of variation not properly captured by the
specified form of the reaction to forecast inflation.
In any case since the Reserve Bank operated
with “tolerance” bands both between forecasts and, as
I have mentioned, in deciding whether to alter the
settings of policy, by only requiring inflation to be in
middle of the road in conditions of poor visibility instead oftrying to keep out of the gutter.28 Since the projection shows monetary conditionstightening after the first quarter of 2000 this would beconsistent with forecast inflation rising late in 2001 and oninto 2002. The model will have been run a lot further aheadwithout reporting the results but its properties (Black et al1997) would suggest that in the absence of any furthershocks would converge fairly rapidly on 1.5% thereafter.
64
a relatively vague “in the middle of the target range” 6
to 8 quarters ahead, this will give the impression of
what Svensson (1998a) describes as “flexible inflation
targeting”.
The tolerance bands between forecasts are
unusual and reflect a combination of the history of the
way in which the instruments of monetary policy
were developed in New Zealand and a preference for
allowing scope for market information in the setting
of monetary conditions. They are not therefore
particularly generalisable to other inflation targeting
countries that use different instruments.
Although the RBNZ describes monetary
conditions in terms of the 90-day bill rate and the
trade-weighted exchange rate in a similar way to the
Bank of Canada (Freedman, 1994; Mayes and
Razzak, 1998) its lever over the market is actually a
quantity – the amount of settlement cash available
each night. However, the setting of that lever is rarely
changed. It was last changed in August 1995 and
before that in early 1993. It is only changed if the
Bank’s requirements for monetary conditions cannot
be achieved purely by the Statement it publishes every
three months when releasing its projections for the
economy and rare statements in the intervening period
announcing a change of view. It is a measure of the
Reserve Bank’s credibility and the success of its open
approach to policy (described in more detail in the
next section) that these so-called “Open Mouth
Operations” (Guthrie and Wright, 1997) are normally
quite sufficient to achieve desired conditions.
However, the Bank does not prescribe a
narrow band for monetary conditions, being content
for them to vary up or down by up to the equivalent of
50 basis points on the 90-day bill rate at the time the
Statement is released and by up to around 100 basis
points immediately before the next Statement (Brash,
1997). This willingness to accept variation reflects at
least five factors:
• The market may have superior knowledge to the
Bank
• There will be small shocks to the economy
during the interval between forecasts whose
impact on inflation cannot readily be assessed
• The Bank’s model of the economy is an
imperfect and approximate tool and it would
make little sense to attempt to fine tune to its
projections
• Limited divergences from an optimal path can
easily be offset at negligible cost when monetary
conditions are reset at the next quarter in the
light of better information
• The PTA requires outcomes to be in the target
range not “as close as possible to the centre of
the range” so a modest measure of latitude in the
expected outcome combined with the impact of
the probability distribution of shocks over the
future will still be consistent with it.
There is some evidence that in practice the
Bank prefers to smooth the path of “instrument”
changes over the cycle (Svensson, 1998a). This will
also show up as an element of flexibility in inflation
targeting.
There are therefore two contrasting elements
to the existence of inflation bands. One is a wish to
restrict fluctuations because this is a requirement for
prices actually to be regarded as stable. The second is
that some scope for variation is actually desirable for
a variety of reasons – not least because it is
unavoidable. While not mentioning a permissible
range may help focus attention on the mid-point it
also leaves the effective extent of inflation
fluctuations that a central bank is prepared to tolerate
or cannot in practice avoid as a subject for
speculation. Indeed, it may make it more difficult for
the market to decide whether a large fluctuation is
unavoidable or whether, whatever the Bank says, in
practice it has changed the inflation target. “Hard”
65
inflation bands may work in a manner similar to
exchange rate bands (Tetlow and Williams, 1998).
When the edge of the bands is approached there may
be a “halo” effect that stems from credibility. If the
central bank’s commitment to the edges of the band is
credible then expectations of a wider fluctuation will
tend to fade away as the edge of the band is reached.
It is clear that many people in New Zealand
(and elsewhere) thought the band was very hard-
edged. There are several articles (Siklos, 1998b, for
example) that state that the governor is liable for
dismissal if the band is breached. Clearly no governor
would want to find out how hard-edged the band is in
practice because that would only be established by the
minister of finance’s action. Breaching a “hard-
edged” band will tend to be more damaging to
credibility than reaching the same level of inflation
with either a soft-edged band or where there is no
stated band.
The Bank of Finland has not been explicit in
quoting a range for acceptable inflation although it
has made clear the form of underlying inflation it is
targeting. The 2% target has effectively been a
maximum with a wish to keep deviations to a
minimum. As is clear from Table 1 most other
inflation targeting central banks try to keep inflation
within a range of 2 percentage points. In general,
however, the rationale for any such band (or lack of
it) does not seem to be firmly rooted in a concept of
price “stability” but rather in terms of practicalities
and concepts of low inflation.
5 Communication
In this section I consider just two aspects of a
communication strategy to achieve greater credibility,
the publication of “Inflation Reports” to achieve
greater understanding of the intentions of monetary
policy and Monetary Conditions Indexes to make the
stance of policy clear in a small open economy.
However, the whole range of communication has a
role to play including the use of lobbying and
speeches up and down the country to win “hearts and
minds” (Siklos, 1998b).
5.1 Inflation Reports29
Most of the inflation targeting central banks
produce some sort of inflation report at regular
intervals. On the whole these are backward-looking
documents covering not just the recent evolution of
inflation and its components but a description of the
main events in the economy and related to it that have
contributed to the inflation outcome. They also
include a record of their actions. The degree to which
they include analysis and a forward look varies, as
does the degree to which they use or discuss formal
models. On the whole the choices of what to include,
how frequently to present and the readership at whom
to aim has been their own. Even the Reserve Bank of
New Zealand, which has a statutory requirement to
produce at least one report every six months
explaining its actions and in particular explaining any
deviations from the target and how it intends to return
inflation inside the target, is largely unconstrained.
The backward-looking explanation is more aimed at
fulfilling obligations of accountability, whereas the
forward look is aimed primarily at affecting
expectations and increasing the effectiveness and
decreasing the cost of monetary policy. My concern is
therefore primarily with the forward look.30
While the RBNZ is scrupulous in meeting
the legal requirements (this is one of the few issues on
which the Bank’s Board passes formal resolutions)
the report is really aimed primarily at market analysts.
It is the analysis of the problems confronting
monetary policy and the explanation of the way that
the Bank sees itself addressing these problems that is
29 This section draws on earlier work (Mayes and Castern(1998) for example) considering a Price Stability Report forthe ESCB.
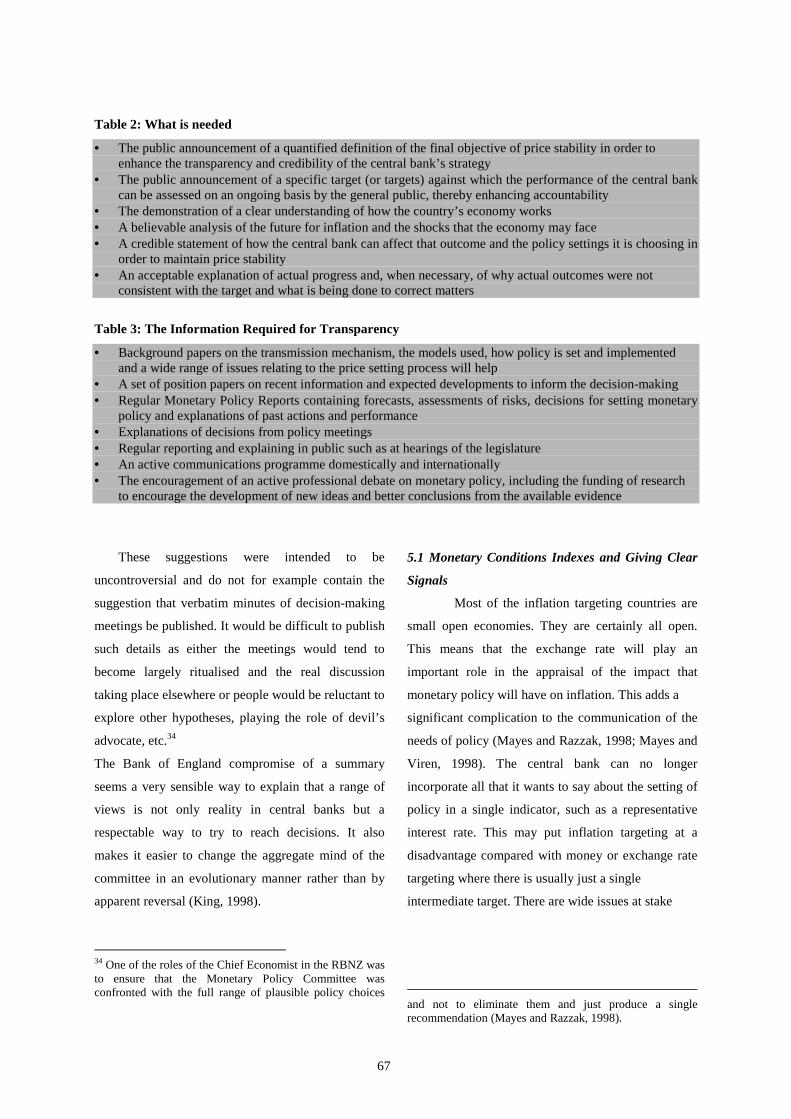
66
at the heart of the report. The English-speaking
inflation targeting countries are at an advantage in that
they can address financial markets round the world in
their own language. Spain, Norway and Sweden also
produce reports in English while the Bank of Finland
produces a separate Bulletin in English and publishes
almost all of its research in English.31
In most of these reports it is the backward
look and the discussion of the current monetary and
economic position that dominates. Both the Norges
Bank and the Sveriges Riksbank show scenarios,
based on models that indicate the quantitative
importance to monetary policy of risks that face the
economy. The Bank of England is alone in presenting
a probability distribution of outcomes for both
inflation and the real economy.32 Furthermore the
record of the meetings of the Monetary Policy
Committee give a clear digest of the concerns about
the future. A good case can be made for being right
down the open end of the scale.33 The dividing line
for openness needs to be drawn before the extra
information starts making the central bank look
indecisive or the message becomes muddled in the
mind of the receivers. Where this occurs will depend
in part upon history and the framework society is used
to for communication.
My impression from reading some of the
debates over where to draw the line is that there is a
confusion in terminology rather than substance that
hinges on the meaning of the words “clarity” and
“transparency”.
All central banks want to give clear
messages. However, these can be achieved by a
number of routes:
30 Clearly the backward look can also contribute tocredibility.31 Very little research is published in Finnish.32 I note in the next section a concern about the form ofthese distributions.33 Although, as Archer (1995) notes, to some extent thismay be a one-way street. It is easy to increase openness butoutside comment may make it more difficult to decrease theamount of information
• By actions in setting interest rates, reserve
requirements, intervention in markets
• By structures and by pre-commitment to a set of
rules and responses (as discussed in section 2)
• By explanation.
All of these have their difficulties and
inflation targeting can put a considerable burden on
the last of these. Certainly in so far as credibility can
be achieved by routes other than explanation the
burden is eased.
Transparency, however, is a different issue.
One can be clear without being transparent. A central
bank is transparent if outsiders can understand what it
is doing and be able to predict with reasonable
accuracy what it is going to do. This almost certainly
involves being clear but the clarity necessary to
achieve transparency in a complex world does not
necessarily equate with simplicity. One of the great
advantages often attributed to money targeting is that
it involves both a simple rule and a simple readily
observable means of verifying whether it has been
followed. In one sense therefore it is clear. However,
if the mechanism by which such an intermediate
target is translated into price stability is not spelt out
then it is not likely to be very transparent.
Regrettably for most monetary policy
regimes the transmission mechanism from monetary
policy into price stability and the requirements that
known events and the uncertainties of the future place
on the central bank are not easy to explain. In Mayes
and Castren (1998) we set out some of the messages
that need to be put across successfully to enhance
credibility (Table 2) and also suggested what the
requirements might be for communicating them
(Table 3).
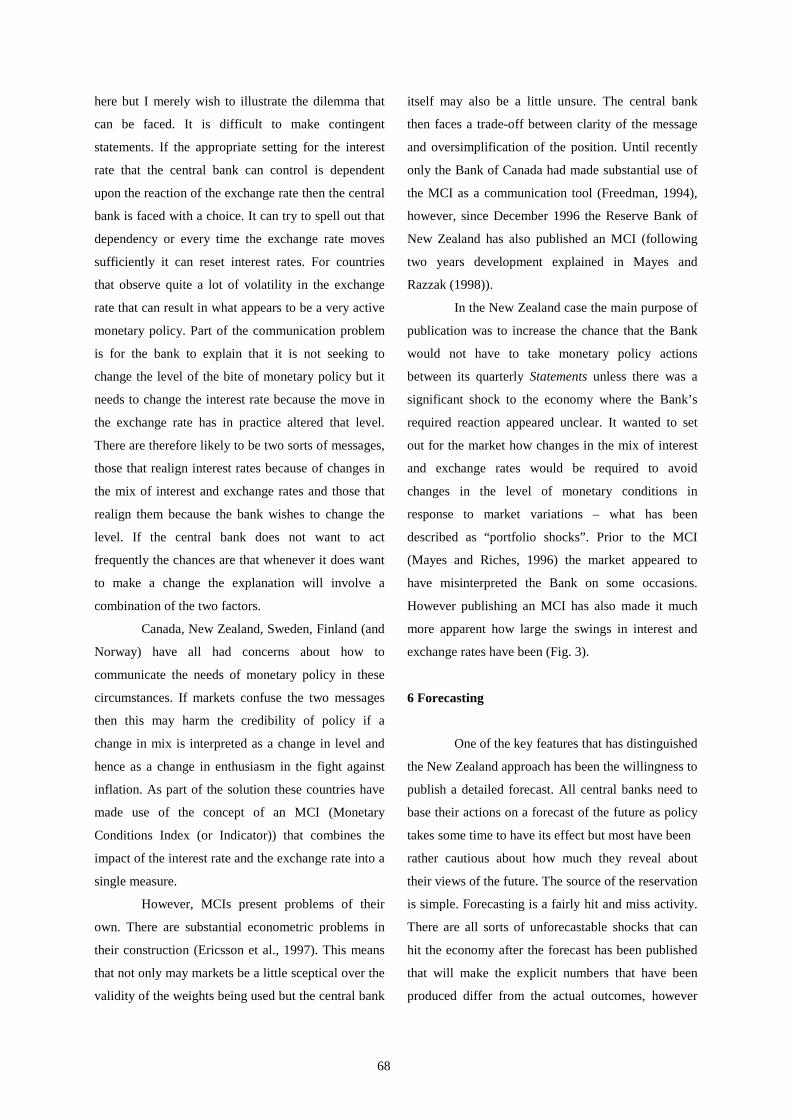
67
Table 2: What is needed
• The public announcement of a quantified definition of the final objective of price stability in order toenhance the transparency and credibility of the central bank’s strategy
• The public announcement of a specific target (or targets) against which the performance of the central bankcan be assessed on an ongoing basis by the general public, thereby enhancing accountability
• The demonstration of a clear understanding of how the country’s economy works• A believable analysis of the future for inflation and the shocks that the economy may face• A credible statement of how the central bank can affect that outcome and the policy settings it is choosing in
order to maintain price stability• An acceptable explanation of actual progress and, when necessary, of why actual outcomes were not
consistent with the target and what is being done to correct matters
Table 3: The Information Required for Transparency
• Background papers on the transmission mechanism, the models used, how policy is set and implementedand a wide range of issues relating to the price setting process will help
• A set of position papers on recent information and expected developments to inform the decision-making• Regular Monetary Policy Reports containing forecasts, assessments of risks, decisions for setting monetary
policy and explanations of past actions and performance• Explanations of decisions from policy meetings• Regular reporting and explaining in public such as at hearings of the legislature• An active communications programme domestically and internationally• The encouragement of an active professional debate on monetary policy, including the funding of research
to encourage the development of new ideas and better conclusions from the available evidence
These suggestions were intended to be
uncontroversial and do not for example contain the
suggestion that verbatim minutes of decision-making
meetings be published. It would be difficult to publish
such details as either the meetings would tend to
become largely ritualised and the real discussion
taking place elsewhere or people would be reluctant to
explore other hypotheses, playing the role of devil’s
advocate, etc.34
The Bank of England compromise of a summary
seems a very sensible way to explain that a range of
views is not only reality in central banks but a
respectable way to try to reach decisions. It also
makes it easier to change the aggregate mind of the
committee in an evolutionary manner rather than by
apparent reversal (King, 1998).
34 One of the roles of the Chief Economist in the RBNZ wasto ensure that the Monetary Policy Committee wasconfronted with the full range of plausible policy choices
5.1 Monetary Conditions Indexes and Giving Clear
Signals
Most of the inflation targeting countries are
small open economies. They are certainly all open.
This means that the exchange rate will play an
important role in the appraisal of the impact that
monetary policy will have on inflation. This adds a
significant complication to the communication of the
needs of policy (Mayes and Razzak, 1998; Mayes and
Viren, 1998). The central bank can no longer
incorporate all that it wants to say about the setting of
policy in a single indicator, such as a representative
interest rate. This may put inflation targeting at a
disadvantage compared with money or exchange rate
targeting where there is usually just a single
intermediate target. There are wide issues at stake
and not to eliminate them and just produce a singlerecommendation (Mayes and Razzak, 1998).
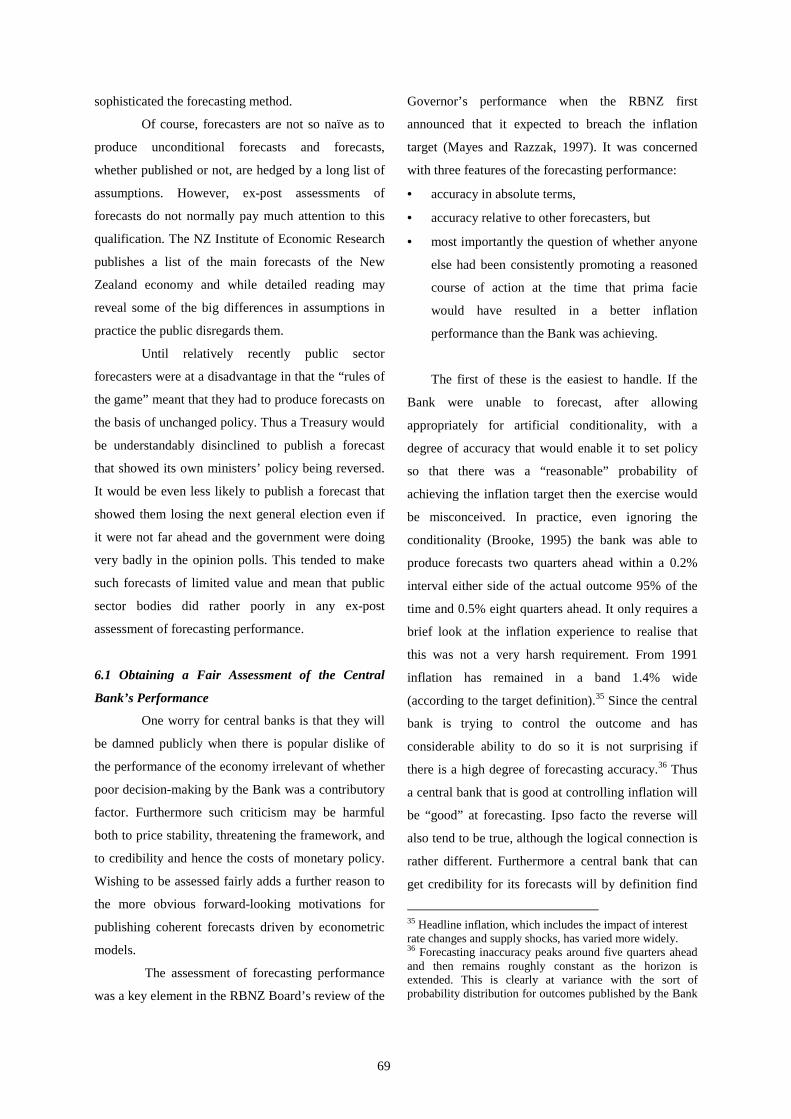
68
here but I merely wish to illustrate the dilemma that
can be faced. It is difficult to make contingent
statements. If the appropriate setting for the interest
rate that the central bank can control is dependent
upon the reaction of the exchange rate then the central
bank is faced with a choice. It can try to spell out that
dependency or every time the exchange rate moves
sufficiently it can reset interest rates. For countries
that observe quite a lot of volatility in the exchange
rate that can result in what appears to be a very active
monetary policy. Part of the communication problem
is for the bank to explain that it is not seeking to
change the level of the bite of monetary policy but it
needs to change the interest rate because the move in
the exchange rate has in practice altered that level.
There are therefore likely to be two sorts of messages,
those that realign interest rates because of changes in
the mix of interest and exchange rates and those that
realign them because the bank wishes to change the
level. If the central bank does not want to act
frequently the chances are that whenever it does want
to make a change the explanation will involve a
combination of the two factors.
Canada, New Zealand, Sweden, Finland (and
Norway) have all had concerns about how to
communicate the needs of monetary policy in these
circumstances. If markets confuse the two messages
then this may harm the credibility of policy if a
change in mix is interpreted as a change in level and
hence as a change in enthusiasm in the fight against
inflation. As part of the solution these countries have
made use of the concept of an MCI (Monetary
Conditions Index (or Indicator)) that combines the
impact of the interest rate and the exchange rate into a
single measure.
However, MCIs present problems of their
own. There are substantial econometric problems in
their construction (Ericsson et al., 1997). This means
that not only may markets be a little sceptical over the
validity of the weights being used but the central bank
itself may also be a little unsure. The central bank
then faces a trade-off between clarity of the message
and oversimplification of the position. Until recently
only the Bank of Canada had made substantial use of
the MCI as a communication tool (Freedman, 1994),
however, since December 1996 the Reserve Bank of
New Zealand has also published an MCI (following
two years development explained in Mayes and
Razzak (1998)).
In the New Zealand case the main purpose of
publication was to increase the chance that the Bank
would not have to take monetary policy actions
between its quarterly Statements unless there was a
significant shock to the economy where the Bank’s
required reaction appeared unclear. It wanted to set
out for the market how changes in the mix of interest
and exchange rates would be required to avoid
changes in the level of monetary conditions in
response to market variations – what has been
described as “portfolio shocks”. Prior to the MCI
(Mayes and Riches, 1996) the market appeared to
have misinterpreted the Bank on some occasions.
However publishing an MCI has also made it much
more apparent how large the swings in interest and
exchange rates have been (Fig. 3).
6 Forecasting
One of the key features that has distinguished
the New Zealand approach has been the willingness to
publish a detailed forecast. All central banks need to
base their actions on a forecast of the future as policy
takes some time to have its effect but most have been
rather cautious about how much they reveal about
their views of the future. The source of the reservation
is simple. Forecasting is a fairly hit and miss activity.
There are all sorts of unforecastable shocks that can
hit the economy after the forecast has been published
that will make the explicit numbers that have been
produced differ from the actual outcomes, however
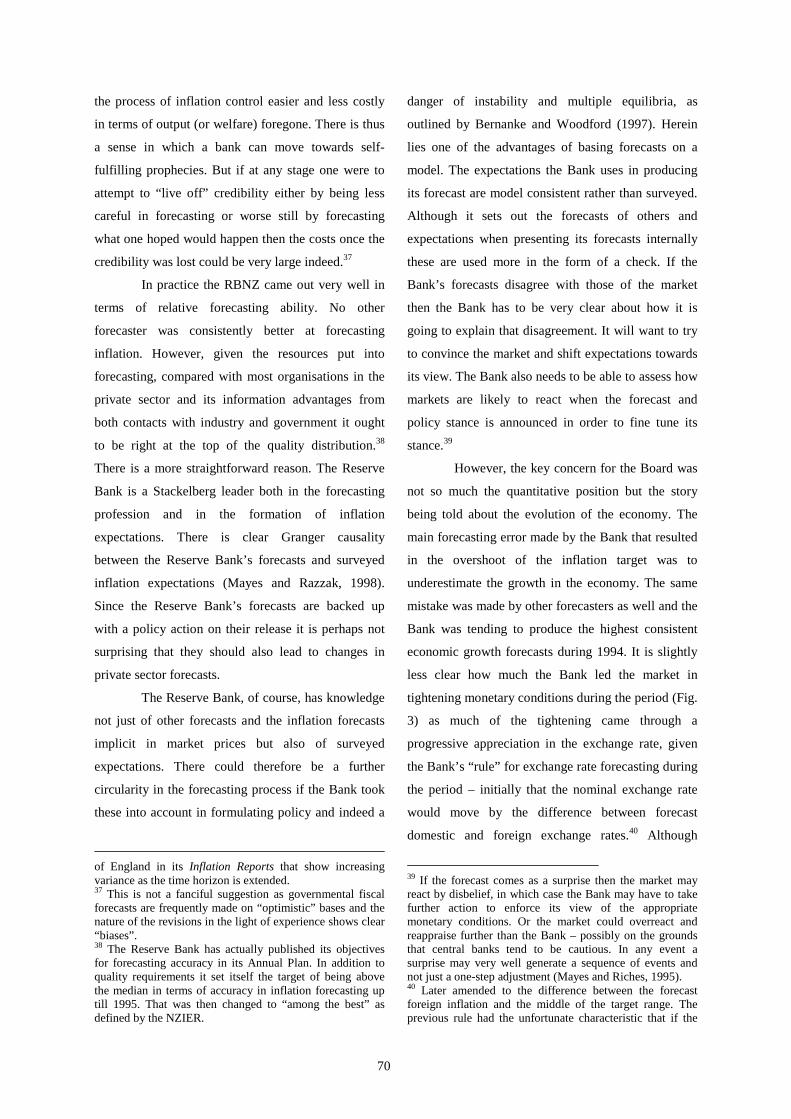
69
sophisticated the forecasting method.
Of course, forecasters are not so naïve as to
produce unconditional forecasts and forecasts,
whether published or not, are hedged by a long list of
assumptions. However, ex-post assessments of
forecasts do not normally pay much attention to this
qualification. The NZ Institute of Economic Research
publishes a list of the main forecasts of the New
Zealand economy and while detailed reading may
reveal some of the big differences in assumptions in
practice the public disregards them.
Until relatively recently public sector
forecasters were at a disadvantage in that the “rules of
the game” meant that they had to produce forecasts on
the basis of unchanged policy. Thus a Treasury would
be understandably disinclined to publish a forecast
that showed its own ministers’ policy being reversed.
It would be even less likely to publish a forecast that
showed them losing the next general election even if
it were not far ahead and the government were doing
very badly in the opinion polls. This tended to make
such forecasts of limited value and mean that public
sector bodies did rather poorly in any ex-post
assessment of forecasting performance.
6.1 Obtaining a Fair Assessment of the Central
Bank’s Performance
One worry for central banks is that they will
be damned publicly when there is popular dislike of
the performance of the economy irrelevant of whether
poor decision-making by the Bank was a contributory
factor. Furthermore such criticism may be harmful
both to price stability, threatening the framework, and
to credibility and hence the costs of monetary policy.
Wishing to be assessed fairly adds a further reason to
the more obvious forward-looking motivations for
publishing coherent forecasts driven by econometric
models.
The assessment of forecasting performance
was a key element in the RBNZ Board’s review of the
Governor’s performance when the RBNZ first
announced that it expected to breach the inflation
target (Mayes and Razzak, 1997). It was concerned
with three features of the forecasting performance:
• accuracy in absolute terms,
• accuracy relative to other forecasters, but
• most importantly the question of whether anyone
else had been consistently promoting a reasoned
course of action at the time that prima facie
would have resulted in a better inflation
performance than the Bank was achieving.
The first of these is the easiest to handle. If the
Bank were unable to forecast, after allowing
appropriately for artificial conditionality, with a
degree of accuracy that would enable it to set policy
so that there was a “reasonable” probability of
achieving the inflation target then the exercise would
be misconceived. In practice, even ignoring the
conditionality (Brooke, 1995) the bank was able to
produce forecasts two quarters ahead within a 0.2%
interval either side of the actual outcome 95% of the
time and 0.5% eight quarters ahead. It only requires a
brief look at the inflation experience to realise that
this was not a very harsh requirement. From 1991
inflation has remained in a band 1.4% wide
(according to the target definition).35 Since the central
bank is trying to control the outcome and has
considerable ability to do so it is not surprising if
there is a high degree of forecasting accuracy.36 Thus
a central bank that is good at controlling inflation will
be “good” at forecasting. Ipso facto the reverse will
also tend to be true, although the logical connection is
rather different. Furthermore a central bank that can
get credibility for its forecasts will by definition find
35 Headline inflation, which includes the impact of interestrate changes and supply shocks, has varied more widely.36 Forecasting inaccuracy peaks around five quarters aheadand then remains roughly constant as the horizon isextended. This is clearly at variance with the sort ofprobability distribution for outcomes published by the Bank
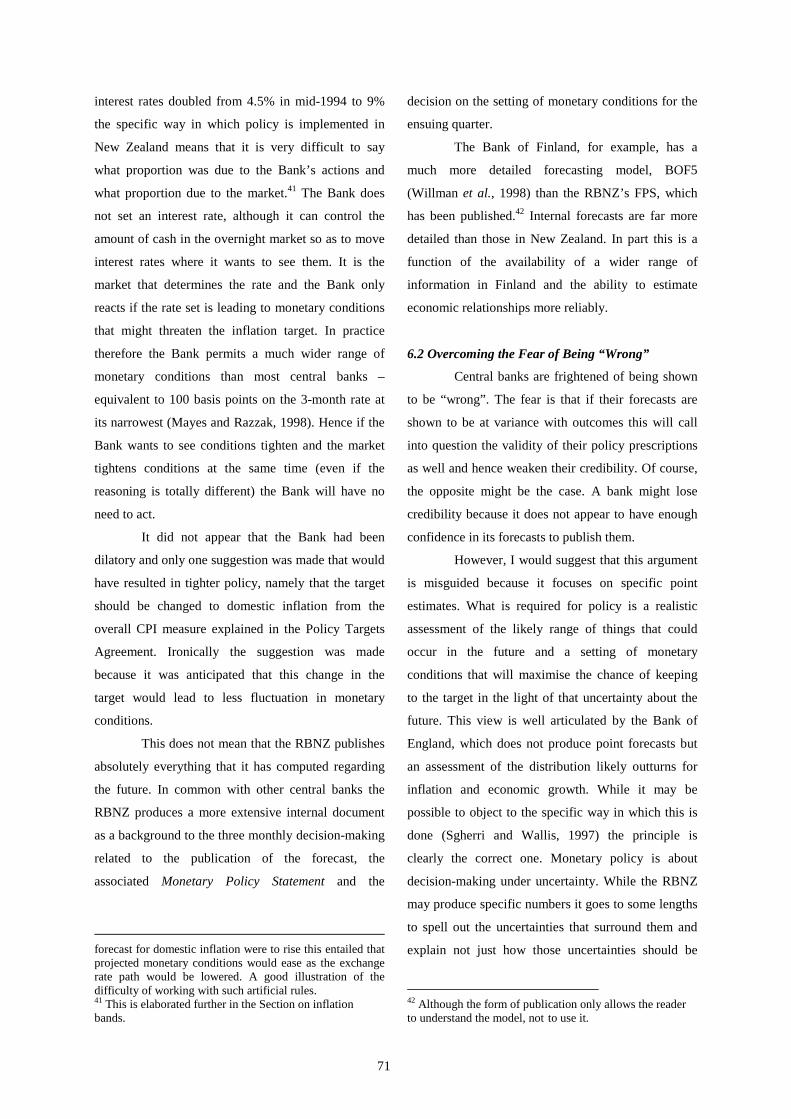
70
the process of inflation control easier and less costly
in terms of output (or welfare) foregone. There is thus
a sense in which a bank can move towards self-
fulfilling prophecies. But if at any stage one were to
attempt to “live off” credibility either by being less
careful in forecasting or worse still by forecasting
what one hoped would happen then the costs once the
credibility was lost could be very large indeed.37
In practice the RBNZ came out very well in
terms of relative forecasting ability. No other
forecaster was consistently better at forecasting
inflation. However, given the resources put into
forecasting, compared with most organisations in the
private sector and its information advantages from
both contacts with industry and government it ought
to be right at the top of the quality distribution.38
There is a more straightforward reason. The Reserve
Bank is a Stackelberg leader both in the forecasting
profession and in the formation of inflation
expectations. There is clear Granger causality
between the Reserve Bank’s forecasts and surveyed
inflation expectations (Mayes and Razzak, 1998).
Since the Reserve Bank’s forecasts are backed up
with a policy action on their release it is perhaps not
surprising that they should also lead to changes in
private sector forecasts.
The Reserve Bank, of course, has knowledge
not just of other forecasts and the inflation forecasts
implicit in market prices but also of surveyed
expectations. There could therefore be a further
circularity in the forecasting process if the Bank took
these into account in formulating policy and indeed a
of England in its Inflation Reports that show increasingvariance as the time horizon is extended.37 This is not a fanciful suggestion as governmental fiscalforecasts are frequently made on “optimistic” bases and thenature of the revisions in the light of experience shows clear“biases”.38 The Reserve Bank has actually published its objectivesfor forecasting accuracy in its Annual Plan. In addition toquality requirements it set itself the target of being abovethe median in terms of accuracy in inflation forecasting uptill 1995. That was then changed to “among the best” asdefined by the NZIER.
danger of instability and multiple equilibria, as
outlined by Bernanke and Woodford (1997). Herein
lies one of the advantages of basing forecasts on a
model. The expectations the Bank uses in producing
its forecast are model consistent rather than surveyed.
Although it sets out the forecasts of others and
expectations when presenting its forecasts internally
these are used more in the form of a check. If the
Bank’s forecasts disagree with those of the market
then the Bank has to be very clear about how it is
going to explain that disagreement. It will want to try
to convince the market and shift expectations towards
its view. The Bank also needs to be able to assess how
markets are likely to react when the forecast and
policy stance is announced in order to fine tune its
stance.39
However, the key concern for the Board was
not so much the quantitative position but the story
being told about the evolution of the economy. The
main forecasting error made by the Bank that resulted
in the overshoot of the inflation target was to
underestimate the growth in the economy. The same
mistake was made by other forecasters as well and the
Bank was tending to produce the highest consistent
economic growth forecasts during 1994. It is slightly
less clear how much the Bank led the market in
tightening monetary conditions during the period (Fig.
3) as much of the tightening came through a
progressive appreciation in the exchange rate, given
the Bank’s “rule” for exchange rate forecasting during
the period – initially that the nominal exchange rate
would move by the difference between forecast
domestic and foreign exchange rates.40 Although
39 If the forecast comes as a surprise then the market mayreact by disbelief, in which case the Bank may have to takefurther action to enforce its view of the appropriatemonetary conditions. Or the market could overreact andreappraise further than the Bank – possibly on the groundsthat central banks tend to be cautious. In any event asurprise may very well generate a sequence of events andnot just a one-step adjustment (Mayes and Riches, 1995).40 Later amended to the difference between the forecastforeign inflation and the middle of the target range. Theprevious rule had the unfortunate characteristic that if the
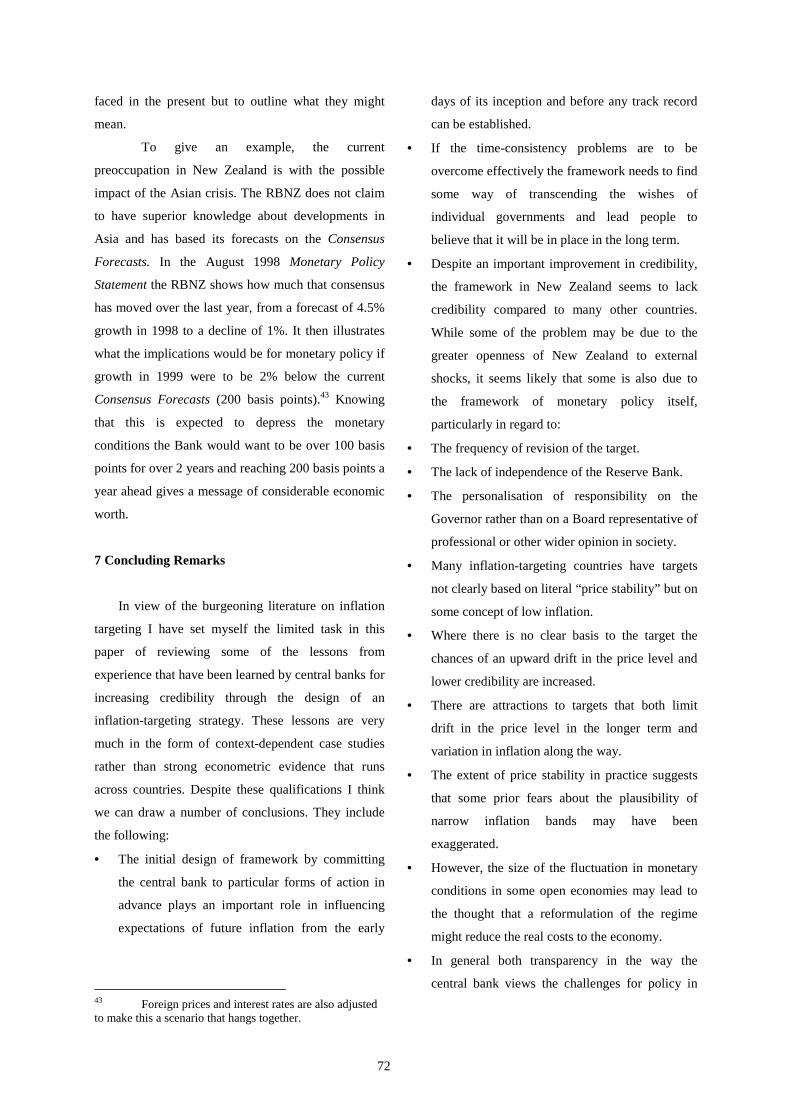
71
interest rates doubled from 4.5% in mid-1994 to 9%
the specific way in which policy is implemented in
New Zealand means that it is very difficult to say
what proportion was due to the Bank’s actions and
what proportion due to the market.41 The Bank does
not set an interest rate, although it can control the
amount of cash in the overnight market so as to move
interest rates where it wants to see them. It is the
market that determines the rate and the Bank only
reacts if the rate set is leading to monetary conditions
that might threaten the inflation target. In practice
therefore the Bank permits a much wider range of
monetary conditions than most central banks –
equivalent to 100 basis points on the 3-month rate at
its narrowest (Mayes and Razzak, 1998). Hence if the
Bank wants to see conditions tighten and the market
tightens conditions at the same time (even if the
reasoning is totally different) the Bank will have no
need to act.
It did not appear that the Bank had been
dilatory and only one suggestion was made that would
have resulted in tighter policy, namely that the target
should be changed to domestic inflation from the
overall CPI measure explained in the Policy Targets
Agreement. Ironically the suggestion was made
because it was anticipated that this change in the
target would lead to less fluctuation in monetary
conditions.
This does not mean that the RBNZ publishes
absolutely everything that it has computed regarding
the future. In common with other central banks the
RBNZ produces a more extensive internal document
as a background to the three monthly decision-making
related to the publication of the forecast, the
associated Monetary Policy Statement and the
forecast for domestic inflation were to rise this entailed thatprojected monetary conditions would ease as the exchangerate path would be lowered. A good illustration of thedifficulty of working with such artificial rules.41 This is elaborated further in the Section on inflationbands.
decision on the setting of monetary conditions for the
ensuing quarter.
The Bank of Finland, for example, has a
much more detailed forecasting model, BOF5
(Willman et al., 1998) than the RBNZ’s FPS, which
has been published.42 Internal forecasts are far more
detailed than those in New Zealand. In part this is a
function of the availability of a wider range of
information in Finland and the ability to estimate
economic relationships more reliably.
6.2 Overcoming the Fear of Being “Wrong”
Central banks are frightened of being shown
to be “wrong”. The fear is that if their forecasts are
shown to be at variance with outcomes this will call
into question the validity of their policy prescriptions
as well and hence weaken their credibility. Of course,
the opposite might be the case. A bank might lose
credibility because it does not appear to have enough
confidence in its forecasts to publish them.
However, I would suggest that this argument
is misguided because it focuses on specific point
estimates. What is required for policy is a realistic
assessment of the likely range of things that could
occur in the future and a setting of monetary
conditions that will maximise the chance of keeping
to the target in the light of that uncertainty about the
future. This view is well articulated by the Bank of
England, which does not produce point forecasts but
an assessment of the distribution likely outturns for
inflation and economic growth. While it may be
possible to object to the specific way in which this is
done (Sgherri and Wallis, 1997) the principle is
clearly the correct one. Monetary policy is about
decision-making under uncertainty. While the RBNZ
may produce specific numbers it goes to some lengths
to spell out the uncertainties that surround them and
explain not just how those uncertainties should be
42 Although the form of publication only allows the readerto understand the model, not to use it.
72
faced in the present but to outline what they might
mean.
To give an example, the current
preoccupation in New Zealand is with the possible
impact of the Asian crisis. The RBNZ does not claim
to have superior knowledge about developments in
Asia and has based its forecasts on the Consensus
Forecasts. In the August 1998 Monetary Policy
Statement the RBNZ shows how much that consensus
has moved over the last year, from a forecast of 4.5%
growth in 1998 to a decline of 1%. It then illustrates
what the implications would be for monetary policy if
growth in 1999 were to be 2% below the current
Consensus Forecasts (200 basis points).43 Knowing
that this is expected to depress the monetary
conditions the Bank would want to be over 100 basis
points for over 2 years and reaching 200 basis points a
year ahead gives a message of considerable economic
worth.
7 Concluding Remarks
In view of the burgeoning literature on inflation
targeting I have set myself the limited task in this
paper of reviewing some of the lessons from
experience that have been learned by central banks for
increasing credibility through the design of an
inflation-targeting strategy. These lessons are very
much in the form of context-dependent case studies
rather than strong econometric evidence that runs
across countries. Despite these qualifications I think
we can draw a number of conclusions. They include
the following:
• The initial design of framework by committing
the central bank to particular forms of action in
advance plays an important role in influencing
expectations of future inflation from the early
43 Foreign prices and interest rates are also adjustedto make this a scenario that hangs together.
days of its inception and before any track record
can be established.
• If the time-consistency problems are to be
overcome effectively the framework needs to find
some way of transcending the wishes of
individual governments and lead people to
believe that it will be in place in the long term.
• Despite an important improvement in credibility,
the framework in New Zealand seems to lack
credibility compared to many other countries.
While some of the problem may be due to the
greater openness of New Zealand to external
shocks, it seems likely that some is also due to
the framework of monetary policy itself,
particularly in regard to:
• The frequency of revision of the target.
• The lack of independence of the Reserve Bank.
• The personalisation of responsibility on the
Governor rather than on a Board representative of
professional or other wider opinion in society.
• Many inflation-targeting countries have targets
not clearly based on literal “price stability” but on
some concept of low inflation.
• Where there is no clear basis to the target the
chances of an upward drift in the price level and
lower credibility are increased.
• There are attractions to targets that both limit
drift in the price level in the longer term and
variation in inflation along the way.
• The extent of price stability in practice suggests
that some prior fears about the plausibility of
narrow inflation bands may have been
exaggerated.
• However, the size of the fluctuation in monetary
conditions in some open economies may lead to
the thought that a reformulation of the regime
might reduce the real costs to the economy.
• In general both transparency in the way the
central bank views the challenges for policy in
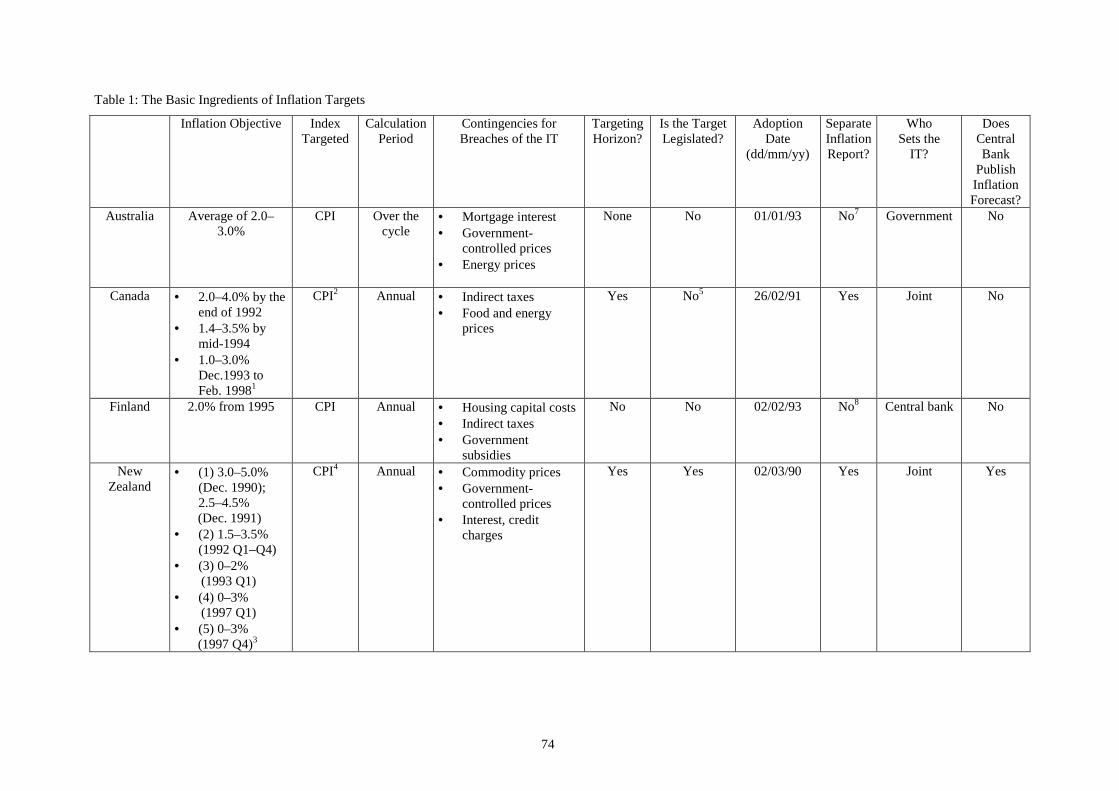
73
the future and clarity in describing the required
policy will tend to increase credibility.
• Central banks face a difficulty in avoiding
confusion in the public mind between optimal
policy in an uncertain world and uncertainty
within the bank that may lead to increased
inflation.
• Many existing “Price Stability Reports” offer
scope for providing less historical statistical
material and more clarification of the view of the
future, particularly the assessment of “risks”.
• Monetary Conditions Indicators offer some scope
for increasing understanding of the joint role of
the exchange rate and interest rates in monetary
policy in open economies.
• Publishing forecasts increases the chance that the
Bank’s record will be judged on professional
criteria and reduce the chance that the credibility
of the framework for price stability will be
damaged by weak economic performance
stemming from other causes.
• Openness by the central bank increases the
chance that the debate about policy will be a
constructive process trying to improve decisions
rather than a combative exchange with those who
feel excluded or ignored.
• Explaining uncertainty allows decisions to evolve
in a credible manner over time rather than
incurring accusations of inconsistency.
Publishing the range of views over the future and
an explanation of the debate in Monetary Policy
Committee meetings can help achieve this.
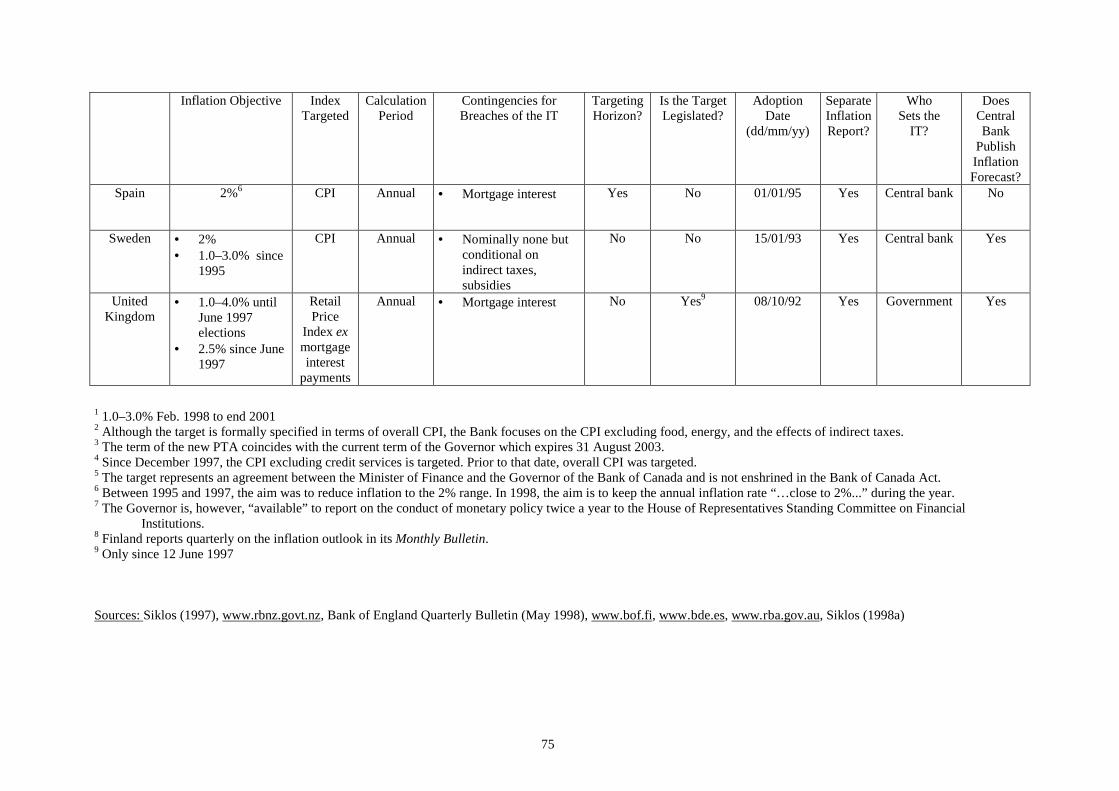
74
Table 1: The Basic Ingredients of Inflation Targets
Inflation Objective IndexTargeted
CalculationPeriod
Contingencies forBreaches of the IT
TargetingHorizon?
Is the TargetLegislated?
AdoptionDate
(dd/mm/yy)
SeparateInflationReport?
WhoSets the
IT?
DoesCentralBank
PublishInflationForecast?
Australia Average of 2.0–3.0%
CPI Over thecycle
• Mortgage interest• Government-
controlled prices• Energy prices
None No 01/01/93 No7 Government No
Canada • 2.0–4.0% by theend of 1992
• 1.4–3.5% bymid-1994
• 1.0–3.0%Dec.1993 toFeb. 19981
CPI2 Annual • Indirect taxes• Food and energy
prices
Yes No5 26/02/91 Yes Joint No
Finland 2.0% from 1995 CPI Annual • Housing capital costs• Indirect taxes• Government
subsidies
No No 02/02/93 No8 Central bank No
NewZealand
• (1) 3.0–5.0%(Dec. 1990);2.5–4.5%
(Dec. 1991)• (2) 1.5–3.5%
(1992 Q1–Q4)• (3) 0–2% (1993 Q1)• (4) 0–3% (1997 Q1)• (5) 0–3% (1997 Q4)3
CPI4 Annual • Commodity prices• Government-
controlled prices• Interest, credit
charges
Yes Yes 02/03/90 Yes Joint Yes
75
Inflation Objective IndexTargeted
CalculationPeriod
Contingencies forBreaches of the IT
TargetingHorizon?
Is the TargetLegislated?
AdoptionDate
(dd/mm/yy)
SeparateInflationReport?
WhoSets the
IT?
DoesCentralBank
PublishInflationForecast?
Spain 2%6 CPI Annual • Mortgage interest Yes No 01/01/95 Yes Central bank No
Sweden • 2%• 1.0–3.0% since
1995
CPI Annual • Nominally none butconditional onindirect taxes,subsidies
No No 15/01/93 Yes Central bank Yes
UnitedKingdom
• 1.0–4.0% untilJune 1997elections
• 2.5% since June1997
RetailPrice
Index exmortgageinterest
payments
Annual • Mortgage interest No Yes9 08/10/92 Yes Government Yes
1 1.0–3.0% Feb. 1998 to end 20012 Although the target is formally specified in terms of overall CPI, the Bank focuses on the CPI excluding food, energy, and the effects of indirect taxes.3 The term of the new PTA coincides with the current term of the Governor which expires 31 August 2003.4 Since December 1997, the CPI excluding credit services is targeted. Prior to that date, overall CPI was targeted.5 The target represents an agreement between the Minister of Finance and the Governor of the Bank of Canada and is not enshrined in the Bank of Canada Act.6 Between 1995 and 1997, the aim was to reduce inflation to the 2% range. In 1998, the aim is to keep the annual inflation rate “…close to 2%...” during the year.7 The Governor is, however, “available” to report on the conduct of monetary policy twice a year to the House of Representatives Standing Committee on Financial
Institutions.8 Finland reports quarterly on the inflation outlook in its Monthly Bulletin.9 Only since 12 June 1997
Sources: Siklos (1997), www.rbnz.govt.nz, Bank of England Quarterly Bulletin (May 1998), www.bof.fi, www.bde.es, www.rba.gov.au, Siklos (1998a)
76
References
Amano, R, Coletti, D and Macklem, T (1998)
“Monetary Rules when Economic Behaviour
Changes”, conference on Central Bank
Inflation Targeting, Stanford University,
March.
Archer, D (1995) “Some Reflections on Inflation
Targets”, pp.246-64 in Haldane (1995).
Bank of Canada (1998) Price Stability, Inflation
Targets and Monetary Policy, Ottawa,
February.
Bernanke, B S and Mishkin, F S (1992) “Central
Bank Behaviour and the Strategy of
Monetary Policy: Observations from Six
Industrialised Countries” in O Blanchard and
S Fischer, eds. NBER Macroeconomics
Annual, pp. 183-238, Cambridge MA: MIT
Press.
Bernanke, B S and Woodford, M (1997) “Inflation
Forecasts and Monetary Policy”, NBER
Working Paper 6157, September.
Black, R, Cassino, V, Drew, A, Hansen, E, Hunt, B
Rose, D and Scott, A (1997) “The
Forecasting and Policy System: the core
model”, Reserve Bank of New Zealand
Research Paper 43.
Boskin, M (1996) “Towards a More Accurate
Measure of the Cost of Living” Final report
by the Advisory Commission to Study the
Consumer Price Index to the Senate Finance
Committee, Washington DC.
Brash, D (1996) Introductory remarks on the release
of the December Monetary Policy Statement,
Reserve Bank homepage (rbnz.govt.nz).
Brash, D (1998) “New Zealand’s Balance of
Payments Deficit: Does it Matter?”, Reserve
Bank Of New Zealand Bulletin, vol. 61(1),
March, pp.5-14
Briault, C, Haldane, A and King, M (1996)
“Independence and Accountability: Theory
and Evidence”, Bank of England Quarterly
Bulletin.
Britton, A J C (1998) Report on New Zealand Fiscal
Arrangements, National Institute of
Economic and Social Research , London.
Brooke, A-M (1995) “The Reserve Bank’s
Forecasting Record”, RBNZ Discussion
Paper
Cassino, V (1995) “The Distribution of Price and
Wage Changes in New Zealand”, RBNZ
Discussion Paper, G95/6.
Castren, O (1998) “Central Bank Independence and
Accountability – How Does the European
Central Bank Fit in the Picture?”, Bank of
Finland Bulletin, vol. 72(8), August, pp. 12-
5.
Clark, P, Laxton, D and Rose, D (1995) “Capacity
Constraints, Inflation and the Transmission
Mechanism: Forward-Looking vs. Myopic
Policy Rules”, IMF Working Paper 95/75.
Coote, M (1996) “Price Stability Requires a Tight, not
Loose, Inflation Target”, New Zealand
Business Review, p.70.
Crawford, A, Fillion, J-F and Lafleche, T (1998) “Is
the CPI a Suitable Measure for Defining
Price Stability?” pp. 39-73 in Bank of
Canada (1998)
Debelle, G (1996) “The Ends of Three Small
Inflations: Australia, New Zealand and
Canada”, Canadian Public Policy, vol. 22
(March), pp. 56-78.
Edey, M (1998) “The Debate on Alternatives for
Monetary Policy in Australia”, pp. 42-67 in
Lowe (1998).
Ericsson, N, Jansen, E S, Kerbeshian, N R and
Nymoen, R (1997) “Understanding a
Monetary Conditions Index”, mimeo, Federal
Reserve Board.
77
Freedman, C (1994) “The Use of Indicators and of the
Monetary Conditions Index in Canada”, in T
Balino and C Cotarelli, eds, Frameworks for
Monetary Stability: Policy Issues and
Country Experiences, Washington DC: IMF.
Guthrie, G and Wright, J (1997) “Market-
implemented Monetary Policy with Open
Mouth Operations”, mimeo, University of
Canterbury, July.
Haldane, A (1995) Targeting Inflation, London: Bank
of England.
Haldane, A (1998) “Designing Inflation Targets”, pp.
74-112 in Lowe (1998).
Hutchison, M and Walsh, C (1998) “The Output-
Inflation Trade-off and Central Bank
Independence”, Economic Journal, vol. 108
(448) pp. 703-25.
Kydland, F and Prescott, E (1977) “Rules Rather than
Discretion: The Inconsistency of Optimal
Plans”, Journal of Political Economy, vol.
85, pp. 473-92.
Lowe, P (1997) Monetary Policy and Inflation
Targeting, Sydney: Reserve Bank of
Australia.
Mattila, V-M (1998) “Simulating the Effects of Peso
Problems” Bank of Finland Discussion
Paper, forthcoming.
Mayes, D G (1997) “Evolving Voluntary Rules for
the Operation of the European Central
Bank”, Bank of Finland Discussion Paper
2/98, Current Politics and Economics of
Europe, forthcoming.
Mayes, D G and Castren, O (1998) “Accountability,
Independence, Transparency and Credible
Monetary Policy”, mimeo, Bank of Finland,
February.
Mayes, D G and Chapple, B (1995) “Defining an
Inflation Target”, pp.226-45 in Haldane
(1995)
Mayes, D G and Razzak, W (1997) “Transparency
and Accountability: Empirical Models and
Policy Making at the Reserve Bank of New
Zealand”, Tinbergen Institute, Amsterdam,
May.
Mayes, D G and Razzak, W (1998) “Transparency
and Accountability: Empirical Models and
Policy Making at the Reserve Bank of New
Zealand”, Economic Modelling, forthcoming.
Mayes, D G and Riches, B (1996) “The Effectiveness
of Monetary Policy in New Zealand”,
Reserve Bank of New Zealand Bulletin, vol.
59(1), pp.5-20
Mayes, D G and Viren, M (1998) “An MCI for the
Euro-area”, mimeo, Bank of Finland.
Mishkin, F (1998) “Should Explicit Inflation Targets
be Set in the United States”, conference on
Central Bank Inflation Targeting, Stanford
University, March.
Mishkin, F and Posen, A S (1997) “Inflation
Targeting: Lessons from Four Countries”,
Economic Policy Review, Federal Reserve
Bank of New York
Nadal De Simone, F, Dennis, R and Redward, P
(1996) “A Monetary Conditions Index for
New Zealand”, RBNZ Discussion Paper
G96/2.
Nicholl, P (1995) mimeo RBNZ
Razzak, W (1995) “The inflation-output Trade-off: Is
the Phillips Curve Symmetric? Evidence
from New Zealand”, RBNZ Discussion
Paper, G95/7.
Rogoff, K (1985) “The Optimal Degree of
Commitment to an Intermediate Monetary
Target” Quarterly Journal of Economics,
vol. 100, pp.169-90.
Rudebusch, G and Walsh, C (1998a) “Central Bank
Inflation Targeting” Federal Reserve Bank of
San Francisco Economic Letter, no 98-17,
May 22.
78
Rudebusch, G and Walsh, C (1998a) “US Inflation
Targeting: pro and con” Federal Reserve
Bank of San Francisco Economic Letter, no
98-18, May 29.
Saikkonen, P (1998) ‘mimeo, Bank of Finland
Sgherri, S and Wallis, K F (1997) “Inflation Target
Bands and the Bank of England’s Fairly
Substantial Lump of Inflation Uncertainty”,
ESRC Macroeconomic Modelling Bureau
Discussion Paper 49, University of Warwick,
October.
Siklos, P L (1998a) “Inflation Target Design,
Performance and Central Bank Behaviour”,
Wilfred Laurier University, July.
Svensson, L E O (1998a) “Open Economy Inflation
Targeting”, Working Paper Institute for
International Economic Studies, University
of Stockholm
Svensson, L E O (1998b) “Inflation Targeting as a
Monetary Policy Rule” (also response to
comments), Sveriges Riksbank conference
on Monetary Policy Rules, June.
Turner, D (1997) OECD
Vilmunen, J (1998) “Macroeconomic Effects of
Looming Policy Shifts: non-falsified
expectations and peso problems.”, Bank of
Finland Discussion Paper 13/98.
Walsh, C (1995) “Is New Zealand’s Reserve Bank
Act of 1989 an Optimal Central Bank
Contract?”, Journal of Money, Credit and
Banking, vol. 27, no.5 (November), pp.
1179-91.
Wilkinson, J (1995) Reserve Bank of Australia
Willman, A, Kortelainen, M, Männistö, H-L and
Tujula, M (1998) “The BOF5
Macroeconomic Model of Finland, Structure
and Equations”, Bank of Finland Discussion
Paper 10/98.
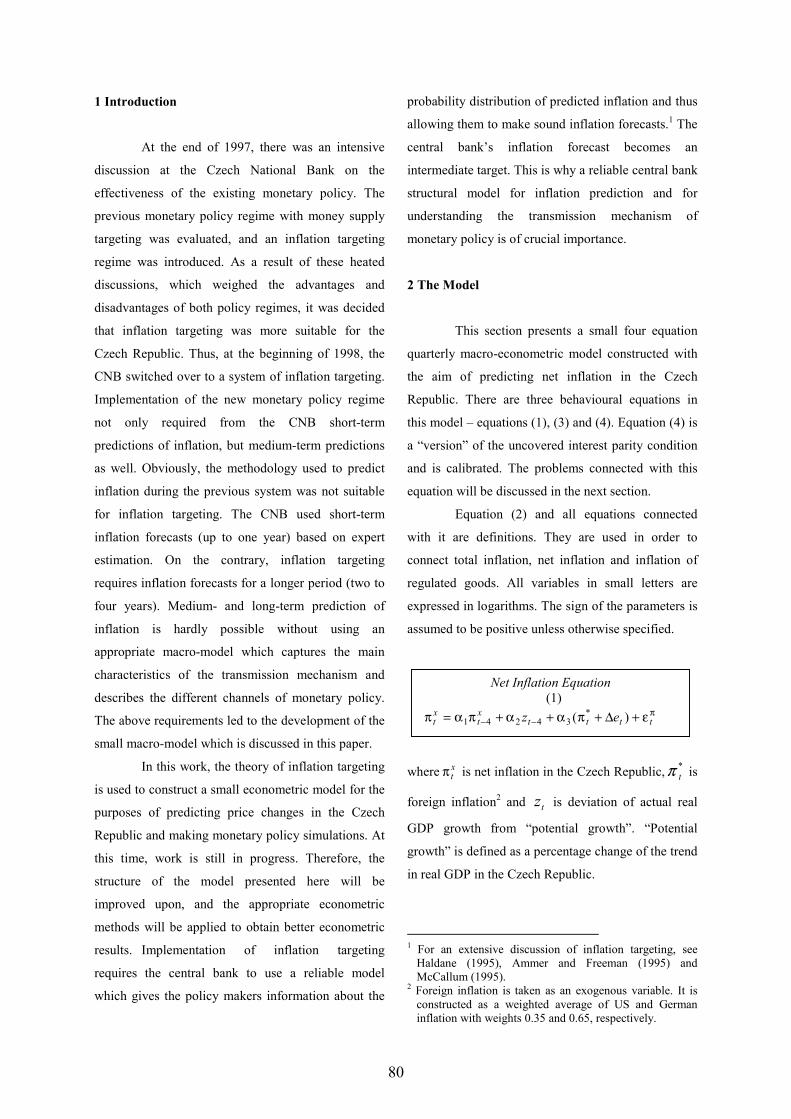
79
Inflation Forecasting Using a Small Macro-Economic ModelPreliminary Version: May 1998
Emil Stavrev*
Abstract
This paper presents a small macro-econometric model which is further used to
predict inflation and produce different monetary policy simulations concerning
inflation targeting in the Czech Republic. The problems connected with inflation
targeting for transition economies are discussed as well as the different
modelling approaches suitable for policy simulation and inflation forecasts.
1 Introduction
2 The Model
3 Estimation and Simulation Results
4 Problems
5 Other Approaches and Further Work
6 Conclusions
The views expressed in this paper are those of the author and not necessarily those of the Czech National Bank.
* Czech National Bank, Division of Economic Modelling, Na Příkopě 28, 115 03, Prague 1
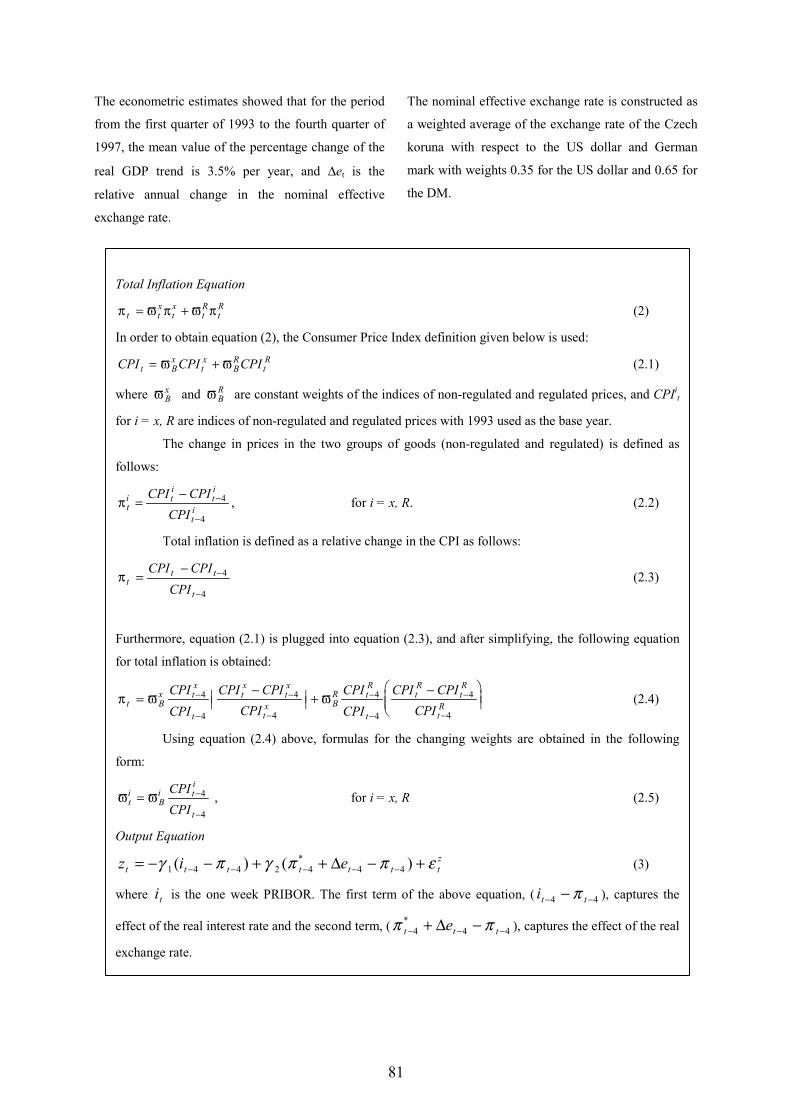
80
1 Introduction
At the end of 1997, there was an intensive
discussion at the Czech National Bank on the
effectiveness of the existing monetary policy. The
previous monetary policy regime with money supply
targeting was evaluated, and an inflation targeting
regime was introduced. As a result of these heated
discussions, which weighed the advantages and
disadvantages of both policy regimes, it was decided
that inflation targeting was more suitable for the
Czech Republic. Thus, at the beginning of 1998, the
CNB switched over to a system of inflation targeting.
Implementation of the new monetary policy regime
not only required from the CNB short-term
predictions of inflation, but medium-term predictions
as well. Obviously, the methodology used to predict
inflation during the previous system was not suitable
for inflation targeting. The CNB used short-term
inflation forecasts (up to one year) based on expert
estimation. On the contrary, inflation targeting
requires inflation forecasts for a longer period (two to
four years). Medium- and long-term prediction of
inflation is hardly possible without using an
appropriate macro-model which captures the main
characteristics of the transmission mechanism and
describes the different channels of monetary policy.
The above requirements led to the development of the
small macro-model which is discussed in this paper.
In this work, the theory of inflation targeting
is used to construct a small econometric model for the
purposes of predicting price changes in the Czech
Republic and making monetary policy simulations. At
this time, work is still in progress. Therefore, the
structure of the model presented here will be
improved upon, and the appropriate econometric
methods will be applied to obtain better econometric
results. Implementation of inflation targeting
requires the central bank to use a reliable model
which gives the policy makers information about the
probability distribution of predicted inflation and thus
allowing them to make sound inflation forecasts.1 The
central bank’s inflation forecast becomes an
intermediate target. This is why a reliable central bank
structural model for inflation prediction and for
understanding the transmission mechanism of
monetary policy is of crucial importance.
2 The Model
This section presents a small four equation
quarterly macro-econometric model constructed with
the aim of predicting net inflation in the Czech
Republic. There are three behavioural equations in
this model – equations (1), (3) and (4). Equation (4) is
a “version” of the uncovered interest parity condition
and is calibrated. The problems connected with this
equation will be discussed in the next section.
Equation (2) and all equations connected
with it are definitions. They are used in order to
connect total inflation, net inflation and inflation of
regulated goods. All variables in small letters are
expressed in logarithms. The sign of the parameters is
assumed to be positive unless otherwise specified.
where π tx is net inflation in the Czech Republic,π t
* is
foreign inflation2 and zt is deviation of actual real
GDP growth from “potential growth”. “Potential
growth” is defined as a percentage change of the trend
in real GDP in the Czech Republic.
1 For an extensive discussion of inflation targeting, see
Haldane (1995), Ammer and Freeman (1995) andMcCallum (1995).
2 Foreign inflation is taken as an exogenous variable. It isconstructed as a weighted average of US and Germaninflation with weights 0.35 and 0.65, respectively.
Net Inflation Equation (1)
π α π α α π ε πtx
tx
t t t tz e= + + + +− −1 4 2 4 3 ( )* ∆
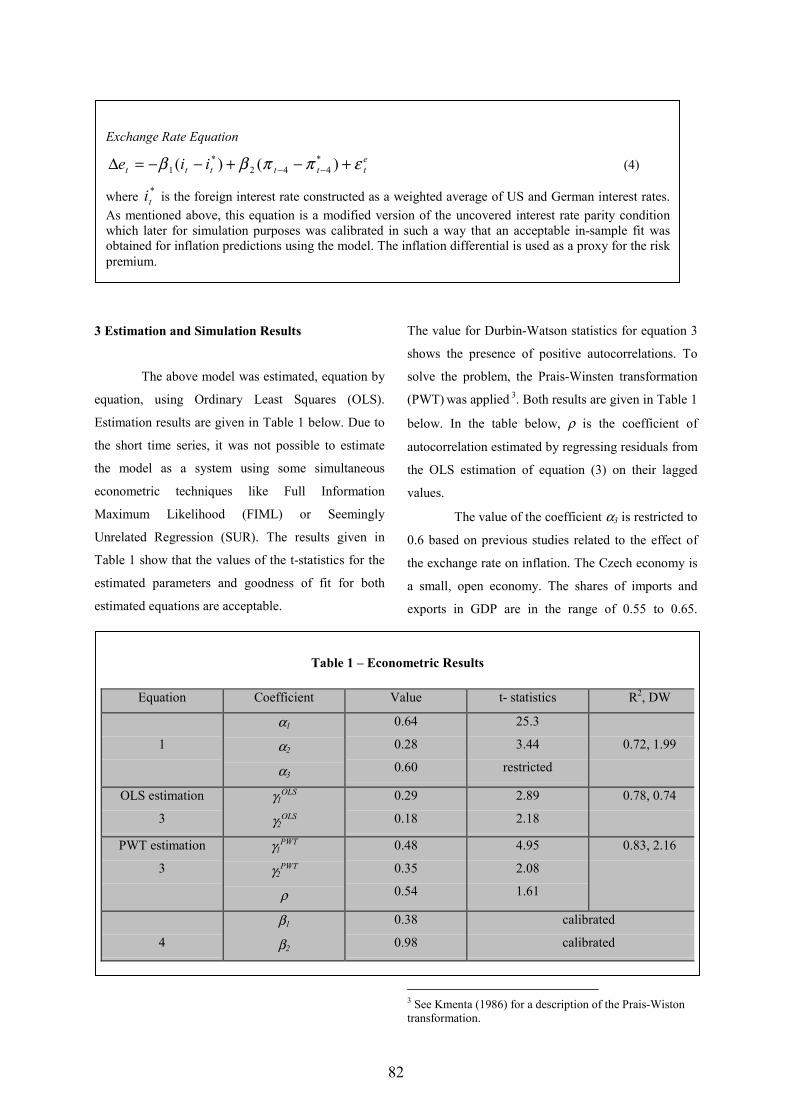
81
The econometric estimates showed that for the period
from the first quarter of 1993 to the fourth quarter of
1997, the mean value of the percentage change of the
real GDP trend is 3.5% per year, and ∆et is the
relative annual change in the nominal effective
exchange rate.
The nominal effective exchange rate is constructed as
a weighted average of the exchange rate of the Czech
koruna with respect to the US dollar and German
mark with weights 0.35 for the US dollar and 0.65 for
the DM.
Total Inflation Equation
π ϖ π ϖ πt tx
tx
tR
tR= + (2)
In order to obtain equation (2), the Consumer Price Index definition given below is used:
CPI CPI CPIt Bx
tx
BR
tR= +ϖ ϖ (2.1)
where ϖBx and ϖ B
R are constant weights of the indices of non-regulated and regulated prices, and CPIit
for i = x, R are indices of non-regulated and regulated prices with 1993 used as the base year.
The change in prices in the two groups of goods (non-regulated and regulated) is defined as
follows:
π ti t
iti
ti
CPI CPICPI
=− −
−
4
4, for i = x, R. (2.2)
Total inflation is defined as a relative change in the CPI as follows:
π tt t
t
CPI CPICPI
=− −
−
4
4
(2.3)
Furthermore, equation (2.1) is plugged into equation (2.3), and after simplifying, the following equation
for total inflation is obtained:
π ϖ ϖt Bx t
x
t
tx
tx
tx B
R tR
t
tR
tR
tR
CPICPI
CPI CPICPI
CPICPI
CPI CPICPI
=−
�� �� +−�
���
���
−
−
−
−
−
−
−
−
4
4
4
4
4
4
4
4
(2.4)
Using equation (2.4) above, formulas for the changing weights are obtained in the following
form:
ϖ ϖti
Bi t
i
t
CPICPI
= −
−
4
4
, for i = x, R (2.5)
Output Equation
z i et t t t t t tz= − − + + − +− − − − −γ π γ π π ε1 4 4 2 4 4 4( ) ( )* ∆ (3)
where it is the one week PRIBOR. The first term of the above equation, ( it t− −−4 4π ), captures the
effect of the real interest rate and the second term, (π πt t te− − −+ −4 4 4* ∆ ), captures the effect of the real
exchange rate.
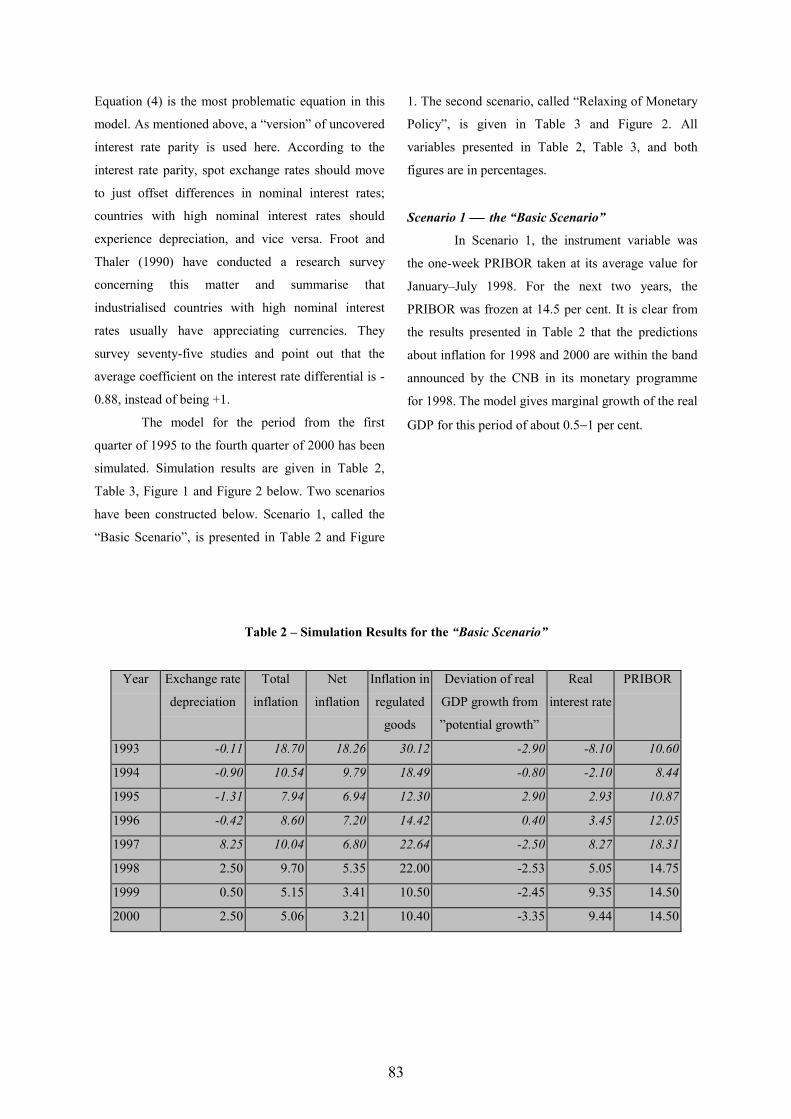
82
3 Estimation and Simulation Results
The above model was estimated, equation by
equation, using Ordinary Least Squares (OLS).
Estimation results are given in Table 1 below. Due to
the short time series, it was not possible to estimate
the model as a system using some simultaneous
econometric techniques like Full Information
Maximum Likelihood (FIML) or Seemingly
Unrelated Regression (SUR). The results given in
Table 1 show that the values of the t-statistics for the
estimated parameters and goodness of fit for both
estimated equations are acceptable.
The value for Durbin-Watson statistics for equation 3
shows the presence of positive autocorrelations. To
solve the problem, the Prais-Winsten transformation
(PWT) was applied 3. Both results are given in Table 1
below. In the table below, ρ is the coefficient of
autocorrelation estimated by regressing residuals from
the OLS estimation of equation (3) on their lagged
values.
The value of the coefficient α3 is restricted to
0.6 based on previous studies related to the effect of
the exchange rate on inflation. The Czech economy is
a small, open economy. The shares of imports and
exports in GDP are in the range of 0.55 to 0.65.
3 See Kmenta (1986) for a description of the Prais-Wistontransformation.
Exchange Rate Equation
∆e i it t t t t te= − − + − +− −β β π π ε1 2 4 4( ) ( )* * (4)
where it* is the foreign interest rate constructed as a weighted average of US and German interest rates.
As mentioned above, this equation is a modified version of the uncovered interest rate parity conditionwhich later for simulation purposes was calibrated in such a way that an acceptable in-sample fit wasobtained for inflation predictions using the model. The inflation differential is used as a proxy for the riskpremium.
Table 1 – Econometric Results
Equation Coefficient Value t- statistics R2, DW
1
α1
α2
α3
0.64
0.28
0.60
25.3
3.44
restricted
0.72, 1.99
OLS estimation
3
γ1OLS
γ2OLS
0.29
0.18
2.89
2.18
0.78, 0.74
PWT estimation
3
γ1PWT
γ2PWT
ρ
0.48
0.35
0.54
4.95
2.08
1.61
0.83, 2.16
4
β1
β2
0.38
0.98
calibrated
calibrated
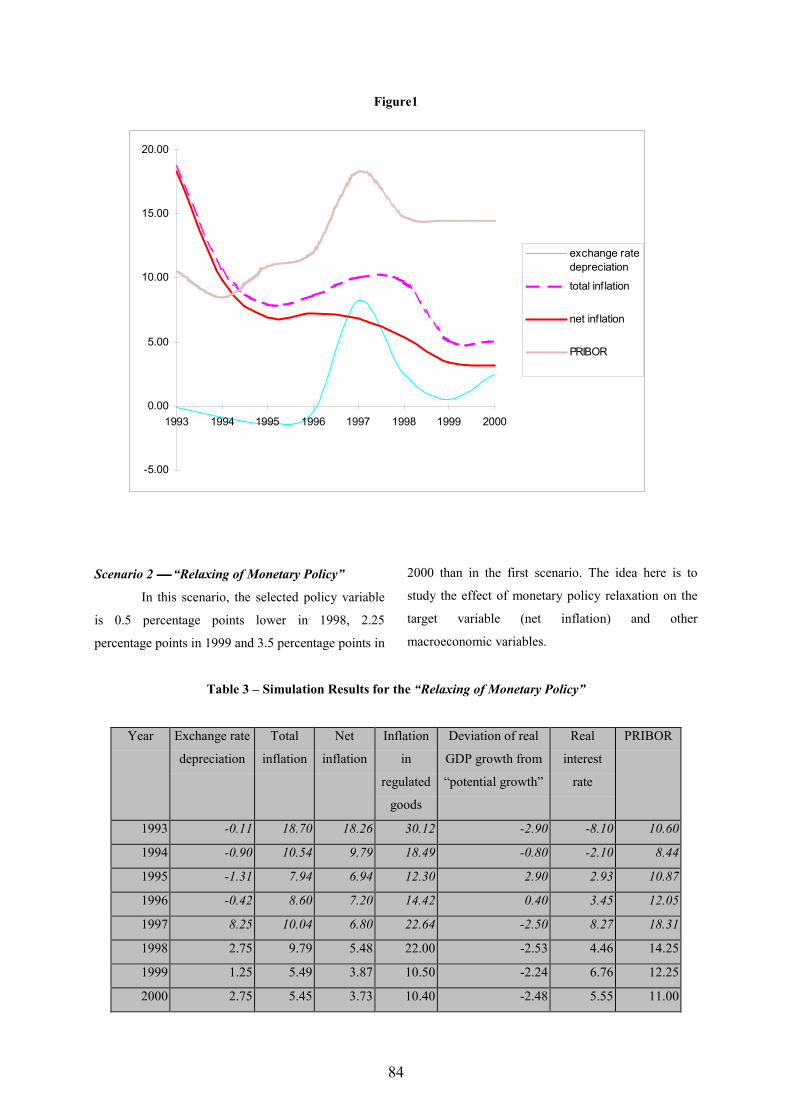
83
Equation (4) is the most problematic equation in this
model. As mentioned above, a “version” of uncovered
interest rate parity is used here. According to the
interest rate parity, spot exchange rates should move
to just offset differences in nominal interest rates;
countries with high nominal interest rates should
experience depreciation, and vice versa. Froot and
Thaler (1990) have conducted a research survey
concerning this matter and summarise that
industrialised countries with high nominal interest
rates usually have appreciating currencies. They
survey seventy-five studies and point out that the
average coefficient on the interest rate differential is -
0.88, instead of being +1.
The model for the period from the first
quarter of 1995 to the fourth quarter of 2000 has been
simulated. Simulation results are given in Table 2,
Table 3, Figure 1 and Figure 2 below. Two scenarios
have been constructed below. Scenario 1, called the
“Basic Scenario”, is presented in Table 2 and Figure
1. The second scenario, called “Relaxing of Monetary
Policy”, is given in Table 3 and Figure 2. All
variables presented in Table 2, Table 3, and both
figures are in percentages.
Scenario 1 the “Basic Scenario”
In Scenario 1, the instrument variable was
the one-week PRIBOR taken at its average value for
January–July 1998. For the next two years, the
PRIBOR was frozen at 14.5 per cent. It is clear from
the results presented in Table 2 that the predictions
about inflation for 1998 and 2000 are within the band
announced by the CNB in its monetary programme
for 1998. The model gives marginal growth of the real
GDP for this period of about 0.5−1 per cent.
Table 2 – Simulation Results for the “Basic Scenario”
Year Exchange rate
depreciation
Total
inflation
Net
inflation
Inflation in
regulated
goods
Deviation of real
GDP growth from
”potential growth”
Real
interest rate
PRIBOR
1993 -0.11 18.70 18.26 30.12 -2.90 -8.10 10.60
1994 -0.90 10.54 9.79 18.49 -0.80 -2.10 8.44
1995 -1.31 7.94 6.94 12.30 2.90 2.93 10.87
1996 -0.42 8.60 7.20 14.42 0.40 3.45 12.05
1997 8.25 10.04 6.80 22.64 -2.50 8.27 18.31
1998 2.50 9.70 5.35 22.00 -2.53 5.05 14.75
1999 0.50 5.15 3.41 10.50 -2.45 9.35 14.50
2000 2.50 5.06 3.21 10.40 -3.35 9.44 14.50
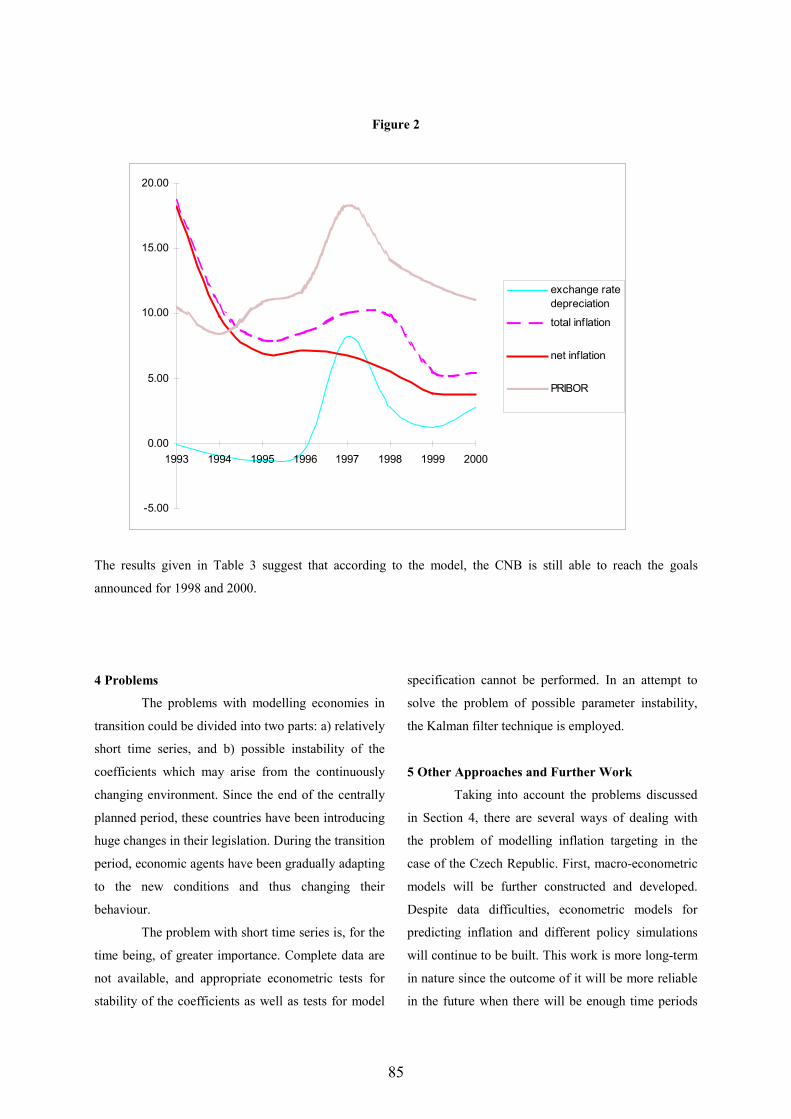
84
Figure1
Scenario 2 “Relaxing of Monetary Policy”
In this scenario, the selected policy variable
is 0.5 percentage points lower in 1998, 2.25
percentage points in 1999 and 3.5 percentage points in
2000 than in the first scenario. The idea here is to
study the effect of monetary policy relaxation on the
target variable (net inflation) and other
macroeconomic variables.
Table 3 – Simulation Results for the “Relaxing of Monetary Policy”
Year Exchange rate
depreciation
Total
inflation
Net
inflation
Inflation
in
regulated
goods
Deviation of real
GDP growth from
“potential growth”
Real
interest
rate
PRIBOR
1993 -0.11 18.70 18.26 30.12 -2.90 -8.10 10.60
1994 -0.90 10.54 9.79 18.49 -0.80 -2.10 8.44
1995 -1.31 7.94 6.94 12.30 2.90 2.93 10.87
1996 -0.42 8.60 7.20 14.42 0.40 3.45 12.05
1997 8.25 10.04 6.80 22.64 -2.50 8.27 18.31
1998 2.75 9.79 5.48 22.00 -2.53 4.46 14.25
1999 1.25 5.49 3.87 10.50 -2.24 6.76 12.25
2000 2.75 5.45 3.73 10.40 -2.48 5.55 11.00
-5.00
0.00
5.00
10.00
15.00
20.00
1993 1994 1995 1996 1997 1998 1999 2000
exchange ratedepreciation
total inf lation
net inf lation
PRIBOR
85
Figure 2
The results given in Table 3 suggest that according to the model, the CNB is still able to reach the goals
announced for 1998 and 2000.
4 Problems
The problems with modelling economies in
transition could be divided into two parts: a) relatively
short time series, and b) possible instability of the
coefficients which may arise from the continuously
changing environment. Since the end of the centrally
planned period, these countries have been introducing
huge changes in their legislation. During the transition
period, economic agents have been gradually adapting
to the new conditions and thus changing their
behaviour.
The problem with short time series is, for the
time being, of greater importance. Complete data are
not available, and appropriate econometric tests for
stability of the coefficients as well as tests for model
specification cannot be performed. In an attempt to
solve the problem of possible parameter instability,
the Kalman filter technique is employed.
5 Other Approaches and Further Work
Taking into account the problems discussed
in Section 4, there are several ways of dealing with
the problem of modelling inflation targeting in the
case of the Czech Republic. First, macro-econometric
models will be further constructed and developed.
Despite data difficulties, econometric models for
predicting inflation and different policy simulations
will continue to be built. This work is more long-term
in nature since the outcome of it will be more reliable
in the future when there will be enough time periods
-5.00
0.00
5.00
10.00
15.00
20.00
1993 1994 1995 1996 1997 1998 1999 2000
exchange ratedepreciation
total inf lation
net inf lation
PRIBOR
86
for obtaining more statistically stable results. It is
expected that the quality of the model and its
estimates and predictions will improve in time.
Secondly, work will continue on short-term
econometric models based on microeconomic
foundations (such a model at the Division for
Economic Modelling already exists; it is used for
short-term inflation forecasting). Thirdly, there are
plans to use the VAR method in order to obtain better
information about the functioning of the Czech
economy. Fourthly, it would be beneficial to use
stylised macro-models based on microeconomic
theory with calibrated parameters for policy
simulations. These models are resistant to the Lucas
critique, and they appear to be more relevant for
policy simulations4. Finally, research on the formation
of expectations in the Czech Republic will be
conducted because of their importance for the
development of the exchange rate and inflation and its
crucial role in modelling the economy.
4 For extended discussion concerning the Lucas critique, seeFair (1984) and Whitley (1994).
6 Conclusions
This paper presents a relatively simple, small
macro-econometric model and shows how it can be
used for simulating different monetary policy
scenarios in the Czech Republic related to inflation
targeting. Despite its simplicity, the model captures
the main characteristics of the monetary transmission
mechanism and gives plausible values for the key
macroeconomic variables in the simulation period
(1995 - 2000).
Finally, the most important conclusion is that
there is much work to be done in studying and
analysing the Czech economy. The results of these
studies are very important for constructing
appropriate models that can be used for reliable
inflation forecasting and policy simulations.

87
References
1. Ammer, John, and Richard T. Freeman (1995),
”Inflation Targeting in the 1990s: The Experiences
of New Zealand, Canada and the United
Kingdom”, Journal of Economics and Business
47, 165-192.
2. Fair, Ray, C. (1984), Specification, Estimation and
Analysis of Macroeconometric Models,
Cambridge, Harvard University Press.
3. Froot, K. and R. Thaler, (1990), ”Anomalies:
Foreign Exchange ”, Journal of Economic
Perspectives,
4. Haldane, A., G., ed. (1995), Targeting Inflation,
Bank of England, London.
5. Kmenta, J., (1986), Elements of Econometrics,
Macmillan Publishing Company.
6. McCallum, Bennett T. (1995), ”Inflation Targeting
in Canada, New Zealand, Sweden, the United
Kingdom, and in General”, presented at the VII
International Conference, Bank of Japan, October
1995.
7. Svensson Lars E. O., (1996), ”Inflation Forecast
Targeting: Implementing and Monitoring Inflation
Targets”, Bank of England 1996.
8. Whitley, John, (1994), A Course in Macroeconomic
Modelling and Forecasting, Harvester-
Wheatsheaf.
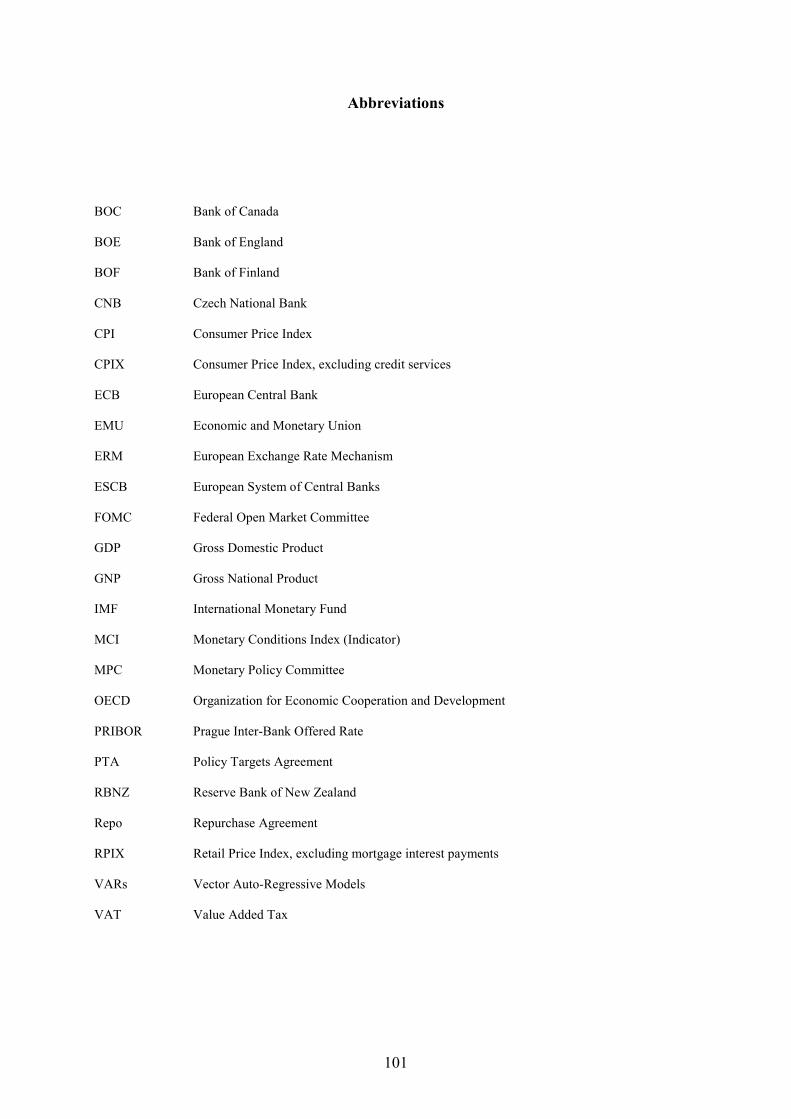
88
PANEL DISCUSSION
The workshop was concluded with a panel discussion. The following questions were used as a framework for the
discussion:
1. How do you define the target for a period of disinflation? When do you switch to a horizontal band?
2. Do inflation expectations switch to a “horizontal” regime?
3. Are there waves common when disinflating? Is fast inflation followed by a period of inflation?
4. What are the choices of targets (point target versus interval)?
5. Does a central bank lose its credibility if a target is under shot?
6. Under what circumstances does a central bank not lose credibility when missing the target?
7. How do you react to large exchange rate movements when targeting inflation?
8. How do you respond to supply shocks, and how do you identify them?
9. How often do you react with interest rates (frequent and smooth versus rare and large changes)?
We hope that this edited record of discussion will provide you with additional views and insight to those already
expressed in the presentations.
Panel Members:
Andrew Haldane (Bank of England)
Miroslav Hrnčíř (Czech National Bank)
Leonardo Leiderman (Bank of Israel)
Lavan Mahadeva (Bank of England)
David Mayes (Bank of Finland)
Zdeněk Tůma (EBRD)

101
Abbreviations
BOC Bank of Canada
BOE Bank of England
BOF Bank of Finland
CNB Czech National Bank
CPI Consumer Price Index
CPIX Consumer Price Index, excluding credit services
ECB European Central Bank
EMU Economic and Monetary Union
ERM European Exchange Rate Mechanism
ESCB European System of Central Banks
FOMC Federal Open Market Committee
GDP Gross Domestic Product
GNP Gross National Product
IMF International Monetary Fund
MCI Monetary Conditions Index (Indicator)
MPC Monetary Policy Committee
OECD Organization for Economic Cooperation and Development
PRIBOR Prague Inter-Bank Offered Rate
PTA Policy Targets Agreement
RBNZ Reserve Bank of New Zealand
Repo Repurchase Agreement
RPIX Retail Price Index, excluding mortgage interest payments
VARs Vector Auto-Regressive Models
VAT Value Added Tax


