FEBRUARY, 1934 The Influence of Certain Photographic Errors on the Profiles of Absorption Lines in Stellar Spectra C. T. ELVEY AND CHRISTINEWESTGATE, Yerkes Observatory (Received October 9, 1933) A study has been made of the Eberhard effect in its relation to the profiles of absorption lines. Measurements have been made of the depression of the background at the edge of an image, due to the inhibiting action of the products of development, for: (a) various differences be- tween the density of the image and that of the background; (b) constant ratio of exposure of image to exposure of background, but different total densities; (c) varying time of development; (d) agitation during development; and (e) type of developer. The influence of scattered light from the back of the plate and the influence of the graininess of the emulsion have also been studied. The conclusion is reached that for Eastman 40 plates developed in D-11 at 70'F, and with a density of the continuous spectrum less than unity, the Eberhard effect and the halation from the back of the plate have a negligible influence on the profile of an absorption line. The profiles of artificial absorption lines are shown. I. IN the course of the investigations at the Yerkes Observatory on the profiles and the total absorptions of lines in stellar spectra, a number of questions have arisen concerning the magnitudes of certain errors which enter into the photographic processes. In a large part of our spectrophotometric work we use the un- backed Eastman 40 plate, develop it in D-11 at a temperature of about 70'F, and during development rock the tray by hand, keeping the developer well agitated. Under these conditions what is the influence of the Eberhard effect upon the profile of a spectral line? How do other effects, which may not be dependent upon the development procedure, such as scattered light in the instrument, halation in the plate, and the graininess of the emulsion, act upon the shape of a spectral line? There is some evidence that our measurements of the total absorptions of lines depend upon the density of the spectrogram. We have checked this by taking a series of five spectrograms of the star -y Orionis with the single-prism Bruce spectrograph attached to the 40-inch telescope and by determining the profile of the H line in the usual manner. The densities of the con- tinuous spectrum at H range from 0.1 to 1.6 on these spectrograms. Four of the spectrograms of densities 0.9 and less gave sufficiently consistent results, the largest deviation from the mean being 13 percent. Errors of this size for wide hydrogen lines may be introduced by variations in the judgment of the measurer in sketching the con- tinuous spectrum across the absorption line.' The spectrogram of highest density (1.6) gave a total absorption of less than 50 percent of the mean of the other four. This, we believe, was caused by reflection of light from the back of the plate. A discussion of this effect follows in a later section. II. In most of the experiments a sharp-edged image was required. For this purpose the shadow of a razor blade, cast by a distant light was used. The exposures were made in a specially con- structed plateholder containing an aluminum plate having two apertures about 12 mm wide and 75 mm long. Across one opening a double- edged safety razor blade was mounted with adjustments by which it could be made concave toward the emulsion and brought almost in contact with it. The adjustment was such that no light could be reflected from the emulsion into the shadow cast by the blade. The plates were the same as those employed in the regular work of the Bruce spectrograph and were cali- brated with a tube sensitometer of 14 holes in two rows having a range in relative intensity of I Astrophys. J. 72, 277 (1930). 43 J. O. S. A. VOLUME 24
Transcript
FEBRUARY, 1934
The Influence of Certain Photographic Errors on the Profiles of Absorption Linesin Stellar Spectra
C. T. ELVEY AND CHRISTINE WESTGATE, Yerkes Observatory(Received October 9, 1933)
A study has been made of the Eberhard effect in itsrelation to the profiles of absorption lines. Measurementshave been made of the depression of the background atthe edge of an image, due to the inhibiting action of theproducts of development, for: (a) various differences be-tween the density of the image and that of the background;(b) constant ratio of exposure of image to exposure ofbackground, but different total densities; (c) varying timeof development; (d) agitation during development; and
(e) type of developer. The influence of scattered light fromthe back of the plate and the influence of the graininess ofthe emulsion have also been studied. The conclusion isreached that for Eastman 40 plates developed in D-11 at70'F, and with a density of the continuous spectrum lessthan unity, the Eberhard effect and the halation from theback of the plate have a negligible influence on the profileof an absorption line. The profiles of artificial absorptionlines are shown.
I.
IN the course of the investigations at theYerkes Observatory on the profiles and the
total absorptions of lines in stellar spectra, anumber of questions have arisen concerningthe magnitudes of certain errors which enter intothe photographic processes. In a large part ofour spectrophotometric work we use the un-backed Eastman 40 plate, develop it in D-11at a temperature of about 70'F, and duringdevelopment rock the tray by hand, keeping thedeveloper well agitated. Under these conditionswhat is the influence of the Eberhard effect uponthe profile of a spectral line? How do othereffects, which may not be dependent upon thedevelopment procedure, such as scattered lightin the instrument, halation in the plate, and thegraininess of the emulsion, act upon the shape ofa spectral line?
There is some evidence that our measurementsof the total absorptions of lines depend uponthe density of the spectrogram. We have checkedthis by taking a series of five spectrograms ofthe star -y Orionis with the single-prism Brucespectrograph attached to the 40-inch telescopeand by determining the profile of the H line inthe usual manner. The densities of the con-tinuous spectrum at H range from 0.1 to 1.6 onthese spectrograms. Four of the spectrograms ofdensities 0.9 and less gave sufficiently consistent
results, the largest deviation from the mean being13 percent. Errors of this size for wide hydrogenlines may be introduced by variations in thejudgment of the measurer in sketching the con-tinuous spectrum across the absorption line.'The spectrogram of highest density (1.6) gave atotal absorption of less than 50 percent of themean of the other four. This, we believe, wascaused by reflection of light from the back of theplate. A discussion of this effect follows in alater section.
II.In most of the experiments a sharp-edged
image was required. For this purpose the shadowof a razor blade, cast by a distant light was used.The exposures were made in a specially con-structed plateholder containing an aluminumplate having two apertures about 12 mm wideand 75 mm long. Across one opening a double-edged safety razor blade was mounted withadjustments by which it could be made concavetoward the emulsion and brought almost incontact with it. The adjustment was such thatno light could be reflected from the emulsioninto the shadow cast by the blade. The plateswere the same as those employed in the regularwork of the Bruce spectrograph and were cali-brated with a tube sensitometer of 14 holes intwo rows having a range in relative intensity of
I Astrophys. J. 72, 277 (1930).
43
J. O. S. A. VOLUME 24
C. T. ELVEY AND C. WESTGATE
a
b
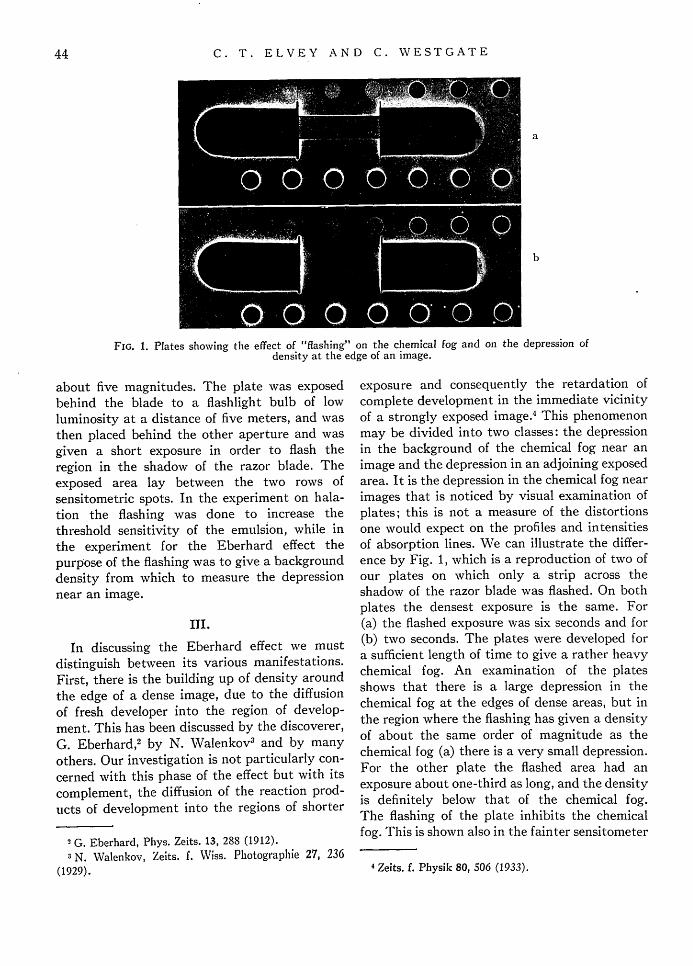
FIG. 1. Plates shoving the effect of "flashing" on the chemical fog and on the depression ofdensity at the edge of an image.
about five magnitudes. The plate was exposedbehind the blade to a flashlight bulb of lowluminosity at a distance of five meters, and wasthen placed behind the other aperture and wasgiven a short exposure in order to flash theregion in the shadow of the razor blade. Theexposed area lay between the two rows ofsensitometric spots. In the experiment on hala-tion the flashing was done to increase thethreshold sensitivity of the emulsion, while inthe experiment for the Eberhard effect thepurpose of the flashing was to give a backgrounddensity from which to measure the depressionnear an image.
III.
In discussing the Eberhard effect we mustdistinguish between its various manifestations.First, there is the building up of density aroundthe edge of a dense image, due to the diffusionof fresh developer into the region of develop-ment. This has been discussed by the discoverer,G. Eberhard, 2 by N. Walenkov 3 and by manyothers. Our investigation is not particularly con-cerned with this phase of the effect but with itscomplement, the diffusion of the reaction prod-ucts of development into the regions of shorter
2 G. Eberhard, Phys. Zeits. 13, 288 (1912).
3 N. Walenkov, Zeits. f. Wiss. Photograplhie 27, 236
(1929).
exposure and consequently the retardation ofcomplete development in the immediate vicinityof a strongly exposed image. This phenomenonmay be divided into two classes: the depressionin the background of the chemical fog near animage and the depression in an adjoining exposedarea. It is the depression in the chemical fog nearimages that is noticed by visual examination ofplates; this is not a measure of the distortionsone would expect on the profiles and intensitiesof absorption lines. We can illustrate the differ-ence by Fig. 1, which is a reproduction of two ofour plates on which only a strip across theshadow of the razor blade was flashed. On bothplates the densest exposure is the same. For(a) the flashed exposure was six seconds and for(b) two seconds. The plates were developed fora sufficient length of time to give a rather heavychemical fog. An examination of the platesshows that there is a large depression in thechemical fog at the edges of dense areas, but inthe region where the flashing has given a densityof about the same order of magnitude as thechemical fog (a) there is a very small depression.For the other plate the flashed area had anexposure about one-third as long, and the densityis definitely below that of the chemical fog.The flashing of the plate inhibits the chemicalfog. This is shown also in the fainter sensitometer
4 Zeits. f. Physik 80, 506 (1933).
44
PROFILES OF ABSORPTION LINES
spots-an effect discovered by F. E. Ross.' Thephenomenon is shown in the microphotometertracings in Fig. 2, made across the edges of the
FIG. 2. Microphotograms of images shown in Fig. 1,(a) and (b). Those on the left are for regions that havebeen flashed and those on the right are for unflashedregions.
shadow of the razor blade in Fig. 1. The twoupper curves are tracings of (a) and show thedifference between the flashed (left) and the un-flashed regions. The lower curves are for (b), inwhich the flashing was of much shorter duration.Here the difference is not so pronounced. Inpractically all cases in stellar spectroscopy theresidual intensity within an absorption line issufficient to give an effect of flashing equivalentto that shown in Fig. la, and consequently theEberhard effect with which we are dealing is atotally different phenomenon from that whichone sees visually on a plate. In all of our workwe have flashed the plates to eliminate thiseffect and also to give a density from which tomeasure. The region of the sensitometric spotswas not flashed.
5 F. E. Ross, Astrophys. J. 73, 54 (1931).
In our first series of experiments we studiedthe variation of Eberhard effect with density onbacked Eastman 40 plates, developed in D-11 ata temperature of 70'F. The exposures were asfollows: 150:6, 90:6, 60:6, 30:6, and 15:6, thefirst figure giving the total exposure of theimage in seconds and the second giving the ex-posure of the flashed area. For each exposuretime three plates were taken, one being sta-tionary during development, another rocked andthe third brushed. The three trays of developerwere poured from the same bottle, which hadbeen kept at the required temperature. Theplates have been measured with the registeringmicrophotometer and the results are shown inFig. 3, upper section. The ordinates, expressedin stellar magnitudes, give the depression of thebackground near the image and the abscissae aredistances from the edge of the image in milli-meters. The effect is greatest at the edge of theimage and decreases to zero at a distance of0.5 mm for the most pronounced case. In theupper row are the results from stationary de-velopment; in the second, those obtained fromplates which had been rocked. The lower illustra-tion gives the results for plates which had beenbrushed. Decreasing exposures are plotted towardthe right in the order listed above. The densitiesof the rocked plates for the above exposures are:1.6, 1.2, 1.1, 0.7 and 0.3. The depression of thebackground exposure near an image is of courselargest for the stationary plates and also in-creases with the density of the image. The rockedand brushed plates show a marked improvementover the stationary ones. For densities of theimage up to 0.7 on rocked or brushed plates wefound no effect, but for densities of 1.1 andgreater the depression is of importance. In allof these cases, however, we have the maximumeffect since we have a very sharp-edged image.In practice, all spectral absorption lines have aconsiderable edge gradient. Furthermore, thedifference in the amount of light falling on thedense area and on the background is muchgreater than that between the center of the lineand the continuous spectrum of most absorptionlines in stellar spectra.
An anomalous result was found in the case ofthe exposure of 60: 6, density 1.1, in that theeffect was very large both for the stationary and
l
45
C. T. ELVEY AND C. WESTGATE
0;0 0.4 0;0
. ._ - I I I I
0.0-
0.1 -V'
0.2 -
.. †.. 0.0-
0.1 -
0.2 -
..... 0.0-
K0.2 -
0.4 0.0 04 0.0 04 0.0I - . I . . . I
I i I ! 1 j 1 1 1 1 1 1 M ! i I .,
...... / / *-0.0-
0.1
0.2
0.3
0.1 -
FIG. 3. The depression of the background at the edge of an image, caused by the Eberhard
effect. The abscissae are millimeters from the edge of the image and the ordinates are the de-pressions in the background density calibrated in terms of the difference in light intensity (mag-nitudes) that would have been necessary to produce them.
for the rocked plates. We repeated the experi-ment for this exposure and for that of next
higher density and obtained the same resultseven though we had another emulsion and anew solution of developer.
A series of experiments was made covering the
same range of total exposures as above but
always keeping the same ratio, 2.5 to 1, between
the exposures for the image and those for the
fog background. The exposures are as follows:
15:6, 30:12, 60:24 and 120:48. This ratio ofexposures should give a difference in density
roughly equal to that found between the con-
tinuous spectrum and the center of an absorptionline having a depth of 60 percent. For each
exposure time a pair of plates was obtained, onebeing developed while in a stationary positionand the other while rocked. The microphoto-metric tracings show no depression of the back-ground at the edge of the image for the rockedplates, and for the stationary ones the effect isno larger than that shown in Fig. 3 for the same
exposure ratio, 15:6. This shows that even inthe severest case a line with abrupt edges, havinga central depth of 60 percent can be keptpractically free from the influence of the Eber-hard effect by proper development.
The effect of time of development is shown in
the lower part of Fig. 3. For this experiment wetook three plates with the same exposure times,
46
I I I I . I
Il I I
I I
I
PROFILES OF ABSORPTION
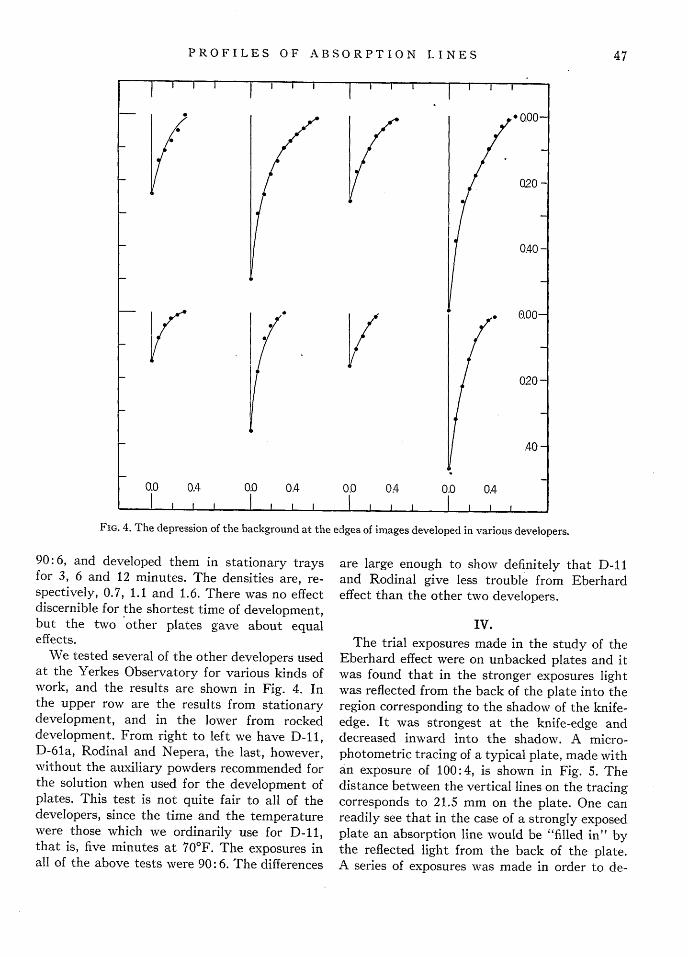
FIG. 4. The depression of the background at the edges of images developed in various developers.
90:6, and developed them in stationary traysfor 3, 6 and 12 minutes. The densities are, re-spectively, 0.7, 1.1 and 1.6. There was no effectdiscernible for the shortest time of development,but the two other plates gave about equaleffects.
We tested several of the other developers usedat the Yerkes Observatory for various kinds ofwork, and the results are shown in Fig. 4. Inthe upper row are the results from stationarydevelopment, and in the lower from rockeddevelopment. From right to left we have D-11,D-61a, Rodinal and Nepera, the last, however,without the auxiliary powders recommended forthe solution when used for the development ofplates. This test is not quite fair to all of thedevelopers, since the time and the temperaturewere those which we ordinarily use for D-11,that is, five minutes at 70'F. The exposures inall of the above tests were 90:6. The differences
are large enough to show definitely that D-11and Rodinal give less trouble from Eberhardeffect than the other two developers.
IV.The trial exposures made in the study of the
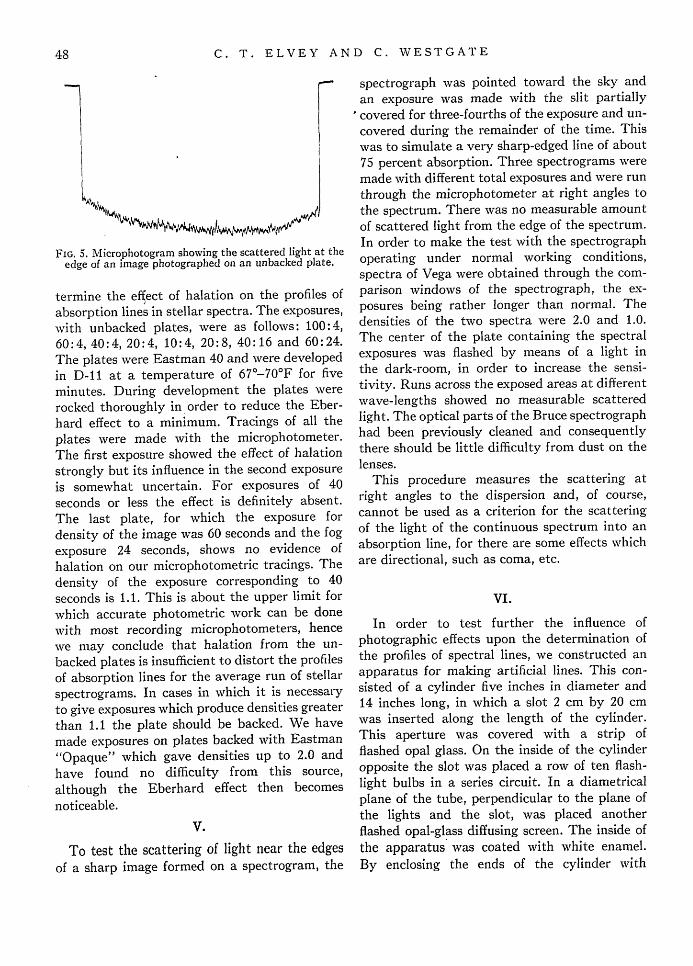
Eberhard effect were on unbacked plates and itwas found that in the stronger exposures lightwas reflected from the back of the plate into theregion corresponding to the shadow of the knife-edge. It was strongest at the knife-edge anddecreased inward into the shadow. A micro-photometric tracing of a typical plate, made withan exposure of 100:4, is shown in Fig. 5. Thedistance between the vertical lines on the tracingcorresponds to 21.5 mm on the plate. One canreadily see that in the case of a strongly exposedplate an absorption line would be "filled in" bythe reflected light from the back of the plate.A series of exposures was made in order to de-
i I I I I
_0.00-
020 -
7 ~~~~~~~~~~~~~~~~~~~040 -
6 i~g. / a. 0.00-
020 -
40 -
0.0 0.4 0.0 0.4 0.0 0.4 0.0 0.4I I I I I I I I I I
L I NE 47
C. T. ELVEY AND C. WESTGATE
FIG. 5. Microphotogram showing the scattered light at theedge of an image photographed on an unbacked plate.
termine the effect of halation on the profiles ofabsorption lines in stellar spectra. The exposures,with unbacked plates, were as follows: 100: 4,60:4, 40:4, 20:4, 10:4, 20:8, 40:16 and 60:24.The plates were Eastman 40 and were developedin D-11 at a temperature of 67 0-70'F for fiveminutes. During development the plates wererocked thoroughly in order to reduce the Eber-hard effect to a minimum. Tracings of all theplates were made with the microphotometer.The first exposure showed the effect of halationstrongly but its influence in the second exposureis somewhat uncertain. For exposures of 40seconds or less the effect is definitely absent.The last plate, for which the exposure fordensity of the image was 60 seconds and the fogexposure 24 seconds, shows no evidence ofhalation on our microphotometric tracings. Thedensity of the exposure corresponding to 40seconds is 1.1. This is about the upper limit forwhich accurate photometric work can be donewith most recording microphotometers, hencewe may conclude that halation from the un-backed plates is insufficient to distort the profilesof absorption lines for the average run of stellarspectrograms. In cases in which it is necessaryto give exposures which produce densities greaterthan 1.1 the plate should be backed. We havemade exposures on plates backed with Eastman"Opaque" which gave densities up to 2.0 andhave found no difficulty from this source,although the Eberhard effect then becomesnoticeable.
V.
To test the scattering of light near the edgesof a sharp image formed on a spectrogram, the
spectrograph was pointed toward the sky andan exposure was made with the slit partiallycovered for three-fourths of the exposure and un-covered during the remainder of the time. Thiswas to simulate a very sharp-edged line of about75 percent absorption. Three spectrograms weremade with different total exposures and were runthrough the microphotometer at right angles tothe spectrum. There was no measurable amountof scattered light from the edge of the spectrum.In order to make the test with the spectrographoperating under normal working conditions,spectra of Vega were obtained through the com-parison windows of the spectrograph, the ex-posures being rather longer than normal. Thedensities of the two spectra were 2.0 and 1.0.The center of the plate containing the spectralexposures was flashed by means of a light inthe dark-room, in order to increase the sensi-tivity. Runs across the exposed areas at differentwave-lengths showed no measurable scatteredlight. The optical parts of the Bruce spectrographhad been previously cleaned and consequentlythere should be little difficulty from dust on thelenses.
This procedure measures the scattering atright angles to the dispersion and, of course,cannot be used as a criterion for the scatteringof the light of the continuous spectrum into anabsorption line, for there are some effects whichare directional, such as coma, etc.
VI.
In order to test further the influence ofphotographic effects upon the determination ofthe profiles of spectral lines, we constructed anapparatus for making artificial lines. This con-sisted of a cylinder five inches in diameter and14 inches long, in which a slot 2 cm by 20 cmwas inserted along the length of the cylinder.This aperture was covered with a strip offlashed opal glass. On the inside of the cylinderopposite the slot was placed a row of ten flash-light bulbs in a series circuit. In a diametricalplane of the tube, perpendicular to the plane ofthe lights and the slot, was placed anotherflashed opal-glass diffusing screen. The inside ofthe apparatus was coated with white enamel.By enclosing the ends of the cylinder with
48
PROFILES OF ABSORPTION LINES
mirrors, uniform illumination of the narrowstrip of opal glass was made possible; this couldbe used as a source to represent a continuousspectrum. Tests made by photographing thesource on a scale reduced to 1/15, on Processplates which were then developed to high con-trast, showed that for our purposes the illumina-tion along the source was uniform. This tube wasmounted inside a rotating cylinder 7 inchesin diameter and 15 inches in length. A sectionwas taken out of the wall of the rotating cylinderso that an aperture 20 cm by 20 cm was available,and this opening was covered with two sheets ofKodaloid. A mask of any desired shape cut fromblack paper could be inserted between the twosheets of Kodaloid. A photograph of the lightsource while the cylinder is rotating integratesalong the direction of rotation, and the shape ofthe mask determines the effective intensity fromthe different parts of the uniformly illuminatedstrip.
We used one of the spectrograph cameras, setup at a distance of five meters and focussedaccurately on the mask. This gave an image ofthe source 1.2 mm by 13 mm. The first maskwas one which would produce an artificial linein which the effective exposure for the centerof the line was 25 percent, with one of its edgesjumping abruptly back to 100 percent intensityand the other edge sloping gradually back along astraight line. Several exposures were taken withthis mask and a profile, obtained from anaverage of the results, is shown in Fig. 6. Theshortest exposure is that obtained from 100 turnsof the rotating cylinder. In this diagram theordinates are percentages of absorption and theabscissae are millimeters. The measures acrossthe width of the line have been reduced to theoriginal size of the mask. The profile of the linehas been drawn in from the relative size of themask and the aperture. The exposures were allmade on backed Eastman 40 plates developed inD-11 for five minutes at 70'F with thoroughrocking. The influence of the Eberhard effect andof the scattering of light from the back of theplate is seen to be negligible. The lack of sharp-ness at the abrupt edge of the line is due to lackof resolving power in the equipment, but this issmall in comparison with the effects which arehere sought.
. 0
50
l l I I I I I 1000 20 40 60
FIG. 6. Profile of an artificial absorption line as described inthe text. The ordinates are percentages of absorption.
Another mask was made having two tri-angular-shaped lines with depths of 75 percentfor the wider one and 50 percent for the other.The widths of the two lines on the photographare 2.8 mm and 0.7 mm, respectively, corre-sponding to lines of 28A and 7A width at 4500in the three-prism Bruce spectrograph. AgainEastman 40 backed plates were used with theusual development. A series of four plates ofexposures of 100, 200, 300 and 600 seconds wasobtained to note any effect of density upon theresults. Fig. 7 shows the reduced profiles, theordinates being percentages of absorption andthe abscissae millimeters on the original mask.The curves are plotted in the order of decreasingdensities of the images, which are, respectively,1.5, 0.95, 0.85 and 0.44. Essentially the sameresults were obtained from the plates of thevarious densities, excepting perhaps the one oflowest density, for which the central intensity ofthe line seems to be somewhat less. This, how-ever, may be a result of the waviness observedin some of the profiles, which was found to beof instrumental origin.
VII.
The graininess of an emulsion is a measure ofthe distribution of the individual grains ratherthan a measure of their size. C. E. K. Mees6has shown microphotometric tracings from vari-ous emulsions uniformly blackened to a densityof 0.3 which exhibit the relative structure orgraininess very nicely. The irregular distributionof the grains blurs out the fine details and calls
6 C. E. K. Mees, J. Opt. Soc. Am. 21, 762 (1931).
49
C. T. ELVEY AND C. WESTGATE
FIG. 7. Profiles of artificial absorption lines.
for considerable judgment in determining what isreal. An inexperienced person is apt to put toomuch emphasis on the deviations of the tracingand as a result sees too many faint lines or toomuch detail in the more intense lines. Fig. 8shows microphotometric tracings of two equallydense spectrograms of 53 K Orionis. The upper isfrom a fine-grain Process emulsion and the loweris from a Par-speed emulsion. On the tracingfrom the Par-speed emulsion the Mg II lineX4481 is practically obliterated by the graininess.At best there would be a large percentage errorin the determination of its total absorption. For
Ile 447/ A, YO 448/
FIG. 8. Microphotograms of spectra of 53 K Orionis inthe region of the absorption lines He I 4471 and Mg II4481. The upper is from a Process plate and the lower froma Par-speed plate.
the stronger line of He I the error would not beso great, nevertheless there would be considerableuncertainty in sketching the continuous back-ground and the smooth curve for the line itself.
SUMARY
We may summarize our results as follows:for Eastman 40 plates developed in D-11 at70'F for five minutes there is no appreciableinfluence of the Eberhard effect on the profileof an absorption line as long as the density ofthe continuous spectrum is less than unity.Likewise, it is found that the halation from theback of the plate is not serious under theseconditions.
We wish to express our gratitude to ourcolleague, Professor Ross, for his helpful sug-gestions.