The Twelfth International Ferroalloys Congress Sustainable Future June 6 – 9, 2010 Helsinki, Finland 349 REDUCTANTS INFLUENCE OF COKE PARTICLE SIZE ON THE ELECTRICAL RESISTIVITY OF COKE BEDS P. A. Eidem 1 , M. Tangstad 2 , J. A. Bakken 2 and R. Ishak 3 1 Eramet Norway AS, c/o Sintef Materials and Chemistry, Afred Getz vei 2, N-7465 Trondheim, Norway; [email protected], previously with 2 Department of Materials Science and Technology, Norwegian University of Science and Technology (NTNU), N-7491 Trondheim, Norway; [email protected], [email protected]3 Eramet Norway AS, Postboks 82, 3901 Porsgrunn; [email protected]ABSTRACT In the production of high carbon ferromanganese (HCFeMn) in a submerged arc furnace, a coke enriched area is present around and below the electrode tip. This area is often called the coke bed. As the current flows through this area of the furnace, electric energy is dissipated through ohmic heating, which again is used for the reduction of manganese oxides. The furnace resistance, which is an important control parameter, is determined by, among other things, the geometrical dimensions and the resistivity of the coke bed. In this work the resistivity of a coke bed is determined through pilot scale experiments. The two presented experiments were performed in a 150 kVA furnace, producing HCFeMn. Of the controlled parameters only the coke particle size was changed, i.e. variables such as the charge composition and electrode height was the same for both the experiments. After the experiments the furnace was cooled, casted in epoxy and cut in half so that the coke bed geometry could be studied. By the use of a multiphysics modeling software the resistivity of the coke bed was estimated based on the observed geometrical dimensions of the coke bed and the recorded voltage and current of the furnace moments before it was turned off. The results show an estimated resistivity of approximately 1.9⋅10 -3 Ω·m and 1.3⋅10 -3 Ω·m for the experiments with 5 - 10 mm and 15 - 20 mm coke, respectively. A decrease in electrical resistivity with increasing coke particle size is in accordance with the results obtained for dry coke beds. Possible industrial advancements due to these results are also discussed in the paper. 1 INTRODUCTION Ferroalloys such as HCFeMn, FeCr and SiMn are commonly produced in submerged arc furnaces (SAF) today. Several dig-outs of industrial furnaces have shown that there is a coke enriched area below and around the electrode tip [1-4]. This area is often called the coke bed. It consists of a mixture of coke, slag, metal droplets and gas. Simulations of the current paths in a SAF by Dhainaut [5] show that more than 95 % of the current flows through the coke bed area. The coke bed is heated through resistive heating, which produces the energy needed for the reduction of e.g. FeMn. It is thus important to have knowledge of how variables such as the charge composition, temperature, type of coke and sizing of coke influences the electrical resistivity of the coke bed. Previously several authors have done measurements on the electrical resistivity of charge material mixes [6-9], reducing agents [6, 7, 9-13] and various slag compositions [10, 14-16]. Rhømen [17] estimated the coke bed resistivity, in experiments similar to the experiments presented here, by dividing the coke bed into several horizontal slices. The coke bed was divided into two main parts with different resistivity, the dry coke bed, which is upper part of the coke bed that consists mainly of coke, and the wet coke bed, which is the lower part where slag and coke is mixed. In doing so the coke bed did not have a constant resistivity. The present paper describes two experiments where FeMn was produced in a 150 kVA one phase furnace. Only the particle size of the metallurgical coke was changed in the experiments so that the
Transcript
The Twelfth International Ferroalloys CongressSustainable Future
June 6 – 9, 2010Helsinki, Finland
349
reductants
INFLUENCE OF COKE PARTICLE SIZE ON THE ELECTRICAL RESISTIVITY OF COKE BEDS
P. A. Eidem 1, M. Tangstad2, J. A. Bakken2 and R. Ishak3
1 Eramet Norway AS, c/o Sintef Materials and Chemistry, Afred Getz vei 2, N-7465 Trondheim, Norway; [email protected], previously with
2Department of Materials Science and Technology, Norwegian University of Science and Technology (NTNU), N-7491 Trondheim, Norway; [email protected], [email protected]
In the production of high carbon ferromanganese (HCFeMn) in a submerged arc furnace, a coke enriched area is present around and below the electrode tip. This area is often called the coke bed. As the current flows through this area of the furnace, electric energy is dissipated through ohmic heating, which again is used for the reduction of manganese oxides. The furnace resistance, which is an important control parameter, is determined by, among other things, the geometrical dimensions and the resistivity of the coke bed. In this work the resistivity of a coke bed is determined through pilot scale experiments. The two presented experiments were performed in a 150 kVA furnace, producing HCFeMn. Of the controlled parameters only the coke particle size was changed, i.e. variables such as the charge composition and electrode height was the same for both the experiments. After the experiments the furnace was cooled, casted in epoxy and cut in half so that the coke bed geometry could be studied. By the use of a multiphysics modeling software the resistivity of the coke bed was estimated based on the observed geometrical dimensions of the coke bed and the recorded voltage and current of the furnace moments before it was turned off. The results show an estimated resistivity of approximately 1.9⋅10-3 Ω·m and 1.3⋅10-3 Ω·m for the experiments with 5 - 10 mm and 15 - 20 mm coke, respectively. A decrease in electrical resistivity with increasing coke particle size is in accordance with the results obtained for dry coke beds. Possible industrial advancements due to these results are also discussed in the paper.
1 INTRODUCTION Ferroalloys such as HCFeMn, FeCr and SiMn are commonly produced in submerged arc furnaces (SAF) today. Several dig-outs of industrial furnaces have shown that there is a coke enriched area below and around the electrode tip [1-4]. This area is often called the coke bed. It consists of a mixture of coke, slag, metal droplets and gas. Simulations of the current paths in a SAF by Dhainaut [5] show that more than 95 % of the current flows through the coke bed area. The coke bed is heated through resistive heating, which produces the energy needed for the reduction of e.g. FeMn. It is thus important to have knowledge of how variables such as the charge composition, temperature, type of coke and sizing of coke influences the electrical resistivity of the coke bed. Previously several authors have done measurements on the electrical resistivity of charge material mixes [6-9], reducing agents [6, 7, 9-13] and various slag compositions [10, 14-16]. Rhømen [17] estimated the coke bed resistivity, in experiments similar to the experiments presented here, by dividing the coke bed into several horizontal slices. The coke bed was divided into two main parts with different resistivity, the dry coke bed, which is upper part of the coke bed that consists mainly of coke, and the wet coke bed, which is the lower part where slag and coke is mixed. In doing so the coke bed did not have a constant resistivity. The present paper describes two experiments where FeMn was produced in a 150 kVA one phase furnace. Only the particle size of the metallurgical coke was changed in the experiments so that the
The Twelfth International Ferroalloys CongressSustainable Future
June 6 – 9, 2010Helsinki, Finland
350
influence of particle size on the resistivity of the coke bed could be examined. Based on a cross section cut of the furnaces after the experiments, a multiphysics modeling software was used to estimate the resistivity of the coke bed to find the influence of particle size.
2 EXPERIMENTAL
2.1 The Pilot Furnace
The pilot furnace, shown in Figure 1, is a 150 kVA one phase furnace. A circular lining, internal diameter approximately 60 cm and height approximately 70 cm, is made from high alumina refractory. The height of the 152 mm graphite top electrode, which is centered in the furnace, can be adjusted mechanically. The bottom is made from a conductive carbon paste and functions as the bottom electrode. Both the top electrode and the bottom electrode are water cooled.
Figure 1: Picture of the 150 kVA one phase furnace. The electrode diameter is approximately 15 cm.
The power of the furnace is controlled by adjusting the voltage in 9 voltage steps between 20 V and 40 V. The maximum current varies, from 6000 A to 3750 A, according to the respective voltage steps.
2.2 Furnace Operation
Both experiments were operated with a constant electrode tip position of 20 cm above the bottom electrode and a constant power of about 150 kW. The charge level was at all times kept at the height of the furnace lining. At the initial stage of the experiments 5 kg of English coke of the size used throughout the experiment was charged to the empty furnace and the electrode was lowered to create contact. The furnace was then preheated for 19.5 kWh before adding the first charge. The composition of the charge mix is given in Table 1. Material analyses can be found in [19, pp. 229]. The electrode tip position was increased until an electrode tip position of 200 mm was reached, as indicated in Figure 2 and 3. The first tapping was done after 160 kWh, and thereafter every 60 kWh. The tapping time, from opening to closing of the furnace tap hole, was typically 2 minutes. The tappings are indicated in Figure 2 and 3 in gray, where the width of the gray area represents the tapping time, and the tap numbers are given. During the experiment the voltage and current is continuously logged by a data logger. A power meter is used to determine the electric power consumption used between taps. No correction for reactive power and voltage was found necessary as cos ϕ ≈ 1 [18].
reductants
The Twelfth International Ferroalloys CongressSustainable Future
June 6 – 9, 2010Helsinki, Finland
351
Table 1: Composition of charge mix. Charge mix was constant throughout the experiment. Further analyses are given in [19, pp. 229]
Material Weight [kg] South African Ore 11.4 Gabon ore 6.5 Gabon sinter 14.0 FeMn fines 0.7 Dolomite 1.1 English coke 7.3
Figure 2: Resistance variations during the experiment using 5-10 mm English coke. Tappings, tap numbers and electrode tip position are indicated.
Figure 3: Resistance variations during the experiment where 15-20mm English coke was used. Tappings, tap number and electrode tip position are indicated.
2.3 Termination of experiment and post experimental work
39 kWh after the last tapping the furnace is shut off. Due to the highly endothermic reactions occurring in the coke bed area, the chemical reactions will stop within minutes of shutting off the power [20]. The furnace is then cooled for approximately 72 hours before epoxy is poured into the furnace. After another 48 hours the epoxy has hardened and the furnace can be cut in half. The shape of the coke bed can then be evaluated. The tapped slag and metal is separated and weighed, and representative samples of slag and metal from each tap is taken. Raw materials that are mixed with the slag and metal can make the separation difficult.
3 DETERMINATION OF THE COKE BED RESISTIVITY During production of HC FeMn the ore and sinter particles are smelted to slag at the edge of the coke bed. In the coke bed there is no ore or sinter particles present, only coke and slag. The method used to determine the outer edges of the coke bed is to outline the ore and sinter particles on the polished cross section of the furnace. Based on the outlined ore and sinter particles the geometry of the coke bed was determined. A multiphysics modeling software was used to estimate the resistivity of the coke bed. A 2D axial symmetric geometry is made based on the furnace cross sections. Since the electromagnetic penetration depth at 50 Hz is assumed to be large compared to the radial dimensions of the furnace,
reductants
The Twelfth International Ferroalloys CongressSustainable Future
June 6 – 9, 2010Helsinki, Finland
352
i.e. negligible current displacement, a DC module in the multiphysics modeling software is used. The module solves the current continuity equation:
01=⎟⎟
⎠
⎞⎜⎜⎝
⎛∇⋅−∇=⋅∇ V
ρJ (1)
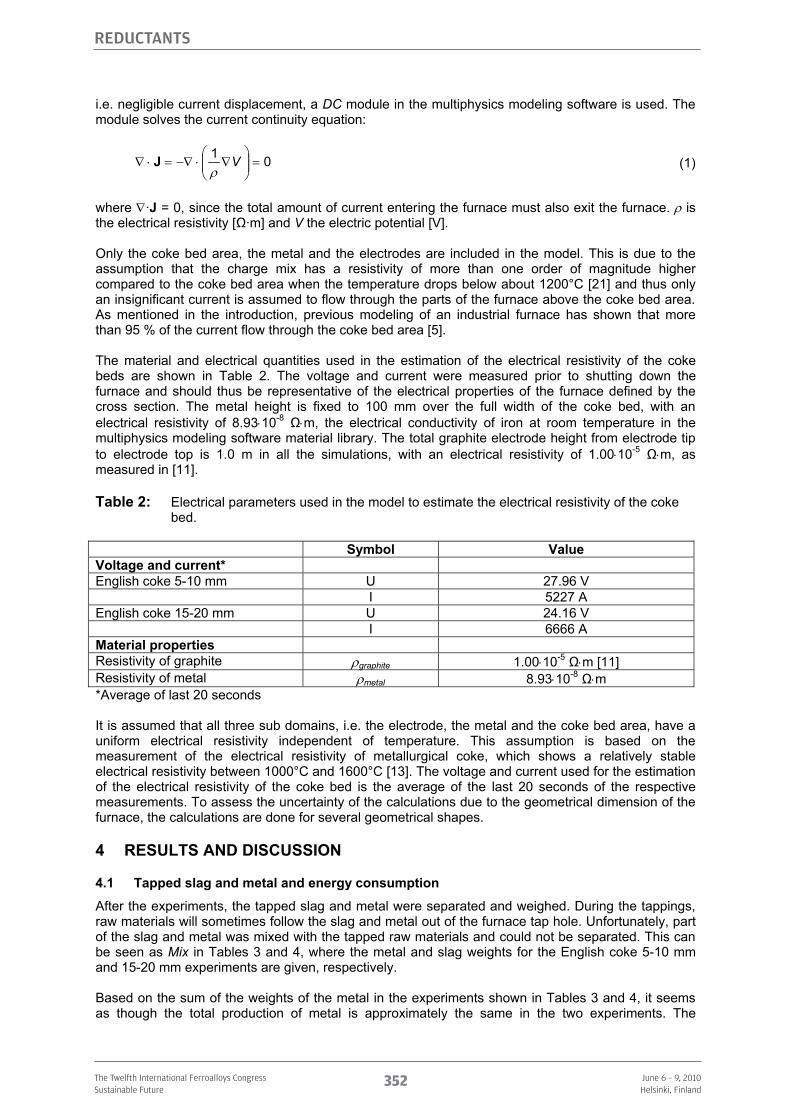
where ∇·J = 0, since the total amount of current entering the furnace must also exit the furnace. ρ is the electrical resistivity [Ω·m] and V the electric potential [V]. Only the coke bed area, the metal and the electrodes are included in the model. This is due to the assumption that the charge mix has a resistivity of more than one order of magnitude higher compared to the coke bed area when the temperature drops below about 1200°C [21] and thus only an insignificant current is assumed to flow through the parts of the furnace above the coke bed area. As mentioned in the introduction, previous modeling of an industrial furnace has shown that more than 95 % of the current flow through the coke bed area [5]. The material and electrical quantities used in the estimation of the electrical resistivity of the coke beds are shown in Table 2. The voltage and current were measured prior to shutting down the furnace and should thus be representative of the electrical properties of the furnace defined by the cross section. The metal height is fixed to 100 mm over the full width of the coke bed, with an electrical resistivity of 8.93⋅10-8 Ω⋅m, the electrical conductivity of iron at room temperature in the multiphysics modeling software material library. The total graphite electrode height from electrode tip to electrode top is 1.0 m in all the simulations, with an electrical resistivity of 1.00⋅10-5 Ω⋅m, as measured in [11].
Table 2: Electrical parameters used in the model to estimate the electrical resistivity of the coke bed.
Symbol Value Voltage and current* English coke 5-10 mm U 27.96 V I 5227 A English coke 15-20 mm U 24.16 V I 6666 A Material properties Resistivity of graphite ρgraphite 1.00⋅10-5 Ω⋅m [11] Resistivity of metal ρmetal 8.93⋅10-8 Ω⋅m *Average of last 20 seconds It is assumed that all three sub domains, i.e. the electrode, the metal and the coke bed area, have a uniform electrical resistivity independent of temperature. This assumption is based on the measurement of the electrical resistivity of metallurgical coke, which shows a relatively stable electrical resistivity between 1000°C and 1600°C [13]. The voltage and current used for the estimation of the electrical resistivity of the coke bed is the average of the last 20 seconds of the respective measurements. To assess the uncertainty of the calculations due to the geometrical dimension of the furnace, the calculations are done for several geometrical shapes.
4 RESULTS AND DISCUSSION
4.1 Tapped slag and metal and energy consumption
After the experiments, the tapped slag and metal were separated and weighed. During the tappings, raw materials will sometimes follow the slag and metal out of the furnace tap hole. Unfortunately, part of the slag and metal was mixed with the tapped raw materials and could not be separated. This can be seen as Mix in Tables 3 and 4, where the metal and slag weights for the English coke 5-10 mm and 15-20 mm experiments are given, respectively. Based on the sum of the weights of the metal in the experiments shown in Tables 3 and 4, it seems as though the total production of metal is approximately the same in the two experiments. The
reductants
The Twelfth International Ferroalloys CongressSustainable Future
June 6 – 9, 2010Helsinki, Finland
353
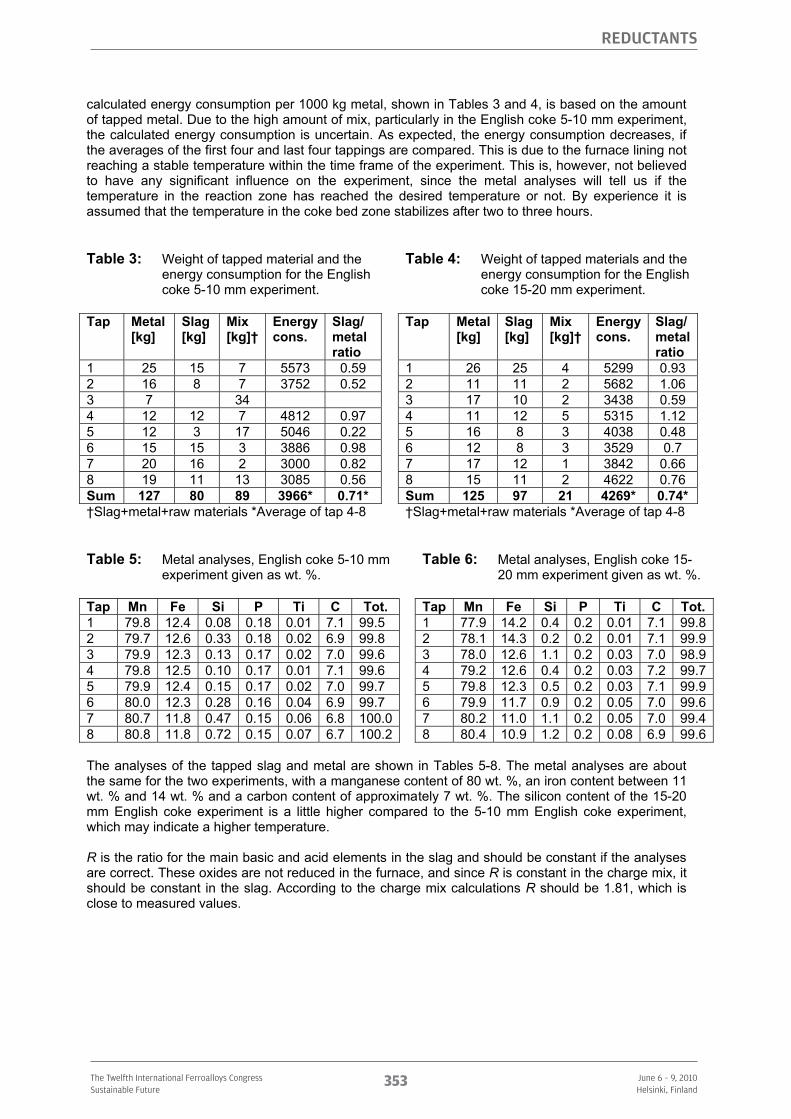
calculated energy consumption per 1000 kg metal, shown in Tables 3 and 4, is based on the amount of tapped metal. Due to the high amount of mix, particularly in the English coke 5-10 mm experiment, the calculated energy consumption is uncertain. As expected, the energy consumption decreases, if the averages of the first four and last four tappings are compared. This is due to the furnace lining not reaching a stable temperature within the time frame of the experiment. This is, however, not believed to have any significant influence on the experiment, since the metal analyses will tell us if the temperature in the reaction zone has reached the desired temperature or not. By experience it is assumed that the temperature in the coke bed zone stabilizes after two to three hours.
Table 3: Table 4: Weight of tapped material and the energy consumption for the English coke 5-10 mm experiment.
Weight of tapped materials and the energy consumption for the English coke 15-20 mm experiment.
Table 5: Table 6: Metal analyses, English coke 5-10 mm experiment given as wt. %.
Metal analyses, English coke 15-20 mm experiment given as wt. %.
Tap Mn Fe Si P Ti C Tot. Tap Mn Fe Si P Ti C Tot. 1 79.8 12.4 0.08 0.18 0.01 7.1 99.5 1 77.9 14.2 0.4 0.2 0.01 7.1 99.82 79.7 12.6 0.33 0.18 0.02 6.9 99.8 2 78.1 14.3 0.2 0.2 0.01 7.1 99.93 79.9 12.3 0.13 0.17 0.02 7.0 99.6 3 78.0 12.6 1.1 0.2 0.03 7.0 98.94 79.8 12.5 0.10 0.17 0.01 7.1 99.6 4 79.2 12.6 0.4 0.2 0.03 7.2 99.75 79.9 12.4 0.15 0.17 0.02 7.0 99.7 5 79.8 12.3 0.5 0.2 0.03 7.1 99.96 80.0 12.3 0.28 0.16 0.04 6.9 99.7 6 79.9 11.7 0.9 0.2 0.05 7.0 99.67 80.7 11.8 0.47 0.15 0.06 6.8 100.0 7 80.2 11.0 1.1 0.2 0.05 7.0 99.48 80.8 11.8 0.72 0.15 0.07 6.7 100.2 8 80.4 10.9 1.2 0.2 0.08 6.9 99.6 The analyses of the tapped slag and metal are shown in Tables 5-8. The metal analyses are about the same for the two experiments, with a manganese content of 80 wt. %, an iron content between 11 wt. % and 14 wt. % and a carbon content of approximately 7 wt. %. The silicon content of the 15-20 mm English coke experiment is a little higher compared to the 5-10 mm English coke experiment, which may indicate a higher temperature. R is the ratio for the main basic and acid elements in the slag and should be constant if the analyses are correct. These oxides are not reduced in the furnace, and since R is constant in the charge mix, it should be constant in the slag. According to the charge mix calculations R should be 1.81, which is close to measured values.
reductants
The Twelfth International Ferroalloys CongressSustainable Future
June 6 – 9, 2010Helsinki, Finland
354
Table 7: Table 8: Slag analyses, English coke 5-10 mm experiment given as wt. %.
Slag analyses, English coke 15-20 mm experiment given as wt. %.
The furnace resistance during operation is shown in Figures 2 and 3. The initial stages of both of the experiments are very unstable due to the electrode tip position being increased at this stage. As the electrode height is increased, the furnace resistance increases. This effect is more significant in the 15-20 mm English coke experiment due to a more rapid increase in the electrode tip position. For both the experiments the furnace resistance does stabilize over time. In both of the experiments the furnace resistance decreases from the first to the last tapping, see Figures 2 and 3. The furnace resistance of the English coke 15-20 mm experiment is lower compared to the furnace resistance observed for the English coke 5-10 mm experiment. The higher furnace resistance observed for the English coke 5-10 mm experiment may be due to the decreased coke particle size used. It may, however, also be due to a buildup of the coke bed. An increased amount of coke in the coke bed will widen the coke bed cross section area and thus decrease the resistance of the current path. For the first tapping of the 15-20 mm English coke experiment and throughout the English coke 5-10 mm experiment, the furnace resistance increases for a short period of time as the furnace is tapped. This may be due to the slag that is tapped out of the furnace. However, since the furnace resistance is not affected during the last 5 taps of the English coke 15-20 mm experiment. It may be that the changes seen in the English coke 5-10 mm experiment is due to geometrical changes of the coke bed. This may also be the explanation of the higher variations in the resistance seen for the English coke 5-10 mm experiment.
4.3 Furnace cross sections and the coke bed geometry
The shape of the coke bed is, as previously mentioned, determined by outlining the lowest ore and sinter particles, see Figures 4 and 6. Based on these pictures a simplified coke bed geometry was determined for each case, as shown in Figures 5 and 7. For both experiments an asymmetric coke bed is seen, where the coke bed height is lower at the tap hole side, the right side for the English coke 5-10 mm experiment and the left side for the English coke 15-20 mm experiments. Observations during the experiment indicate that the vertical velocity of the raw materials was higher on the tap hole side compared to the non-tap hole side, in the following called the opposite side.
reductants
The Twelfth International Ferroalloys CongressSustainable Future
June 6 – 9, 2010Helsinki, Finland
355
Figure 4: Furnace cross section of English coke 5-10 mm experiment. Ore particles outlined.
Figure 5: Furnace model used for determining the coke bed resistivity of the English coke 5-10 mm experiment.
Figure 6: Furnace cross section of English coke 15-20 mm experiment. Ore particles outlined.
Figure 7: Furnace model used for calculating the coke bed resistivity of the English coke 15-20 mm experiment.
The electrode had an initial diameter of approximately 150 mm prior in both the experiments. In both the experiments a neck developed on the bottom part of the electrode, see Figures 5 and 7. Beneath the electrode there is a cavity in both cross sections. This has been reported also for previous experiments, e.g. [22]. This is probably due to a combination of two factors; 1) settling of the charge after the furnace has been turned off and 2) low radial mass flow below the electrode tip. The cavity is, as shown in Figures 5 and 7, included in the simulations.
reductants
The Twelfth International Ferroalloys CongressSustainable Future
June 6 – 9, 2010Helsinki, Finland
356
4.4 The electrical resistivity of the coke bed
The coke bed resistivity estimated using the multiphysics modeling software was found to be between 1.71⋅10-3 Ω·m and 2.2⋅10-3 Ω·m for the English coke 5-10 mm experiment and between 0.95⋅10-3 Ω·m and 1.62⋅10-3 Ω·m for the English coke 15-20 mm experiment, see Table 9. These results are comparable to what was found by Røhmen [17]. By comparison the measured electrical resistivity of a dry coke bed is 4.67 ± 0.30⋅10-3 Ω⋅m and 3.71 ± 0.45⋅10-3 Ω⋅m for English coke 5-10 mm and English coke 15-20 mm respectively [23]. From this it seems as though an increased coke particle size gives a lower electrical resistivity of the coke bed. Although this is only based on two experiments, the result that the electrical resistivity of the coke bed decreases with increasing particle size is supported by investigations of the dry coke beds [7-10, 12-13, 23-24]. It is also supported by work in a pilot furnace at ERAMET RESEARCH, which lead to similar conclusions [25].
Table 9: The estimated coke bed resistivities of both the experiments have been based on either the tap hole side of the furnace or the opposite half of the cross section of the furnace. All the calculations have been based on axial symmetry.
Condition English coke 5-10 mm [10-3 Ω⋅m]
English coke 15-20 mm [10-3 Ω⋅m]
Tap hole side 2.0 1.11 Opposite side 1.94 1.41 -10 % coke bed radius, tap hole side 1.80 0.95 +10 % coke bed radius, tap hole side 2.2 1.26 -10 % coke bed radius, opposite side 1.71 1.21 +10 % coke bed radius, opposite side 2.2 1.62 -10 % electrode tip position, tap hole side 2.2 1.24 +10 % electrode tip position, tap hole side 1.71 0.99 -10 % electrode tip position, opposite side 2.2 1.54 +10 % electrode tip position, opposite side 1.72 1.31 HCFeMn and the SiMn experiments is thought to be due to a more significant fraction of the current being conducted through the slag in the HCFeMn experiments compared to the SiMn experiments. This was also the result of simulations of coke particles submerged in slag [19]. The simulations showed that the main electrical conductor of current in the coke bed is the metallurgical coke, but that the presence of slag decreases the particle-to-particle contact resistance between the coke particles. This is because the material resistivity of the English coke, i.e. the electrical resistivity of the material that the coke particles are made up of, is measured as 0.127 ± 0.041⋅10-3 Ω⋅m [19], i.e. only a fraction of the resistivity of the slag. It is worth noticing that the measurements by Segers et al. [16] are on synthetic slags, and that the exact composition of the slags from the experiments could not be matched. The uncertainty of the calculation is assessed through estimating the resistivity of the coke bed both for the tap hole side and the opposite side. In addition single parameters such as the electrode tip position and the width of the coke bed and the cavity shape have been varied to assess the sensitivity due to these factors. The coke bed width and the electrode tip position was found to have the largest influence on the resistivity and is thus the only variable included in the results. Comparing the charge height of the experiments, see Figures 4 and 6, it is possible to see that the charge height of the English coke 5-10 mm experiment is approximately 10 cm lower compared to the charge height of the English coke 15-20 mm experiment. This difference in charge height may have caused the observed difference in the coke bed size. In other words, that the larger coke bed size observed for the English coke 15-20 mm experiment is due to the charge being higher. The effect of a larger coke bed size is that the estimated coke bed resistivity is higher. If one assumes that the same coke bed height would have given the same accumulation of coke, then difference between the estimates of the coke bed resistivities would have been larger. At the same time, a higher charge will increase the force on the coke bed and thus decrease the coke bed resistivity. This is an effect that causes an increased difference in the estimated resistivties.
reductants
The Twelfth International Ferroalloys CongressSustainable Future
June 6 – 9, 2010Helsinki, Finland
357
5 INDUSTRIAL EXPERIENCE AND APPLICATION A full scale industrial trial at Eramet Norway has given the same results as the laboratory investigations, indicating that also for an industrial submerged arc furnace a smaller sized metallurgical coke gives a higher electrical resistivity of the coke bed. In this particular test three types of coke were used. Metallurgical coke A and B with a particle size range of 5-25 mm and coke C that had been screened to a particle size range of approximately 5-10 mm. The results show that using coke C gave a higher coke bed resistivity compared to coke A and B. Previous measurements of the bulk resistivity of coke A and B, in an apparatus as described by Eidem et al. [13], show that coke A and B has a bulk resistivity comparable to the metallurgical cokes published in [13]. It is thus thought that the observed change in the coke bed resistivity of the industrial test is due to the particle size and not due to the possible difference in bulk resistivity between cokes A, B and C. The operational parameters did not reveal any significant change in the coke bed size or slag chemistry within the test period. By using a smaller particle size on industrial submerged arc furnace the electrode tip position can be deeper. A deeper electrode tip position is believed to give a more stable operation, that is an increased prereduction, better slag-metal separation and better tapping conditions due to the higher temperature in the lower parts of the furnace. The permeability of the charge is also thought to decrease with decreasing particle size. If very small particles are used, e.g. below 1-5 mm, it is thought that this may increase the risk of bridging and slag boiling.
6 CONCLUSIONS The estimated electrical resistivity of the coke beds found in the two experiments is 1.71 - 2.2⋅10-3 Ω·m for the English coke 5-10 mm experiment and 0.95 - 1.62⋅10-3 Ω·m for the English coke 15-20 mm experiment. Supported by previous findings of the electrical resistivity of dry coke beds, it may be concluded that an increasing particle size leads to a decreasing coke bed resistivity. Using a smaller particle size industrially can be used to to get an electrode tip position closer to the metal bath. This is thought to give a more stable operation.
7 REFERENCES [1] Barcza, N.A., Koursaris, A., See, J.B. and Gericke, W.A., “The ‘Dig Out’ of a 75 MVA High-Carbon
Ferromanganese Electric Smelting Furnace”, Proceedings of the 37th Electric Furnace Conference, 1979, Detroit, USA, pp. 19-33.
[2] Yoneka, S., Harada, K., Kojima, K., Nakagawa, K., “Considerations of electric furnace dimension & dynamic operation based on research”, Journal francais de l'électrothermie, 1(1981), pp.29-34.
[3] Ringdalen, E. and Eilertsen, J., “Excavation of a 54 MVA HC-ferrochromium furnace”, Proceedings of the Ninth International Congress on Ferroalloys; INFACON 9, 2001, Quebec City, pp.166-173.
[4] Olsen, S.E. and Tangstad, M., “Silicomanganese Production – Process Understanding”, Proceedings of the Tenth International Congress on Ferroalloys; INFACON X, Cape Town, South Africa, 2004, pp.231-238.
[5] Dhainaut, M., “Simulation of the electric field in a submerged arc furnace”, Proceedings of the Tenth International Ferroalloy Congress; INFACON X, 2004, Cape Town, South Africa, pp.605-613.
[6] Bakken, J.A. and Wærnes, A.N., "Elektrisk ledningsevne i chargematerialer”, Report no. 341173.10/ANW/11b, SINTEF, Trondheim, Norway, 1986.
[7] Dijs, H.M. and Smith, D.J., “Factors affecting the resistivity and reactivity of carbonaceous reducing agents for the electric-smelting industry”, J S Afr Inst Min Metall, 1980, pp.286-296.
[8] Willand, K., “Measurement of the Electrical Resistance of Ferrochromium Furnace Charges”, Report, National Institute for Metallurgy, Johannesburg, South Africa, 1975.
[9] Krogerus, H., Lintumaa, T., Jokinen, P., “Laboratory Investigations of the Electrical Resistivity of Cokes and Smelting Charge for Optimizing Operation in Large Ferrochrome Furnaces”, Proceedings of the Southern African Pyrometallurgy 2006 Intl. Conference, Johannesburg, South Africa, 2006, pp.309-328.
[10] Downing, J.H. and Urban, L., “Electrical Conduction in Submerged Arc Furnaces”, JOM, 1966, pp.337-342.
reductants
The Twelfth International Ferroalloys CongressSustainable Future
June 6 – 9, 2010Helsinki, Finland
358
[11] Eidem, P.A., Tangstad, M., Bakken, J.A., “Measurement of Material Resistivity and Contact Resistance of Metallurgical Coke”, Proceedings of the INFACON XI, 2007, Delhi, India, pp.561-571.
[12] Lorenz, V.M. and Marincek, B., “Der electrische Widerstand der Möllerstoffe im Elektro-Verhüttungsofen”, Schweizer Archiv, 35 (1969), pp.91-103.
[13] Eidem, P.A., Tangstad, M., and Bakken, J.A., “Determination of Electrical Resistivity of Dry Coke Beds”, Metall. Mater. Trans. B, 39B(2008), pp.7-15.
[14] Eric, R.H., Hejja, A.A., and Stange, W., “Liauidus Temperature and Electrical Conductivities of Synthetic Ferromanganese Slag”, Miner Eng, 4(1991)12, pp.1315-1332.
[15] Woollacott, L.C., Howat, D.D., Jochens, P.R., “The Viscosities and Electrical Conductivities of Slag Associated with the Production of High-carbon Ferromanganese Alloys”, Proceedings of the INFACON 74, Johannesburg, South Africa, 1975, pp.227-232.
[16] Segers, L., Fontana, A., Winand, R., “Electrical Conductivity of Molten Slags of the System SiO2-Al2O3-MnO-CaO-MgO”, Can. Metall. Q., 22(1983)4, pp.429-435.
[17] Røhmen, C.M., “FeMn Pilot Scale Experiments”, Report no. 2002/33, Eramet Norway AS, 2002. [18] Sævarsdóttir, G.A., “High current AC arcs in silicon and ferrosilicon furnaces”, PhD Thesis, NTNU,
Trondheim, Norway, 2002. [19] Eidem, P.A., “Electrical Resistivity of Coke Beds”, Doctoral Theses at NTNU, 2008:279, NTNU
(Norwegian Universtiy of Science and Technology), Trondheim, Norway, 2008. Digitally available at: http://ntnu.diva-portal.org/smash/get/diva2:132857/FULLTEXT01
[20] Tangstad, M., “The High Carbon Ferromanganese Process - Coke Bed Relations”, PhD Thesis, The Norwegian Institute of Technology, Trondheim, Norway, 1996.
[21] Miyauchi, Y., Mochida, M., Fuchi, Y., “High Thermal Electrical Property of Manganese Ore in Production of High Carbon Ferromanganese”, Proceedings of the 9th Internationan Ferroalloy Congress: INFACON 9, Quebec City, Canada, 2001, pp.236-243.
[22] Eidem, P.A., Tangstad, M., and Bakken, J.A., “Electrical conditions of a coke bed in SiMn production”, Can. Metall. Q., accepted for publication May 2009.
[23] Eidem, P.A., Runde, M., Tangstad, M., Bakken, J.A., Zhou, Z., You, A.B., “Effect of Contact Resistance on Bulk Resistivity of Coke Beds”, Metall. Mater. Trans. B, 40B(2009)3, pp. 388.
[24] Mazumdar, S.K. and Mitra, B., “A Study of the Electrical Resistivity of Chemical Coke & Other Heat-treated Carbonaceous Materials”, Indian J. Tech., 10(1972), pp.404-407.
[25] Soller, A., Amalric, A., Pochart, G., Nussbaum, G., “Manganese Ore and Alloys Piloting Tools at Eramet Research”, to be published in the Proceedings of the 12th International Ferroalloy Congress: INFACON XII, Helsinki, Finland, 6-9th of June, 2010.