Influence of drying method on the material properties of nanocellulose I thermostability and crystallinity
Yucheng Peng middot Douglas J Gardner middot Yousoo Han middot Alper Kiziltas middot Zhiyong Cai middot Mandla A Tshabalala
Received 1 February 2013Accepted 4 August 2013 copy Springer Science+Business Media Dordrecht 2013
Abstract The effect of drying method on selected material properties of nanocellulose was investigated Samples of nanofibrillated cellulose (NFC) and cellushylose nanocrystals (CNC) were each subjected to four separate drying methods air-drying freeze-drying spray-drying and supercritical-drying The thermal stability and crystallinity of the dried nanocellulose were evaluated using thermogravimetric analysis (TGA) and X-ray diffraction Supercritical-drying produced NFCs with the least thermal stability and the lowest crystallinity index Air-drying or spray-drying produced NFCs which were more thermally stable compared with freeze-dried NFCs The CNCs dried by the three methods (air-drying freeze-drying
Y Peng middot D J Gardner middot Y Han middot A Kiziltas Advanced Structures and Composites Center University of Maine 35 Flagstaff Road Orono ME 04469 USA e-mail douglasgmaineedu
Y Peng middot D J Gardner middot Y Han middot A Kiziltas School of Forest Resources University of Maine 35 Flagstaff Road Orono ME 04469 USA
A Kiziltas Department of Forest Industry Engineering Faculty of Forestry University of Bartin 74100 Bartin Turkey
Z Cai middot M A Tshabalala Forest Products Laboratory USDA Forest Service One Gifford Pinchot Drive Madison Wl 53726-2398 USA
and spray-drying) have similar onset temperature of thermal degradation The different drying methods resulted in various char weight percentages at 600 degC for the dried NFCs or CNCs from TGA measurements The dried NFCs are pure cellulose I while the dried CNCs consist of cellulose I and II The calculated crystallinity indices differ with each drying method The cellulose II content in CNCs changes as a function of drying method For the application of nanocellulose in non polar thermoplastics spray-dried products are recommended according to their higher thermal stashybility and higher crystallinity index
Nanocellulose as a new generation of nano-scale material from forest products has received considerable attention (Wegner andJones 2006 Eichhorn etal 2010 Habibi et al 2010 Siqueira et al 2010 Moon et al 2011 Klemm et al 2011) Cellulose is the primary structural building block of trees and other plants and can be economically extracted from the wood fibersndash an abundant and renewable resource Regardless of its source cellulose can be characterized as a high molecular weight linear homopolymer composed of D-anhydroglucopyranose units (AGU) which are linked
Published online 11 August 2013 Springer
Cellulose
together by szlig-(1 4)-glycosidic bonds (Klemm et al 1998) In woody plants these cellulose linear chains aggregate to highly ordered structures referred to as nanofibrils or elementary fibrils These nanofibrils of cellulose are then packed into larger units to form microfibrils which in turn are assembled into cellulose fibers such as the pulp fibers Nanofibrils in the woody plant are nano-scale fibers with average cross-sectional dimensions of about 10 nm times 35 nm They consist of crystalline and amorphous domains with cellulose chains parallel to the nanofibril axis (Fengel and Wegener 1998 Chakraborty et al 2005 Gardner et al 2008) The nanofibrils are generally produced from the wood fiber plant fiber pulp fiber microcrystalline cellulose (MCC) and microfibrillated cellulose (MFC) using mechanical or chemical methods (Moon et al 2011) Processing dilute slurries of cellulose fibers including wood fiber plant fiber and pulp fiber by grinding or high-pressure homogenizing action proshyduces nanofibrillated cellulose (NFC) (Herrick et al 1983 Moon et al 2011) while digestion of amorphous cellulosic domains of the raw materials through an acid hydrolysis process produces cellulose nanocrystals (CNC) (Hubbe et al 2008) During the mechanical fibrillation process the treatment of the raw materials with oxidation mediated by 2 2 6 6-tetramethylpipershyidine-1-oxyl (TEMPO) radical facilitates the disinteshygration of the materials into individual nanofibrils (Saito et al 2006) NFC can also be utilized as a raw material for producing CNC These nanocellulose suspensions including CNC and NFC suspensions are produced on the pilot scale and are commercially available in US and Canada (Bloch 2011 Ferguson 2012 Wallace 2012)
Each AGU of a cellulose chain possesses three hydroxyl groups at C-2 C-3 and C-6 positions which can form hydrogen bonds An extended network of hydrogen bonds consisting of inter- and intra-molecshyular bonds is responsible for the aggregation of cellulose chains which form the crystalline and amorshyphous regions The high mechanical properties of cellulose fibers are also attributed to the formation of complicated hydrogen bonding networks among celshylulose chains The Youngs modulus of the crystalline domain has values that range from 115 to 140 GPa (Sakurada et al 1962 Matsuo et al 1990 Nishino etal 1995 Ishikawa et al 1997) Youngs modulus meashysured in the direction perpendicular to the chain axis was recently reported to be 148 plusmn 08 GPa and in the chain axis direction it was reported to be 220 plusmn 50 GPa
(Diddens et al 2008) Compared with stainless steel the strength-to-weight ratio of cellulose nanocrystals (CNCs) is said to be eight times higher (Ferguson 2012 Cranston et al 2012) Because of their relatively high mechanical properties nanocellulose has great potenshytial as reinforcement in new bio composites innovative bio plastics and advanced reinforced composite materials Because nanocellulose fibrils are produced as aqueous slurries that cannot be used as such in the manufacture of plastic composites new drying techshyniques of the nanocellulose suspensions are required A highly desirable feature of a good drying method is preservation of the morphology of the nanocellulose and its properties In a previous study four drying methods were investigated (Peng et al 2012a) The study showed that three methods [freeze-drying (FD) supercritical-drying (SCD) and spray-drying (SD)] produced nano-scale cellulose fibrils
From the point view of producing a dry form of nanocellulose for developing natural fiber reinforced thermoplastics two material properties must be conshysidered thermal stability and crystallinity In the extrusion of plastic composites reinforced with lignoshycellulosic fibers the compounding temperature of the composite is commonly restricted to about 200 degC because lignocellulosic materials start to degrade at approximately 230 degC Cellulose the most thermally stable constituent in the lignocellulosic materials has a glass transition temperature in the range of 200-230degC and thermal decomposition starts at about 260 degC (Goring 1963 Gardner et al 2008) The thermal stability of nanocellulose compared with traditional cellulose fibers may be influenced by various factors including processing conditions and their high surface to volume ratio Indeed one study showed that the thermal stability of dried nanofibrilshylated cellulose (NFC) decreased as a result of homogshyenization and drying processes (Quievy et al 2010) For CNCs obtained by chemical hydrolysis using sulfuric acid the presence of sulfate groups on the cellulose surface decreased their thermal stability (Roman and Winter 2004) Freeze and air-drying were also observed to have some influence on the thermal stability of CNC (Raumlmaumlnen et al 2012)
A high modulus of elasticity is expected from highly crystalline cellulose material The Youngrsquos modulus of cellulose material depends on its crystallinity and the interaction of amorphous and crystalline regions (Cabrera et al 2011) The arrangement of crystalline
Springer
Cellulose
and amorphous regions of cellulose fiber is proposed as ldquolongitudinally arranged molecules change from one ordered region to the subsequent one the transition areas being less ordered regionsrdquo (Fengel and Wegener 1998 Chakraborty et al 2005) In the study of Cabrera et al (2011) the Youngrsquos modulus of crystalline part was measured as 200-355 GPa while the bulk modulus of cellulose was measured as 20 GPa indicating the superior mechanical properties of the crystalline region compared to the amorphous region As a result the higher crystallinity of nanocellulose may result in potentially higher mechanical properties in reinforced composites according to the rule of mixtures On the other hand the waterholding capacity of nanocellulose is related to its crystallinity When nanocellulose fibrils are included in composites the absorption of water by cellulose fibrils severely degrades the properties of the composites (Espert et al 2004) According to Nakamshyura et al (1981) the amount of freezing bound water decreases with increasing degree of crystallinity in cellulose fibers The effect of various drying methods on the crystallinity of dissolving-grade sulphite pulp was studied by Kouris et al (1958) The drying methods included air drying oven drying freeze drying and freeze drying with a series of solvent exchanges in the cellulose pulp The results indicated that no change in the crystallinity index occurred except a lower value was obtained from freeze drying cellulose fibers in benzene
The present study focuses on the effect of different drying methods on the crystallinity and thermal properties of CNCs and NFCs Samples of NFC and CNC suspensions were dried by freeze-drying supershycritical-drying or spray-drying The thermal propershyties of dried products were characterized by thermogravimetric analysis (TGA) The crystalline structure of nanocellulose was investigated by X-ray diffraction (XRD) Air-dried suspensions were used as controls The effect of different drying methods on the thermostability and crystalline structures of NFCs and CNCs is discussed
Experimental
Suspension preparation and drying
The NFC suspension was a commercial product ARBOCEL MF40-10 at 10 wt from J Rettenmaier
amp Sohne GMBH + COKG Germany The CNC suspension at 65 wt was obtained from the Forest Products Laboratory in Madison Wisconsin Before drying distilled water was added into the original suspensions and mixed using a Speed Mixerreg (Flack Tek Inc US) for 4 min at 2000 rpm to obtain final weight concentration of CNC and NFC suspensions at 2 wt
Different drying methods were applied to the nanoshycellulose suspensions at 2 wt including NFC and CNC suspensionsjust after mixing Air-drying (AD) of the two different suspensions was performed in a conditioning room with relative humidity of 65 plusmn 5 and temperature of 20 plusmn 2 degC The suspensions were allowedto settle to a constant weight in plastic containers before collection Prior to freeze-drying (FD) CNF suspensions (about 20 ml) were frozen in vials at a temperature of -80degC for 24 h Frozen suspensions were then transferred to a Virtis Freezemobile 25 SL freeze dryer which has a condenser temperature of ndash 80 degC and a vacuum of 11 mTorr Lyophilization was allowedto continue for 72 h Supercritical drying (SCD) of the prepared suspension was conducted on the Tousimis Samdri PVT-3 Critical-Point dryer Four steps were involved in this process (1) dehydration of CNF suspension with a series of ethanol solutions (50 75 95 and 100 ) until water was completely replaced with ethanol (2) replacement of ethanol with liquid CO2 (3) pressurization and heating of the liquid CO2 and the cellulose mixture to the supercritical conditions and (4) slow decompression of the supercritical CO2 to atmoshyspheric pressure Spray-drying of the CNF suspensions was conducted using a Buchi Mini Spray Dryer B-290 laboratory spray dryer (New Castle DE USA) High purity nitrogen gas was used as an injected gas to form the suspension droplets The spray-drying process is detailed in Peng et al (2012a and b) In this study nanocellulose suspensions were dried at an inlet temshyperature of 175 degC gas flow rate of 540 1h pump rate of 45 mlmin and drying gas flow rate of approximately 35 m3h The outlet temperatures of the spray-dryer measured for the NFCs and CNCs were 89 and 92 degC respectively All the dried NFCs and CNCs were put in plastic bags and stored in a desiccator at ambient temperature to prevent moisture absorption
Thermogravimetric analysis (TGA)
Thermal properties of dried nanocellulose and a commercial product of microcrystalline cellulose
Springer
Cellulose
(MCC) with the brand name of Emcocelreg SP15 from Rettenmaier and Sohne GMBH + COKG (Germany) which was used a control were characshyterized using a Mettler Toledo System consisting of the STARe Software and the TGASDTA851e modshyule All tests were performed in a nitrogen atmosphere with a ceramic sample pan Analysis of individual nanocellulose samples weighing 1-2 mg was carried out at a constant heating rate of 10 degCmin between 25 to 600 degC Each sample was tested in triplicate The TGA thermal curve was displayed as weight percent () versus temperature After the TGA test the residual nanocellulose fibrils were examined by scanshyning electron microscopy
Scanning electron microscopy (SEM)
The morphologies of the air-dried samples were studied by SEM using an AMR 1000 (AMRay Co) scanning electron microscope All samples were sputter-coated with gold before the microscopic observations were obtained SEM images were taken at an accelerating voltage of 10 kV at various magnifications The samples of dried nanocellulose after TGA testing were directly studied by SEM using the Hitachi Tabletop Microscope SEM TM 3000 (Hitachi High-Technologies Corporation Tokyo Japan) at an accelerating voltage of 15 kV
X-ray diffraction (XRD) characterization
XRD analyses of dried nanocellulose were performed on a high resolution X-ray diffractometer (Model XrsquoPert PRO Philips PANalytical Netherlands) with nickel-filtered copper (0154 nm) radiation genershyated at 45 kV and 40 mA The dried nanocellulose materials were pressed manually into cylindrical wafers with a diameter of 2 cm and thickness of 005-01cm using a Dake Press (Drake Grand Falls MI) A silicon zero background plate was used to calibrate the effect of sample holder and to make sure no signal was generated from the sample holder The same sample holder position and sample holder (holder and silicon zero background plate) were used for all experiments Scans were obtained from 5deg to 40 20 in 002 degree steps for 25 s per step Subtraction of background intensity from the meashysured intensity of nanocellulose samples was pershyformed first and then normalization of the maximum
peak intensity of nanocellulose materials to an intenshysity of 10000 was conducted Crystallinity index (CI) of dried nanocellulose samples was calculated using the empirical method described by Segal et al (1959) The equation is shown in the following
where I200 is the maximum intensity of the principal peak (200) lattice diffraction (at 227deg of for cellulose I and 217deg of 20 for cellulose II) and Iam is the intensity of diffraction attributed to amorphous cellulose (at 18deg of 20 for cellulose I and at 16deg of 20 for cellulose II) (Segal et al 1959 Azubuike et al 2012 French and Sntiago Cintroacuten 2013) This method is convenient and quick to determine the relative crystallinity of nanocellulose which can be used for relative comparisons A comparison of CI of the nanocellulose including NFCs and CNCs caused by different drying methods was conducted The effect of different drying methods on the crystallinity of nanocellulose was also evaluated using the methods of Gjoslashnnea and Norman (1958 1960)
Results and discussion
Thermal properties of dried nanocellulose
Thermal properties of cellulosic materials have been intensively studied (Shafizadeh 1984 Maschio et al 1992 Li et al 2001 Shen and Gu 2009 Peng et al 2011) Cellulose as one of the main components its thermal decomposition is principally responsible for the production of flammable volatiles which are released through dehydration hydrolysis oxidation decarboxshyylation and transglycosylation (Levan 1989) The pathway of thermal decomposition and the composition of the cellulose fibers (residual hemicelluloses) are influenced by many physical and chemical factors such as temperature type of atmosphere size and texture of the cellulose sample crystallinity presence of impurishyties such as metals and other parameters (Shafizadeh 1984) The thermal behavior of dried nanocellulose including NFC and CNC was characterized by thershymogravimetric analysis (TGA) in nitrogen
Representative TGA curves of dried NFC and CNC at a heating rate of 10 degCmin are shown in Figs l a and 2a The results of the three tests for each sample
Springer
Cellulose
were consistent Based on the weight percentage change as a function of temperature each TGA curve can be divided into three regions For example region I of the TGA curve of the MCC control sample is defined as the initial mass loss portion found from 25 degC to about 216 degC In region I the slight mass loss is below 31 plusmn 01 (The standard deviation is calculated based on the three measurements) and is mainly caused by the evaporation of water from the cellulosic samples No thermal degradation occurred in this region The detailed TGA curve of the MCC sample in region I is shown in Figs l b and 2b For the MCC sample in region I the mass loss increased to about 31 at 110 degC and continued at a plateau until about 216 degC (Fig lb) Region II for the MCC sample in the TGA curve (Fig la) is defined as the major mass loss stage starting at the temperature where the mass loss deviated from the plateau region (about 216 degC in Fig lb) The temperature of 216 degC (the ending temperature of region I shown in Table 1) is defined as the onset temperature of thermal degradashytion for the MCC sample In region II two different degradation mechanisms were proposed by Kilzer and Broido (1965) (1) dehydration of cellulose by an endothermic process to produce ldquodehydrocelluloserdquo
between about 200 and 280 degC and (2) depolymershyization of cellulose in competition with dehydration between 280 and 340 degC resulting in the formation of volatiles Decomposition of dehydrocellulose formed in the first path into gases and char residue becomes dominant at about 320 degC Evolution of CO2 H2O and CO with formation of solid char is mainly observed If depolymerization occurs more extensively than dehyshydration volatilization of tar (high boiling products HPB) mostly composed of levoglucosan is observed The HBP might further decompose with the producshytion of light flammable gases if it is not promptly removed from the heating zone The mass residue and temperature at the end of region II are 125 plusmn 03 wt and 358 degC as shown in Table 1 After region II the mass loss rate of the cellulosic samples decreased (Fig 1a) The TGA curve starting from this point to the final testing temperature of 600 degC is defined as region III For the MCC sample region III starts at a temperature of 358 degC In region III at a temperature above 500 degC the levoglucosan breaks down to provide a variety of low molecular weight fission products including hydrocarbons and hydrogen as well as CO CO2 and H2O Secondary reactions may occur in the gas phase as further decomposition of
Springer
Cellulose
levoglucosan in the solid phase as the condensation and crosslinking of intermediate chars to highly condensed polycyclic aromatic structures or by interaction of both phases as gasification of char by reaction with H2O and CO2 at high temperatures to produce CO and H2 (Shafizadeh 1982) At a tempershyature of 600 degC the final char residue for the MCC sample is 54 plusmn 03 wt (Table 1)
The dried NFCs showed similar thermal behaviors compared to the MCC sample (Fig la) A close-up examination of region I in Fig l b indicated that the dried NFCs showed almost the same TGA curve trend as the MCC sample The elimination of residual water from the NFC samples occurs first with increasing temperature and then a plateau of constant mass of the dried NFC is reached as all the residual moisture evaporates A similar mass loss rate was observed at the beginning of region I for all the samples (Fig lb) indicating that the water content within the dried NFC samples was the same for the samples dried by the different methods The evaporation rate appears to be consistent Depending on the amount of the residual water in the dried NFCs the plateau temperatures are not the same Supercritical-dried NFCs reach the plateau temperature first with the least mass loss of 19 plusmn 01 indicating that supercritical-drying proshyduced NFCs with about 19 moisture content (Table 1) Freeze-dried (31 plusmn 06) and spray-dried (28 plusmn 01) NFCs have a similar moisture content while the commercial MCC sample has a moisture content of 31 The residual moisture contents for
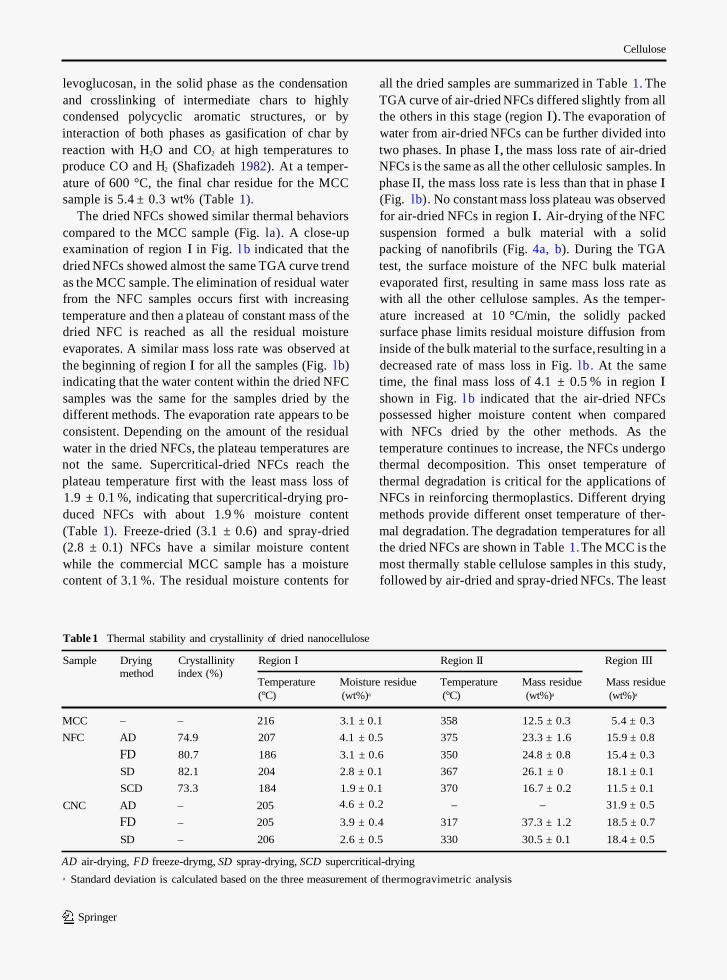
Table 1 Thermal stability and crystallinity of dried nanocellulose
all the dried samples are summarized in Table 1 The TGA curve of air-dried NFCs differed slightly from all the others in this stage (region I) The evaporation of water from air-dried NFCs can be further divided into two phases In phase I the mass loss rate of air-dried NFCs is the same as all the other cellulosic samples In phase II the mass loss rate is less than that in phase I (Fig lb) No constant mass loss plateau was observed for air-dried NFCs in region I Air-drying of the NFC suspension formed a bulk material with a solid packing of nanofibrils (Fig 4a b) During the TGA test the surface moisture of the NFC bulk material evaporated first resulting in same mass loss rate as with all the other cellulose samples As the tempershyature increased at 10 degCmin the solidly packed surface phase limits residual moisture diffusion from inside of the bulk material to the surface resulting in a decreased rate of mass loss in Fig lb At the same time the final mass loss of 41 plusmn 05 in region I shown in Fig l b indicated that the air-dried NFCs possessed higher moisture content when compared with NFCs dried by the other methods As the temperature continues to increase the NFCs undergo thermal decomposition This onset temperature of thermal degradation is critical for the applications of NFCs in reinforcing thermoplastics Different drying methods provide different onset temperature of thershymal degradation The degradation temperatures for all the dried NFCs are shown in Table 1 The MCC is the most thermally stable cellulose samples in this study followed by air-dried and spray-dried NFCs The least
Sample Drying Crystallinity Region I Region II Region III method index ()
Temperature Moisture residue Temperature Mass residue Mass residue (degC) (wt)a (degC) (wt)a (wt)a
AD air-drying FD freeze-drymg SD spray-drying SCD supercritical-drying a Standard deviation is calculated based on the three measurement of thermogravimetric analysis
Springer
Cellulose
thermally stable sample is supercritical-dried and freeze-dried NFCs During the thermal degradation processes in the regions II and III cellulose samples dried by different methods showed different results The ending temperatures of region II are different for the NFCs dried by different methods (Table 1) Air-dried NFCs end region II at the highest temperature of 375 degC among all the dried NFCs and the ending temperature for the spray-dried NFCs is 367 degC Under the same temperature of region II the mass residue of air-dried NFCs is higher than that of spray-dried NFCs followed by freeze-dried and supercritshyical-dried NFCs The TGA curve of freeze-dried NFCs in region II almost completely overlaps with those of supercritical-dried samples (Fig la) However they performed differently in region III and freeze-dried NFCs enter the region III at a lower temperature (350 degC) than those of supercritical-dried materials (370 degC) (Table 1) The mass residue of freeze-dried NFC in region III is much higher than that of supercritical-dried materials The final char residue of freeze-dried NFCs at 600 degCis about 154 plusmn 03 while the value for supercritical-dried NFCs is about 115 plusmn 01 The behavior of the air-dried NFCs was
the same as the freeze-dried NFCs in region III except the different starting temperatures (Table 1) Spray-dried NFCs have the highest char residue among all the samples in region III and the final char residue at 600 Cis about 181 plusmn 01 Air-drying NFC susshypensions formed solidly packed material (Fig 4a b) while the other three drying methods formed nanoshystructured materials (Peng et al 2012a b) Compared with air-dried material the other three drying methods provide higher surface area for the same weight of the cellulose material resulting in the greater mass loss rates in region II of thermal decomposition via the TGA tests At the same time supercritical-drying produced finely divided smaller diameter nanocellushylose fibrils while freeze-drying and spray-drying produced larger sized nanocellulose fibrils (Peng et al 2012a) As a result the final mass residue of supercritical-dried NFCs is the lowest For spray-dried NFCs agglomerated fibrils or irregular shaped mateshyrials were formed (Peng et al 2012a b) During the process of water evaporation at relatively high temshyperature the surface nanofibrils become closely packed forming a solid shell layer The thermal degradation of the spray-dried NFCs started on the surface first and then a compact charcoal protection layer formed to reduce thermal degradation of the inner fibrils This behavior is validated by the microshygraph shown in Fig 4a The spray-dried NFC single fibrils and agglomerates retain their original shape during the TGA test up to 600 degC Finally the highest char residue was observed for the spray-dried NFCs During air-drying the long drying time precipitated the larger sized NFC fragments at the bottom of the drying container After drying a solid packed top surface and porous structured bottom surface were formed (Fig 4c d) For spray-dried NFCs as shown in Fig 4e agglomerated fibrous and spherical NFCs were produced (Peng et al 2012b) As a result the packing of nanofibrils for air-dried NFCs is not as tight as the nanofibrils produced by spray-drying NFCs indicating the lower final mass residue of the air-dried NFCs For freeze-drying the nanofibrils were first confined in the space between ice crystals during the freezing process (Svagan et al 2008 Sehaqui et al 2010) increasing the concentration of nanofibrils locally At this point the interaction among nanocelshylulose fibrils is enhanced and the nanofibrils form a similar agglomerate structure as occurring in the case of the air-drying process This would explain the
Springer
Cellulose
Fig 4 SEM mcrographs a TGA test residues of spray-dried NFCs b TGA test residues of spray-dried CNCS c air-dried NFC top surface d air dried NFC bottom surface e spray dried NFC and f air dried CNC
identical thermal behaviors and similar char residues of the freeze-dried and air-dried NFCs in region III (Fig la Table 1)
The first derivative curves of the TGA (DTG) scans for the dried NFCs are shown in Fig 3a DTG curves represent the mass loss rate of the materials at different temperatures For the dried NFCs two peaks are observed in the DTG curves The first small peak represents the mass loss caused by the residual moisture evaporation which is identified in region I of the TGA curves The second peak is a continuous phase and mainly represents the major mass loss stage This peak starts from the onset temperature of thermal degradation until the final testing temperature of
600 degC The onset temperatures for the second peak are different among the NFCs dried by different methods which were previously discussed for the TGA scans At the same temperature the different values observed in the DTG curves in the second peak phase indicate that the NFC samples dried by various drying methods have different mass loss rates From the vertex point of the second DTG peak the temperature of the greatest mass loss rate can be extracted From Fig 3a the temperatures of the greatest mass loss rate for the dried NFCs are identified as 363 degC for air-dried sample 340 degC for spray-dried and supercritical-dried samples and 328 degC for freeze-dried sample
Springer
Cellulose
Supercritical-drying of CNC suspension was not possible in this study (Peng et al 2012a) The thermal behaviors of the CNC dried by other methods are similar with those of NFCs and the TGA curves are shown in Fig 2a and b Simultaneously the DTG curves are shown in Fig 3b The CNCs were less thermally stable than the MCC sample Analysis of the thermal behaviors of dried CNC in region I showed that (1) spray-dried CNC has similar moisture content (26 plusmn 05 ) with those of spray-dried NFCs (28 plusmn 01 ) (2) Freeze-dried CNC has slightly higher moisture content (39 plusmn 04 ) than both freeze-dried NFCs (31 plusmn 06 ) and spray-dried CNC (26 plusmn 05 ) The water evaporation region can also be identified in the DTG curves shown in Fig 3b At the same time the thermal behavior of air-dried CNC differs from all the other cellulose samples under the testing conditions For the freeze-dried and spray-dried CNC samples a plateau of mass residue occurred before the onset temperature of thermal degradation For air-dried CNC material the initial mass loss increased linearly with increasing tempershyature until the onset temperature of thermal degradashytion (205 degC) The CNC mass loss rate of the air-dried sample is also less than those of freeze-dried and spray-dried samples The low mass loss rate can be demonstrated by the DTG curves shown in Fig 3b The low mass loss rate indicates that the evaporation of water from air-dried CNC is more difficult than the CNCs dried by the other two methods Air-drying of CNC suspension formed a tightly packed material with a very smooth surface (Fig 4f) The surface layer functioned as a dense thermoplastic slowing down the evaporation of water from inside of the bulk material The onset temperatures of thermal degradation of the dried CNC samples were determined and these data are shown in Table 1 The effect of drying methods on the onset temperatures of thermal degradation of CNCs is not obvious and the dried CNCs are slightly more thermally stable than those of NFC samples From the DTG curves in Fig 3b it can also be seen that the dried CNCs started to degrade at similar temperatures ie similar onset temperature of thermal degradation However the mass loss rate after the onset temperature of thermal degradation is comshypletely different (Fig 3b) Air-dried CNCs have the highest mass loss rate followed by the spray-dried sample The freeze-dried sample has the lowest mass loss rate following the onset temperature of thermal
degradation among the three samples From the DTG curves shown in Fig 3a it can be seen that the behaviors of mass loss rate of the air-dried CNCs differ significantly from the CNCs dried by the other two methods In the significant thermal degradation phases (regions II and III in the TGA curves) only one peak is observed in the DTG curves of freeze-dried and spray-dried CNC samples while multiple peaks are identified in the DTG curves of air-dried CNCs (Fig 3b) The temperature of the greatest mass loss rate for the air-dried CNCs is 253 degC which is much lower than those of freeze-dried CNCs (305 degC) and spray-dried CNCs (311 degC) The char residues at the end of region II for freeze-dried and spray-dried CNCs are 373 plusmn 12 and 305 plusmn 01 wt as shown in Table 1 Division of the TGA curve of air-dried CNCs into regions II and III is vague and the char residue in region II is not shown in Table 1 The higher final mass residues of the dried CNCs forced the tempershyature spans of region II for the dried CNC into a narrower band than those of the dried NFCs The final char residues of the air-dried and freeze-dried CNC samples are 319 plusmn 05 and 185 plusmn 07 wt which are higher than those of corresponding NFC samples (159 plusmn 08 and 154 plusmn 03 wt for air-dried and freeze-dried samples) (Fig 2a Table 1) The manushyfacturing process of CNC may partially contribute to the observed behavior The addition of sulfuric acid into the cellulose increased the carbon yield at high temperature (Kim et al 2001) For spray-dried CNCs the final char residue (184 plusmn 05 ) at 600 degC is similar with that of the spray-dried NFCs (181 plusmn 01 ) Spray-drying of CNC suspensions formed spherical or donut shaped materials with hard shells (Peng et al 2012b) The solid shell formed may prevent the thermal degradation of the inside CNCs and exhibit a similar thermal degradation mechanism with the spray-dried NFCs The SEM micrograph of the final CNC residues after the TGA test is shown in Fig 4b Almost intact spherical shapes of the thershymally degraded CNCs are observed Therefore spray-drying produced NFC and CNC having similar final char residues However the final char residues are significantly different for air-dried NFCs and CNCs (Table 1) Air-dried CNC char residue is 318 plusmn 05 wt while air-dried NFC char residue is 159 plusmn 08 wt In addition air-dried CNCs have significantly higher char residue than the freeze-dried and spray-dried CNC samples This result is consistent
Springer
Cellulose
with the observation of Raumlmaumlnen et al (2012) The TGA curve of air-dried CNCs in region II and III obviously differs from the others (Fig 2a) During air-drying of the CNC suspension the slow water evaporation rate allows the CNCs to rearrange in a preferred order A hydrogen bonded network is created among the cellulose nanocrystals when the sample is dried to a constant weight The hydrogen bonded network assembled for air-dried CNCs is also different from that for air-dried NFCs because of the different structures and the much smaller size of the CNCs During the TGA test thermal decomposition of the air-dried CNCs occurred in three phases (1) the CNC sample first started to lose residual water (2) the hydrogen bonding network assembled among the CNCs during drying started to thermally degrade and (3) the thermal decomposition of CNCs themshyselves occurred The thermal behaviors as defined by these three steps differ from the other NFCs and slow down the thermal decomposition of air-dried CNC Therefore a relatively high char residue weight percentage was observed
X-ray diffraction (XRD) characterization
The X-ray diffraction spectra of dried nanocellulose are shown in Fig 5a b The peaks shown in the X-ray diffraction pattern are the composite peaks combining several different crystalline planes (Guinier 1963 French and Sntiago Cintroacuten 2013) The major diffracshytion peaks at = 148deg 163deg 226deg and 345 in Fig 5a were assigned as the crystalline planes with Miller indices of -110 110 200 and 004 in the crystal structure of cellulose I (Langan et al 2001 Nishiyama et al 2002) However the intensity for each peak is not the real diffraction intensity of the assigned single crystalline plane These peaks are the composite peaks of diffraction intensity of the assigned crystalline plane with several other crystalline planes (Langan et al 2001 Nishiyama et al 2002 2003 French and Sntiago Cintroacuten 2013) The assigned crystalline plane contributes the major portion of the intensity shown in the Fig 5a For example the peak at = 148 observed in Fig 5a is a combination of diffraction signals from crystalline planes of 011 101 and -110 with the dominant signal of the crystalline plane of -110 (Nishiyama et al 2002 2003 French and Sntiago Cintroacuten 2013) Overlapping of the diffraction signals of these crystalline planes broadened the width
Fig 5 X-ray diffraction spectra of dried nanocellulose a NFC and b CNC Subscript 1 and 2 represent cellulose I and II
of the obtained diffraction peaks Diffraction spectra of dried CNCs differ from those of NFCs According to the assignment of X-ray diffraction peaks to cellulose crystalline planes dried CNCs include two polymorphs cellulose I and II (Garvey et al 2005 Qi et al 2009 Langan et al 2001 Nishiyama et al 2002 2003 French and Sntiago Cintroacuten 2013) Peaks in Fig 5b at = 121deg and 198deg are assigned to crystalline planes with Miller indices of -110 and 110 for cellulose II (Langan et al 2001 French and Sntiago Cintroacuten 2013) Peaks at = 149deg and 164deg are mainly caused by the diffraction of the crystalline planes of -110 and 110 from cellulose I (Nishiyama et al 2002 French and Sntiago Cintroacuten 2013) Simultaneously the peak intensities at = 121deg 198deg 149deg and 164deg does not represent the diffracshytion signal of the single crystalline planes of -110 110 from cellulose II and -110110 from cellulose I respectively These peaks are also composite peaks overlapped with the diffraction signal from other crystalline planes It is worth noting that crystalline planes of 200 (at = 226deg) and 004 (at = 345deg) were observed in both celluloses I and II at the same
Springer
Cellulose
position of the diffraction spectra as shown in Fig 5a and b The diffraction signals of crystalline planes of 200 from cellulose I 020 from cellulose 11 and 004 from cellulose I and II in CNCs contributed to the observed diffraction peaks shown in Fig 5b Different manufacturing processes result in the different crysshytalline composition of NFC and CNC During the manufacturing of CNC cellulose II was generated in the suspension because of the sulfuric acid treatment (Krassig 1993) while mechanically nanofibrillated cellulose did not change the cellulose polymorphs
Quantitative characterization of the portions of the crystalline region in the dried nanocellulose was also conducted The crystallinity indices of the dried NFCs corrected for the background signal measured without cellulose samples were calculated directly from the height ratio between the intensity of the crystalline peak (I200 ndash Iam) and total intensity (I200) (Segal et al 1959) In this method the characterized sample is assumed to consist of two components crystalline and amorphous regions The amount of the crystalline region is represented by the intensity of the highest diffraction peak and the amount of amorphous region is represented by the minimum intensity between the major peaks (French and Sntiago Cintroacuten 2013) However the highest diffraction peak and the minishymum intensity are a composite signal combined with the signals from the other crystalline planes The method of Segal et al (1959) cannot resolve the absolute value of the crystallinity index of the material According to the calculations of Nishiyama et al (2002 and 2003) and French and Sntiago Cintroacuten (2013) overlapping at the highest diffraction peak of cellulose I (crystalline plane of 200 at = 226deg) is not significantly affected by the signal from the other crystalline planes At the same time the impact of the diffraction signal from crystalline plane of 111 located at between 18deg and 20deg on the minimum intensity between the major peaks is not significant in cellulose I (Nishiyama et al 2002 2003 French and Sntiago Cintroacuten 2013) Therefore the Segal crystallinity index provides reliable relative crystallinity of the dried nanocellulose for comparison purposes The calcushylated values of crystallinity indices are shown in Table 1 Spray-dried products showed the highest crystallinity index of 821 compared with the other drying methods This high crystallinity index can be partially explained by the heat treatment of the NFCs during the spray-drying process The highest
temperature the NFCs experienced during the spray-drying process was 89 degC (Peng et al 2012b) Heat treatment can increase the crystallinity of cellulose (Bhuiyan et al 2000 Yildiz and 2007) At the same time recrystallization of amorphous cellushylose was also observed with heat and humidity (Hermans and Weidinger 1946 Wadehra et al 1965 Kimura et al 1974 Hatakeyama 1981) The spray-drying process provides these heat and humidity conditions The agglomeration of nanocellulose fibrils may provide another opportunity to increase the crystallinity index of spray-dried NFCs Under nonshyaqueous conditions or highly concentrated solutions of cellulose hydrogen bonding can occur directly among the hydroxyl groups of the cellulose chains (Tanaka and Fukui 2004) The hydrogen-bonding drives nanoshycellulose fibrils to approach each other closely and form tight aggregates resulting in the formation of crystalline structures Supercritical-drying produced single NFC entangled with a crystallinity index of 733 The crystalline regions did not change during the drying process For air-drying and freeze-drying the nanocellulose fibrils rearrange forming samples with higher crystallinity indices of 749 and 807 compared with that of the supercritical-dried sample With the normalization of the diffraction intensity of dried nanocellulose comparison of the crystallinity index of the dried nanocellulose can be easily performed as shown in Fig 5a The minimum intenshysities between major peaks for the dried nanocellulose are in the order supercritical-drying gt air-dryshying gt freeze-drying gt spray-drying For the dried CNC samples calculation of crystallinity index is not as simple as the dried NFCs It can be seen from Fig 5b that drying methods significantly affect the diffraction patterns of the dried nanocellulose For the complicated diffraction pattern the relative crystalshylinity index cannot be evaluated directly The dried CNC samples consist of cellulose I and II The superposition of the 002 plane makes it impossible to calculate the crystallinity index for the cellulose I component using the method of Segal et al (1959) At the same time the height and the shape of the peaks in the X-ray spectra are strongly influenced by the presence of the two polymorphs However the proportion of each component in the dried CNC samples can be approximately determined by the method of Gjoslashnnes and Norman (1960) But this was not the goal of the present study Examination of the
Springer
Cellulose
relative crystallinity changes resulting from different drying methods is the point Based on the method of Gjoslashnnes and Norman the intensity ratio of 110 plane in cellulose II to 200 amp 020 plane in the X-ray spectra (I[11O2]I[2001 amp 0202]) is linearly related to the component of cellulose I in the mixture (Gjoslashnnea and Norman 1960) The intensity ratios (I[110]I[2001
amp 0202]) measured in Fig 5b are 047 054 and 076 for air-dried freeze-dried and spray-dried CNCs indicating that different drying methods produced different proportions of cellulose I and II in the mixture with the same starting CNC suspension Simultashyneously the peak locations of the crystalline plane of 200 amp 0202 were observed to be linearly increased with increasing cellulose II content The shifts of 2001
amp 0202 peak location to lower Bragg angles further demonstrated that the proportions of cellulose II in the mixture decreased in the order air-dried gt freeze-dried gt spray-dried The higher cellulose II content may partially explain the thermal behavior of the dried CNC samples Cellulose II crystals have better thermal stability than that of cellulose I (Yue 2011) The higher content of cellulose II results in higher final char residues for the dried CNC samples (Fig 2a)
Conclusions
The effects of drying methods on the thermostability and crystallinity of nanocellulose including nanofibrshyillated cellulose and cellulose nanocrystals were investigated Four drying methods were employed air-drying freeze-drying spray-drying and supercritshyical-drying Each drying method produced unique nanocellulose fibril sizes and morphologies Supershycritical-drying generated NFCs with the least thermal stability and the lowest crystallinity index Air-drying and spray-drying formed NFCs and CNCs with similar onset temperatures of thermal degradation Freeze-dried CNCs are more thermally stable than the freeze-dried NFCs Different drying methods also resulted in different char residue weight percentages at 600 degC for the same starting materials of NFC or CNC The dried NFCs are pure cellulose I while the dried CNCs consist of cellulose I and II The calculated crystalshylinity indices differ with each drying method The cellulose II content in CNCs is a function of each drying method On the basis of their relatively superior thermal stability and higher crystallinity index it is
reasonable to expect sprayed-dried nanocellulose to be more suitable for the application in non polar thermoshyplastics compared with air-dried or freeze-dried or supercritical-dried nanocellulose
Acknowledgments We acknowledge the financial support from Maine Economic Improvement Fund and the USDA Forest Service Forest Product Laboratory The content and information does not necessarily reflect the position of the funding agencies Much appreciation goes to J Rettenmaier amp Soumlhne GMBH Company for donating the nanofibrillated cellulose
References
Azubuike CP Rodriacuteguez H Okhamafe AO Rogers RD (2012) Physicochemical properties of maize cob cellulose powshyders reconstituted from ionic liquid solution Cellulose 19(2)425-433
BhuiyanMTRHiraiN SobueN(2000)Changesofcrystallinity in wood cellulose by heat treatment under dried and moist conditions J Wood Sci 46431-436
Bloch J(2011) UMaine to build nations only cellulose nanoshyfibrils pilot plant httpumaineedunewsblog201110 28umaine-to-build-nationrsquos-only-cellulose-nanofibrilsshypilot-plant
Cabrera RO Meersman F McMillan PF Dmitriev V (2011) Nanomechanical and structural properties of native cellushylose under compressive stress Biomacromolecules 12 2178-2183
Chakraborty A Sain M Kortschot M (2005) Cellulose micro-fibres as reinforcing agents for structural materials In Oksman K Sain M (eds) Cellulose nanocomposites proshycessing characterizationand properties American Chemshyical Society Washington DC pp 169-186
Cranston ED Kan KHM Eita M Johansson E Netrval J Salshyajkova M Arwin H Waringgberg L (2012) Mechanical testing ofthin film nanocellulose materials httpwwwtappiorg HideEvents2012-Nanotechnology-ConferencePapers 12NANO05aspx Accessed 28 Sept 2012
Diddens I Murphy B Krisch M Muller M (2008) Anisotropic elastic properties of cellulose measured using inelastic X-ray scattering Macromolecules419755-9759
Eichhorn SJ Dufresne A Aranguren M Marcovich NE CashypadonaJRRowan SJWederCThielemansWRomanM Renneckar S Gindl W Veigel S Keckes J Yano H Abe K Nogi M Nakagaito AN Mangalam A Simonsen J Benight AS Bismarck A Berglund LA Peijs T (2010) Review current internationalresearch into cellulosenanofibres and nanocomposites J Mater Sci 45l-33
Espert A Vilaplana F Karlsson S (2004) Comparison of water absorption in natural cellulosic fibres from wood and one-year crops in polypropylene composites and its influence on their mechanical properties Compos Part A Appl Sci Manuf 35(11)1267-1276
Fengel D Wegener G (1998) Wood chemistry ultrastructure reactions De Gruyter Berlin
Ferguson W (2012) Why wood pulp is worlds new wonder material New Sci 287824
Springer
Cellulose
French AD Sntiago Cintroacuten M (2013) Cellulose polymorphy crystallite sire and the Segal crystallinity index Cellulose 20583-588
Gardner DJ Oporto GS Mills R Samir MASA (2008) Adhesion and surface issues in cellulose and nanocellulose J Adhes Sci Technol 22545-567
Garvey CJ Parker IH Simon GP (2005) On the interpretation of X-ray diffraction powder patterns in terms of the nanoshystructure of cellulose I fibers Macromol Chem Phys 206(15)1568-1575
Gjoslashnnea J Norman N (1958) The use of half width and position of the lines in the X-ray diffractograms of native cellulose to characterize the structural properties of the samples Acta Chem Scand 12(10)2028-2033
Gjoslashnnea J Norman N (1960) X-ray investigations on cellulose II and mixtures of cellulose I and II 1 A method for characterizing and determining the relative contents of the two modifications Acta Chem Scand 14(3)683-688
Goring DAI (1963) Thermal softening of lignin hemicelluloses and cellulose Pulp Paper Mag Can 64(12)T517-T527
Guinier A (1963) X-ray diffraction in crystals imperfect crysshytals and amorphous bodies W H Freeman and Company San Francisco London
Habibi Y Lucia LA Rojas OJ (2010) Cellulose nanocrystals chemistry self-assembly and applications Chem Rev 1103479-3500
Hatakeyama H (1981) Structural change of amorphous cellushylose by water- and heat-treatment Makromol Chem 182 1655-1668
Hermans PH Weidinger A (1946) On the recrystallization of amorphous cellulose J Am Chem Soc 68(12)2547-2552
Herrick FW Casebier RL Hamilton JK Sandberg KR (1983) Microfibrillated cellulose morphology and accessibility J Appl Polym Sci Symp 37797-813
Hubbe MA Rojas OJ Lucia LA Sain M (2008) Cellulosic nanocomposites a review BioResources 3(3)929-980
Ishikawa A Okano T Sugiyama J (1997) Fine structure and tensile properties of ramie fibers in the crystalline form of cellulose I II IIII and IVI Polymer 38463-468
Kilzer FJ Broido A (1965) Speculations on the nature of celshylulose pyrolysis Pyrodynamics 2151-163
Kim D Nishiyama Y Wada M Kuga S (2001) High-yield carbonization of cellulose by sulfuric acid impregnation Cellulose 829-33
Kimura M Hatakeyama T Nakano J (1974) DSC study on recrystallization of amorphous cellulose with water J Appl Polym Sci 183069-3076
Klemm D Philipp B Heinze T Heinze U Wagenknecht W (1998) Comprehensive cellulose chemistry Fundamentals and analytical methods Vol 1 Weinheim New York Chichester Brisbane Singapore Toronto Wiley-VCH VerlagGmbH Weinheim 1
Klemm D Kramer F Moritz S Lindstrom T Ankerfors M Gray D Dorris A (2011) Nanocelluloses a new family of nature-based materials Angew Chem Int Ed Engl 505438-5466
Kouris M Ruck H Mason SG (1958) The effect of water removal on the crystallinity of cellulose Can J Chem 36931-948
Kraumlssig HA (1993) Cellulose structure accessibility and reacshytivity Gordon and Breach Science Publishers Amsterdam the Netherlands
Langan P Nishiyama Y Chanzy H (2001) X-ray structure of mercerized cellulose II at 1 A resolution Biomacromoleshycules 2(2)410-416
Levan SL (1989) Thermal degradation In Schniewing AP (ed) Concise encyclopedia of wood amp wood-based materials 1st edn Pergamon Press Elmsford NY pp 271-273
Li S Lyons-hart J Banyasz J Shafer K (2001) Real-time evolved gas analysis by FTIR method an experimental study of cellulose pyrolysis Fuel 801809-1817
Maschio G Koufopanos C Lucchesi A (1992) Pyrolysis a promising route for biomass utilization Bioresour Technol 42219-231
Matsuo M Sawatari C Iwai Y Ozaki F (1990) Effect of orishyentation distribution and crystallinity on the measurement by X-ray diffraction of the crystal lattice moduli of cellushylose I and II Macromolecules 233266-3275
Nakamura K Hatakeyma T Hatakeyma H (1981) Studies on scanningbound water of cellulose bv differential caloshy
crystalline regions of cellulose polymorphs J Polym Sci Polym Phys 331647-1651
Nishiyama Y Langan P Chanzy H (2002) Crystal structure and hydrogen-bonding system in cellulose Iszlig from synchrotron X-ray and neutron fiber diffraction J Am Chem Soc 124(31)9074-9082
Nishiyama Y Sugiyama J Chanzy H Langan P (2003) Crystal Structure and hydrogen bonding system in cellulose from synchrotron X-ray and neutron fiber diffraction J Am Chem Soc 12514300-14306
Peng Y Shi SQ Ingram L (2011) Chemical emissions from adhesive-bonded wood products at elevated temperatures Wood Sci Technol 45627-644
Peng Y Gardner DJ Han Y (2012a) Drying cellulose nanofishybrils in search of a suitable method Cellulose 19(1) 91-102
Peng Y Han Y Gardner DJ (2012b) Spray-drying cellulose nanofibrils effect of drying process parameters on particle morphology and sire distribution Wood Fiber Sci 44(4) 448-461
Qi H Cai J Zhang L Kuga S (2009) Properties of films com-Dosed of cellulose nanowhiskers and a cellulose matrix regenerated from alkaliurea solution Biomacromolecules 10(6)1597-1602
Quievy N Jacquet N Sclavons M Deroanne C Paquot M Devaux J (2010) Influence of homogenization and drying on the thermal stability of microfibrillated cellulose Polym Degrad Stab 95306-314
Raumlmaumlnen P Penttilauml PA Svedstroumlm K Maunu SL Serimaa R (2012) The effect of drying method on the properties and nanoscale structure of cellulose whiskers Cellulose 19(3)901-912
Roman M Winter WT (2004) Effect of sulfate groups from sulfuric acid hydrolysis on the thermal degradation behavior of bacterial cellulose Biomacromolecules 51671-1677
Saito T Nishiyama Y Putaux J Vignon M Isogai A (2006) Homogeneous suspensions of individualized microfibrils
Springer
Cellulose
from TEMPO-catalyzed oxidation of native cellulose Biomacromolecules 7(6)1687-1691
Sakurada I Nukushina Y Itoh T (1962) Experimental detershymination of the elastic modulus of crystalline regions in oriented polymers J Polym Sci 57651-660
Segal L Creely JJ Martin AE Jr Conrad CM (1959) An empirical method for estimating the degree of crystallinity of native cellulose using the X-ray diffractometer Text Res J 29(10)786-794
Sehaqui H Salajkova M Zhou Q Berglund LA (2010) Mechanical performance tailoring of tough ultra-high porosity foams prepared from cellulose I nanofiber susshypensions Soft Matter 61824-1832
Shafizadeh F (1982) Introduction to pyrolysis of biomass J Anal Appl Pyrolysis 3283-305
Shafizadeh F (1984) The chemistry of pyrolysis and combusshytion In Rowell RM (ed) The chemistry of solid wood the American Chemical Society Seattle Washington pp 489-529
Shen DK Gu S (2009) The mechanism for thermal decomposhysition of cellulose and its main products Bioresour Technol 1006496-6504
Siqueira G Bras J Dufresne A (2010) Cellulosic bionanoshycomposites a review of preparation properties and applishycatioins Polymers 2728-765
Svagan AJ Azizi Samir MAS Bergund LA (2008) Biomimetic foams of high mechanical performance based on nanoshystructured cell walls reinforced by native cellulose nanoshyfibrils Adv Mater 201263-1269
Tanaka F Fukui N (2004) The behavior of cellulose molecules in aqueous environments Cellulose 1133-38
Wadehra IL Manley R St J (1965) Recrystallization of amorshyphous cellulose J Appl Polym Sci 92627-2630
Wallace R (2012) USDA under Secretary Sherman unveils nanocellulose production facility httpblogsusdagov 20120803usda-under-secretary-sherman-unveils-nanoce llulose-production-facility
Wegner TH Jones PE (2006) Advancing cellulose-based nanotechnology Cellulose 13115-118
Yildiz S E (2007) The effects of thermal modifishycation on crystalline structure of cellulose in soft and hardwood Build Environ 4262-67
Yue Y (2011) A comparative study of cellulose I and II fibers and nanocrystals School of renewable natural resources (Vol Master of Science) Louisiana State University Baton Rouge
Springer
Cellulose
together by szlig-(1 4)-glycosidic bonds (Klemm et al 1998) In woody plants these cellulose linear chains aggregate to highly ordered structures referred to as nanofibrils or elementary fibrils These nanofibrils of cellulose are then packed into larger units to form microfibrils which in turn are assembled into cellulose fibers such as the pulp fibers Nanofibrils in the woody plant are nano-scale fibers with average cross-sectional dimensions of about 10 nm times 35 nm They consist of crystalline and amorphous domains with cellulose chains parallel to the nanofibril axis (Fengel and Wegener 1998 Chakraborty et al 2005 Gardner et al 2008) The nanofibrils are generally produced from the wood fiber plant fiber pulp fiber microcrystalline cellulose (MCC) and microfibrillated cellulose (MFC) using mechanical or chemical methods (Moon et al 2011) Processing dilute slurries of cellulose fibers including wood fiber plant fiber and pulp fiber by grinding or high-pressure homogenizing action proshyduces nanofibrillated cellulose (NFC) (Herrick et al 1983 Moon et al 2011) while digestion of amorphous cellulosic domains of the raw materials through an acid hydrolysis process produces cellulose nanocrystals (CNC) (Hubbe et al 2008) During the mechanical fibrillation process the treatment of the raw materials with oxidation mediated by 2 2 6 6-tetramethylpipershyidine-1-oxyl (TEMPO) radical facilitates the disinteshygration of the materials into individual nanofibrils (Saito et al 2006) NFC can also be utilized as a raw material for producing CNC These nanocellulose suspensions including CNC and NFC suspensions are produced on the pilot scale and are commercially available in US and Canada (Bloch 2011 Ferguson 2012 Wallace 2012)
Each AGU of a cellulose chain possesses three hydroxyl groups at C-2 C-3 and C-6 positions which can form hydrogen bonds An extended network of hydrogen bonds consisting of inter- and intra-molecshyular bonds is responsible for the aggregation of cellulose chains which form the crystalline and amorshyphous regions The high mechanical properties of cellulose fibers are also attributed to the formation of complicated hydrogen bonding networks among celshylulose chains The Youngs modulus of the crystalline domain has values that range from 115 to 140 GPa (Sakurada et al 1962 Matsuo et al 1990 Nishino etal 1995 Ishikawa et al 1997) Youngs modulus meashysured in the direction perpendicular to the chain axis was recently reported to be 148 plusmn 08 GPa and in the chain axis direction it was reported to be 220 plusmn 50 GPa
(Diddens et al 2008) Compared with stainless steel the strength-to-weight ratio of cellulose nanocrystals (CNCs) is said to be eight times higher (Ferguson 2012 Cranston et al 2012) Because of their relatively high mechanical properties nanocellulose has great potenshytial as reinforcement in new bio composites innovative bio plastics and advanced reinforced composite materials Because nanocellulose fibrils are produced as aqueous slurries that cannot be used as such in the manufacture of plastic composites new drying techshyniques of the nanocellulose suspensions are required A highly desirable feature of a good drying method is preservation of the morphology of the nanocellulose and its properties In a previous study four drying methods were investigated (Peng et al 2012a) The study showed that three methods [freeze-drying (FD) supercritical-drying (SCD) and spray-drying (SD)] produced nano-scale cellulose fibrils
From the point view of producing a dry form of nanocellulose for developing natural fiber reinforced thermoplastics two material properties must be conshysidered thermal stability and crystallinity In the extrusion of plastic composites reinforced with lignoshycellulosic fibers the compounding temperature of the composite is commonly restricted to about 200 degC because lignocellulosic materials start to degrade at approximately 230 degC Cellulose the most thermally stable constituent in the lignocellulosic materials has a glass transition temperature in the range of 200-230degC and thermal decomposition starts at about 260 degC (Goring 1963 Gardner et al 2008) The thermal stability of nanocellulose compared with traditional cellulose fibers may be influenced by various factors including processing conditions and their high surface to volume ratio Indeed one study showed that the thermal stability of dried nanofibrilshylated cellulose (NFC) decreased as a result of homogshyenization and drying processes (Quievy et al 2010) For CNCs obtained by chemical hydrolysis using sulfuric acid the presence of sulfate groups on the cellulose surface decreased their thermal stability (Roman and Winter 2004) Freeze and air-drying were also observed to have some influence on the thermal stability of CNC (Raumlmaumlnen et al 2012)
A high modulus of elasticity is expected from highly crystalline cellulose material The Youngrsquos modulus of cellulose material depends on its crystallinity and the interaction of amorphous and crystalline regions (Cabrera et al 2011) The arrangement of crystalline
Springer
Cellulose
and amorphous regions of cellulose fiber is proposed as ldquolongitudinally arranged molecules change from one ordered region to the subsequent one the transition areas being less ordered regionsrdquo (Fengel and Wegener 1998 Chakraborty et al 2005) In the study of Cabrera et al (2011) the Youngrsquos modulus of crystalline part was measured as 200-355 GPa while the bulk modulus of cellulose was measured as 20 GPa indicating the superior mechanical properties of the crystalline region compared to the amorphous region As a result the higher crystallinity of nanocellulose may result in potentially higher mechanical properties in reinforced composites according to the rule of mixtures On the other hand the waterholding capacity of nanocellulose is related to its crystallinity When nanocellulose fibrils are included in composites the absorption of water by cellulose fibrils severely degrades the properties of the composites (Espert et al 2004) According to Nakamshyura et al (1981) the amount of freezing bound water decreases with increasing degree of crystallinity in cellulose fibers The effect of various drying methods on the crystallinity of dissolving-grade sulphite pulp was studied by Kouris et al (1958) The drying methods included air drying oven drying freeze drying and freeze drying with a series of solvent exchanges in the cellulose pulp The results indicated that no change in the crystallinity index occurred except a lower value was obtained from freeze drying cellulose fibers in benzene
The present study focuses on the effect of different drying methods on the crystallinity and thermal properties of CNCs and NFCs Samples of NFC and CNC suspensions were dried by freeze-drying supershycritical-drying or spray-drying The thermal propershyties of dried products were characterized by thermogravimetric analysis (TGA) The crystalline structure of nanocellulose was investigated by X-ray diffraction (XRD) Air-dried suspensions were used as controls The effect of different drying methods on the thermostability and crystalline structures of NFCs and CNCs is discussed
Experimental
Suspension preparation and drying
The NFC suspension was a commercial product ARBOCEL MF40-10 at 10 wt from J Rettenmaier
amp Sohne GMBH + COKG Germany The CNC suspension at 65 wt was obtained from the Forest Products Laboratory in Madison Wisconsin Before drying distilled water was added into the original suspensions and mixed using a Speed Mixerreg (Flack Tek Inc US) for 4 min at 2000 rpm to obtain final weight concentration of CNC and NFC suspensions at 2 wt
Different drying methods were applied to the nanoshycellulose suspensions at 2 wt including NFC and CNC suspensionsjust after mixing Air-drying (AD) of the two different suspensions was performed in a conditioning room with relative humidity of 65 plusmn 5 and temperature of 20 plusmn 2 degC The suspensions were allowedto settle to a constant weight in plastic containers before collection Prior to freeze-drying (FD) CNF suspensions (about 20 ml) were frozen in vials at a temperature of -80degC for 24 h Frozen suspensions were then transferred to a Virtis Freezemobile 25 SL freeze dryer which has a condenser temperature of ndash 80 degC and a vacuum of 11 mTorr Lyophilization was allowedto continue for 72 h Supercritical drying (SCD) of the prepared suspension was conducted on the Tousimis Samdri PVT-3 Critical-Point dryer Four steps were involved in this process (1) dehydration of CNF suspension with a series of ethanol solutions (50 75 95 and 100 ) until water was completely replaced with ethanol (2) replacement of ethanol with liquid CO2 (3) pressurization and heating of the liquid CO2 and the cellulose mixture to the supercritical conditions and (4) slow decompression of the supercritical CO2 to atmoshyspheric pressure Spray-drying of the CNF suspensions was conducted using a Buchi Mini Spray Dryer B-290 laboratory spray dryer (New Castle DE USA) High purity nitrogen gas was used as an injected gas to form the suspension droplets The spray-drying process is detailed in Peng et al (2012a and b) In this study nanocellulose suspensions were dried at an inlet temshyperature of 175 degC gas flow rate of 540 1h pump rate of 45 mlmin and drying gas flow rate of approximately 35 m3h The outlet temperatures of the spray-dryer measured for the NFCs and CNCs were 89 and 92 degC respectively All the dried NFCs and CNCs were put in plastic bags and stored in a desiccator at ambient temperature to prevent moisture absorption
Thermogravimetric analysis (TGA)
Thermal properties of dried nanocellulose and a commercial product of microcrystalline cellulose
Springer
Cellulose
(MCC) with the brand name of Emcocelreg SP15 from Rettenmaier and Sohne GMBH + COKG (Germany) which was used a control were characshyterized using a Mettler Toledo System consisting of the STARe Software and the TGASDTA851e modshyule All tests were performed in a nitrogen atmosphere with a ceramic sample pan Analysis of individual nanocellulose samples weighing 1-2 mg was carried out at a constant heating rate of 10 degCmin between 25 to 600 degC Each sample was tested in triplicate The TGA thermal curve was displayed as weight percent () versus temperature After the TGA test the residual nanocellulose fibrils were examined by scanshyning electron microscopy
Scanning electron microscopy (SEM)
The morphologies of the air-dried samples were studied by SEM using an AMR 1000 (AMRay Co) scanning electron microscope All samples were sputter-coated with gold before the microscopic observations were obtained SEM images were taken at an accelerating voltage of 10 kV at various magnifications The samples of dried nanocellulose after TGA testing were directly studied by SEM using the Hitachi Tabletop Microscope SEM TM 3000 (Hitachi High-Technologies Corporation Tokyo Japan) at an accelerating voltage of 15 kV
X-ray diffraction (XRD) characterization
XRD analyses of dried nanocellulose were performed on a high resolution X-ray diffractometer (Model XrsquoPert PRO Philips PANalytical Netherlands) with nickel-filtered copper (0154 nm) radiation genershyated at 45 kV and 40 mA The dried nanocellulose materials were pressed manually into cylindrical wafers with a diameter of 2 cm and thickness of 005-01cm using a Dake Press (Drake Grand Falls MI) A silicon zero background plate was used to calibrate the effect of sample holder and to make sure no signal was generated from the sample holder The same sample holder position and sample holder (holder and silicon zero background plate) were used for all experiments Scans were obtained from 5deg to 40 20 in 002 degree steps for 25 s per step Subtraction of background intensity from the meashysured intensity of nanocellulose samples was pershyformed first and then normalization of the maximum
peak intensity of nanocellulose materials to an intenshysity of 10000 was conducted Crystallinity index (CI) of dried nanocellulose samples was calculated using the empirical method described by Segal et al (1959) The equation is shown in the following
where I200 is the maximum intensity of the principal peak (200) lattice diffraction (at 227deg of for cellulose I and 217deg of 20 for cellulose II) and Iam is the intensity of diffraction attributed to amorphous cellulose (at 18deg of 20 for cellulose I and at 16deg of 20 for cellulose II) (Segal et al 1959 Azubuike et al 2012 French and Sntiago Cintroacuten 2013) This method is convenient and quick to determine the relative crystallinity of nanocellulose which can be used for relative comparisons A comparison of CI of the nanocellulose including NFCs and CNCs caused by different drying methods was conducted The effect of different drying methods on the crystallinity of nanocellulose was also evaluated using the methods of Gjoslashnnea and Norman (1958 1960)
Results and discussion
Thermal properties of dried nanocellulose
Thermal properties of cellulosic materials have been intensively studied (Shafizadeh 1984 Maschio et al 1992 Li et al 2001 Shen and Gu 2009 Peng et al 2011) Cellulose as one of the main components its thermal decomposition is principally responsible for the production of flammable volatiles which are released through dehydration hydrolysis oxidation decarboxshyylation and transglycosylation (Levan 1989) The pathway of thermal decomposition and the composition of the cellulose fibers (residual hemicelluloses) are influenced by many physical and chemical factors such as temperature type of atmosphere size and texture of the cellulose sample crystallinity presence of impurishyties such as metals and other parameters (Shafizadeh 1984) The thermal behavior of dried nanocellulose including NFC and CNC was characterized by thershymogravimetric analysis (TGA) in nitrogen
Representative TGA curves of dried NFC and CNC at a heating rate of 10 degCmin are shown in Figs l a and 2a The results of the three tests for each sample
Springer
Cellulose
were consistent Based on the weight percentage change as a function of temperature each TGA curve can be divided into three regions For example region I of the TGA curve of the MCC control sample is defined as the initial mass loss portion found from 25 degC to about 216 degC In region I the slight mass loss is below 31 plusmn 01 (The standard deviation is calculated based on the three measurements) and is mainly caused by the evaporation of water from the cellulosic samples No thermal degradation occurred in this region The detailed TGA curve of the MCC sample in region I is shown in Figs l b and 2b For the MCC sample in region I the mass loss increased to about 31 at 110 degC and continued at a plateau until about 216 degC (Fig lb) Region II for the MCC sample in the TGA curve (Fig la) is defined as the major mass loss stage starting at the temperature where the mass loss deviated from the plateau region (about 216 degC in Fig lb) The temperature of 216 degC (the ending temperature of region I shown in Table 1) is defined as the onset temperature of thermal degradashytion for the MCC sample In region II two different degradation mechanisms were proposed by Kilzer and Broido (1965) (1) dehydration of cellulose by an endothermic process to produce ldquodehydrocelluloserdquo
between about 200 and 280 degC and (2) depolymershyization of cellulose in competition with dehydration between 280 and 340 degC resulting in the formation of volatiles Decomposition of dehydrocellulose formed in the first path into gases and char residue becomes dominant at about 320 degC Evolution of CO2 H2O and CO with formation of solid char is mainly observed If depolymerization occurs more extensively than dehyshydration volatilization of tar (high boiling products HPB) mostly composed of levoglucosan is observed The HBP might further decompose with the producshytion of light flammable gases if it is not promptly removed from the heating zone The mass residue and temperature at the end of region II are 125 plusmn 03 wt and 358 degC as shown in Table 1 After region II the mass loss rate of the cellulosic samples decreased (Fig 1a) The TGA curve starting from this point to the final testing temperature of 600 degC is defined as region III For the MCC sample region III starts at a temperature of 358 degC In region III at a temperature above 500 degC the levoglucosan breaks down to provide a variety of low molecular weight fission products including hydrocarbons and hydrogen as well as CO CO2 and H2O Secondary reactions may occur in the gas phase as further decomposition of
Springer
Cellulose
levoglucosan in the solid phase as the condensation and crosslinking of intermediate chars to highly condensed polycyclic aromatic structures or by interaction of both phases as gasification of char by reaction with H2O and CO2 at high temperatures to produce CO and H2 (Shafizadeh 1982) At a tempershyature of 600 degC the final char residue for the MCC sample is 54 plusmn 03 wt (Table 1)
The dried NFCs showed similar thermal behaviors compared to the MCC sample (Fig la) A close-up examination of region I in Fig l b indicated that the dried NFCs showed almost the same TGA curve trend as the MCC sample The elimination of residual water from the NFC samples occurs first with increasing temperature and then a plateau of constant mass of the dried NFC is reached as all the residual moisture evaporates A similar mass loss rate was observed at the beginning of region I for all the samples (Fig lb) indicating that the water content within the dried NFC samples was the same for the samples dried by the different methods The evaporation rate appears to be consistent Depending on the amount of the residual water in the dried NFCs the plateau temperatures are not the same Supercritical-dried NFCs reach the plateau temperature first with the least mass loss of 19 plusmn 01 indicating that supercritical-drying proshyduced NFCs with about 19 moisture content (Table 1) Freeze-dried (31 plusmn 06) and spray-dried (28 plusmn 01) NFCs have a similar moisture content while the commercial MCC sample has a moisture content of 31 The residual moisture contents for
Table 1 Thermal stability and crystallinity of dried nanocellulose
all the dried samples are summarized in Table 1 The TGA curve of air-dried NFCs differed slightly from all the others in this stage (region I) The evaporation of water from air-dried NFCs can be further divided into two phases In phase I the mass loss rate of air-dried NFCs is the same as all the other cellulosic samples In phase II the mass loss rate is less than that in phase I (Fig lb) No constant mass loss plateau was observed for air-dried NFCs in region I Air-drying of the NFC suspension formed a bulk material with a solid packing of nanofibrils (Fig 4a b) During the TGA test the surface moisture of the NFC bulk material evaporated first resulting in same mass loss rate as with all the other cellulose samples As the tempershyature increased at 10 degCmin the solidly packed surface phase limits residual moisture diffusion from inside of the bulk material to the surface resulting in a decreased rate of mass loss in Fig lb At the same time the final mass loss of 41 plusmn 05 in region I shown in Fig l b indicated that the air-dried NFCs possessed higher moisture content when compared with NFCs dried by the other methods As the temperature continues to increase the NFCs undergo thermal decomposition This onset temperature of thermal degradation is critical for the applications of NFCs in reinforcing thermoplastics Different drying methods provide different onset temperature of thershymal degradation The degradation temperatures for all the dried NFCs are shown in Table 1 The MCC is the most thermally stable cellulose samples in this study followed by air-dried and spray-dried NFCs The least
Sample Drying Crystallinity Region I Region II Region III method index ()
Temperature Moisture residue Temperature Mass residue Mass residue (degC) (wt)a (degC) (wt)a (wt)a
AD air-drying FD freeze-drymg SD spray-drying SCD supercritical-drying a Standard deviation is calculated based on the three measurement of thermogravimetric analysis
Springer
Cellulose
thermally stable sample is supercritical-dried and freeze-dried NFCs During the thermal degradation processes in the regions II and III cellulose samples dried by different methods showed different results The ending temperatures of region II are different for the NFCs dried by different methods (Table 1) Air-dried NFCs end region II at the highest temperature of 375 degC among all the dried NFCs and the ending temperature for the spray-dried NFCs is 367 degC Under the same temperature of region II the mass residue of air-dried NFCs is higher than that of spray-dried NFCs followed by freeze-dried and supercritshyical-dried NFCs The TGA curve of freeze-dried NFCs in region II almost completely overlaps with those of supercritical-dried samples (Fig la) However they performed differently in region III and freeze-dried NFCs enter the region III at a lower temperature (350 degC) than those of supercritical-dried materials (370 degC) (Table 1) The mass residue of freeze-dried NFC in region III is much higher than that of supercritical-dried materials The final char residue of freeze-dried NFCs at 600 degCis about 154 plusmn 03 while the value for supercritical-dried NFCs is about 115 plusmn 01 The behavior of the air-dried NFCs was
the same as the freeze-dried NFCs in region III except the different starting temperatures (Table 1) Spray-dried NFCs have the highest char residue among all the samples in region III and the final char residue at 600 Cis about 181 plusmn 01 Air-drying NFC susshypensions formed solidly packed material (Fig 4a b) while the other three drying methods formed nanoshystructured materials (Peng et al 2012a b) Compared with air-dried material the other three drying methods provide higher surface area for the same weight of the cellulose material resulting in the greater mass loss rates in region II of thermal decomposition via the TGA tests At the same time supercritical-drying produced finely divided smaller diameter nanocellushylose fibrils while freeze-drying and spray-drying produced larger sized nanocellulose fibrils (Peng et al 2012a) As a result the final mass residue of supercritical-dried NFCs is the lowest For spray-dried NFCs agglomerated fibrils or irregular shaped mateshyrials were formed (Peng et al 2012a b) During the process of water evaporation at relatively high temshyperature the surface nanofibrils become closely packed forming a solid shell layer The thermal degradation of the spray-dried NFCs started on the surface first and then a compact charcoal protection layer formed to reduce thermal degradation of the inner fibrils This behavior is validated by the microshygraph shown in Fig 4a The spray-dried NFC single fibrils and agglomerates retain their original shape during the TGA test up to 600 degC Finally the highest char residue was observed for the spray-dried NFCs During air-drying the long drying time precipitated the larger sized NFC fragments at the bottom of the drying container After drying a solid packed top surface and porous structured bottom surface were formed (Fig 4c d) For spray-dried NFCs as shown in Fig 4e agglomerated fibrous and spherical NFCs were produced (Peng et al 2012b) As a result the packing of nanofibrils for air-dried NFCs is not as tight as the nanofibrils produced by spray-drying NFCs indicating the lower final mass residue of the air-dried NFCs For freeze-drying the nanofibrils were first confined in the space between ice crystals during the freezing process (Svagan et al 2008 Sehaqui et al 2010) increasing the concentration of nanofibrils locally At this point the interaction among nanocelshylulose fibrils is enhanced and the nanofibrils form a similar agglomerate structure as occurring in the case of the air-drying process This would explain the
Springer
Cellulose
Fig 4 SEM mcrographs a TGA test residues of spray-dried NFCs b TGA test residues of spray-dried CNCS c air-dried NFC top surface d air dried NFC bottom surface e spray dried NFC and f air dried CNC
identical thermal behaviors and similar char residues of the freeze-dried and air-dried NFCs in region III (Fig la Table 1)
The first derivative curves of the TGA (DTG) scans for the dried NFCs are shown in Fig 3a DTG curves represent the mass loss rate of the materials at different temperatures For the dried NFCs two peaks are observed in the DTG curves The first small peak represents the mass loss caused by the residual moisture evaporation which is identified in region I of the TGA curves The second peak is a continuous phase and mainly represents the major mass loss stage This peak starts from the onset temperature of thermal degradation until the final testing temperature of
600 degC The onset temperatures for the second peak are different among the NFCs dried by different methods which were previously discussed for the TGA scans At the same temperature the different values observed in the DTG curves in the second peak phase indicate that the NFC samples dried by various drying methods have different mass loss rates From the vertex point of the second DTG peak the temperature of the greatest mass loss rate can be extracted From Fig 3a the temperatures of the greatest mass loss rate for the dried NFCs are identified as 363 degC for air-dried sample 340 degC for spray-dried and supercritical-dried samples and 328 degC for freeze-dried sample
Springer
Cellulose
Supercritical-drying of CNC suspension was not possible in this study (Peng et al 2012a) The thermal behaviors of the CNC dried by other methods are similar with those of NFCs and the TGA curves are shown in Fig 2a and b Simultaneously the DTG curves are shown in Fig 3b The CNCs were less thermally stable than the MCC sample Analysis of the thermal behaviors of dried CNC in region I showed that (1) spray-dried CNC has similar moisture content (26 plusmn 05 ) with those of spray-dried NFCs (28 plusmn 01 ) (2) Freeze-dried CNC has slightly higher moisture content (39 plusmn 04 ) than both freeze-dried NFCs (31 plusmn 06 ) and spray-dried CNC (26 plusmn 05 ) The water evaporation region can also be identified in the DTG curves shown in Fig 3b At the same time the thermal behavior of air-dried CNC differs from all the other cellulose samples under the testing conditions For the freeze-dried and spray-dried CNC samples a plateau of mass residue occurred before the onset temperature of thermal degradation For air-dried CNC material the initial mass loss increased linearly with increasing tempershyature until the onset temperature of thermal degradashytion (205 degC) The CNC mass loss rate of the air-dried sample is also less than those of freeze-dried and spray-dried samples The low mass loss rate can be demonstrated by the DTG curves shown in Fig 3b The low mass loss rate indicates that the evaporation of water from air-dried CNC is more difficult than the CNCs dried by the other two methods Air-drying of CNC suspension formed a tightly packed material with a very smooth surface (Fig 4f) The surface layer functioned as a dense thermoplastic slowing down the evaporation of water from inside of the bulk material The onset temperatures of thermal degradation of the dried CNC samples were determined and these data are shown in Table 1 The effect of drying methods on the onset temperatures of thermal degradation of CNCs is not obvious and the dried CNCs are slightly more thermally stable than those of NFC samples From the DTG curves in Fig 3b it can also be seen that the dried CNCs started to degrade at similar temperatures ie similar onset temperature of thermal degradation However the mass loss rate after the onset temperature of thermal degradation is comshypletely different (Fig 3b) Air-dried CNCs have the highest mass loss rate followed by the spray-dried sample The freeze-dried sample has the lowest mass loss rate following the onset temperature of thermal
degradation among the three samples From the DTG curves shown in Fig 3a it can be seen that the behaviors of mass loss rate of the air-dried CNCs differ significantly from the CNCs dried by the other two methods In the significant thermal degradation phases (regions II and III in the TGA curves) only one peak is observed in the DTG curves of freeze-dried and spray-dried CNC samples while multiple peaks are identified in the DTG curves of air-dried CNCs (Fig 3b) The temperature of the greatest mass loss rate for the air-dried CNCs is 253 degC which is much lower than those of freeze-dried CNCs (305 degC) and spray-dried CNCs (311 degC) The char residues at the end of region II for freeze-dried and spray-dried CNCs are 373 plusmn 12 and 305 plusmn 01 wt as shown in Table 1 Division of the TGA curve of air-dried CNCs into regions II and III is vague and the char residue in region II is not shown in Table 1 The higher final mass residues of the dried CNCs forced the tempershyature spans of region II for the dried CNC into a narrower band than those of the dried NFCs The final char residues of the air-dried and freeze-dried CNC samples are 319 plusmn 05 and 185 plusmn 07 wt which are higher than those of corresponding NFC samples (159 plusmn 08 and 154 plusmn 03 wt for air-dried and freeze-dried samples) (Fig 2a Table 1) The manushyfacturing process of CNC may partially contribute to the observed behavior The addition of sulfuric acid into the cellulose increased the carbon yield at high temperature (Kim et al 2001) For spray-dried CNCs the final char residue (184 plusmn 05 ) at 600 degC is similar with that of the spray-dried NFCs (181 plusmn 01 ) Spray-drying of CNC suspensions formed spherical or donut shaped materials with hard shells (Peng et al 2012b) The solid shell formed may prevent the thermal degradation of the inside CNCs and exhibit a similar thermal degradation mechanism with the spray-dried NFCs The SEM micrograph of the final CNC residues after the TGA test is shown in Fig 4b Almost intact spherical shapes of the thershymally degraded CNCs are observed Therefore spray-drying produced NFC and CNC having similar final char residues However the final char residues are significantly different for air-dried NFCs and CNCs (Table 1) Air-dried CNC char residue is 318 plusmn 05 wt while air-dried NFC char residue is 159 plusmn 08 wt In addition air-dried CNCs have significantly higher char residue than the freeze-dried and spray-dried CNC samples This result is consistent
Springer
Cellulose
with the observation of Raumlmaumlnen et al (2012) The TGA curve of air-dried CNCs in region II and III obviously differs from the others (Fig 2a) During air-drying of the CNC suspension the slow water evaporation rate allows the CNCs to rearrange in a preferred order A hydrogen bonded network is created among the cellulose nanocrystals when the sample is dried to a constant weight The hydrogen bonded network assembled for air-dried CNCs is also different from that for air-dried NFCs because of the different structures and the much smaller size of the CNCs During the TGA test thermal decomposition of the air-dried CNCs occurred in three phases (1) the CNC sample first started to lose residual water (2) the hydrogen bonding network assembled among the CNCs during drying started to thermally degrade and (3) the thermal decomposition of CNCs themshyselves occurred The thermal behaviors as defined by these three steps differ from the other NFCs and slow down the thermal decomposition of air-dried CNC Therefore a relatively high char residue weight percentage was observed
X-ray diffraction (XRD) characterization
The X-ray diffraction spectra of dried nanocellulose are shown in Fig 5a b The peaks shown in the X-ray diffraction pattern are the composite peaks combining several different crystalline planes (Guinier 1963 French and Sntiago Cintroacuten 2013) The major diffracshytion peaks at = 148deg 163deg 226deg and 345 in Fig 5a were assigned as the crystalline planes with Miller indices of -110 110 200 and 004 in the crystal structure of cellulose I (Langan et al 2001 Nishiyama et al 2002) However the intensity for each peak is not the real diffraction intensity of the assigned single crystalline plane These peaks are the composite peaks of diffraction intensity of the assigned crystalline plane with several other crystalline planes (Langan et al 2001 Nishiyama et al 2002 2003 French and Sntiago Cintroacuten 2013) The assigned crystalline plane contributes the major portion of the intensity shown in the Fig 5a For example the peak at = 148 observed in Fig 5a is a combination of diffraction signals from crystalline planes of 011 101 and -110 with the dominant signal of the crystalline plane of -110 (Nishiyama et al 2002 2003 French and Sntiago Cintroacuten 2013) Overlapping of the diffraction signals of these crystalline planes broadened the width
Fig 5 X-ray diffraction spectra of dried nanocellulose a NFC and b CNC Subscript 1 and 2 represent cellulose I and II
of the obtained diffraction peaks Diffraction spectra of dried CNCs differ from those of NFCs According to the assignment of X-ray diffraction peaks to cellulose crystalline planes dried CNCs include two polymorphs cellulose I and II (Garvey et al 2005 Qi et al 2009 Langan et al 2001 Nishiyama et al 2002 2003 French and Sntiago Cintroacuten 2013) Peaks in Fig 5b at = 121deg and 198deg are assigned to crystalline planes with Miller indices of -110 and 110 for cellulose II (Langan et al 2001 French and Sntiago Cintroacuten 2013) Peaks at = 149deg and 164deg are mainly caused by the diffraction of the crystalline planes of -110 and 110 from cellulose I (Nishiyama et al 2002 French and Sntiago Cintroacuten 2013) Simultaneously the peak intensities at = 121deg 198deg 149deg and 164deg does not represent the diffracshytion signal of the single crystalline planes of -110 110 from cellulose II and -110110 from cellulose I respectively These peaks are also composite peaks overlapped with the diffraction signal from other crystalline planes It is worth noting that crystalline planes of 200 (at = 226deg) and 004 (at = 345deg) were observed in both celluloses I and II at the same
Springer
Cellulose
position of the diffraction spectra as shown in Fig 5a and b The diffraction signals of crystalline planes of 200 from cellulose I 020 from cellulose 11 and 004 from cellulose I and II in CNCs contributed to the observed diffraction peaks shown in Fig 5b Different manufacturing processes result in the different crysshytalline composition of NFC and CNC During the manufacturing of CNC cellulose II was generated in the suspension because of the sulfuric acid treatment (Krassig 1993) while mechanically nanofibrillated cellulose did not change the cellulose polymorphs
Quantitative characterization of the portions of the crystalline region in the dried nanocellulose was also conducted The crystallinity indices of the dried NFCs corrected for the background signal measured without cellulose samples were calculated directly from the height ratio between the intensity of the crystalline peak (I200 ndash Iam) and total intensity (I200) (Segal et al 1959) In this method the characterized sample is assumed to consist of two components crystalline and amorphous regions The amount of the crystalline region is represented by the intensity of the highest diffraction peak and the amount of amorphous region is represented by the minimum intensity between the major peaks (French and Sntiago Cintroacuten 2013) However the highest diffraction peak and the minishymum intensity are a composite signal combined with the signals from the other crystalline planes The method of Segal et al (1959) cannot resolve the absolute value of the crystallinity index of the material According to the calculations of Nishiyama et al (2002 and 2003) and French and Sntiago Cintroacuten (2013) overlapping at the highest diffraction peak of cellulose I (crystalline plane of 200 at = 226deg) is not significantly affected by the signal from the other crystalline planes At the same time the impact of the diffraction signal from crystalline plane of 111 located at between 18deg and 20deg on the minimum intensity between the major peaks is not significant in cellulose I (Nishiyama et al 2002 2003 French and Sntiago Cintroacuten 2013) Therefore the Segal crystallinity index provides reliable relative crystallinity of the dried nanocellulose for comparison purposes The calcushylated values of crystallinity indices are shown in Table 1 Spray-dried products showed the highest crystallinity index of 821 compared with the other drying methods This high crystallinity index can be partially explained by the heat treatment of the NFCs during the spray-drying process The highest
temperature the NFCs experienced during the spray-drying process was 89 degC (Peng et al 2012b) Heat treatment can increase the crystallinity of cellulose (Bhuiyan et al 2000 Yildiz and 2007) At the same time recrystallization of amorphous cellushylose was also observed with heat and humidity (Hermans and Weidinger 1946 Wadehra et al 1965 Kimura et al 1974 Hatakeyama 1981) The spray-drying process provides these heat and humidity conditions The agglomeration of nanocellulose fibrils may provide another opportunity to increase the crystallinity index of spray-dried NFCs Under nonshyaqueous conditions or highly concentrated solutions of cellulose hydrogen bonding can occur directly among the hydroxyl groups of the cellulose chains (Tanaka and Fukui 2004) The hydrogen-bonding drives nanoshycellulose fibrils to approach each other closely and form tight aggregates resulting in the formation of crystalline structures Supercritical-drying produced single NFC entangled with a crystallinity index of 733 The crystalline regions did not change during the drying process For air-drying and freeze-drying the nanocellulose fibrils rearrange forming samples with higher crystallinity indices of 749 and 807 compared with that of the supercritical-dried sample With the normalization of the diffraction intensity of dried nanocellulose comparison of the crystallinity index of the dried nanocellulose can be easily performed as shown in Fig 5a The minimum intenshysities between major peaks for the dried nanocellulose are in the order supercritical-drying gt air-dryshying gt freeze-drying gt spray-drying For the dried CNC samples calculation of crystallinity index is not as simple as the dried NFCs It can be seen from Fig 5b that drying methods significantly affect the diffraction patterns of the dried nanocellulose For the complicated diffraction pattern the relative crystalshylinity index cannot be evaluated directly The dried CNC samples consist of cellulose I and II The superposition of the 002 plane makes it impossible to calculate the crystallinity index for the cellulose I component using the method of Segal et al (1959) At the same time the height and the shape of the peaks in the X-ray spectra are strongly influenced by the presence of the two polymorphs However the proportion of each component in the dried CNC samples can be approximately determined by the method of Gjoslashnnes and Norman (1960) But this was not the goal of the present study Examination of the
Springer
Cellulose
relative crystallinity changes resulting from different drying methods is the point Based on the method of Gjoslashnnes and Norman the intensity ratio of 110 plane in cellulose II to 200 amp 020 plane in the X-ray spectra (I[11O2]I[2001 amp 0202]) is linearly related to the component of cellulose I in the mixture (Gjoslashnnea and Norman 1960) The intensity ratios (I[110]I[2001
amp 0202]) measured in Fig 5b are 047 054 and 076 for air-dried freeze-dried and spray-dried CNCs indicating that different drying methods produced different proportions of cellulose I and II in the mixture with the same starting CNC suspension Simultashyneously the peak locations of the crystalline plane of 200 amp 0202 were observed to be linearly increased with increasing cellulose II content The shifts of 2001
amp 0202 peak location to lower Bragg angles further demonstrated that the proportions of cellulose II in the mixture decreased in the order air-dried gt freeze-dried gt spray-dried The higher cellulose II content may partially explain the thermal behavior of the dried CNC samples Cellulose II crystals have better thermal stability than that of cellulose I (Yue 2011) The higher content of cellulose II results in higher final char residues for the dried CNC samples (Fig 2a)
Conclusions
The effects of drying methods on the thermostability and crystallinity of nanocellulose including nanofibrshyillated cellulose and cellulose nanocrystals were investigated Four drying methods were employed air-drying freeze-drying spray-drying and supercritshyical-drying Each drying method produced unique nanocellulose fibril sizes and morphologies Supershycritical-drying generated NFCs with the least thermal stability and the lowest crystallinity index Air-drying and spray-drying formed NFCs and CNCs with similar onset temperatures of thermal degradation Freeze-dried CNCs are more thermally stable than the freeze-dried NFCs Different drying methods also resulted in different char residue weight percentages at 600 degC for the same starting materials of NFC or CNC The dried NFCs are pure cellulose I while the dried CNCs consist of cellulose I and II The calculated crystalshylinity indices differ with each drying method The cellulose II content in CNCs is a function of each drying method On the basis of their relatively superior thermal stability and higher crystallinity index it is
reasonable to expect sprayed-dried nanocellulose to be more suitable for the application in non polar thermoshyplastics compared with air-dried or freeze-dried or supercritical-dried nanocellulose
Acknowledgments We acknowledge the financial support from Maine Economic Improvement Fund and the USDA Forest Service Forest Product Laboratory The content and information does not necessarily reflect the position of the funding agencies Much appreciation goes to J Rettenmaier amp Soumlhne GMBH Company for donating the nanofibrillated cellulose
References
Azubuike CP Rodriacuteguez H Okhamafe AO Rogers RD (2012) Physicochemical properties of maize cob cellulose powshyders reconstituted from ionic liquid solution Cellulose 19(2)425-433
BhuiyanMTRHiraiN SobueN(2000)Changesofcrystallinity in wood cellulose by heat treatment under dried and moist conditions J Wood Sci 46431-436
Bloch J(2011) UMaine to build nations only cellulose nanoshyfibrils pilot plant httpumaineedunewsblog201110 28umaine-to-build-nationrsquos-only-cellulose-nanofibrilsshypilot-plant
Cabrera RO Meersman F McMillan PF Dmitriev V (2011) Nanomechanical and structural properties of native cellushylose under compressive stress Biomacromolecules 12 2178-2183
Chakraborty A Sain M Kortschot M (2005) Cellulose micro-fibres as reinforcing agents for structural materials In Oksman K Sain M (eds) Cellulose nanocomposites proshycessing characterizationand properties American Chemshyical Society Washington DC pp 169-186
Cranston ED Kan KHM Eita M Johansson E Netrval J Salshyajkova M Arwin H Waringgberg L (2012) Mechanical testing ofthin film nanocellulose materials httpwwwtappiorg HideEvents2012-Nanotechnology-ConferencePapers 12NANO05aspx Accessed 28 Sept 2012
Diddens I Murphy B Krisch M Muller M (2008) Anisotropic elastic properties of cellulose measured using inelastic X-ray scattering Macromolecules419755-9759
Eichhorn SJ Dufresne A Aranguren M Marcovich NE CashypadonaJRRowan SJWederCThielemansWRomanM Renneckar S Gindl W Veigel S Keckes J Yano H Abe K Nogi M Nakagaito AN Mangalam A Simonsen J Benight AS Bismarck A Berglund LA Peijs T (2010) Review current internationalresearch into cellulosenanofibres and nanocomposites J Mater Sci 45l-33
Espert A Vilaplana F Karlsson S (2004) Comparison of water absorption in natural cellulosic fibres from wood and one-year crops in polypropylene composites and its influence on their mechanical properties Compos Part A Appl Sci Manuf 35(11)1267-1276
Fengel D Wegener G (1998) Wood chemistry ultrastructure reactions De Gruyter Berlin
Ferguson W (2012) Why wood pulp is worlds new wonder material New Sci 287824
Springer
Cellulose
French AD Sntiago Cintroacuten M (2013) Cellulose polymorphy crystallite sire and the Segal crystallinity index Cellulose 20583-588
Gardner DJ Oporto GS Mills R Samir MASA (2008) Adhesion and surface issues in cellulose and nanocellulose J Adhes Sci Technol 22545-567
Garvey CJ Parker IH Simon GP (2005) On the interpretation of X-ray diffraction powder patterns in terms of the nanoshystructure of cellulose I fibers Macromol Chem Phys 206(15)1568-1575
Gjoslashnnea J Norman N (1958) The use of half width and position of the lines in the X-ray diffractograms of native cellulose to characterize the structural properties of the samples Acta Chem Scand 12(10)2028-2033
Gjoslashnnea J Norman N (1960) X-ray investigations on cellulose II and mixtures of cellulose I and II 1 A method for characterizing and determining the relative contents of the two modifications Acta Chem Scand 14(3)683-688
Goring DAI (1963) Thermal softening of lignin hemicelluloses and cellulose Pulp Paper Mag Can 64(12)T517-T527
Guinier A (1963) X-ray diffraction in crystals imperfect crysshytals and amorphous bodies W H Freeman and Company San Francisco London
Habibi Y Lucia LA Rojas OJ (2010) Cellulose nanocrystals chemistry self-assembly and applications Chem Rev 1103479-3500
Hatakeyama H (1981) Structural change of amorphous cellushylose by water- and heat-treatment Makromol Chem 182 1655-1668
Hermans PH Weidinger A (1946) On the recrystallization of amorphous cellulose J Am Chem Soc 68(12)2547-2552
Herrick FW Casebier RL Hamilton JK Sandberg KR (1983) Microfibrillated cellulose morphology and accessibility J Appl Polym Sci Symp 37797-813
Hubbe MA Rojas OJ Lucia LA Sain M (2008) Cellulosic nanocomposites a review BioResources 3(3)929-980
Ishikawa A Okano T Sugiyama J (1997) Fine structure and tensile properties of ramie fibers in the crystalline form of cellulose I II IIII and IVI Polymer 38463-468
Kilzer FJ Broido A (1965) Speculations on the nature of celshylulose pyrolysis Pyrodynamics 2151-163
Kim D Nishiyama Y Wada M Kuga S (2001) High-yield carbonization of cellulose by sulfuric acid impregnation Cellulose 829-33
Kimura M Hatakeyama T Nakano J (1974) DSC study on recrystallization of amorphous cellulose with water J Appl Polym Sci 183069-3076
Klemm D Philipp B Heinze T Heinze U Wagenknecht W (1998) Comprehensive cellulose chemistry Fundamentals and analytical methods Vol 1 Weinheim New York Chichester Brisbane Singapore Toronto Wiley-VCH VerlagGmbH Weinheim 1
Klemm D Kramer F Moritz S Lindstrom T Ankerfors M Gray D Dorris A (2011) Nanocelluloses a new family of nature-based materials Angew Chem Int Ed Engl 505438-5466
Kouris M Ruck H Mason SG (1958) The effect of water removal on the crystallinity of cellulose Can J Chem 36931-948
Kraumlssig HA (1993) Cellulose structure accessibility and reacshytivity Gordon and Breach Science Publishers Amsterdam the Netherlands
Langan P Nishiyama Y Chanzy H (2001) X-ray structure of mercerized cellulose II at 1 A resolution Biomacromoleshycules 2(2)410-416
Levan SL (1989) Thermal degradation In Schniewing AP (ed) Concise encyclopedia of wood amp wood-based materials 1st edn Pergamon Press Elmsford NY pp 271-273
Li S Lyons-hart J Banyasz J Shafer K (2001) Real-time evolved gas analysis by FTIR method an experimental study of cellulose pyrolysis Fuel 801809-1817
Maschio G Koufopanos C Lucchesi A (1992) Pyrolysis a promising route for biomass utilization Bioresour Technol 42219-231
Matsuo M Sawatari C Iwai Y Ozaki F (1990) Effect of orishyentation distribution and crystallinity on the measurement by X-ray diffraction of the crystal lattice moduli of cellushylose I and II Macromolecules 233266-3275
Nakamura K Hatakeyma T Hatakeyma H (1981) Studies on scanningbound water of cellulose bv differential caloshy
crystalline regions of cellulose polymorphs J Polym Sci Polym Phys 331647-1651
Nishiyama Y Langan P Chanzy H (2002) Crystal structure and hydrogen-bonding system in cellulose Iszlig from synchrotron X-ray and neutron fiber diffraction J Am Chem Soc 124(31)9074-9082
Nishiyama Y Sugiyama J Chanzy H Langan P (2003) Crystal Structure and hydrogen bonding system in cellulose from synchrotron X-ray and neutron fiber diffraction J Am Chem Soc 12514300-14306
Peng Y Shi SQ Ingram L (2011) Chemical emissions from adhesive-bonded wood products at elevated temperatures Wood Sci Technol 45627-644
Peng Y Gardner DJ Han Y (2012a) Drying cellulose nanofishybrils in search of a suitable method Cellulose 19(1) 91-102
Peng Y Han Y Gardner DJ (2012b) Spray-drying cellulose nanofibrils effect of drying process parameters on particle morphology and sire distribution Wood Fiber Sci 44(4) 448-461
Qi H Cai J Zhang L Kuga S (2009) Properties of films com-Dosed of cellulose nanowhiskers and a cellulose matrix regenerated from alkaliurea solution Biomacromolecules 10(6)1597-1602
Quievy N Jacquet N Sclavons M Deroanne C Paquot M Devaux J (2010) Influence of homogenization and drying on the thermal stability of microfibrillated cellulose Polym Degrad Stab 95306-314
Raumlmaumlnen P Penttilauml PA Svedstroumlm K Maunu SL Serimaa R (2012) The effect of drying method on the properties and nanoscale structure of cellulose whiskers Cellulose 19(3)901-912
Roman M Winter WT (2004) Effect of sulfate groups from sulfuric acid hydrolysis on the thermal degradation behavior of bacterial cellulose Biomacromolecules 51671-1677
Saito T Nishiyama Y Putaux J Vignon M Isogai A (2006) Homogeneous suspensions of individualized microfibrils
Springer
Cellulose
from TEMPO-catalyzed oxidation of native cellulose Biomacromolecules 7(6)1687-1691
Sakurada I Nukushina Y Itoh T (1962) Experimental detershymination of the elastic modulus of crystalline regions in oriented polymers J Polym Sci 57651-660
Segal L Creely JJ Martin AE Jr Conrad CM (1959) An empirical method for estimating the degree of crystallinity of native cellulose using the X-ray diffractometer Text Res J 29(10)786-794
Sehaqui H Salajkova M Zhou Q Berglund LA (2010) Mechanical performance tailoring of tough ultra-high porosity foams prepared from cellulose I nanofiber susshypensions Soft Matter 61824-1832
Shafizadeh F (1982) Introduction to pyrolysis of biomass J Anal Appl Pyrolysis 3283-305
Shafizadeh F (1984) The chemistry of pyrolysis and combusshytion In Rowell RM (ed) The chemistry of solid wood the American Chemical Society Seattle Washington pp 489-529
Shen DK Gu S (2009) The mechanism for thermal decomposhysition of cellulose and its main products Bioresour Technol 1006496-6504
Siqueira G Bras J Dufresne A (2010) Cellulosic bionanoshycomposites a review of preparation properties and applishycatioins Polymers 2728-765
Svagan AJ Azizi Samir MAS Bergund LA (2008) Biomimetic foams of high mechanical performance based on nanoshystructured cell walls reinforced by native cellulose nanoshyfibrils Adv Mater 201263-1269
Tanaka F Fukui N (2004) The behavior of cellulose molecules in aqueous environments Cellulose 1133-38
Wadehra IL Manley R St J (1965) Recrystallization of amorshyphous cellulose J Appl Polym Sci 92627-2630
Wallace R (2012) USDA under Secretary Sherman unveils nanocellulose production facility httpblogsusdagov 20120803usda-under-secretary-sherman-unveils-nanoce llulose-production-facility
Wegner TH Jones PE (2006) Advancing cellulose-based nanotechnology Cellulose 13115-118
Yildiz S E (2007) The effects of thermal modifishycation on crystalline structure of cellulose in soft and hardwood Build Environ 4262-67
Yue Y (2011) A comparative study of cellulose I and II fibers and nanocrystals School of renewable natural resources (Vol Master of Science) Louisiana State University Baton Rouge
Springer
Cellulose
from TEMPO-catalyzed oxidation of native cellulose Biomacromolecules 7(6)1687-1691
Sakurada I Nukushina Y Itoh T (1962) Experimental detershymination of the elastic modulus of crystalline regions in oriented polymers J Polym Sci 57651-660
Segal L Creely JJ Martin AE Jr Conrad CM (1959) An empirical method for estimating the degree of crystallinity of native cellulose using the X-ray diffractometer Text Res J 29(10)786-794
Sehaqui H Salajkova M Zhou Q Berglund LA (2010) Mechanical performance tailoring of tough ultra-high porosity foams prepared from cellulose I nanofiber susshypensions Soft Matter 61824-1832
Shafizadeh F (1982) Introduction to pyrolysis of biomass J Anal Appl Pyrolysis 3283-305
Shafizadeh F (1984) The chemistry of pyrolysis and combusshytion In Rowell RM (ed) The chemistry of solid wood the American Chemical Society Seattle Washington pp 489-529
Shen DK Gu S (2009) The mechanism for thermal decomposhysition of cellulose and its main products Bioresour Technol 1006496-6504
Siqueira G Bras J Dufresne A (2010) Cellulosic bionanoshycomposites a review of preparation properties and applishycatioins Polymers 2728-765
Svagan AJ Azizi Samir MAS Bergund LA (2008) Biomimetic foams of high mechanical performance based on nanoshystructured cell walls reinforced by native cellulose nanoshyfibrils Adv Mater 201263-1269
Tanaka F Fukui N (2004) The behavior of cellulose molecules in aqueous environments Cellulose 1133-38
Wadehra IL Manley R St J (1965) Recrystallization of amorshyphous cellulose J Appl Polym Sci 92627-2630
Wallace R (2012) USDA under Secretary Sherman unveils nanocellulose production facility httpblogsusdagov 20120803usda-under-secretary-sherman-unveils-nanoce llulose-production-facility
Wegner TH Jones PE (2006) Advancing cellulose-based nanotechnology Cellulose 13115-118
Yildiz S E (2007) The effects of thermal modifishycation on crystalline structure of cellulose in soft and hardwood Build Environ 4262-67
Yue Y (2011) A comparative study of cellulose I and II fibers and nanocrystals School of renewable natural resources (Vol Master of Science) Louisiana State University Baton Rouge