Page 1
CC HH AA PP TT EE RR
55
INFLUENCE OF Fe3+ AND Mn3+ (B-SITE ACCEPTOR DOPANTS ON PZT (53/47)
5.1 Introduction 5.2 Experimental Procedure 5.3 Results and Discussion
5.3.1 B-site Mn doped PSZT 5.3.2 B-site Fe-doped PSZT 5.3.3 Degree of acceptor – nature of B-site Fe, Mn – doped PSZT
5.4 Conclusion
Some of the contents presented in this chapter have appeared in the following research publications;
1. K.P.Rema and V.Kumar “Structure– Property Relationship in Mn- doped (Pb0.94 Sr0.06)(Zr0.53Ti0.47)O3”, J. Am.Ceram.Soc. 91 (1), 164-168 ( 2008).
2. K.P.Rema, Vinod Kumar Etacheri and V.Kumar, “Influence of low trivalent iron doping on the electrical characteristics of PZT”, J. Mater Sci: Mater Electron, DOI 10.1007/s 10854-009-0035-9.
3. K.P.Rema, Vinod Kumar Etacheri and V.Kumar, “Degree of acceptor-nature of B-site trivalent Fe, Mn dopants in PZT.” (Paper presented in International Conference on Advanced Functional Materials, ICAFM 09, Thiruvananthapuram, Dec.2009).
Co
nt
en
ts
Page 2
Chapter-5
88
5.1 Introduction
In PZT, the optimum piezoelectric properties can be obtained near the
morphotropic phase boundary (MPB) where the Zr/Ti ratio is ~53/47[1,2]. The
piezoelectric properties of PZT with compositions near MPB have been
modified with several isovalent and nonisovalent substituents at the A and/or
B sites, giving rise to the classifications ‘‘soft’’ and ‘‘hard.’’ Donor dopants
such as Nb5+ ions at the B site impart soft characteristics to PZT, which
include higher values of dielectric constant, dielectric loss, piezoelectric
constants (kp, d33), and low aging rates. Lower-valent substituents at the B-site
of ABO3 render the PZT “hard” [3-7].Typical B-site lower-valent substituents
are Mn3+, Fe3+ and Al3+. ‘Hard’ PZT is characterized by lower values of
dielectric constant, dielectric loss, higher mechanical quality factor (Qm), and a
high aging rate. A-site doping with cations of the same valence enables the
Curie temperature, Tc, to be modified. A-site isovalent Sr2+-substituted PZT
with an MPB composition, (Pb0.94Sr0.06)(Zr0.53Ti0.47)O3 [PSZT], which is
ferroelectrically harder[1], have been studied intensively for high-power
applications that requires a low dielectric loss, tan δ, high electromechanical
coupling factor(kp), and high Qm. Although several studies have been
reported[3-17]on the B-site aliovalent ion (such as Fe3+, Mn3+, Al3+, Cr3+,etc.)-
substituted PZT, most of them have correlated the properties on the basis of
oxygen vacancies in the lattice. While such charge compensation mechanisms
and the influence of the resulting defect structure on the electrical properties
have been widely studied, structural perturbations brought about by some of
the dopants and their influence on the electrical properties have not been
studied in detail, especially with respect to PZT of an MPB composition.
Although Kamiya et al. [8] have ascribed the ‘‘soft’’ nature of Mn-doped PZT
Page 3
Influence of Fe3+and Mn3+ (B-site acceptor dopants on PZT (53/47)
89
to structural changes, detailed investigations on the factors responsible for
such structural changes have not been reported. Also, there is considerable
scatter in the data in the literature with regard to the site substitution and
doping mechanism. Therefore, the influence of Mn3+ dopant on the
structure and their relation with the electrical properties of PSZT has been
investigated in detail. The results were compared with the influence of another
typical B-site dopant, Fe3+.
5.2 Experimental Procedure
A PSZT solid solution with an MPB composition was chosen as the basis
for doping with different amounts (0.001 ≤ y ≥ 0.02) of M (M= Mn3+or Fe3+) to
yield the compositions with the general formula (Pb0.94Sr0.06) (Zr0.53Ti0.47)z M3+yO3
where z=1–3/4y. The materials were synthesized by the sol–gel method as per the
procedure adapted from our earlier work [18]. For the preparation of the precursor
solution, stoichiometric amounts of basic lead acetate, (CH3COO)2Pb.Pb(OH)2
(ACS reagent grade, Merck, Mumbai, India), strontium acetate, Sr(CH3COO)2
(99.9% purity, Aldrich, Steinheim, Germany), zirconium acetylacetonate,
Zr(CH3COCH=C(O)CH3)4, (>98% purity, Merck, Hohenbrunn, Germany), and
manganese (III) acetylacetonate, Mn (CH3COCH=C(O)CH3)3 (tech.grade,
Aldrich), or iron (III)acetylacetonate, Fe(CH3COCH=C(O)CH3)3 (tech.-grade,
Aldrich), were dissolved in acetic acid, [CH3COOH]/[Zr+Ti+Mn (or Fe)]=25, and
were mixed with titanium tetraisopropoxide, Ti(OC3H 7i )4 (97% purity, Aldrich)in
isopropyl alcohol under constant stirring. To induce hydrolysis, water,
[H2O]/[Ti]=2, was added dropwise to this solution and stirring was continued for
another hour. The clear homogeneous precursor solution was then transferred to a
glass Petri dish and allowed to gel at room temperature. The gel-derived powders,
Page 4
Chapter-5
90
obtained after calcination at 600°C for 2 h, were isostatically pressed at 200 MPa
into pellets of diameter 10 mm and thickness 1.0 mm.
Fig. 5.1 Process flow chart for sol-gel processing of PSZTM (M=MnIII /FeIII)
(CH3COO)2Pb.Pb(OH)2 CH3COOH
Sr(CH3COO)2 CH3COOH
M(CH3COCH=C(O)CH3)3CH3COOH
M=MnIII/FeIII
Zr(CH3COCH=C(O)CH3)3 CH3COOH
Ti(OC3H 7i
)4
i- (C3H7OH)
PSZTM(M=MnIII / FeIII)homogeneous solution
PSZTM-xerogel (amorphous)
Nanocrystalline PSZTM
Mixing
Hydrolysis, ageing
Calcination
Page 5
Influence of Fe3+and Mn3+ (B-site acceptor dopants on PZT (53/47)
91
The PSZTM specimens were sintered, in static air, at a temperature of
1200°C for 3 h under constant PbO atmospheres maintained using a mixture,
PbZrO3+10%ZrO2, as reported [15,19]. All X-ray diffraction (XRD) measurements
were performed on sintered and powdered samples on an X-ray diffractometer
(Model-D5005, Bruker, Karlsruhe, Germany) with CuKα radiation using a step
size of 0.021 and acounting time of 3 s per step. The sintered PZT specimens were
polished and electroded with a silver paste and subsequently cured at 700°C for
30 min and poled at temperatures around 95°C for 60 min by applying a DC
electric field of 2.5 kV/mm in a silicone oil bath. The piezoelectric characteristics
were measured 24 h after poling. The electromechanical characteristics were
determined from the resonance measurements [20]. The d33constant was
measured by applying a known force to the electroded surfaces of the
piezoelectric specimen and measuring the electrical charges generated in
the same direction using a d33meter (Model Pennebaker 8000, APC Inc.,
Mackeyville, PA).The dielectric properties of the sintered compacts were
determined at 1 kHz using an impedance analyzer (Model 4192A,Agilent
Technologies, Palo Alto, CA). The microstructures of the sintered pellets
were recorded using an SEM (Model JSM-840A, JEOL, Tokyo, Japan).
The diffuse reflectance spectra were measured on sintered and powdered
samples using a UV-Vis spectrophotometer (Model UV 2400, Shimadzu,
Tokyo, Japan).The Curie temperature, Tc, was determined on sintered and
powdered samples using a differential scanning calorimeter (Model DSC
822E, Mettler Toledo, Schwerzenbach, Switzerland) in a nitrogen
atmosphere, at a constant heating rate of 10°C/min. Ferroelectric hysteresis
(P-E) of the sintered compacts were measured using a TF Analyser (Model
200D, aix ACT, Germany).
Page 6
Chapter-5
92
5.3 Results and Discussion 5.3.1 B-site Mn doped PSZT
The XRD patterns as a function of B-site aliovalent dopant concentration
are shown in Figure 5.2. The composition without the B-site dopant is
tetragonal (Figure 5.2(a)). In comparison with the undoped composition, the
c/a ratio increases for the 1 atom % Mn doped composition (Figure 5.2(b),
Table 5.1), along with an increase in Tc (Figure 5.3). On further increasing the
Mn content, the perovskite structure changes from tetragonal to rhombohedral
(Figure 5.2) along with a reduction in Tc (Figure 5. 3).
This can be explained on the basis of the coordination effect of Mn2+
cation. In PSZT, for low Mn-dopant concentrations (y≤0.001), Mn2+ is
incorporated into the A site of the perovskite as reported [6] earlier.
Mn2+[rMn2+(CN-8) =1.10 A˚] is too small to have a symmetric dodecahedral
coordination of O2- ions and is therefore displaced off-center to have eight
near neighbors and four distant anions, thus causing a dipolar moment
whose effect leads to an increase in Tc.
Page 7
Influence of Fe3+and Mn3+ (B-site acceptor dopants on PZT (53/47)
93
Fig. 5.2 X-ray diffraction patterns of (Pb0.94 Sr0.06)(Zr0.53 Ti0.47)zMnyO3; y
(at.%) = (a) 0; (b) 0.001; (c) 0.002; (d) 0.003; (e) 0.004; (f) 0.005; (g) 0.01; (h) 0.015; and (i) 0.02.
Page 8
Chapter-5
94
Table 5.1 c/a ratio of (Pb0.94Sr0.06)(Zr0.53Ti0.47)zMnyO3
(PS)(ZT)zMnyO3 y(atom%) c/a ratio
0 1.0215
0.001 1.0225
0.002 1.0198
0.003 1.0177
0.004 1.0172
0.005 1.0161
0.01 1.0145
0.015 1.0067
0.02 1.002
Fig. 5.3 Effect of Mn3+ content(y) on Tc of (Pb0.94Sr0.06)(Zr0.53Ti0.47)zMnyO3.
Page 9
Influence of Fe3+and Mn3+ (B-site acceptor dopants on PZT (53/47)
95
For higher concentrations (y>0.001), the dopant ion Mn3+ substitutes for the
B-site ions (Ti4+, Zr4+) because of similar ionic radii. In theMnO6 octahedra,
Mn3+(d4) adopts the high-spin state. Because high-spin d4 systems, in
octahedral symmetry, contain a degenerate ground state, Jahn–Teller (J–T)
distortion occurs, in which the t2g level splits into B2(dxy) and E(dxz,dyz), while
eg splits into B1(dx2-y
2) andA1(dz2) as shown in Figure 5. 4.
Fig.5.4 Alteration of orbital energies of Mn3+(d4) in octahedral symmetry due
to ‘‘z–in’’ type J–T distortion; ∆o >>δ1>δ2 . J–T, Jahn–Teller.
Page 10
Chapter-5
96
Because the eg orbitals are directly involved in σ B–O bonding
(B=Mn3+), the J–T distortion is quite significant and, as a consequence,
elongation of the four equatorial Mn–O bonds and the contraction of the two
axial Mn–O bonds result in the decrease of the c/a ratio and Tc.
J–T distortion is confirmed from the diffuse reflectance spectra (Figure
5.5). The two broad absorption features at ~14 200 cm-1 (ν1) and ~24 000cm -1
(ν2) are due to the spin-allowed d–d transitions, 5A1← 5B1 (ν1); 5A1← 5B2(ν2)
(Figure 5.4). On the basis of the assignments of the observed spin-allowed d–d
bands, a crystal field splitting (∆o) of 11,625 cm-1 and a CFSE of 139 kJ/mol
are determined, which are comparable, to those reported[21,22] for Mn3+ in
relatively symmetric cubic environments.
Fig. 5.5 Diffuse reflectance spectra of(Pb0.94Sr0.06)(Zr0.53Ti0.47)zMnyO3.
Page 11
Influence of Fe3+and Mn3+ (B-site acceptor dopants on PZT (53/47)
97
Figures 5.6-5.8 show the changes in the dielectric and piezoelectric
characteristics of Mn-doped systems. The dielectric characteristics εr, tan δ
(Figure 5.6), increase with increasing Mn content. The slight decrease in εr for
the 1.5 at. % Mn-doped system is due to the smaller grain size.
Fig. 5.6 Effect of Mn3+content (y) on εr and tan δ of (Pb0.94Sr0.06) (Zr0.53Ti0.47)z MnyO3
ε r
Page 12
Chapter-5
98
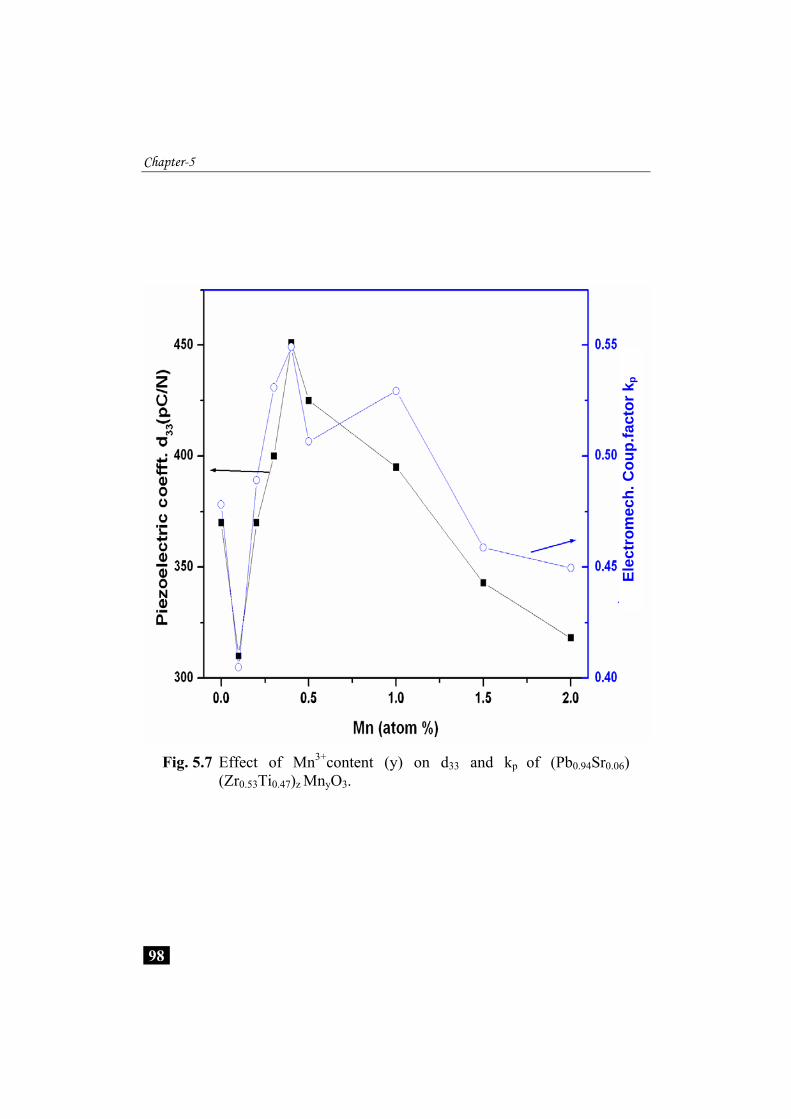
Fig. 5.7 Effect of Mn3+content (y) on d33 and kp of (Pb0.94Sr0.06)
(Zr0.53Ti0.47)z MnyO3.
Elec
trom
ech.
Cou
p.fa
ctor
kp
Page 13
Influence of Fe3+and Mn3+ (B-site acceptor dopants on PZT (53/47)
99
Fig. 5.8 Effect of Mn3+content (y) on g33 and Qm of (Pb0.94Sr0.06)
(Zr0.53Ti0.47)z MnyO3.
Mec
h. Q
ualit
y fa
ctor
Qm
Page 14
Chapter-5
100
It is seen that the electromechanical coupling factor ( pk ), piezoelectric
constant ( 33d ), piezoelectric voltage coefficient ( 33g ), and mechanical quality
factor ( mQ ) show a similar variation with increasing Mn3+ concentration.
When y (at.%) =0.001, all the characteristics decreased owing to the increase
in the tetragonality. When 0.001<y≤0.004, pk , 33d , and 33g increase. The
highest values of pk =0.55, 33d = 451 pC/N, and 33g = 46.3(x10 -3 V/mN) are
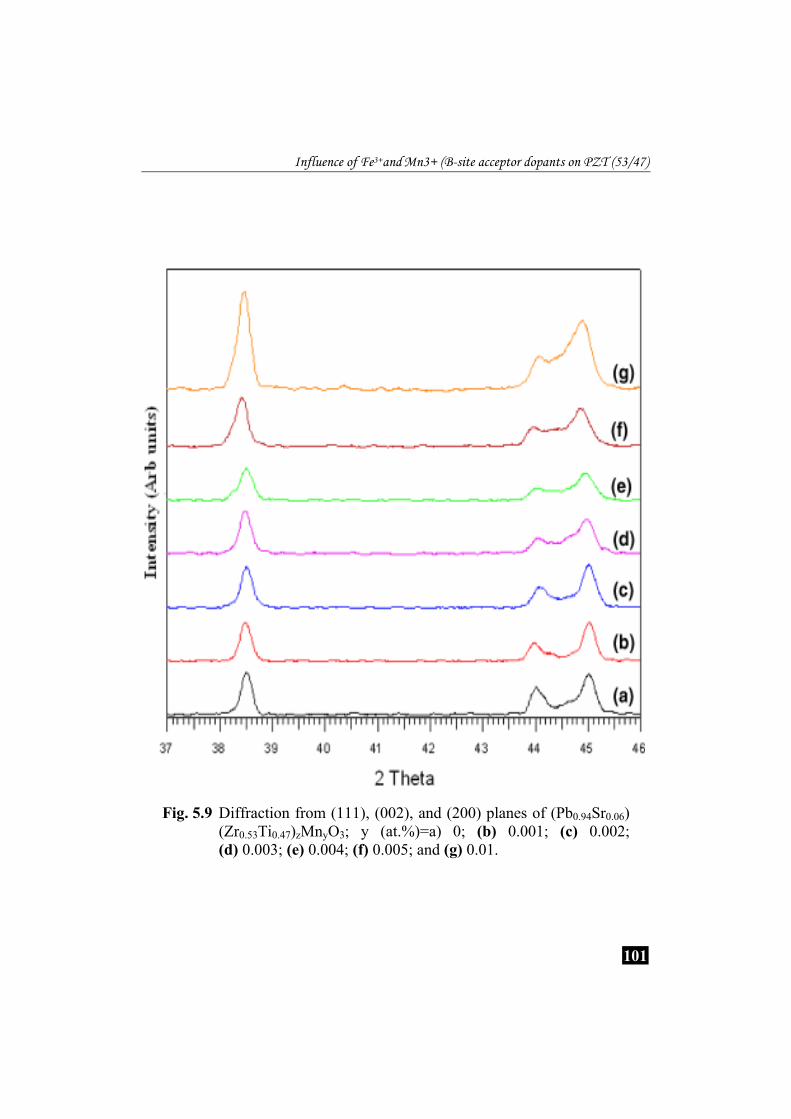
obtained for the composition with y=0.004, which corresponds well with the
MPB composition (Figure 5.9(e)) and a more uniform microstructure (Figure
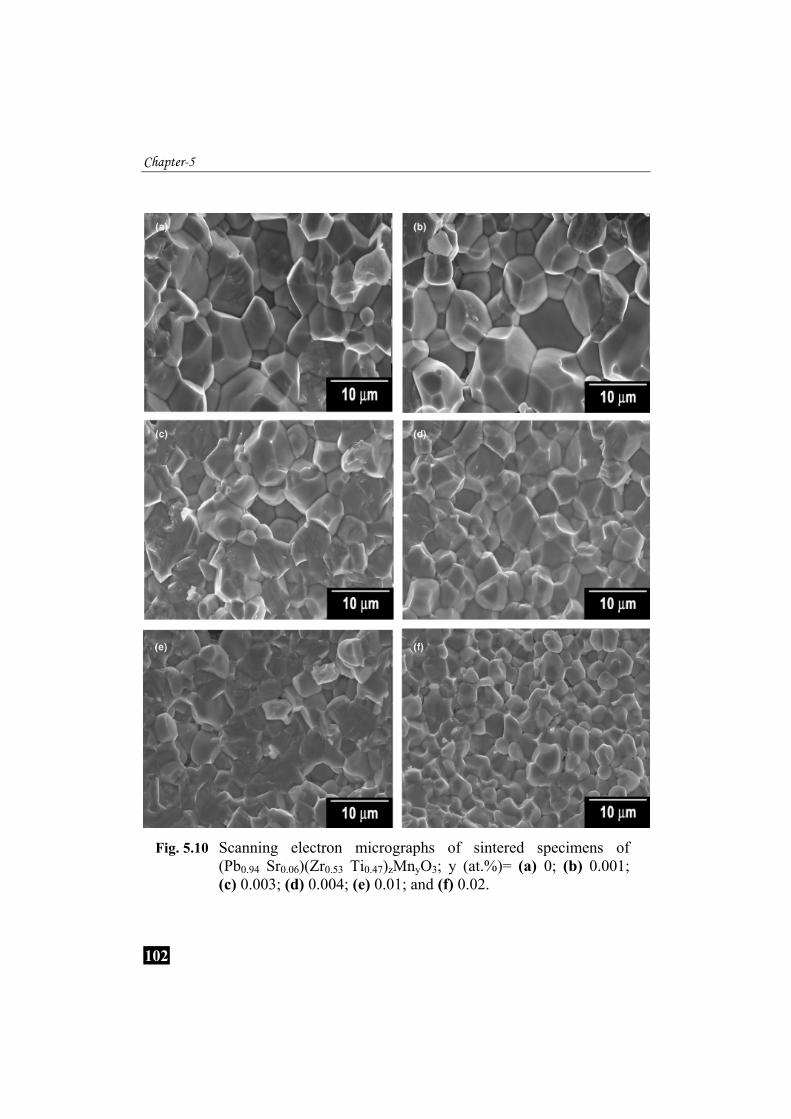
5.10(d)). The mechanical quality factor, mQ , is also the highest for the 0.4
at.% Mn-doped system, indicating the pinning of domain walls by the oxygen
vacancies. Further addition of Mn3+ above 0.4 at.% led to a decrease in the
dielectric and piezoelectric characteristics, indicating the solubility limit of
Mn3+in the perovskite lattice. This is also supported by the reduction in grain
size beyond 0.4 at.% Mn-doped composition(Figures 5.10(e) and (f)).
The various mechanisms by which the aliovalent dopant ion Mn3+ influence
the electrical and mechanical characteristics of PSZT are (i) to bring about a
change in the crystal structure from tetragonal to rhombohedral through J–T
distortion, which increases the dielectric and electromechanical characteristics
through enhanced domain wall mobility, and (ii) to create oxygen vacancies that
pin the domain walls, which increases the mechanical characteristics. Therefore,
Mn-doped systems exhibit certain ‘‘soft’’ characteristics as a result of structural
change from tetragonal to rhombohedral due to J–T distortion of the BO6
octahedra.
Page 15
Influence of Fe3+and Mn3+ (B-site acceptor dopants on PZT (53/47)
101
Fig. 5.9 Diffraction from (111), (002), and (200) planes of (Pb0.94Sr0.06) (Zr0.53Ti0.47)zMnyO3; y (at.%)=a) 0; (b) 0.001; (c) 0.002; (d) 0.003; (e) 0.004; (f) 0.005; and (g) 0.01.
Page 16
Chapter-5
102
Fig. 5.10 Scanning electron micrographs of sintered specimens of
(Pb0.94 Sr0.06)(Zr0.53 Ti0.47)zMnyO3; y (at.%)= (a) 0; (b) 0.001; (c) 0.003; (d) 0.004; (e) 0.01; and (f) 0.02.
Page 17
Influence of Fe3+and Mn3+ (B-site acceptor dopants on PZT (53/47)
103
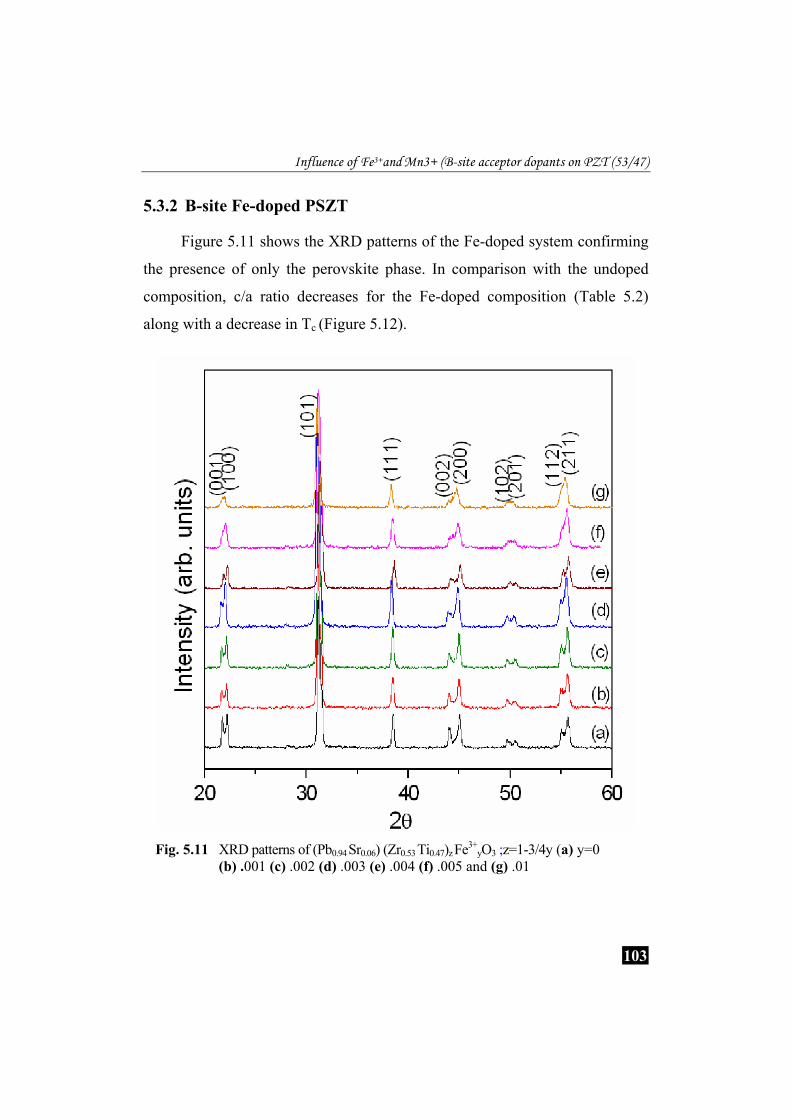
5.3.2 B-site Fe-doped PSZT
Figure 5.11 shows the XRD patterns of the Fe-doped system confirming
the presence of only the perovskite phase. In comparison with the undoped
composition, c/a ratio decreases for the Fe-doped composition (Table 5.2)
along with a decrease in Tc (Figure 5.12).
Fig. 5.11 XRD patterns of (Pb0.94 Sr0.06) (Zr0.53 Ti0.47)z Fe3+
yO3 ;z=1-3/4y (a) y=0 (b) .001 (c) .002 (d) .003 (e) .004 (f) .005 and (g) .01
Page 18
Chapter-5
104
These are due to the decrease in B-O-B coupling as a result of
incorporation of Fe3+-cations at the B-site. Incorporation of Fe3+ at the B-site
is also confirmed by the continuous decrease in the Curie temperature, Tc as
shown in Figure 5.12. Figure 5.13 A shows the P-E characteristics of the
PSZTFe virgin specimens at room temperature revealing double-loop nature.
The P-E characteristics are similar to those reported for ferroelectrics
containing randomly oriented polarisable defects [23,24]. The degree of
double–loop characteristics is quite pronounced. The magnitude of the
remanent polarization (Pr) decreases as the double-loop characteristic increases
and the switchable polarization is considerably less than that of the undoped
system. The mechanism by which the B-site dopant influences the polarization
switching characteristics of PSZT can be explained as follows.
Table 5.2 c/a ratio of (Pb0.94 Sr0.06)(Zr0.53Ti0.47)zFeyO3
(PS)(ZT)zFeyO3
y(atom%) c/a ratio Structure
0 1.022 Tetragonal
0.001 1.021 Tetragonal
0.002 1.021 Tetragonal
0.003 1.021 Tetragonal
0.004 1.020 Tetragonal
0.005 1.017 Tetragonal
0.010 1.016 Tetragonal
Page 19
Influence of Fe3+and Mn3+ (B-site acceptor dopants on PZT (53/47)
105
Fig. 5.12 Tc of PSZTFe as a function of Fe-content
Page 20
Chapter-5
106
Fig. 5.13 A. P-E hysteresis characteristics of Fe-doped virgin PSZTFey
specimens at room temperature. (a) y = 0 (b)0.001 (c) 0.002 (d) 0.003 and (e) 0.005
-20 -10 0 10 20
-4.5
-3.0
-1.5
0.0
1.5
3.0
4.5 A
e
d
c
-20 -10 0 10 20
-8-4048
b
-20 -10 0 10 20
-10-505
10 a
Pol
ariz
atio
n(µC
/cm
2 )
Electric Field(kV/cm)
Page 21
Influence of Fe3+and Mn3+ (B-site acceptor dopants on PZT (53/47)
107
Fig. 5.13 B. P-E hysteresis characteristics of Fe-doped poled PSZTFey
specimens at room temperature. (b)0.001 (c)0.002 (d)0.003 and (e)0.005
-20 -10 0 10 20
-20
-10
0
10
20B
d
c
b
-20 -10 0 10 20
-1.6
-0.8
0.0
0.8
1.6e
Pol
ariz
atio
n(µC
/cm
2 )
Electric Field(kV/cm)
Page 22
Chapter-5
108
For the trivalent acceptor dopant M at the B-site of the perovskite,
charge compensation is achieved by creating oxygen vacancy as represented in
equation 5.1;
22 '2 3 2 3BO
B O OM O M O V••
⎯⎯⎯→ + + ....................................... (5.1)
where 'BM indicates a singly negatively charged acceptor at the B-site and
OV••
a doubly positively charged oxygen vacancy with respect to the neutral
lattice according to Kröger and Vink.
Fig. 5.14 EPR spectra of ( ..o
'Ti VFe − ) defect –dipole in PSZTFe
The negatively charged trivalent dopant at the B-site forms a defect-dipole
with the positively charged ⋅⋅oV , ]V[M o
'B
⋅⋅− . In the EPR spectrum (Figure 5.14)
the signals at g ≈ 5.7 and g ≈ 4.3 are characteristic of ( )⋅⋅−′ oTi VeF defect-dipole in
Page 23
Influence of Fe3+and Mn3+ (B-site acceptor dopants on PZT (53/47)
109
PZT of MPB composition [25]. Such defect- dipoles, if they are mobile, have
been reported to pin domain walls suppressing nucleation and growth of domains
in the direction of the applied electric field [4, 26, 27]. In the case of the poled
samples, the P-E curves (Figure 5.13B) reveal strong asymmetry
with only a single loop. The polarization is switchable only to the reverse-biased
state. Also the magnitude of this switchable polarization decreases with increasing
Fe-content. For [Fe3+] ≥ 0.005, the P-E curve is considerably constricted (Figure
5.13B(e)). The P-E curves are similar to those reported for A-site K+-substituted
PZT (65/35) [23]. In poled specimens, as a result of the applied electric field, the
defect-dipoles undergo a preferred alignment leading to the development of an
internal electric field (Ei). This internal electric field (Ei) was estimated from the
current curves as shown in Figure 5.15 and are plotted in Figure 5.16.
-20 -10 0 10 20
-15
-10
-5
0
5
10
15
P
olar
izat
ion(
µC/c
m2 )
Electric Field(kV/cm)
-600
-400
-200
0
200
400
600-20 -10 0 10 20
Ei
Fig. 5.15 Estimation of Ei from the current curve
Page 24
Chapter-5
110
Since the current is given by the equation 5.2, the current curves
(Figure5.15) were obtained by differentiating the polarization curves as
described previously [27].
dtdE
dEdP
dttEdPEi .)]([)( == .................................... (5.2)
With increasing Fe3+ concentration, Ei increases up to a maximum value of
-10kV/cm. for an Fe concentration as low as 0.4 at.%. This shows that very high
internal electric fields are developed with Fe-doping as a result of the preferred
alignment of the ( )⋅⋅−′ oTi VeF defect-dipole. These results also correlate well with
their piezoelectric and dielectric characteristics (Figures 5.17A and B)
Fig. 5.16 Internal electric field (Ei) as a function of the dopant concentration in poled specimens of PSZTFe
Page 25
Influence of Fe 3+and M
n3+ (B-site acceptor dopants on PZT (53/47)
111
Fig. 5.17 Effect of dopant concentration on (A) piezoelectric and (B) dielectric characteristics of PSZTFe
Page 26
Chapter-5
112
(a) (b)
(c) (d)
(e)
Fig.5.18 SEM micrographs of sintered specimens of PSZTFeyO3; y(at.%)= (a) 0; (b) 0.001;(c) 0.002; (d) 0.005; and (e) 0.01
Page 27
Influence of Fe3+and Mn3+ (B-site acceptor dopants on PZT (53/47)
113
The micrographs shown in Figures 5.18(a)-(e) reveal well defined
microstructures with crystal-like faces up to a Fe-dopant concentration, y ≤
0.005. It is seen that the grain size is strongly influenced by the Fe content.
The undoped composition (Fig, 5.18a) has an average grain size of 8.0 µm. As
the Fe content increases, the grain size decreases to 3.0 µm. for the composition
with a Fe-dopant concentration, y=0.01(Fig.5.18e). This reduction in grain size
is due to the inhibition of grain growth by the oxygen vacancies as a result of Fe
doping. There is good correlation between the microstructures and the electrical
characteristics.
5.3.3 Degree of acceptor – nature of B-site Fe, Mn – doped PSZT
Thus in PZT, there exist differences in the acceptor- nature of various
substituents at the B-site. Acceptor impurities are known to exhibit significant
polarization pinning effects [14-17]. The differences in the acceptor- nature of
different dopants are therefore expected to manifest in their polarization
switching characteristics. However no detailed studies have been reported
investigating the differences in the acceptor- nature of different dopants.
Therefore an important constituent of the present investigation is to determine
the degree of acceptor- nature of two typical B-site acceptors in PZT viz. Mn3+
and Fe3+ by studying their polarization switching effects.
Figure 5.19 shows the P-E characteristics of the Mn-doped PSZT virgin
specimens at room temperature revealing double- loop nature. The degree of
double – loop characteristics is less in the case of Mn- doped systems (Figure
5.19), whereas it is pronounced in Fe-doped systems (Figure 5.13A). In the virgin
specimens, where the defects are randomly–oriented and mobile, the difference in
the polaristion characteristics is attributed to the enhanced mobility and therefore
Page 28
Chapter-5
114
decreased domain-pinning effects of the ( )⋅⋅−′ oTi VnM defect-dipole when
compared to that of the ( )⋅⋅−′ oTi VeF defect-dipole.
Fig. 5.19 P-E hysterisis characteristics of Mn-doped PSZTMy specimens at room temperature. (a) y=0 (b) 001 (c) 002 (d) 003 (e) 004 (f) 005
Pol
ariz
atio
n(µC
/cm
2 )
-20 -10 0 10 20
-11
-6
0
6
11
e
cd
b
-20 -10 0 10 20
-16-808
16f
-20 -10 0 10 20
-10-505
10
a
Electric Field(kV/cm)
-20 -10 0 10 20
-10-505
10 a
Page 29
Influence of Fe3+and Mn3+ (B-site acceptor dopants on PZT (53/47)
115
Fig. 5.20 P-E hysteresis characteristics of Mn-doped compositions after poling (b) y=0.001 (c) 0.003 (d) 0.005and (e) y=0.01
In the case of the poled samples , the P-E curves of the Fe3+- doped
systems reveal strong asymmetry with only a single loop (Figure 5.13B)
whereas in the case of Mn3+- systems the effect is considerably less(Figure
5.20). In poled specimens , as a result of the applied electric field, the defect-
dipoles undergo a preferred alignment leading to the development of an
internal electric field(Ei). This internal electric field (Ei) was estimated from
the current curves as described previously and are plotted in Figure 5.21.
-20 -10 0 10 20
-30
-20
-10
0
10
20
30
e
d
cb
Electric Field(kV/cm)
Pol
ariz
atio
n(µC
/cm
2 )
Page 30
Chapter-5
116
With increasing dopant concentration, Ei increases up to a maximum
value of -3kV/ cm for 1.0 at% Mn3+- doped system. With Fe-doping, Ei is
comparatively very high, with a value of -10kV/cm, for a dopant concentration
of only 0.5 atom%. This shows that very high internal electric fields are
developed with Fe-doping as a result of a stronger preferred alignment of the
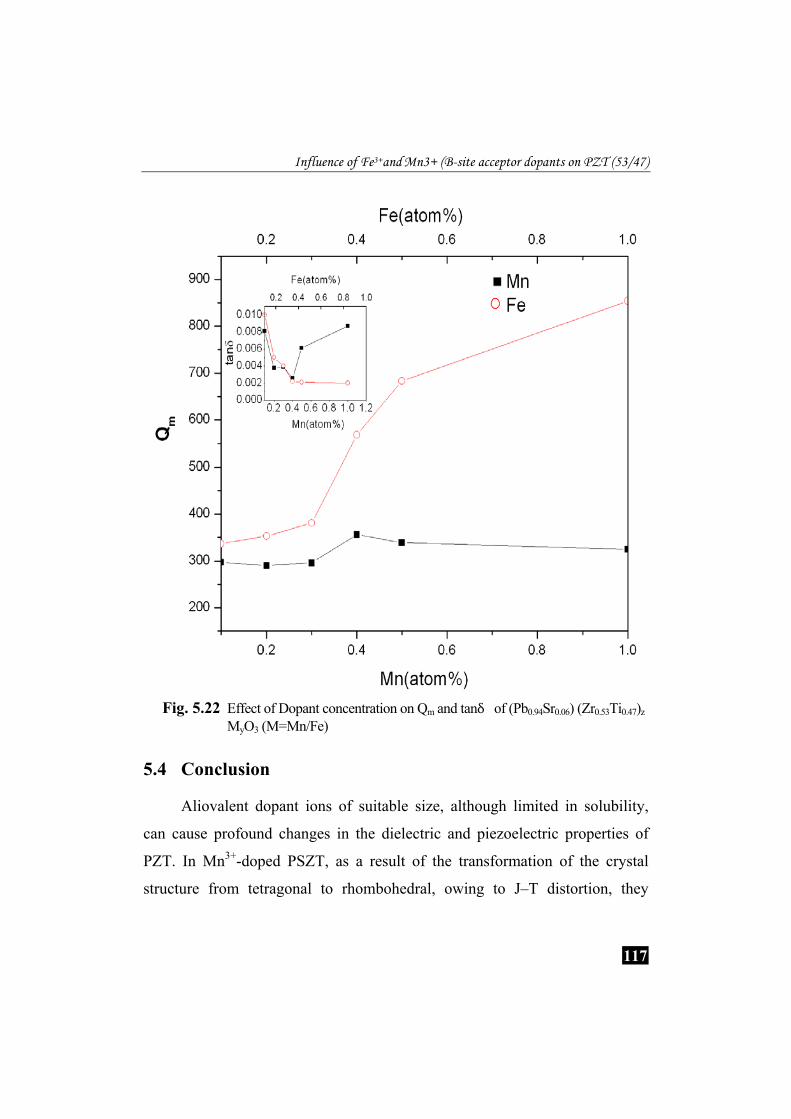
( )⋅⋅−′ oTi VeF defect- dipole. The relatively harder nature of the Fe3+-doped
systems is also well correlated with their lower values of dielectric loss (tan δ)
and higher values of mechanical quality factor (Qm) as shown in Figure 5.22.
Fig. 5.21 Internal field (Ei) as a function of the dopant concentration in
PSZTM[M=Fe/Mn]
Page 31
Influence of Fe3+and Mn3+ (B-site acceptor dopants on PZT (53/47)
117
Fig. 5.22 Effect of Dopant concentration on Qm and tanδ of (Pb0.94Sr0.06) (Zr0.53Ti0.47)z
MyO3 (M=Mn/Fe)
5.4 Conclusion
Aliovalent dopant ions of suitable size, although limited in solubility,
can cause profound changes in the dielectric and piezoelectric properties of
PZT. In Mn3+-doped PSZT, as a result of the transformation of the crystal
structure from tetragonal to rhombohedral, owing to J–T distortion, they
Page 32
Chapter-5
118
exhibited both ‘‘soft’’ and ‘‘hard’’ characteristics. A good correlation has been
obtained between the structure and electrical properties of Mn3+-doped PSZT.
Fe3+- doped systems exhibit typical characteristics of “hard” ferroelectrics.
A detailed investigation of the Polarization Switching characteristics of
Mn3+ and Fe3+- doped PSZT has revealed the influence of the defect dipoles viz.
( )⋅⋅−′ oTi VeF and ( )⋅⋅−′ oTi VnM on the polarization switching characteristics. These
dipoles are found to have high mobilities in virgin specimens whereas they are
preferentially oriented in poled specimens leading to the development of
significant internal electric fields and therefore in their acceptor- characteristics.
Fe3+- doped PZT are found to be ferroelectrically harder when compared to Mn3+-
doped systems. These results are also found to correlate well with their
observed dielectric and piezoelectric characteristics. This study provides a
useful basis for the selection of appropriate acceptor dopant in PZT- based
piezoelectric systems.
References
[1] B.Jaffe, W.R Cook and H. Jaffe Piezoelectric Ceramics (Academic Press, NY, 1971).
[2] B.Noheda, B.E Cox, G.Shirane, J.A.Gonzalo, L.E.Cross and S-E.Park, Appl. Phys. Lett. 74, 2059 (1999).
[3] T.B.Weston, A. H. Webster, and V. M Mc Namara, J.Am.Ceram. Soc., 52, 253 (1969).
[4] H .Dederichs, and G. Arlt, Ferroelectrics, 68 , 281 (1986)
[5] K.H.Hardtl, J. Am.Ceram. Soc., 64, 283 (1981).
Page 33
Influence of Fe3+and Mn3+ (B-site acceptor dopants on PZT (53/47)
119
[6] L.-X. He, and C -E Li, J. Mater. Sci., 35, 2477 (2000).
[7] S.Takahashi, and M.Takahashi, Jpn. J. Appl. Phys., 11, 31 (1972).
[8] T. Kamiya, T. Suzuki, T. Tsurumi, and M. Daimon, Jpn. J. Appl. Phys., 31, 3058 (1992).
[9] J. S. Kim, K. H. Yoon, B. H. Choi, J. O. Park, and J.M. Lee, J. Korean Ceram. Soc., 27, 187 (1990).
[10] D. Hennings and H. Pomplun, J. Am. Ceram. Soc., 57, 527 (1974).
[11] E. Boucher, D. Guyomar, L. Lebrun, B. Guiffard, and G. Grange, J. Appl. Phys., 92, 5437 (2002).
[12] K. Li, G. Pang, H. Lai, H. L. Wah Chan, C. L. Choy, and J.-h. Li, J. Appl. Phys., 95, 5691 (2004).
[13] K. Li, J.-H. Li, and H. L. Wah Chan, Mater.Chem. Phys., 86, 83 (2004).
[14] K.Okazaki, and K. Sakata, ETJ of Japan, 7, 13 (1962).
[15] R.B.Atkin, and R.M. Fulrath, J. Amer. Ceram. Soc., 54, 265 (1971).
[16] W.L.Warren, D.Dimos,G.E.Pike, and K.Vanheusden, Appl. Phys. Lett., 67, 1689 (1995).
[17] W.L.Warren, G.E. Pike, K.Vanheusden, D. Dimos, and B.E.Tuttle, J.Appl. Phys., 79, 9250 (1996).
[18] K. Stanly Jacob, N. Rani Panicker, I. Packia Selvam, and V. Kumar, J. Sol–Gel. Sci.Technol., 28, 289 (2003).
[19] A.I.Kingon, and J.B.Clark, J.Am.Ceram.Soc., 66, 253 (1983).
[20] H. Jaffe, D. Berlincourt, T. Kinsley, T. M. Lambert, D. Schwartz, E. A. Gerber, and I. E. Fair, Proc. IRE, 49, 1161 (1961).
Page 34
Chapter-5
120
[21] J. E. Huheey, E. A. Keiter, and R. L. Keiter, pp. 450–2 in Inorganic Chemistry—Principlesof Structure and Reactivity (Chapter 11), 4th edition, Benjamin Cummins, U.K.,1997.
[22] T. S. Davis, J. P. Fackler, and M. J. Weeks, Inorg. Chem., 7, 1994 (1968).
[23] Q.Tan, and D.Viehland, J. Am.Ceram. Soc. 81, 328 (1998).
[24] M.C.McQuarrie, J. Appl. Phys., 24 , 1334 (1953).
[25] W.L.Warren, B.A.Tuttle, F.Christopher Rong, G.J.Gerardi, and E.H. Poindexter, J. Am. Ceram. Soc., 80 , 680 (1997).
[26] Q.Tan, Z. Xu, J-F. Li and D.Viehland, Appl. Phys. Lett., 71, 1062 (1997).
[27] K.Carl,and K.H. Hardtl, Ferroelectrics, 17, 473 (1978).
….... …....