Page 1
INFLUENCE OF TETRABUTYLAMMONIUM HYDROXIDE ON HEAVY OIL
INTERFACIAL TENSION
by
Stephen A. Ezeogbo
Submitted in partial fulfilment of the requirements
for the degree of Master of Engineering in Petroleum Engineering
at
Dalhousie University
Halifax, Nova Scotia
August, 2013
© Copyright by Stephen A. Ezeogbo, 2013
Page 2
i
DEDICATION
This project report is dedicated to my lovely family, Charity, Chukwudi, Oge, Chijioke, and
Oluchi for their hard work in making my career a successful one, especially my mom, Rhoda
Ezeogbo.
Page 3
ii
CONTENTS
DEDICATION ............................................................................................................................................... i
CONTENTS ..................................................................................................................................................... ii
LIST OF TABLES ....................................................................................................................................... iv
LIST OF FIGURES ...................................................................................................................................... v
ABSTRACT ................................................................................................................................................. vi
LIST OF SYMBOLS AND ABREVIATIONS .......................................................................................... vii
ACKNOWLEDGEMENTS ....................................................................................................................... viii
CHAPTER 1: INTRODUCTION ................................................................................................................. 1
1.1 A Brief Review of Alkaline Flooding ................................................................................................. 1
1.2 Objective ............................................................................................................................................. 2
CHAPTER 2: LITERATURE REVIEW ...................................................................................................... 4
2.1 Heavy Crude Oil ................................................................................................................................. 4
2.1.1 Origin of Heavy Crude Oil ........................................................................................................... 5
2.1.2 Heavy Crude Oil Composition ..................................................................................................... 7
2.2 Heavy Crude Oil Recovery ................................................................................................................. 7
2.2.1 Thermal Technique ...................................................................................................................... 8
2.2.2 Chemical Technique .................................................................................................................... 9
2.2.3 Miscible Processes ....................................................................................................................... 9
2.3 EOR (Alkaline Flooding) .................................................................................................................. 10
2.3.1 Interfacial Tension ..................................................................................................................... 10
2.3.2 Wettability Change .................................................................................................................... 11
2.3.3 Emulsification of Oil .................................................................................................................. 11
CHAPTER 3: REACTIONS OF CARBOXYLIC ACIDS WITH BASES ................................................ 13
3.1 Reaction of NaOH with Carboxylic Acids ....................................................................................... 13
3.2 TBAOH with Carboxylic Acids ........................................................................................................ 13
3.3 Tetrabutylammonium hydroxide Applications ................................................................................. 14
3.3.1 Phase Transfer Catalyst .............................................................................................................. 14
3.3.2 Swelling Agent ........................................................................................................................... 15
3.3.3 Dispersing Agent........................................................................................................................ 15
Page 4
iii
3.3.4 Surfactant ................................................................................................................................... 15
3.3.5 Formation of Foam..................................................................................................................... 16
CHAPTER 4: EOR PREPARATION AND EXPERIMENT ..................................................................... 17
4.1 Crude Oil Selection ........................................................................................................................... 17
4.1.1 Acid Content Determination ...................................................................................................... 18
4.1.2 Crude Oil and Brine Density Determination .............................................................................. 20
4.2 Brine .................................................................................................................................................. 20
4.2.1 Brine Salinity ............................................................................................................................. 21
4.3 Brine and Salt .................................................................................................................................... 22
4.4 Equipment Used ................................................................................................................................ 22
4.4.1 Principle of Spinning Drop Tensiometer ................................................................................... 24
4.5 Spinning Drop Experiment ............................................................................................................... 26
CHAPTER 5: RESULTS AND DISCUSSION .......................................................................................... 28
5.1 Densities of Heavy Phase and Light Phase ....................................................................................... 28
5.2 Interfacial Tension Results................................................................................................................ 30
5.3 TBAOH Flooding ............................................................................................................................. 30
5.4 Interpretation of IFT ......................................................................................................................... 32
5.5 Observations ..................................................................................................................................... 32
5.6 Challenges Encountered .................................................................................................................... 33
CHAPTER 6: CONCLUSIONS AND RECOMMENDATIONS .............................................................. 34
6.1 EOR Summary .................................................................................................................................. 34
6.2 Conclusions ....................................................................................................................................... 34
6.3 Recommendations ............................................................................................................................. 34
REFERENCES ................................................................................................................................................ 36
APPENDICES ............................................................................................................................................ 42
Appendix A ............................................................................................................................................. 42
Appendix B ............................................................................................................................................. 45
Page 5
iv
LIST OF TABLES
Table 2.1: Dissolved Component in Produced Water (Reed & Johnson, 1996) ........................................... 7 Table 4.1: FT-IR Interpretation Table ......................................................................................................... 19
Table 4.2: Physical Characteristics of Salts ................................................................................................ 21
Table 4.3: Physical Characteristic of Tetrabutylammonium hydroxide ..................................................... 22
Table 4.4: TBAOH concentrations ............................................................................................................. 22 Table 5.1: Doba Chad crude oil diluted with 20% of Toluene by mass ....................................................... 28
Table 5.2: Synthetic Brine Density .............................................................................................................. 28
Page 6
v
LIST OF FIGURES
Figure 1.1: Hydrocarbon Transformation (Gordon, 2012) ........................................................................... 6
Figure 2.2: Steam Assisted Gravity Drainage Process (Cenovus Energy Inc. n.d) ...................................... 8
Figure 2.3: Surfactant Flooding (PEERI, 2011) ........................................................................................... 9
Figure 2.4: Miscible Process EOR (M.E.T.T.S Pty. Ltd., 2011) ................................................................ 10
Figure 2.5: Wettability Effect of Surfactants (Ayirala & Rao, 2004) ......................................................... 11 Figure 4.1: Central African Rift Basins (United Hydrocarbons, 2013) ...................................................... 17
Figure 4.2: ATR System for FT-IR (PerkinElmer, n.d) .............................................................................. 18
Figure 4.3: Doba Chad Crude Spectrum ..................................................................................................... 19
Figure 4.4: Site-100 Spinning Drop Tensiometer (from Dalhousie laboratory) ......................................... 23
Figure 4.5: The Measuring Cell (KRUSS Manual) .................................................................................... 23
Figure 4.6: Centrifugal Force on Crude Oil Drops ..................................................................................... 26 Figure 5.1: Doba Chad crude oil Density ................................................................................................... 29
Figure 5.2: Synthetic Brine Density ............................................................................................................ 29
Figure 5.3: Interfacial tension variation of several runs of TBAOH brine-oil system 60oC. ...................... 31
Figure 5.4: Average Interfacial tension variation of several runs of TBAOH brine-oil system 60oC. ....... 31
Page 7
vi
ABSTRACT
The decline in light crude oil reserves has led to an increase in the recovery of heavy and extra-
heavy crude oils, thus placing emphasis on some physical and chemical properties of the oils.
One of such properties is the interfacial tension (IFT) which must be lowered to enhance the oil
recovery. Alkaline flooding is one of the methods used to form surfactant in situ that helps in
lowering the interfacial tension between oil and water, emulsification of oil and water,
wettability alteration, and mobility enhancement. When injected into the reservoir, NaOH reacts
with a long chain of carboxylic acids contained in crude oil to form surfactant which enables
better sweep efficiency. In this study, the characteristics of tetrabutylammonium hydroxide
(TBAOH) as an organic alkaline flooding are examined. Like the NaOH, TBAOH reacts with a
long chain of carboxylic acid to form salt and water and this salt is considered as a surfactant as
it lowers the interfacial tension.
TBAOH has been observed carefully to find that it disperses the crude oil at 6% of TBAOH by
volume of the brine. This shows that TBAOH can not only serve as Enhanced Oil Recovery
(EOR) organic base but also as a dispersing agent in other applications that may include
environmental remediation of oil spill. Additionally, on completion of the chapters in this
project, one will find that TBAOH successfully have a positive effect (IFT reduction) on the IFT
of Doba Chad crude oil. The critical lowest IFT observed was averaged to get 3.07mN/m at 0.4%
of TBAOH. This project was made possible by the use of a complex machine “Site-100 Spinning
Drop Tensiometer”.
Page 8
vii
LIST OF SYMBOLS AND ABREVIATIONS
Symbols
Interfacial Tension (mN/m)
ΔP change in pressure (N/ )
Δρ change in density (kg/ )
ω angular velocity (rad/s)
Abbreviations
API American Petroleum Institute
ASTM American Standard of Testing Materials
ATR Attenuated Total Reflection
CMC Critical Micelle Concentration
CPU Central Processing Unit
EOR Enhanced Oil Recovery
FT-IR Fourier Transform Infrared
IFT Interfacial Tension
LPG Liquefied Petroleum Gas
PPM Parts Per Million
RPM Revolution per minute
SAGD Steam Assisted Gravity Drainage
TBAOH Tetrabutylammonium Hydroxide
Page 9
viii
ACKNOWLEDGEMENTS
Sincere acknowledgement and gratitude is hereby extended to the following individuals;
My family in Nigeria, for their unconditional love and support throughout my university career;
My girlfriend, Mariah MacKay, for her constant support and encouragement, and for helping to
proof read the final draft of my project;
My special friends, Ann and Keith Shears, for treating me like a true member of their family;
My project co-supervisor, Dr. Adango Miadonye from Cape Breton University for the revisions
and contributions to the success of this project;
My project co-supervisor, Mumuni Amadu, of Dalhousie University, for helping me turn my
initial idea into a thesis project. I sincerely appreciate his ongoing advice, support, and patience
throughout the duration of my project;
Finally, a big thank you to my project supervisor Dr. Michael Pegg, who approved this project
and his assistance.
Page 10
1
CHAPTER 1: INTRODUCTION
1.1 A Brief Review of Alkaline Flooding
Alkaline flooding is a type of enhanced oil recovery that reduces the interfacial tension between
the brine and crude oil phase when the formation of surfactant molecule occurs in situ thereby
increasing the displacement of crude oil (Meyers, 2001). Alkaline flooding was first identified in
1899 by Donnan (Chan, Sharma, & Yen, 1982). Alkaline flooding is identified as one of the
methods to form surfactant in situ that helps in lowering the interfacial tension between crude oil
and water, emulsification of crude oil and water, wettability alteration, and mobility
enhancement (Dong, Ma, & Li, 2011). When injected into the reservoir, alkaline (e.g. NaOH)
reacts with a long chain of carboxylic acids contained in crude oil to form surfactant which
enables better sweep efficiency. TBAOH was also identified to foam and forms an emulsion
when reacts with long chain fatty acids (Fameau, Ventureira, Novales, & Douliez, 2012).
Surfactants are classified by the type of charge they carry termed anionic, cationic and non-ionic
(Erbil, 2006). Speel and Poats (1964) stated that anionic has its hydrophilic head to be negatively
charged ions and is referred to as the water-loving end whereas its tail is referred to as the oil-
loving end. As the opposite of anionic, the hydrophilic head for cationic surfactant bears
positively charged ions and its hydrophobic tail bears no charge as recorded by Erbil (2006).
Rosen and Kunjappu (2012) added that surfactant may carry both positive and negative charge in
the surface active part that is termed Zwitterionic surfactants. Additionally, the non-ionic
surfactants as mentioned and elaborated by Erbil (2006) do not contain any charge. The
advantage of non-ionic surfactant is said to be that both of its ends (hydrophilic head and
Page 11
2
hydrophobic tail) can vary in action of surface active when required. Examples of the
classification of surfactants are listed below.
C11H23COO-Na
+ Anionic Surfactant (e.g: sodium dodecanoate) [1.1]
C12H25N+(CH3)3Cl
- Cationic Surfactant (e.g: dodecyl trimethylammonium chloride) [1.2]
C12H25(OC2H4)6OH Non-ionic Surfactant (e.g: dodecyl hexaoxylene glycol monoether) [1.3]
1.2 Objective
The reduction in crude oil production may become a threat to the oil industry as the decrease in
production will lead to a decrease in income earnings. This can be seen the same way as drilling
a well to discover heavy oil having a difficulty to flow. This research is been completed for the
following reasons:
To investigate the effect of tetrabutylammonium hydroxide–brine on IFT of heavy crude
oil using Site-100 Spinning Drop Tensiometer.
To examine the existence of carboxylic acids in heavy crude oil and its reaction with
tetrabutylammonium hydroxide.
Following the research by Zana et al. (2005), the critical micelle concentration (CMC) of
TBAOH was recorded to be at 1.7mM when examined with C14 (myristic acid) using electrical
conductivity method. Additionally, Fameau et al (2012) also recorded the CMC of TBAOH to be
at 1.3mM using CDM230 Conductivity Meter. Considering the figure provided in appendix C by
Fameau et al. (2012), the surface and interfacial tension of the fatty acids/TBAOH were recorded
at 25℃ with respect to time which the decrease in interfacial tension was observed. CMC is
the range at which surfactant shows a sudden change and at which micelles are formed (Moroi,
1992); Micelles are collection of surfactant molecules dispersed in a liquid (Borisenko &
Ossicini, 2012). The CMC for TBAOH recorded by Zana, et al. (2005) and Fameau et al (2012)
Page 12
3
motivated my interest in the study of the IFT of TBAOH using spinning drop tensiometer on
heavy crude oil.
Page 13
4
CHAPTER 2: LITERATURE REVIEW
2.1 Heavy Crude Oil
Viscosity and specific gravity are part of the main physical properties of heavy crude oil (Huc,
2011). The API value can be obtained if the specific gravity of the crude oil is known according
to Huc (2011). See equation 2.1.
API = (141.5/specific gravity) - 131.5 [2.1]
The specific gravity of a fluid can be calculated by dividing the density of the fluid by the
density of water where the density of a liquid is the weight per unit volume of a liquid at a
particular temperature (PDHengineer, 2013). Using the formula in equation 2.1, one should find
that the lower the specific gravity will lead to an increase in the API value of the crude oil and
vice versa.
Viscosity of a fluid, on the other hand, is the measure of its resistance to flow. This resistance to
flow can be caused by the internal friction of the fluid. The higher the fluid friction between the
layers of the fluids, the higher the viscosity of the fluid and vice versa (Ahmed, 2010).
Meyer and Witt (1990), in their research on API gravity, noted that:
The API gravity of the conventional crude oil is higher than 20 degrees.
The API gravity of heavy oil is said to be between 10 to 20 degrees
The API gravity of extra heavy oil is less than 10 degrees.
The API gravity less than 10 degrees will have a specific gravity greater than one which is higher
than that of the water. At this point, the heavy oil will not float but will sink into the water in the
Page 14
5
reservoir (Gordon, 2012). According to Gordon (2012), the API gravity for heavy oil is below 22
degrees which is different from the initial report from Meyer & Witt (1990).
2.1.1 Origin of Heavy Crude Oil
Geologically, crude oil originated from the solar energy synthesized by living organisms millions
of years ago (Hubert, 1956). Hubert’s descriptions on the origin of crude oil can be summarized
as: (1) the burial of past living organisms in sedimentary rock; (2) hydrocarbon transformation;
(3) migration; (4) oil and Gas accumulation; and (5) sedimentary reservoir rocks (flow in porous
media). The geological approach on the origination of crude oil has long been accepted by
geologists as they believed that crude oil was formed millions of years ago by organic organisms
living in different places in the earth’s crust, particularly rivers, oceans, and lakes as described by
Hubert (1956). Hubert also added that the continuous burial of organic matter before they decay
with the sediments on top of them is the origination point of hydrocarbon. It can be said that
crude oil was formed from hydrocarbons synthesized by living organisms in addition to those
formed by thermal alteration of organic matter in sedimentary rocks (Bluemle & Manz, n.d.).
After the formation of hydrocarbon in the source rock, there will be an upward movement of the
reservoir fluids through the water and other subsurface materials. This upward movement is
possible due to the low density of the crude oil and gas (Hubert, 1956). Additionally, the upward
movement will continue until the point where there is a “trap” to hold the hydrocarbon in place.
At the present, the hydrocarbon tends to settle in sedimentary reservoir rock which is a porous
media that can allow fluids to move freely in them. Most of these hydrocarbon fluids are located
in sedimentary rocks which include sandstone and limestone; although some smaller fluids have
been identified in igneous or metamorphic rocks (Hubert, 1956).
Page 15
6
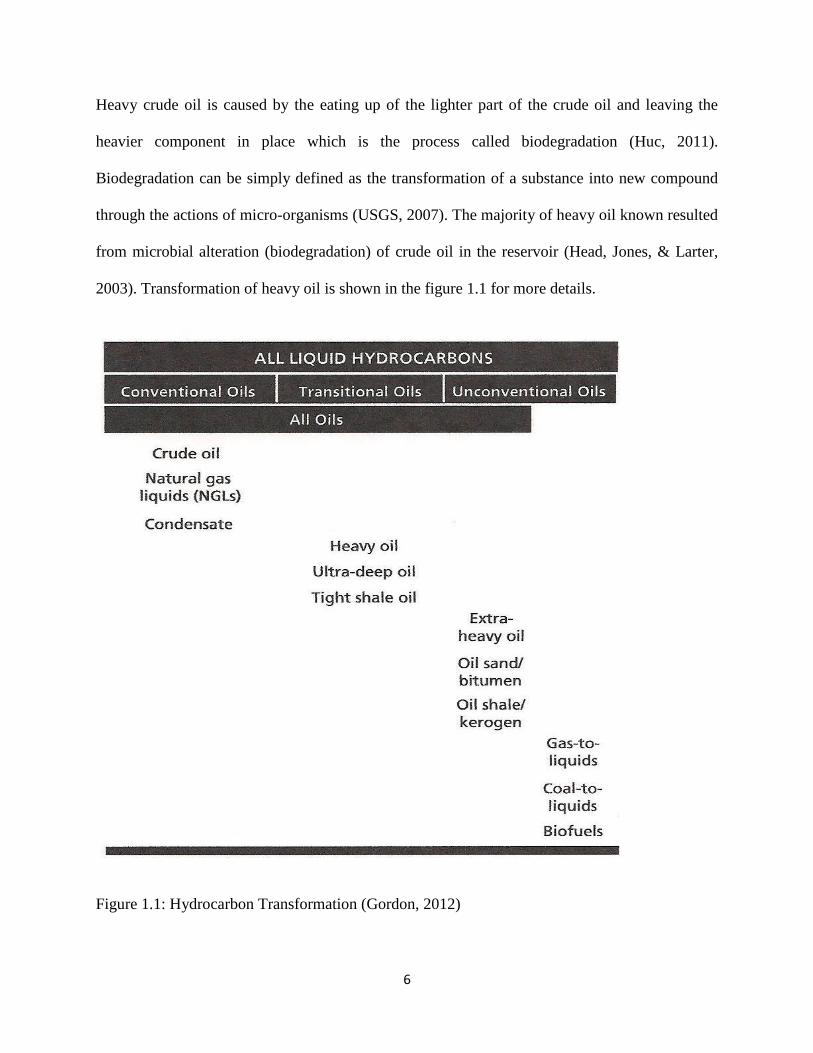
Heavy crude oil is caused by the eating up of the lighter part of the crude oil and leaving the
heavier component in place which is the process called biodegradation (Huc, 2011).
Biodegradation can be simply defined as the transformation of a substance into new compound
through the actions of micro-organisms (USGS, 2007). The majority of heavy oil known resulted
from microbial alteration (biodegradation) of crude oil in the reservoir (Head, Jones, & Larter,
2003). Transformation of heavy oil is shown in the figure 1.1 for more details.
Figure 1.1: Hydrocarbon Transformation (Gordon, 2012)
Page 16
7
2.1.2 Heavy Crude Oil Composition
Crude oil in general consists of many compositions including Stearic acid and Naphthoic acid
which were identified by previous researchers (Becker, 1997). According to the produced water
from Norwegian North Sea platforms, carboxylic acids seem to have the highest concentration of
organic components (Reed & Johnsen, 1996). Alberta oil is also said to contain a great deal of
the carboxylic acids, which are also referred to as cycloaliphatic carboxylic acid (Birkholz,
2012). Apart from the listed components of the North Sea platforms, Reed and Johnsen (1996)
also included major components of crude oil (termed ‘dissolved components’) in produced water
which fatty acids (carboxylic acids) have the highest concentration (see table 2.1).
Table 2.1: Dissolved Component in Produced Water (Reed & Johnson, 1996)
2.2 Heavy Crude Oil Recovery
Heavy crude oil recovery had been very troublesome to the oil and gas industry as it requires a
great deal of energy to get the crude to the surface. Over the last several years, however, there
has been positive news from researchers around the world on how to solve this problem using
Enhanced Oil Recovery (EOR). EOR is the process by which liquid hydrocarbon in situ can be
produced when we cannot produce any more liquid by primary or secondary recovery methods
Page 17
8
(Jahn, Cook, & Graham, 2003). Jahn, Cook, and Graham (2003) outlined the three categories of
EOR techniques, which include thermal techniques, chemical techniques, and miscible
processes.
2.2.1 Thermal Technique
Thermal technique is the term used for crude oil recovery by using the injection of steam into the
reservoir thereby reducing the viscosity of crude oil allowing for a free flow of fluid
(hydrocarbon) to the surface. Steam Assisted Gravity Drainage (SAGD) is one of the method
used for the steam injection and is said to be one of the most effective thermal technique used for
the Canadian bitumen production due to its high recovery in crude oil (Sawatzky, 2004).
According to Cenovus Energy Inc., SAGD as shown in figure 2.2 was first recognized in Alberta
in 1996 and the full operation began in 2001.
Figure 2.2: Steam Assisted Gravity Drainage Process (Cenovus Energy Inc. n.d)
Page 18
9
2.2.2 Chemical Technique
Previous researchers (e.g., Wen-Zhang, 1994) have recorded that the discovery of the thermal
method has helped to recover crude oil in China, although it can only be applied in certain
reservoir types for compatibility. Before using a chemical EOR, one has to consider the reservoir
condition and the fluid properties for compatibility with the chemical needed to be injected (Luo,
n.d). Further research developed another method termed ‘chemical injection’ which recovers a
higher rate of crude oil than the thermal method; however, this has not been commonly used due
to the high cost of these chemicals termed surfactants. See Figure 2.3 for details.
Figure 2.3: Surfactant Flooding (PEERI, 2011)
2.2.3 Miscible Processes
This part of EOR is made possible by injection of gases that is miscible with crude oil (Romero-
Zerón, 2012). Some of these miscible gases were mentioned: liquefied petroleum gases (LPG),
carbon dioxide, high pressure methane, and high pressure nitrogen. Additionally, Romero-Zerón
Page 19
10
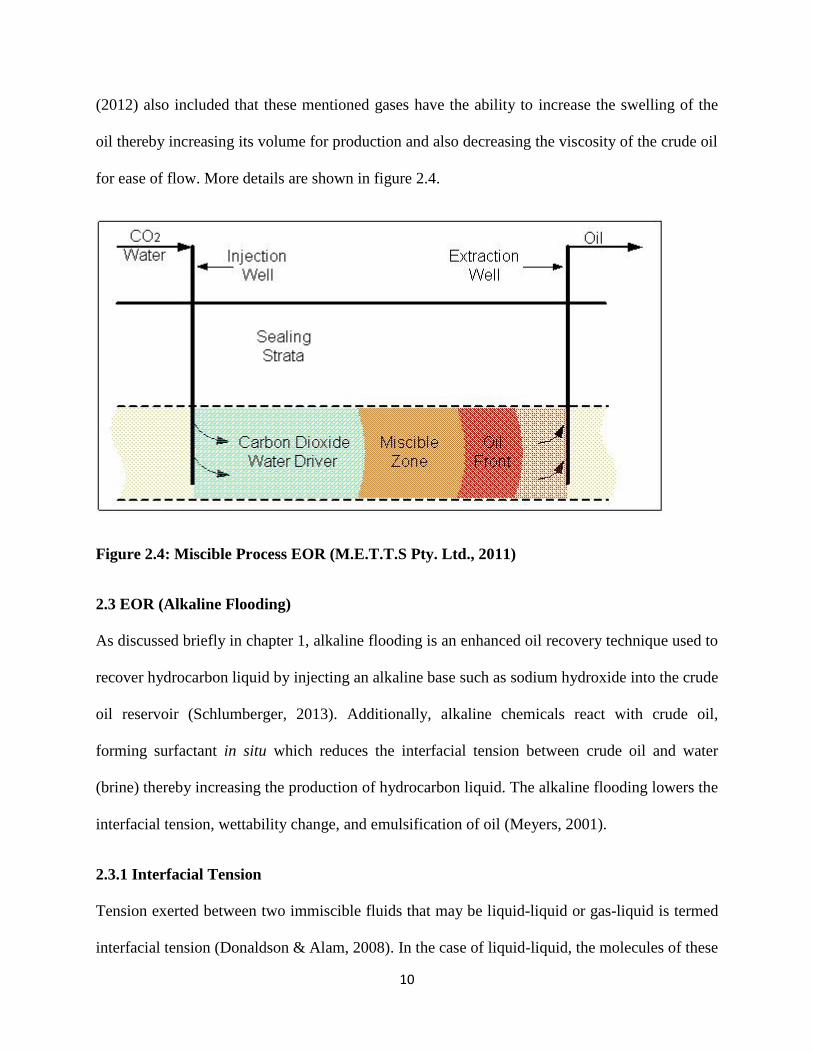
(2012) also included that these mentioned gases have the ability to increase the swelling of the
oil thereby increasing its volume for production and also decreasing the viscosity of the crude oil
for ease of flow. More details are shown in figure 2.4.
Figure 2.4: Miscible Process EOR (M.E.T.T.S Pty. Ltd., 2011)
2.3 EOR (Alkaline Flooding)
As discussed briefly in chapter 1, alkaline flooding is an enhanced oil recovery technique used to
recover hydrocarbon liquid by injecting an alkaline base such as sodium hydroxide into the crude
oil reservoir (Schlumberger, 2013). Additionally, alkaline chemicals react with crude oil,
forming surfactant in situ which reduces the interfacial tension between crude oil and water
(brine) thereby increasing the production of hydrocarbon liquid. The alkaline flooding lowers the
interfacial tension, wettability change, and emulsification of oil (Meyers, 2001).
2.3.1 Interfacial Tension
Tension exerted between two immiscible fluids that may be liquid-liquid or gas-liquid is termed
interfacial tension (Donaldson & Alam, 2008). In the case of liquid-liquid, the molecules of these
Page 20
11
liquids exert some forces to attract them together. Reducing these attractive forces is then
reduces the interfacial tension which will help in achievement of better sweep record.
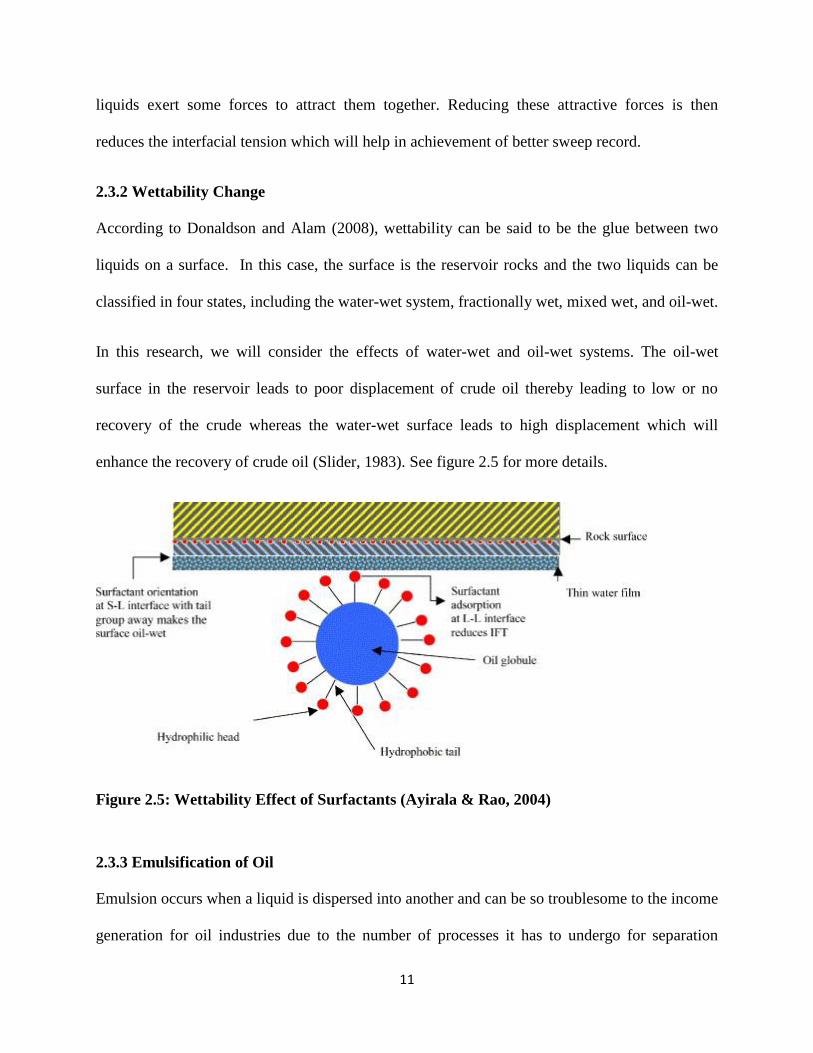
2.3.2 Wettability Change
According to Donaldson and Alam (2008), wettability can be said to be the glue between two
liquids on a surface. In this case, the surface is the reservoir rocks and the two liquids can be
classified in four states, including the water-wet system, fractionally wet, mixed wet, and oil-wet.
In this research, we will consider the effects of water-wet and oil-wet systems. The oil-wet
surface in the reservoir leads to poor displacement of crude oil thereby leading to low or no
recovery of the crude whereas the water-wet surface leads to high displacement which will
enhance the recovery of crude oil (Slider, 1983). See figure 2.5 for more details.
Figure 2.5: Wettability Effect of Surfactants (Ayirala & Rao, 2004)
2.3.3 Emulsification of Oil
Emulsion occurs when a liquid is dispersed into another and can be so troublesome to the income
generation for oil industries due to the number of processes it has to undergo for separation
Page 21
12
(Kokal & Aramco, 2002). Additionally, emulsion can then be classified in three different forms
that include water-in-oil, oil-in-water, and multiple/complex emulsions.
Page 22
13
CHAPTER 3: REACTIONS OF CARBOXYLIC ACIDS WITH BASES
3.1 Reaction of NaOH with Carboxylic Acids
Let us consider the chemical reaction below to see why this reduction in interfacial tension will
be possible in situ. Reaction between NaOH and carboxylic acids will form Salts of carboxylic
acids (soap) and water (Morrison & Boyd, 1978). This can be written as shown: RCOO-Na
+ +
H2O
RCOOH + NaOH RCOO-Na
+ + H2O [3.1]
RCOOH is the carboxylic acid and R depends on the number of carbon atoms we have. The
reaction of carboxylic acid was also shown by Morrison & Boyd (1978) where Lauric acid reacts
with NaOH to form Sodium Laurate.
CH3(CH2)10COOH + NaOH CH3(CH2)10COO-Na
+ + H2O [3.2]
Using the above procedure, we can get the reaction between NaOH and stearic acid to form
Sodium Stearate and water.
CH3(CH2)16COOH + NaOH CH3(CH2)16COO-Na
+ + H2O [3.3]
Carboxylic acid group are mostly located in the heavy end fraction of crude oil. Results have
shown that phenols and carboxylic acids are the major portion of the acidic specie in heavy crude
oil (Fathi, Austad, Strand, & Puntervold, 2010). Moreover, Head, Jones, & Larter (2003)
recorded that heavy crude oil contains carboxylic acids.
3.2 TBAOH with Carboxylic Acids
TBAOH was selected amongst other organic bases due to its previous observations and
applications (see chapter 1 and section 3.3). TBAOH reacts with fatty acids (carboxylic acids);
for example, the ones with C12 (lauric acid), C14 (myristic acid), C18 (stearic acid), C22 (behenic
Page 23
14
acid), and C24 (lignoceric acid) to form tetrabutylammonium alkyl carboxylate, which is a form
of surfactant (Zana, Schmidt, & Talmon, 2005). Stearic acid was recorded by Becker (1997) as
one of the main carboxylic acid contained in crude oil. Reaction of the carboxylic acids with
tetrabutylammonium hydroxide gives the result of tetrabutylammonium alkyl carboxylate as also
recorded by Zana et al. (2005). This alkyl carboxylate was concluded to be a surfactant. Section
3.3 has some details concerning the previous applications of TBAOH which gives another reason
to try out the effect it may have on IFT.
3.3 Tetrabutylammonium hydroxide Applications
This organic base is considered in previous studies as:
Phase transfer catalyst
Swelling agent
Dispersing agent
Surfactant
Formation of foam
3.3.1 Phase Transfer Catalyst
TBAOH can be used as a phase transfer catalyst and it is one of the commonly used phase
transfer catalyst (Starks, Liotta, & Halpern, 1994). Phase transfer catalyst is said to be a chemical
technique that is used to speed up a chemical reaction between two liquids (Carey & Sundberg,
2007). For the phase transfer catalyst to be successful, a condition have to be met which is if it
transfers enough of the anion from the aqueous phase to the organic phase in order for the
reaction to be accomplished in a good time frame as discussed by Starks, Liotta, & Halpern,
(1994).
Page 24
15
3.3.2 Swelling Agent
TBAOH is also considered to be a swelling agent (Thenganpallil, 1991). Swelling agent helps to
reduce the viscosity of heavy crude oil by swelling the oil phase (Ramirez, 1987). An example of
a tested swelling agent is carbon dioxide, which is used for EOR of crude oil as described by
Ramirez (1987). Romero-Zerón (2012) also added that the purpose of the injection fluids in the
reservoir for recovery sometimes includes the swelling of the crude oil. If carbon hydroxide
increases the swelling phase of crude oil, then TBAOH should be able to do same in the reservoir
by reducing the viscosity of crude oil which will help in better displacement of the oil.
3.3.3 Dispersing Agent
TBAOH has been identified as a dispersing agent that has been used successfully to disperse
fatty acids instead of using sodium hydroxide (Fameau, et al., 2011). Dispersing agents are
compounds that reduce the bond between liquids (hydrocarbon liquid) and also break them into
smaller droplets allowing them to be swept easily according to Emergency Management (2011).
3.3.4 Surfactant
Not only does TBAOH react with carboxylic acids to form a salt that is a form of surfactant, it is
also considered as a surfactant by itself (Monopoli, et al., 2010). Although TBAOH is considered
to be under the quaternary ammonium group, according to the example given by Speel and poats
(1964), sodium lauryl sulfate has its hydrophobic end to be negatively charged. Surfactants are
said to serve as detergents, wetting agents, emulsifiers, dispersants, and foaming agents
according to Fink (2012).
Page 25
16
3.3.5 Formation of Foam
TBAOH was also identified to foam when reacts with a long chain of fatty acids (Fameau,
Ventureira, Novales, & Douliez, 2012). If this is going to foam, then there is a better chance that
it will reduce interfacial tension. It is true that this can form a foaming soap; however, it does not
mean that it will be more effective than the foamless soaps, as the foamless soaps are said to be
as effective as those that are foaming by Speel and Poats (1964). This may be seen as a clear
indication that TBAOH can be a cleansing agent.
Page 26
17
CHAPTER 4: EOR PREPARATION AND EXPERIMENT
4.1 Crude Oil Selection
Doba Chad crude oil was examined and taken into consideration in the present experiment. The
Doba Chad crude oil was selected for this experiment due to its properties which includes having
an API value of 21.10 (Chevron, 2001). The crude oil was supplied by a client named
ConocoPhillips, Caleb Brett Canada Limited. According to Chevron, Doba Chad crude has an
acid number of 5.18 mg KOH/g. Section 4.1.1 was taken into consideration to test for the
carboxylic acid in the selected crude. Because of the high acid content in the Doba Chad crude
oil, it was selected for the present experiment. Figure 4.3 is the spectrum recorded following the
procedure in section 4.1.1.
Doba Chad crude oil is situated in upper cretaceous and lower cretaceous located at about 1000m
to 3000m and 3000m to 3400m depth respectively as recorded by United Hydrocarbon (2013).
The Basin is shown in figure 4.1 containing the central African rift basins.
Figure 4.1: Central African Rift Basins (United Hydrocarbons, 2013)
Page 27
18
4.1.1 Acid Content Determination
Acid content determination was performed to prove the existence of carboxylic acids in Doba
Chad crude oil, as it is required to react with TBAOH. Previous researchers of heavy oil (e.g.
Reed & Johnsen, 1996; Becker, 1997; Birkholz, 2012) agreed that heavy crude oil contains
carboxylic acids (as shown in table 2.1). The equipment used to determine the unknown acids is
called Fourier Transform Infrared (FT-IR) Spectrometer (Thermo Nicolet Corporation, 2001).
After following FT-IR manual of Attenuated Total Reflection (ATR) procedure (PerkinElmer,
n.d), it was found that Doba Chad crude oil contain carboxylic acids. Although carboxylic acid is
not the only acid component in crude oil, it is the acid of interest in the present study.
The principle of ATR functions by measuring the changes that occur internally when the beam
comes in contact with the sample (for example: crude oil) as noted by PerkinElmer Life and
Analytical Sciences. For the measurement to be actualised there must be a good contact between
the sample being examined and the crystal surface. Figure 4.2 is the example of ATR System.
Figure 4.2: ATR System for FT-IR (PerkinElmer, n.d)
Consider the figure 4.3 that shows the spectrum of Doba Chad crude oil performed in the
Chemical Engineering laboratory to show the existence of carboxylic acid in the Doba Chad
crude oil used for the present study.
Page 28
19
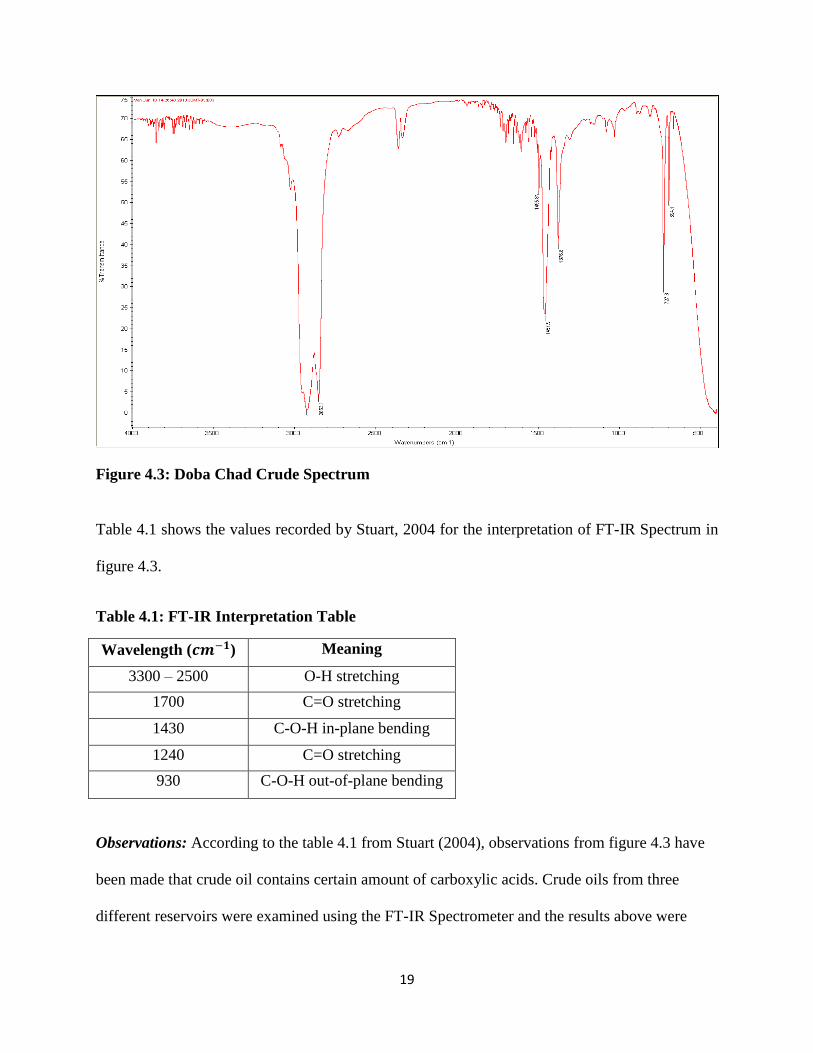
Figure 4.3: Doba Chad Crude Spectrum
Table 4.1 shows the values recorded by Stuart, 2004 for the interpretation of FT-IR Spectrum in
figure 4.3.
Table 4.1: FT-IR Interpretation Table
Wavelength ( ) Meaning
3300 – 2500 O-H stretching
1700 C=O stretching
1430 C-O-H in-plane bending
1240 C=O stretching
930 C-O-H out-of-plane bending
Observations: According to the table 4.1 from Stuart (2004), observations from figure 4.3 have
been made that crude oil contains certain amount of carboxylic acids. Crude oils from three
different reservoirs were examined using the FT-IR Spectrometer and the results above were
Page 29
20
obtained. Between 2500 and 3300 , there was a stretch which is termed ‘O-H stretching’
which shows the existence of carboxylic acid. Additionally, between 1400 and 1500 , there
is another stretch that falls on the C-O-H in-plane bending. These interpretations confirm the
existence of carboxylic acid in the crude oil.
4.1.2 Crude Oil and Brine Density Determination
The density for the crude oil used was performed at different temperatures as the spinning drop
tensiometer requires the light phase density for an accurate result (see chapter 5 for results). This
is where pycnometer comes into play which is used to measure the density of a liquid
(Williamson & Peck, 2009). This method was embraced due to the small amount of liquid
sample needed to perform this experiment compared to the hydrometer which requires a larger
amount of liquid. It is advisable to leave the pycnometer in the water bath for about twenty
minutes in order to obtain temperature equilibrium from the test liquid contained in the
pycnometer (ASTM, 1960). This procedure was described under ASTM D1429-56T.
Additionally, ASTM 1480-81 for petroleum products and lubricants also illustrated how the
pycnometer can be calibrated and used for density measurements (ASTM, 1986).
4.2 Brine
Brine was prepared by adding 24.5g of NaCl, 15g of CaCl2, and 10g of MgCl2 to 400g of water.
The accuracy for the measuring device used is 0.1g. Concentration of Na+ is higher according to
the North-Sea formation brine that was imitated. This concentration was prepared by taking into
consideration the main components of the sea water deemed chloride dominated. According to
the Concise Oxford dictionary, the term ‘dominate’ can be said to be something that is more
important or that has taken control amongst others (Sykes, 1982). The listed quantity of water
Page 30
21
will be used for each experiment due to the amount of times the spinning drop will be cleaned or
flushed with brine to eliminate air bubbles.
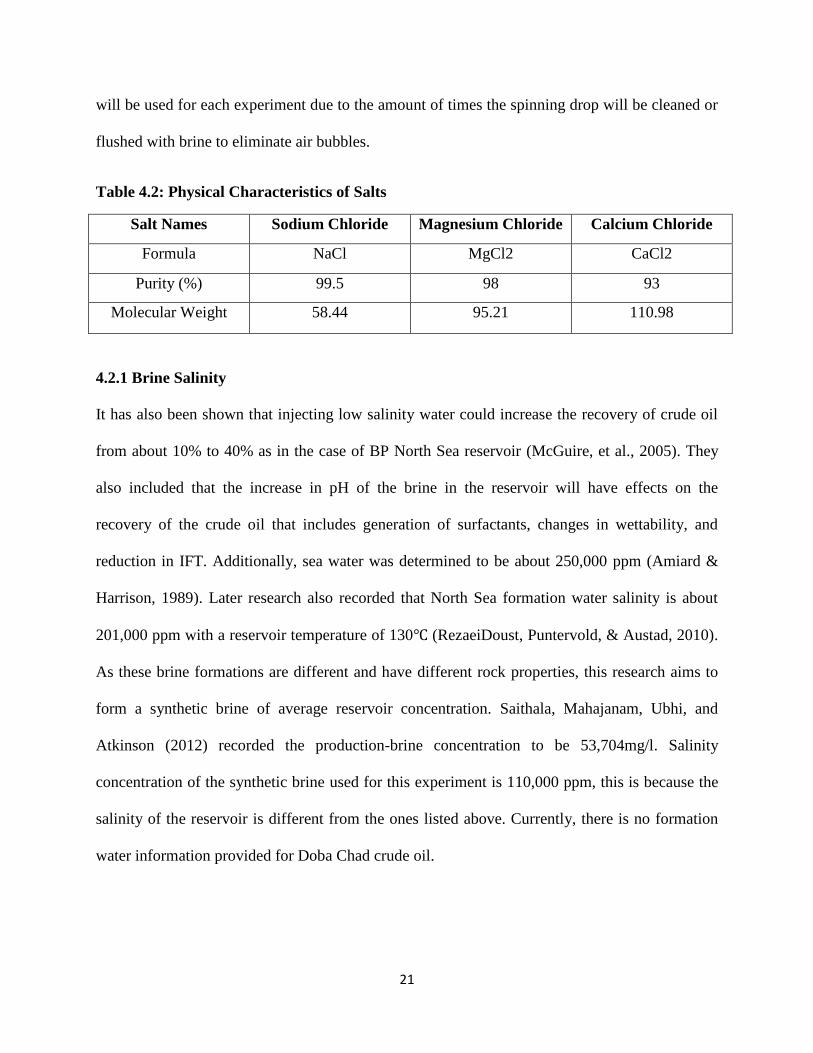
Table 4.2: Physical Characteristics of Salts
Salt Names Sodium Chloride Magnesium Chloride Calcium Chloride
Formula NaCl MgCl2 CaCl2
Purity (%) 99.5 98 93
Molecular Weight 58.44 95.21 110.98
4.2.1 Brine Salinity
It has also been shown that injecting low salinity water could increase the recovery of crude oil
from about 10% to 40% as in the case of BP North Sea reservoir (McGuire, et al., 2005). They
also included that the increase in pH of the brine in the reservoir will have effects on the
recovery of the crude oil that includes generation of surfactants, changes in wettability, and
reduction in IFT. Additionally, sea water was determined to be about 250,000 ppm (Amiard &
Harrison, 1989). Later research also recorded that North Sea formation water salinity is about
201,000 ppm with a reservoir temperature of 130℃ (RezaeiDoust, Puntervold, & Austad, 2010).
As these brine formations are different and have different rock properties, this research aims to
form a synthetic brine of average reservoir concentration. Saithala, Mahajanam, Ubhi, and
Atkinson (2012) recorded the production-brine concentration to be 53,704mg/l. Salinity
concentration of the synthetic brine used for this experiment is 110,000 ppm, this is because the
salinity of the reservoir is different from the ones listed above. Currently, there is no formation
water information provided for Doba Chad crude oil.
Page 31
22
4.3 Brine and Salt
The brine was prepared according to the information provided in section 4.2. TBAOH was
purchased at Sigma Aldrich in Canada having 40% weight in water.
Table 4.3: Physical Characteristic of Tetrabutylammonium hydroxide
Formula Purity Density Molecular Weight (g/mol)
C16H37NO 40% 0.99g/ml @ 25℃ 259.47
Table 4.4: TBAOH concentrations
No. % wt of salts and TBAOH
components
ppm of brine and 40% wt
TBAOH
1 11% salts 110,000
2 11% salts + 0.1 % TBAOH 110,000; 1,000
3 11% salts + 0.2 % TBAOH 110,000; 2,000
4 11% salts + 0.3 % TBAOH 110,000; 3,000
5 11% salts + 0.4 % TBAOH 110,000; 4,000
6 11% salts + 0.6 % TBAOH 110,000; 6,000
7 11% salts + 1 % TBAOH 110,000; 10,000
8 11% salts + 2 % TBAOH 110,000; 20,000
4.4 Equipment Used
Spinning Drop Tensiometer Site-100. The Site-100 is used to calculate the interfacial tension of
hydrocarbon liquid (KRUSS, 2003). The diagrammatic representation of the Site-100 Spinning
Drop Tensiometer can be seen in figure 4.4.
Page 32
23
Figure 4.4: Site-100 Spinning Drop Tensiometer (from Dalhousie laboratory)
Figure 4.5 was taken from the manufacturer’s manual to show some internal parts of this
machine.
Figure 4.5: The Measuring Cell (KRUSS Manual)
Page 33
24
Other apparatus used to actualize our aim includes:
Pycnometer: This is used to measure the density of the crude oil and the synthetic brine mixture.
FT-IR Spectroscopy: This is used to provide the unknown component of a solution. In the case
of crude oil, it is used to detect the acids contained in the crude oil. Additionally, it can be used
to determine the quality of a sample and the amount of components in a sample as explained by
Thermo Nicolet Corporation (2001).
Thermometer: For the density to be measure at each temperature, thermometer is needed to
measure the required temperature in the water bath before pycnometer is immersed in the water.
G10 Gyrotory Shaker: This is used to thoroughly mix the synthetic brine or the crude oil-
toluene.
4.4.1 Principle of Spinning Drop Tensiometer
The spinning drop method is sometimes referred to as the rotational method. This method is used
to set up a balance between the centrifugal force and the surface tension (Schramm, 2005).
According to the Young-Laplace equation described by Schramm (2005), the presence of the
pressure difference across the curved surface can be used to determine the interfacial tension. For
example, if there is an interface between phase A and B where phase A is the light phase and
phase B is the heavy phase, it will have a pressure and when the principle radii of
curvature are R1 and R2.
ΔP = PA - PB = Ƴ (1/R1 + 1/R2) [4.1]
This is then further broken down to be: ΔP = PA - PB = 2Ƴ/R [4.2]
where:
Page 34
25
ΔP varies with the radius R, PA > PB. This shows that the pressure exerted inside the bubble is
greater than the pressure outside the bubble.
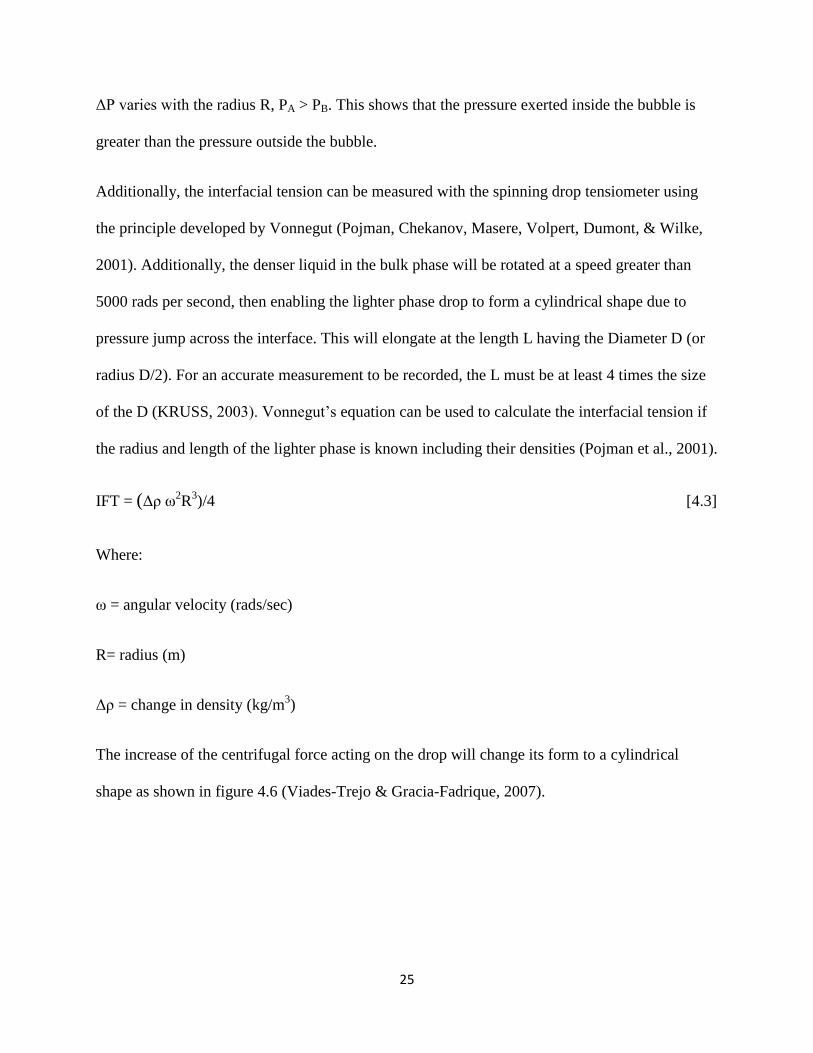
Additionally, the interfacial tension can be measured with the spinning drop tensiometer using
the principle developed by Vonnegut (Pojman, Chekanov, Masere, Volpert, Dumont, & Wilke,
2001). Additionally, the denser liquid in the bulk phase will be rotated at a speed greater than
5000 rads per second, then enabling the lighter phase drop to form a cylindrical shape due to
pressure jump across the interface. This will elongate at the length L having the Diameter D (or
radius D/2). For an accurate measurement to be recorded, the L must be at least 4 times the size
of the D (KRUSS, 2003). Vonnegut’s equation can be used to calculate the interfacial tension if
the radius and length of the lighter phase is known including their densities (Pojman et al., 2001).
IFT = (Δρ ω2R
3)/4 [4.3]
Where:
ω = angular velocity (rads/sec)
R= radius (m)
Δρ = change in density (kg/m3)
The increase of the centrifugal force acting on the drop will change its form to a cylindrical
shape as shown in figure 4.6 (Viades-Trejo & Gracia-Fadrique, 2007).
Page 35
26
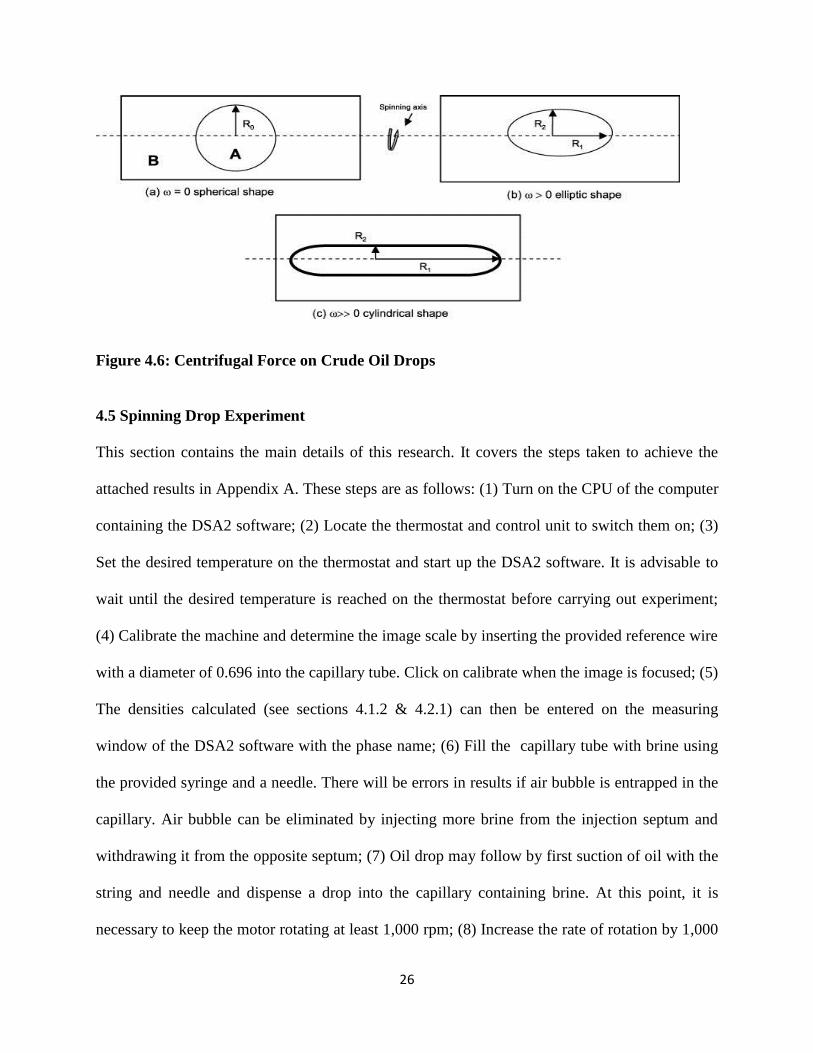
Figure 4.6: Centrifugal Force on Crude Oil Drops
4.5 Spinning Drop Experiment
This section contains the main details of this research. It covers the steps taken to achieve the
attached results in Appendix A. These steps are as follows: (1) Turn on the CPU of the computer
containing the DSA2 software; (2) Locate the thermostat and control unit to switch them on; (3)
Set the desired temperature on the thermostat and start up the DSA2 software. It is advisable to
wait until the desired temperature is reached on the thermostat before carrying out experiment;
(4) Calibrate the machine and determine the image scale by inserting the provided reference wire
with a diameter of 0.696 into the capillary tube. Click on calibrate when the image is focused; (5)
The densities calculated (see sections 4.1.2 & 4.2.1) can then be entered on the measuring
window of the DSA2 software with the phase name; (6) Fill the capillary tube with brine using
the provided syringe and a needle. There will be errors in results if air bubble is entrapped in the
capillary. Air bubble can be eliminated by injecting more brine from the injection septum and
withdrawing it from the opposite septum; (7) Oil drop may follow by first suction of oil with the
string and needle and dispense a drop into the capillary containing brine. At this point, it is
necessary to keep the motor rotating at least 1,000 rpm; (8) Increase the rate of rotation by 1,000
Page 36
27
rpm until the dispensed fluid is at least four times its diameter; (9) For each dispensed drop,
measure the IFT with respect to time until there is no change observed; and (10) To ensure an
accurate result, it is advisable to take about two to three measurements on each drop.
Page 37
28
CHAPTER 5: RESULTS AND DISCUSSION
5.1 Densities of Heavy Phase and Light Phase
Table 5.1 and 5.2 are the density values determined using pycnometer. This shows that the
higher the temperature of a liquid, the lower its density becomes. Figure 5.1 and figure 5.2 can
be studied for more details.
Table 5.1: Doba Chad crude oil diluted with 20% of Toluene by mass
Temperature (oC) Density (g/ml)
40 0.8746
50 0.8720
60 0.8696
70 0.8673
80 0.8649
90 0.8626
Table 5.2: Synthetic Brine Density
Temperature (oC) Density (g/ml)
40 1.0466
50 1.0450
60 1.0431
70 1.0404
80 1.0382
90 1.0361
Page 38
29
Figure 5.1: Doba Chad crude oil Density
Figure 5.2: Synthetic Brine Density
R² = 0.9996
0.8600
0.8620
0.8640
0.8660
0.8680
0.8700
0.8720
0.8740
0.8760
30 40 50 60 70 80 90 100
De
nsi
ty (
g/m
l)
Temperature (℃)
Doba Chad Crude Oil Density
R² = 0.9951
1.0340
1.0360
1.0380
1.0400
1.0420
1.0440
1.0460
1.0480
30 40 50 60 70 80 90 100
De
nsi
ty (
g/m
l)
Temperature (℃)
Synthetic Brine Density
Page 39
30
5.2 Interfacial Tension Results
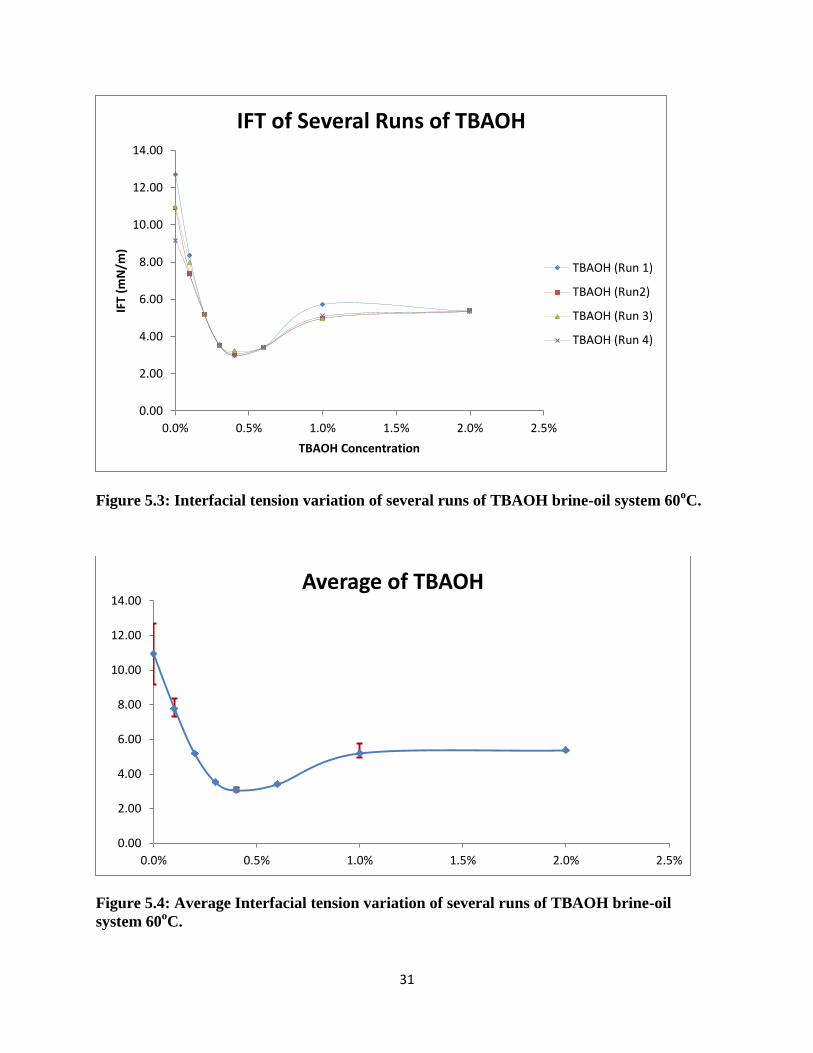
IFTs were recorded using the site-100 Spinning Drop Tensiometer (see figures 5.3 and 5.4); the
sources for these figures are located in appendix A and appendix B. There are two cameras
available for the site-100 spinning drop tensiometer that includes 2.5 lens fold and 5.0 lens fold.
The 2.5 lens was chosen due to the ease of using this to achieve our aim because it was said to be
suitable for all measurements, but less accurate for small diameters. The decision for using this is
due to the initial difficulties encountered while using the 5.0 lens as the image appears too large
for this measurement. This was also noted in the KRUSS manual as being a possible concern,
although the 5.0 lens is considered to be generally more accurate for smaller diameters (which
are for lower interfacial tensions).
5.3 TBAOH Flooding
The lowest average interfacial tension for TBAOH was determined to be 3.07mN/m at 0.4% (see
figure 5.4 for the average IFT variation of several runs at 60oC). To ensure accuracy, each of the
tests was done four times. Conclusion is drawn that TBAOH can be used to recover crude oil as
the lowering of IFT was observed but recommended for more studies to be carried on. According
to figure 5.4, the error bars decreases as we increase the concentration of the TBAOH in the
system; however, there was a slight increase in the error bar at 1% of TBAOH.
Page 40
31
Figure 5.3: Interfacial tension variation of several runs of TBAOH brine-oil system 60oC.
Figure 5.4: Average Interfacial tension variation of several runs of TBAOH brine-oil
system 60oC.
0.00
2.00
4.00
6.00
8.00
10.00
12.00
14.00
0.0% 0.5% 1.0% 1.5% 2.0% 2.5%
IFT
(mN
/m)
TBAOH Concentration
IFT of Several Runs of TBAOH
TBAOH (Run 1)
TBAOH (Run2)
TBAOH (Run 3)
TBAOH (Run 4)
0.00
2.00
4.00
6.00
8.00
10.00
12.00
14.00
0.0% 0.5% 1.0% 1.5% 2.0% 2.5%
Average of TBAOH
Page 41
32
5.4 Interpretation of IFT
At 0.4 % of TBAOH, the interfacial tension will begin to increase back to its original point. Le
Chatelier’s principle can be used to describe the observed IFT by using the equation 5.1 (Fox &
Whitesell, 2004)
A + B ↔ C [5.1]
This shows that when A is added to B, it will give a result of C. However, at some point, there
will be no more A to react with B; at this point, B has used all that is needed to produce C. Then
the reaction will reverse to produce A. This is what happened during the experiment, as TBAOH
is used to lower the interfacial tension by reacting it with the carboxylic acid contained in the oil.
There will be a time, however, when the carboxylic acid is not enough to react with the amount
of TBAOH injected. At this point, the interfacial tension will increase.
5.5 Observations
TBAOH was injected up to 6% to report its reaction in higher concentrations. Unexpectedly, the
dispersing of crude oil and the breakdown of crude oil into small droplets in the brine solution
was observed. This process was repeated three times for consistency. Therefore, TBAOH can be
considered to be a dispersing agent at some concentration in a solution containing crude oil as
also recorded by Fameau et al. (2011) and Emergency Management (2011). Due to the limited
time provided for this research and the amount of people needed to use the laboratory, the IFTs
were run only four times for each TBAOH concentration.
When TBAOH was added to the brine, precipitates were observed after some time. It can then be
concluded that Calcium Chloride contained in the brine mixture will react with the brine to form
Calcium hydroxide precipitate (Neal & Stanger, 1984). Moreover, previous researcher (e.g.
Page 42
33
Donaldson & Alam, 2008) has recorded the chemical representative of precipitation reaction
showing how the injected alkaline reacts with the calcium and magnesium contained in the brine
to form Ca(OH)2 and Mg(OH)2 precipitates (e.g. equations 6.1 and 6.2).
When the alkaline reacts with the brine salts to form precipitate, some of the alkaline needed to
form a better surfactant can be used up. This then concludes that the effect of surfactant
formation in situ will also depend on the type of formation brine of the reservoir.
Ca+ + 2OH
- ↔ Ca(OH)2 [6.1]
Mg+
+ 2OH- ↔ Mg(OH)2 [6.2]
5.6 Challenges Encountered
Three difficulties arose while performing the experiments. These difficulties include:
1. The initial 10% toluene used for dilution was not good enough as it was still hard to go
into the syringe through the provided needle. If in any case it is forced in, at some point,
it will be stuck to the capillary instead of rotating. Therefore, an additional 10% of
toluene was added to enable this research to be accomplished.
2. Air bubbles coming into the capillary tube which has an effect on the IFT measurements.
The flushing of the capillary tube with brine has to be done several times to eliminate
these air bubbles.
3. The size of the oil drop also posed a concern as it was difficult to inject the correct
amount of oil into the brine. After few days of practice, however, it became easier to
inject the appropriate amount of oil into the brine phase.
Page 43
34
CHAPTER 6: CONCLUSIONS AND RECOMMENDATIONS
6.1 EOR Summary
Having discussed the effect of TBAOH flooding in the recovery of crude oil, it was found that
one can effectively use TBAOH to reduce the IFT of brine-oil; although, the decrease in
interfacial tension was not much. According to figure 4.3, the crude oil used was successfully
examined and recorded to contain carboxylic acid. The densities of the crude oil and synthetic
brine were recorded as shown in table 5.1 and 5.2.
6.2 Conclusions
As the TBAOH concentration increases, the IFT decreases, although there was a reverse in the
action due to the earlier discussion in equation 5.1. Note that the allowable time before the
readings were taken is between three to five minutes to allow for the stabilization of the IFT. The
lowest average interfacial tension for TBAOH is 3.07mN/m at 0.4%. According to table 4.4, one
can say that 4,000 ppm is the critical IFT needed to produce the highest amount of crude when
using TBAOH. Emulsifiers, dispersants, and foaming agents were mentioned in section 3.3.4 as
some of the applications of surfactants. It is then concluded that TBAOH has similar applications
as dispersing of crude oil and emulsification were observed in addition to foaming on stirring.
6.3 Recommendations
Note that the optimum alkaline concentration needed for each flooding to form a better surfactant
depends on the formation brine and the composition of the oil as we need longer chain of
carboxylic acids to form an effective surfactant. It will also be interesting to know the effect of
crude oil from another reservoir and composition on IFT using TBAOH.
Page 44
35
In the present research, condensate was examined and noted to be able to dilute heavy crude oil.
Future research should study the IFT of TBAOH using diluted crude oil with condensate to
compare with the result of the diluted crude oil with toluene. Additionally, salinity concentration
of different reservoir brine should be examined to report the better reservoir brine condition
necessary for TBAOH flooding. Finally, the effect of residence time of the TBAOH in the
capillary tube on IFT should be explored in future research.
Page 45
36
REFERENCES
Ahmed, T. (2010). Reservoir Engineering Handbook. Burlington, USA: Elservier Inc. doi:10.1016/C2009-0-
30429-8
Amiard, J. P., & Harrison, B. (1989). North Sea Rw Catalogue. London: Society of Professional Well Log
Analysts. Retrieved from
http://www.statoil.com/en/TechnologyInnovation/OptimizingReservoirRecovery/RecoveryMeth
ods/WaterAssistedMethodsImprovedOilRecoveryIOR/Pages/LowSalinityWaterInjection.aspx
ASTM. (1960). Manual on Industrial Water and Industrial Waste Water. Baltimore, Md, USA: American
Society for Testing Materials.
ASTM. (1986). Annual Book of ASTM Standards for Petroleum Products, Lubricants, and Fossil Fuels. (Vol.
05.01). Philadelphia: ASTM.
Ayirala, S. C., & Rao, D. N. (2004, 07 14). Multiphase flow and wettability effects of surfactants in porous
media. Colloids and Surfaces A: Physicochemical and Engineering Aspects, 241(1 - 3), 313 - 322.
Retrieved from http://www.sciencedirect.com/science/article/pii/S0927775704002237
Becker, J. R. (1997). Crude Oil Waxes, Emulsions, and Ashphaltenes. Oklahoma: PennWell Publishing
Company. Retrieved from
http://books.google.ca/books?id=Qw9gwzzf4SAC&pg=PA41&lpg=PA41&dq=stearic+acid+in+cru
de&source=bl&ots=HneB0-
NWnb&sig=PfBGBsedlZlnTTFG7arWi4kJ6bc&hl=en&sa=X&ei=LBGMUaqnEoLWyQG3y4GgAQ&ve
d=0CDIQ6AEwATgU#v=onepage&q=stearic%20acid%20in%20crude&f=false
Birkholz, D. A. (2012). Napthanic Acids in the Environmental State of Union. Alberta: ALS Laboratory
Group (Environmental Testing Services). Retrieved from ALS Laboratory Group:
http://www.esaa-events.com/proceedings/watertech/2012/pdf/P33.pdf
Bluemle, J., & Manz, L. (n.d.). The Origin of Oil. 31, No. 1, 1. Retrieved from
https://www.dmr.nd.gov/ndgs/newsletter/NL04S/PDF/origin.pdf
Borisenko, V. E., & Ossicini, S. (2012). What is What in the Nanoworld: A Handbook on Nanoscience and
Nanotechnology. Weinheim, Germany: Wiley-VCH Verlag a& Co.
Carey, F. A., & Sundberg, R. J. (2007). Advanced Organic Chamistry. New York, United States of America:
Springer Science and Business Media, LLC. Retrieved from
http://books.google.ca/books?id=Y7yFyZjSy2IC&pg=PA225&dq=phase+transfer+catalyst+applic
ation&hl=en&sa=X&ei=FPGQUfXXJMmjqQGA7oH4DQ&ved=0CEwQ6AEwBQ#v=onepage&q=pha
se%20transfer%20catalyst%20application&f=false
Page 46
37
Cenovus Energy Inc. (n.d). Steam Assited Gravity Drainage (SAGD). Retrieved from Cenovus Energy Inc.:
http://www.cenovus.com/operations/technology/sagd.html
Chan, M., Sharma, M. M., & Yen, T. F. (1982). Generation of Surface Active Acids in Crude Oil for Caustic
Flooding Enhanced Oil Recovery. University of Southern California, Chemical Engineering. Los
Angeles: American Chemical Society. Retrieved from
http://faculty.engr.utexas.edu/sharma/pdfs/publications/Pub-9.pdf
Chevron. (2001). Doba (Chad). Retrieved from Chevron, Crude Oil Marketing:
http://crudemarketing.chevron.com/crude/african/doba.aspx
Clarke, M. C. (2011). Clean Coal Technology and Enhanced Oil Recovery - Matches and Mismatches.
Retrieved from M.E.T.T.S. Pty. Ltd. - Consulting Engineers: http://www.metts.com.au/clean-coal-
technology-enhanced-oil-recovery-matches-mismatches.html
Donaldson, E. C., & Alam, W. (2008). Wettability. Houston, Texas, USA: Gulf Publishing Company.
Retrieved from
http://www.knovel.com.ezproxy.library.dal.ca/web/portal/browse/display?_EXT_KNOVEL_DISP
LAY_bookid=2167
Dong, M., Ma, S., & Li, A. (2011). Sweep Efficiency Improvement by Alkaline Flooding for Pelican Lake
Heavy Oil. Canadian Unconventional Resources Conference (p. 1). Alberta: Society of Petroleum
Engineers. Retrieved from http://www.onepetro.org/mslib/servlet/onepetropreview?id=SPE-
148971-MS
Emergency Management. (2011, 1 27). Retrieved from U.S Environmental Protection Agency:
http://www.epa.gov/osweroe1/content/learning/disperse.htm
Erbil, H. Y. (2006). Surface Chemistry of Solid and Liquid Interfaces. Oxford, UK: Blackwell Publishing
Limited. Retrieved from ftp://s208.math.msu.su/139000/816bb4a95bb55e9a9ab15f57c33ca0c3
Fameau, A.-L., Houinsou-Houssou, B., Ventureira, J. L., Navailles, L., Nallet, F., Novales, B., & Douliez, J.-
P. (2011, 3 15). Self-Assembly, Foaming, and Emulsifying Properties of Sodium. 4505. Retrieved
from http://pubs.acs.org/doi/pdf/10.1021/la2002404
Fameau, A.-L., Ventureira, J., Novales, B., & Douliez, J.-P. (2012). Foaming and emulsifying properties of
fatty acids neutralized by tetrabutylammonium hydroxide. Colloids and Surfaces A:
Physicochemical and Engineering Aspects, 403, 87-95. Retrieved from
http://www.sciencedirect.com/science/article/pii/S0927775712002191
Fathi, S. J., Austad, T., Strand, S., & Puntervold, T. (2010). Wettability Alteration in Carbonates: The
Effect of Water-Soluble Carboxylic Acids in Crude Oil. 2974. doi:10.1021/ef901527h
Fink, J. (2012). Petroleum Engineer's Guide to Oil Field Chemicals and Fluids (First ed.). Oxford, UK: Elsevier Inc. Retrieved from http://books.google.ca/books?id=R1QC6eEo3_IC&pg=PT639&dq=surfactants+is+emulsifier+and
Page 47
38
+dispersant&hl=en&sa=X&ei=b_4HUpKKH5PwyAHymYCYAQ&ved=0CGEQ6AEwCA#v=onepage&q=surfactants%20is%20emulsifier%20and%20dispersant&f=false
Fox, M. A., & Whitesell, J. K. (2004). Organic Chemistry (3rd ed.). Jones and Bartlett Publishers Inc.
Retrieved from
http://books.google.ca/books?id=xx_uIP5LgO8C&pg=PA322&dq=Le+Chatelier%E2%80%99s+pri
nciple&hl=en&sa=X&ei=CyT5UerXA5Oo4APu7oG4Bg&ved=0CC4Q6AEwAA#v=onepage&q=Le%2
0Chatelier%E2%80%99s%20principle&f=false
Gordon, D. (2012). Understanding Unconventional Oil. Energy and Climate, 8. Retrieved from
http://carnegieendowment.org/files/unconventional_oil.pdf
Head, I. M., Jones, D. M., & Larter, S. R. (2003). Biological Activity in the Deep Subsurface and the Origin
of Heavy Oil. 344, 426. Retrieved from http://www.permedia.ca/pdf/nature_biodegradation.pdf
Hubert, M. K. (1956, 3). The Origing of Oil and Gas. Retrieved from Nuclear Energy and the Fossils Fuels:
http://www.fossil.energy.gov/programs/reserves/npr/publications/The_Origin_of_Oil_and_Gas
1.pdf
Huc, A.-Y. (2011). Heavy Crude Oils From Geology to Upgrading An Overview. Paris: Editions TECHNIP.
Jahn, F., Cook, M., & Graham, M. (2003). Hydrocarbon Exploration and Production (Vol. 46). Aberdeen,
United Kingdom: ELSVIER SCIENCE B.V.
Kokal, S., & Aramco, S. (2002). Crude Oil Emulsions: A State-Of-The-Art Review. SPE Annual Technical
Conference and Exhibition, 29 September-2 October 2002 (p. 1). San Antonio, Texas: Society of
Petroleum Engineers. doi:10.2118/77497-MS
KRUSS. (2003, 11). Site100 Spinning Drop Tensiometer (The KRUSS Interface Tester). Retrieved from
KRUSS Technical Information: http://meteo-tech.co.il/e-Catalog/pdf/site100.pdf
Luo, M. P. (n.d). Chemical EOR Evaluation. Retrieved from Saskatchewan Research Council:
http://www.src.sk.ca/resource%20files/chemical%20eor%20evaluation%20fact%20sheet.pdf
McGuire, P. L., Chatham, J. R., Paskvan, F. K., Sommer, D. M., Carini, F. H., & BP Exploration (Alaska) Inc.
(2005). Low Salinity Oil Recover: An Exciting New EOR Opportunity for Alaska's North Slope. SPE
Western Regional Meeting (p. 1). Irvine, CA, USA: Society of Petroleum Engineers Inc. Retrieved
from http://www.onepetro.org/mslib/app/Preview.do?paperNumber=SPE-93903-
MS&societyCode=SPE
Meyer, R. F., & Witt, W. d. (1990). Definition and World Resources of Natural Bitumens. USA: US
Geological Survey. Retrieved from
http://www.oildrop.org/Info/Centre/Lib/Papers/MeyerWitt3.pdf
Meyers, R. A. (2001). Enhanced Oil Recovery. In R. A. Meyers, Encyclopedia of Physical Science and
Technology (p. 513). Academic Press.
Page 48
39
Monopoli, A., Calo, V., Ciminale, F., Cotugno, P., Angelici, C., Cioffi, N., & Nacci, A. (2010). Glucose as a
Clean and Renewable Reductant in the Pd-Nanoparticle-Catalyzed Reductive Homocoupling of
Bromo- and Chloroarenes in Water. Bari, Italy: American Chemica Society.
doi:10.1021/jo1005729
Moroi, Y. (1992). Micelles "Theoretical and Applied Aspects". New York: Plenum Press. Retrieved from
http://books.google.ca/books?id=cVenuNI-
29AC&pg=PA47&dq=what+is+critical+micelle+concentration&hl=en&sa=X&ei=EtLpUaTJFJH64AP
UxoDwDw&ved=0CDkQ6AEwAQ#v=onepage&q=what%20is%20critical%20micelle%20concentra
tion&f=false
Morrison, R. T., & Boyd, R. N. (1978). Organic Chemistry. Boston, United States of America: Allyn and
Bacon, Inc.
Neal, C., & Stanger, G. (1984). Calcium and magnesium hydroxide precipitation from alkaline
groundwaters in Oman, and their significance to the process of serpentinization.
MINERALOGICAL MAGAZINE, 48, 237-241. Retrieved from
http://rruff.info/doclib/MinMag/Volume_48/48-347-237.pdf
PDHengineer. (2013, 5 3). Centrifugal Pump Analysis for Petroleum Applications. Retrieved from
PDHengineer.com: http://www.petroleum.co.uk/api
PEERI. (2011). Surfactant Flooding IOR. Retrieved from Power Environmental Energy Research Institute.:
http://www.peeri.org/industrial/surfactant.htm
PerkinElmer. (n.d). FT-IR Spectroscopy: Technical Note. Shelton, USA: PerkinElmer Life and Analytical
Sciences.
Pojman, J. A., Chekanov, Y., Masere, J., Volpert, V., Dumont, T., & Wilke, H. (2001). EFFECTIVE
INTERFACIAL TENSION INDUCED CONVECTION (EITIC) IN MISCIBLE FLUIDS. Mississippi: American
Institute of Aeronautics and Astronautics.
Ramirez, W. F. (1987). Application of Optimal Control Theory to Enhanced Oil Recovery (Vol. 21). New
York, United States of America: Elsevier Science Publishers B.V. Retrieved from
http://books.google.ca/books?id=gcUcEokUXlAC&pg=PA192&dq=swelling+agent+for+oil+recov
ery&hl=en&sa=X&ei=fAKVUZKPBoSY8gSYg4GQBQ&ved=0CEcQ6AEwAw#v=onepage&q=swelling
%2520agent%2520for%2520oil%2520recovery&f=false
Reed, M., & Johnsen, S. (1996). Produced Water 2 (Environmental Issues and Mitigation Technologies)
(Vol. 52). New York, United States of America: Plenum Press.
RezaeiDoust, A., Puntervold, T., & Austad, T. (2010). A Discussion of the Low Salinity EOR Potential for a
North Sea Sandstone Field. SPE Annual Technical Conference and Exhibition (p. 1). Florence,
Italy: Society of Petroleum Engineers. Retrieved from
Page 49
40
http://www.onepetro.org/mslib/app/Preview.do?paperNumber=SPE-134459-
MS&societyCode=SPE
Romero-Zerón, L. (2012). Introduction to Enhanced Oil Recovery (EOR) Processes and Bioremediation of
Oil-Contaminated Sites. InTech. doi:DOI: 10.5772/2053
Rosen, M. J., & Kunjappu, J. T. (2012). Surfactants and Interfacial Phenomena (Fouth ed.). New Jersey: John Wiley & Sons Inc. Retrieved from http://books.google.ca/books?id=1rCdNIzB78AC&printsec=frontcover&dq=what+are+surfactants&hl=en&sa=X&ei=X_QHUq2ADobhyQHP5IDoDw&ved=0CDcQ6AEwAA#v=onepage&q=what%20are%20surfactants&f=false
Saithala, J. R., Mahajanam, S., Ubhi, H. S., & Atkinson, J. D. (2012). Effect of Sigma Phase on the
Environmental Assisted Cracking of Super Duplex Stainless Steel in Oil Field Environments.
Corrosion Conference and Expo 2012 (p. 4). Houston, Texas: Nace International. Retrieved from
http://www.oxford-instruments.com/getmedia/810228a7-5a0d-49be-86fd-
bd2b5d9c1a83/Effect-of-Sigma-Phase-on-the-Environmental-Assisted-Cracking-of-Super-
Duplex-Stainless-Steel-in-Oil-field-Environments
Sawatzky, R. (2004). In Situ Recovery Methods for Heavy Oil and Bitumen. Alberta.
Schlumberger. (2013). Alkaline Flooding. Retrieved from
http://www.glossary.oilfield.slb.com/en/Terms/a/alkaline_flooding.aspx
Schramm, L. L. (2005). Emulsions, Foams, and Suspensions. Saskatoon, Canada: WILEY-VCH Verlag GmbH
& Co. Retrieved from
http://books.google.ca/books?id=9JMrTZxPd2MC&pg=PA61&lpg=PA61&dq=young+laplace+equ
ation+on+spinning+drop&source=bl&ots=-cKdFgQkZR&sig=_HlBUbLMXwEUvDho-
GzhUt0Ness&hl=en&sa=X&ei=xUzdUfqkJbao4AP-
9YGoCw&ved=0CFMQ6AEwCDgK#v=onepage&q=young%20laplace%20equation
Sigma-Aldrich. (2013). Retrieved from http://www.sigmaaldrich.com/MSDS/MSDS/DisplayMSDSPage.do?country=CA&language=en&productNumber=178780&brand=SIAL&PageToGoToURL=http%3A%2F%2Fwww.sigmaaldrich.com%2Fcatalog%2Fproduct%2Fsial%2F178780%3Flang%3Den
Slider, H. C. (1983). Worldwide Practical Petroleum Engineering Methods. Tulsa, Oklahoma: PennWell
Publishing Company. Retrieved from http://books.google.ca/books?id=87Q1m8lVA-
cC&pg=PA648&dq=wettability+change&hl=en&sa=X&ei=sILhUaqYL-
fYywHIpIGYBA&ved=0CC0Q6AEwADgK#v=onepage&q=wettability%20change&f=false
Speel, H. C., & Poats, F. J. (1964). Economic Potential of Soaps, Detergents, and Surfactatnts. Washington
D.C: U.S Department of Agriculture. Retrieved from
http://naldc.nal.usda.gov/download/CAT87201929/PDF
Page 50
41
Starks, C. M., Liotta, C. L., & Halpern, M. (1994). PHASE TRANSFER CATALYST "Fundamentals,
Applications, and Industrial Perspectives. New York, United States of America: Chapman and
Hall. Retrieved from http://books.google.ca/books?id=-
QCGckdeKAkC&pg=PA125&dq=tetrabutylammonium+salt+phase+transfer+catalyst&hl=en&sa=
X&ei=uOKQUef7BtKzqAHj4oHwCg&ved=0CC4Q6AEwAA#v=onepage&q=tetrabutylammonium%
20salt%20phase%20transfer%20catalyst&f=false
Stuart, B. H. (2004). Infrared Spectroscopy: Fundamentals and Applications. John Wiley & Sons, Ltd.
Sykes, J. B. (1982). The Oxford Dictionary of Current English. Oxford University Press.
Thenganpallil, J. (1991, 08 22). Patent No. C10G 01/06. United States of America.
Thermo Nicolet Corporation. (2001). Introduction to Fourier Transform Infrared Spectrometry. Retrieved
from Thermo Nicolet: http://mmrc.caltech.edu/FTIR/FTIRintro.pdf
United Hydrocarbon. (2013). Retrieved from Geology of Chad:
http://unitedhydrocarbon.com/cms/?page_id=887
USGS. (2007). Biodegradation. US Geological Survey. Retrieved from USGS:
http://toxics.usgs.gov/definitions/biodegradation.html
Viades-Trejo, J., & Gracia-Fadrique, J. (2007). Spinning drop method: From Young–Laplace to Vonnegut.
Colloids and Surfaces A: Physicochemical and Engineering Aspects, 302(1-3), 549-552. Retrieved
from http://www.sciencedirect.com/science/article/pii/S0927775707002567
Wen-Zhang Liu. (1994). The Status and Development Prospects for Thermal Recovery in China.
Stavanger: World Petroleum Congress. Retrieved from
http://www.onepetro.org/mslib/servlet/onepetropreview?id=WPC-26178
Williamson, V., & Peck, L. (2009). Experiment in General Chemistry (Inquiry ans Skill Building). Belmont,
CA, USA: Brook/Cole Cengage Learning Inc. Retrieved from
http://books.google.ca/books?id=D8yLoQwwMBUC&pg=PA15&dq=pycnometer+density+measu
rement&hl=en&sa=X&ei=jSWvUfXaMur7ygGW04CwDA&ved=0CF4Q6AEwBw#v=onepage&q=py
cnometer%20density%20measurement&f=false
Zana, R., Schmidt, J., & Talmon, Y. (2005). Tetrabutylammonium Alkyl Carboxylate Surfactants in
Aqueous Solution: Self-Association Behaviour, Solution Nanostructure, and Comparison with
Tetrabutylammonium Alkyl Sulfate Surfactants. Haifa, Israel: American Chemical Society.
Retrieved from http://www.technion.ac.il/~ceritit/papers/Langmuir_21.pdf
Page 51
42
APPENDICES
Appendix A
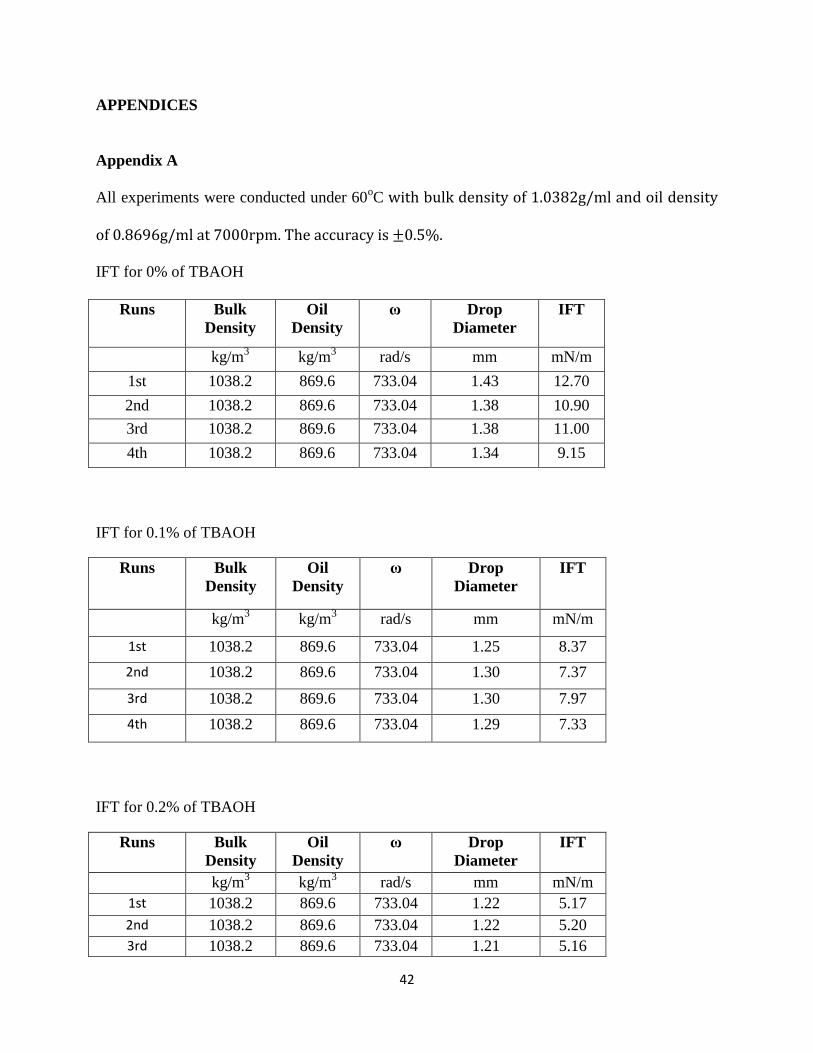
All experiments were conducted under 60oC with bulk density of 1.0382g/ml and oil density
of 0.8696g/ml at 7000rpm. The accuracy is ±0.5%.
IFT for 0% of TBAOH
Runs Bulk
Density
Oil
Density
ω Drop
Diameter
IFT
kg/m3 kg/m
3 rad/s mm mN/m
1st 1038.2 869.6 733.04 1.43 12.70
2nd 1038.2 869.6 733.04 1.38 10.90
3rd 1038.2 869.6 733.04 1.38 11.00
4th 1038.2 869.6 733.04 1.34 9.15
IFT for 0.1% of TBAOH
Runs Bulk
Density
Oil
Density
ω Drop
Diameter
IFT
kg/m3 kg/m
3 rad/s mm mN/m
1st 1038.2 869.6 733.04 1.25 8.37
2nd 1038.2 869.6 733.04 1.30 7.37
3rd 1038.2 869.6 733.04 1.30 7.97
4th 1038.2 869.6 733.04 1.29 7.33
IFT for 0.2% of TBAOH
Runs Bulk
Density
Oil
Density
ω Drop
Diameter
IFT
kg/m3 kg/m
3 rad/s mm mN/m
1st 1038.2 869.6 733.04 1.22 5.17
2nd 1038.2 869.6 733.04 1.22 5.20
3rd 1038.2 869.6 733.04 1.21 5.16
Page 52
43
4th 1038.2 869.6 733.04 1.22 5.18
IFT for 0.3% of TBAOH
Runs Bulk
Density
Oil
Density
ω Drop
Diameter
IFT
kg/m3 kg/m
3 rad/s mm mN/m
1st 1038.2 869.6 733.04 1.13 2.56
2nd 1038.2 869.6 733.04 1.12 3.51
3rd 1038.2 869.6 733.04 1.12 3.50
4th 1038.2 869.6 733.04 1.12 3.51
IFT for 0.4% of TBAOH
Runs Bulk
Density
Oil
Density
ω Drop
Diameter
IFT
kg/m3 kg/m
3 rad/s mm mN/m
1st 1038.2 869.6 733.04 0.94 2.99
2nd 1038.2 869.6 733.04 0.96 3.10
3rd 1038.2 869.6 733.04 0.97 3.22
4th 1038.2 869.6 733.04 0.94 2.98
IFT for 0.6% of TBAOH
Runs Bulk
Density
Oil
Density
ω Drop
Diameter
IFT
kg/m3 kg/m
3 rad/s mm mN/m
1st 1038.2 869.6 733.04 1.07 3.40
2nd 1038.2 869.6 733.04 1.08 3.43
3rd 1038.2 869.6 733.04 1.07 3.39
4th 1038.2 869.6 733.04 1.09 3.43
Page 53
44
IFT for 1% of TBAOH
Runs Bulk
Density
Oil
Density
ω Drop
Diameter
IFT
kg/m3 kg/m
3 rad/s mm mN/m
1st 1038.2 869.6 733.04 1.23 5.74
2nd 1038.2 869.6 733.04 1.21 4.96
3rd 1038.2 869.6 733.04 1.21 4.98
4th 1038.2 869.6 733.04 1.22 5.10
IFT for 2% of TBAOH
Runs Bulk
Density
Oil
Density
ω Drop
Diameter
IFT
kg/m3 kg/m
3 rad/s mm mN/m
1st 1038.2 869.6 733.04 1.23 5.37
2nd 1038.2 869.6 733.04 1.23 5.37
3rd 1038.2 869.6 733.04 1.23 5.38
4th 1038.2 869.6 733.04 1.24 5.37
Page 54
45
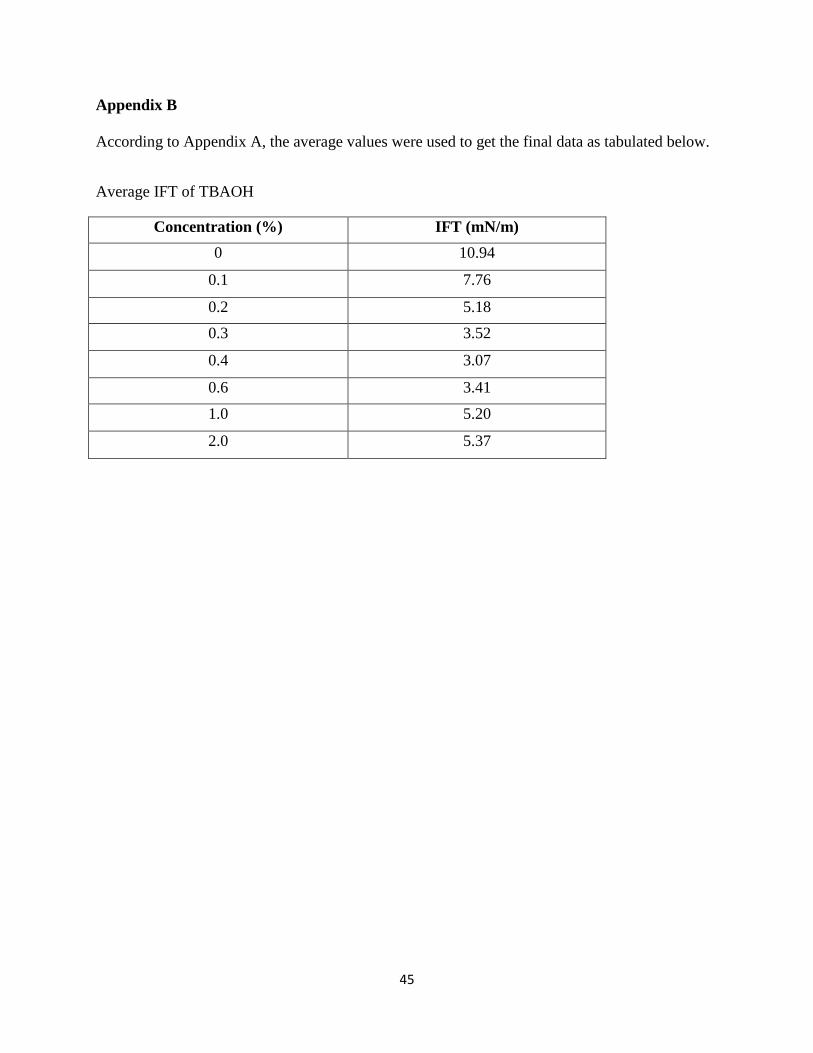
Appendix B
According to Appendix A, the average values were used to get the final data as tabulated below.
Average IFT of TBAOH
Concentration (%) IFT (mN/m)
0 10.94
0.1 7.76
0.2 5.18
0.3 3.52
0.4 3.07
0.6 3.41
1.0 5.20
2.0 5.37