Fluid Mechanics and Transport Phenomena Influence of Transport and Reaction on Wormhole Formation in Porous Media Christopher N. Fredd and H. Scott Fogler Dept. of Chemical Engineering, University of Michigan, Ann Arbor, MI 48109 The transport and reaction of fluids in porous media results in unique pore growth and channel euolution as the media are dissolued. This often leads to the formation of highly Conductive flow channels, commonly referred to as wormholes. The objective of this work is to predict the influence of transport and reaction on the structure of the wormhole channels. An experimental and theoretical inuestigation of a uariety of fluid systems, including strong acids, weak acids, and chelating agents, provides a wide range of conditions for studying wormhole formation. A generalized description of the dissolu- tion phenomenon is introduced, and a common dependence on the Damkohler number is demonstrated. The Damkohler number is shown to dictate the type of wormhole structure formed by systems with uarious degrees of transport and reaction limitations. An optimum Damkohler number for channel formation is obsemed at a value of ap- proximately 0.29 for all of the fluid systems inuestigated. The stochastic nature of the dissolution phenomenon is described using network models. Results from a 2-0 net- work model and a 3-0 physically representatiue network model agree qualitatiuely with experimental results and substantiate the existence of an optimum Damkohler number. Introduction The transport and reaction of fluids in porous media pre- sents a complex problem that influences many processes such as weathering, diagenesis, and the stimulation of petroleum rcservoirs. These processes involve unique pore growth and channel evolution as the media are dissolved by a reactant in the fluid. Understanding this channel evolution is of funda- mental importance to predicting the dissolution phe- nomenon. However, the phenomenon is complicated by the interplay between transport and reaction at the pore scale and by the stochastic nature in which the flow channels de- velop. Channel evolution is most prevalent during the acidization of carbonate reservoirs, which is the focus of this study. Acidization is a stimulation technique commonly used to in- crease the production of petroleum reservoirs. The technique involves the injection of acid into the formation in order to dissolve the matrix rock and/or materials that plug the pore space. Hydrochloric acid is typically used in carbonate forma- tions. because it reacts rapidly with carbonate minerals. The rapid rates of dissolution and heterogeneous flow profiles lead to the formation of highly conductive flow channels, com- ( <irrcyxm&nci. concerning this article should bc addressed to H. Scott Fogler AIChE Journal September 1998 monly referred to as wormholes. Wormhole formation is the dominant mechanism by which the fluid conductivity is in- creased during matrix stimulation treatments (that is, when hydraulic fracturing of the formation is not involved). It is an effective means of stimulating the formation, thereby allow- ing oil or gas to flow more readily. The importance of wormhole formation on the effective- ness of matrix stimulation treatments has led many investiga- tors to study the dissolution phenomenon (Schechter and Gidley, 1969; Nierode and Williams, 1971: Hoefner and Fogler, 1988; Daccord et al., 1989; Wang et al., 1993; Frick et al., 1994; Mostofizadeh and Economides, 1994; Huang et al., 1997). These studies have focused on either mass-transfer or reaction rate limited systems. No fundamental study has fo- cused on the combined effects of transport and reaction on wormhole formation. More recently, alternative fluid systems such as chelating agents and weak acids have been shown to be effective stimulation fluids (Fredd and Fogler, 1998a). These alternative fluid systems are influenced by both trans- port and reaction processes (Fredd and Fogler, 1998b,c), and, therefore, cannot be described by theories developed in pre- vious studies. Because the rates of mass transfer and the ki- netics of the surface reactions are significantly different from those of conventional acid systems, these alternative fluids Vol. 44, No. 9 1933
Transcript
Fluid Mechanics and Transport Phenomena
Influence of Transport and Reaction on Wormhole Formation in Porous Media
Christopher N. Fredd and H. Scott Fogler Dept. of Chemical Engineering, University of Michigan, Ann Arbor, MI 48109
The transport and reaction of fluids in porous media results in unique pore growth and channel euolution as the media are dissolued. This often leads to the formation of highly Conductive flow channels, commonly referred to as wormholes. The objective of this work is to predict the influence of transport and reaction on the structure of the wormhole channels. An experimental and theoretical inuestigation of a uariety of fluid systems, including strong acids, weak acids, and chelating agents, provides a wide range of conditions for studying wormhole formation. A generalized description of the dissolu- tion phenomenon is introduced, and a common dependence on the Damkohler number is demonstrated. The Damkohler number is shown to dictate the type of wormhole structure formed by systems with uarious degrees of transport and reaction limitations. An optimum Damkohler number for channel formation is obsemed at a value of ap- proximately 0.29 for all of the fluid systems inuestigated. The stochastic nature of the dissolution phenomenon is described using network models. Results from a 2-0 net- work model and a 3-0 physically representatiue network model agree qualitatiuely with experimental results and substantiate the existence of an optimum Damkohler number.
Introduction
The transport and reaction of fluids in porous media pre- sents a complex problem that influences many processes such as weathering, diagenesis, and the stimulation of petroleum rcservoirs. These processes involve unique pore growth and channel evolution as the media are dissolved by a reactant in the fluid. Understanding this channel evolution is of funda- mental importance to predicting the dissolution phe- nomenon. However, the phenomenon is complicated by the interplay between transport and reaction at the pore scale and by the stochastic nature in which the flow channels de- velop.
Channel evolution is most prevalent during the acidization of carbonate reservoirs, which is the focus of this study. Acidization is a stimulation technique commonly used to in- crease the production of petroleum reservoirs. The technique involves the injection of acid into the formation in order to dissolve the matrix rock and/or materials that plug the pore space. Hydrochloric acid is typically used in carbonate forma- tions. because it reacts rapidly with carbonate minerals. The rapid rates of dissolution and heterogeneous flow profiles lead to the formation of highly conductive flow channels, com-
( <irrcyxm&nci. concerning this article should bc addressed to H. Scott Fogler
AIChE Journal September 1998
monly referred to as wormholes. Wormhole formation is the dominant mechanism by which the fluid conductivity is in- creased during matrix stimulation treatments (that is, when hydraulic fracturing of the formation is not involved). It is an effective means of stimulating the formation, thereby allow- ing oil or gas to flow more readily.
The importance of wormhole formation on the effective- ness of matrix stimulation treatments has led many investiga- tors to study the dissolution phenomenon (Schechter and Gidley, 1969; Nierode and Williams, 1971: Hoefner and Fogler, 1988; Daccord et al., 1989; Wang et al., 1993; Frick et al., 1994; Mostofizadeh and Economides, 1994; Huang et al., 1997). These studies have focused on either mass-transfer or reaction rate limited systems. No fundamental study has fo- cused on the combined effects of transport and reaction on wormhole formation. More recently, alternative fluid systems such as chelating agents and weak acids have been shown to be effective stimulation fluids (Fredd and Fogler, 1998a). These alternative fluid systems are influenced by both trans- port and reaction processes (Fredd and Fogler, 1998b,c), and, therefore, cannot be described by theories developed in pre- vious studies. Because the rates of mass transfer and the ki- netics of the surface reactions are significantly different from those of conventional acid systems, these alternative fluids
Vol. 44, No. 9 1933
provide unique conditions for studying the phenomenon of wormhole formation.
This article extends the study of alternative stimulation flu- ids. The focus is on the dependence of wormhole formation on the fundamental transport and reaction mechanisms of a variety of fluid systems, including strong acids, weak acids, and chelating agents. Results are described in terms of a gen- eralized description of the dissolution phenomenon that in- cludcs the effects of convection, reactants transport, re- versible surface reactions, and products transport. A common dependence of wormhole formation on the Damkohler num- ber for flow and reaction is demonstrated for a wide range of fluid/mineral systems. The stochastic nature of the dissolu- tion phenomenon is simulated through the use of random network models.
Transport and Reaction in Carbonates Wormhole formation
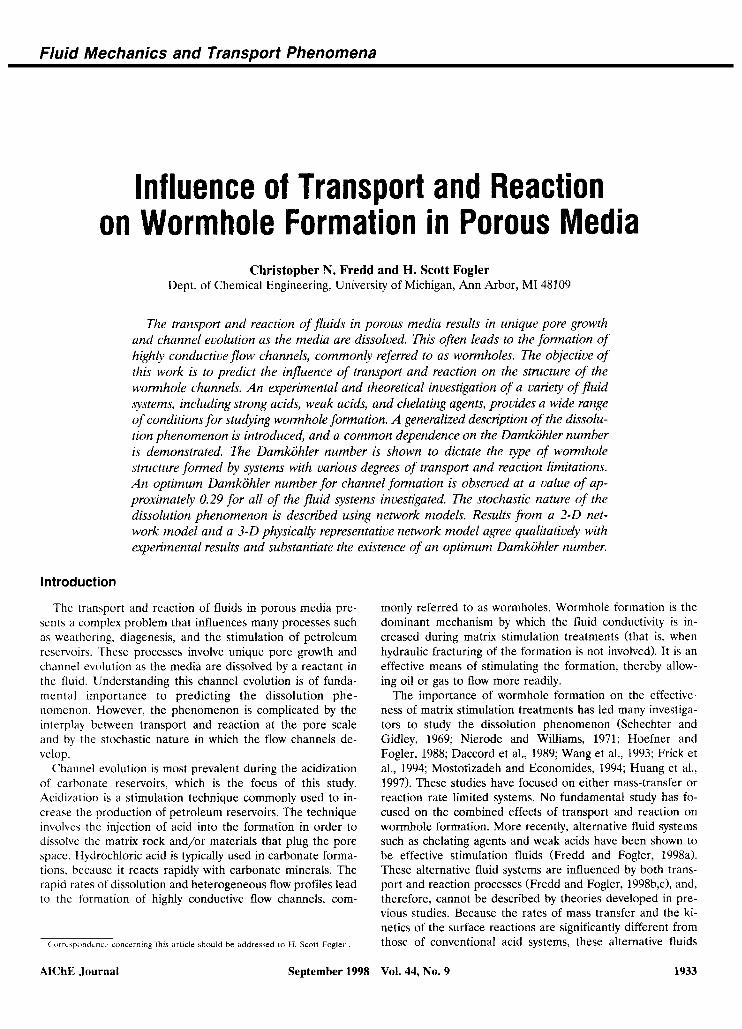
The transport and reaction of reactive fluids in carbonate porous media results in the formation of highly conductive flow channels, or wormholes (Figure 1). Wormholes form be- cause of the natural heterogeneity of the porous medium and the rapid and almost complete dissolution of the mineral in the reactant fluid. During stimulation, the fluid preferentially flows to the regions of highest permeability (the largest pores, voids, or natural fractures). These initial flow paths are en- larged by rapid dissolution of the matrix material, causing these regions to receive even more of the flow. A dominant channel quickly forms and continues to propagate while di- verting flow from other regions. Once formed, the wormhole channels provide negligible resistance to flow and carry es- sentially all the injected fluid.
The structure of the wormhole channel is highly dependent upon the injection rate and the fluid/mineral properties. The typical dependence on flow rate is demonstrated in Figure 1.
At extremely low injection rates, the reactant is consumed on the inlet flow face of the core, resulting in face dissolution (or complete dissolution of the core starting from the inlet flow face). Thc corresponding permeability increase is negli- gible, because a majority of the medium is unaffected by the dissolution. Thus, face dissolution is undesirable for matrix stimulation. At slightly higher injection rates, the reactant can penetrate into the porous matrix and enlarge flow channels. A significant amount of reactant is consumed on the walls of the flow channels. This consumption results in the formation of a conical-shaped dissolution channel (far left structure) and requires the injection of several pore volumes of fluid for the channel to break through, or percolate, the porous medium. (The number of pore volumes to break through, PV,,.. is de- fined as the ratio of the volume of fluid injected to achieve channel breakthrough to the volume of the pore space in the core.) At intermediate injection rates, unconsumed reactant reaches the tip of the evolving flow channels. Subsequent consumption at the tip propagates the dissolution channels and eventually leads to the formation of a dominant worm- hole channel. The wormhole provides significant pcrmeabil- ity increases and requires a minimum pore volume of fluid to break through the rock matrix. At high injection rates, the flow channels become more highly branched or ramified (far right structure), as fluid is forced into smaller pores. Dissolu- tion occurs over a high surface area, which results in an in- crease in the number of pore volumes required to break through. The single dominant wormhole channel represents the most effective mode of stimulation, because it minimizes the volume of fluid required to obtain a given depth of worm- hole penetration.
Several investigators have studied the phenomenon of wormhole formation in a variety of fluid/mineral systems and have reported the existence of an optimum injection rate. (The optimum injection rate represents the conditions at which a minimum volume of fluid is required for the worm-
Figure 1. Neutron radiographs of wormholes formed during the dissolution of limestone by 0.25-M EDTA injected at pH 4.
1934 September 1998 Vol. 44, No. 9 AIChE Journal
hole channel to break through a porous medium.) Daccord et al. (1989) investigated the water/plaster of Paris system and reported the optimum injection rate to occur at a Peclet number just above unity. The Peclet number is defined as the ratio of transport by convection to transport by diffusion. A similar dependence on the Peclet number was observed by Mostofizadch and Economides (1994) for the HCl/limestone system. Frick et al. (1994) also studied the HCl/limestone system and combined the concepts of fractal geometry with the dependence on the Peclet number. Bazin et al. (1995) reported the optimum injection rate for the HCl/limestone system to occur at the transition between convection and mass-transfer limited regimes. In contrast, Wang et al. (1993) and Huang et al. (1997) investigated HCl/carbonate systems and proposcd that the optimum injection rate occurred at a transition between reaction rate and fluid-loss limited regimes. Despite mass transfer having a major influence on wormhole formation, diffusion plays only a minor role in their theory.
Hoefner and Fogler (1988) investigated HCl/carbonate sys- tems and found that the phenomenon of wormhole formation is governed by the Damkohler number for flow and reaction. The Damkiihler number Da is defined as the ratio of the net rate of dissolution by acid to the rate of convective transport of acid. When the net rate of dissolution is mass-transfer lim- ited. the Damkohler number is given by
Dam, = aD,'/"l/Q (1)
where l? i \ the effective diffusion coefficient, Q is the flow rate. 1 15 the pore length, and a is a constant that depends on the carbonate core. The dissolution of limestone by HCI is mass-transfer limited at temperatures above about 0°C (Lund et al., 1975) On the other hand, when the net rate of dissolu- tion 15 reaction rate limited, the Damkohler number is given by
Darxn = ak,dl/Q ( 2 )
where k , is the surface reaction rate constant and d is the pore diameter. (Note that the units of a vary from Eq. 1 to 2 such that the Damkohler number is dimensionless.) The dis- solution of dolomite by HC1 is reaction rate limited below about 5O'C (Lund et al., 1973). Hoefner and Fogler (1988) observed that a minimum volume of fluid was required for channel breakthrough (that is, optimum conditions for worm- hole formation) when the Damkohler number was varied over several orders of magnitude. This observation is consistent with the existence of an optimum injection rate for constant fluid/mincral properties, because the Damkohler number is inversely proportional to the injection rate.
A similar dependence on the Damkohler number was demonstrated for the flow and reaction of chelating agents and weak acids in carbonate porous media (Fredd and Fogler, 1998a). Ethylenediaminetetraacetic acid (EDTA) was shown to effectively form wormholes in limestone, even when in- jected at moderate or nonacidic pH values (4 to 13) and at low flow rates where HCl is ineffective due to face dissolu- tion. Wormhole structures that formed over a wide range of Damkohler numbers during the injection of 0.25-M EDTA at pH 4 are shown in Figure 1. Similar structures were observed
AIChE Journal September 1998
when EDTA was injected at pH 13. The structures reveal the typical trend of increasing channel branching with decreasing Damkohler numbers.
Calcite dissolution The dissolution of calcite (calcium carbonate) involves a
heterogeneous reaction that may be influenced by the rate of transport of reactants to the surface, the kinetics of the sur- face reaction, and the rate of transport of products away from the surface. The rate-limiting step depends on the pH of the medium and is influenced by the presence of weak acids, cal- cium chelating agents, and various ionic species.
At low pH (values less than about 4 at ambient tempera- tures), the rate of dissolution has been shohn to be mass- transfer limited in a variety of acidic media ranging from HCI to pseudo-sea water (Nierode and Williams, 1971; Berner and Morse, 1974; Lund et al., 1975; Plummer et al., 1978; Sjoberg and Rickard, 1984). In strong acids such as HCI. calcite is readily dissolved
2H+ + CaCO, + Ca+' + CO, + H,O (3)
The reaction may be considered irreversible, and, therefore, the dissolution is limited by the transport of hydrogen ions to the calcite surface. In weak acids, the dissolution is compli- cated by reversible surface reactions and the additional influ- ence of products transport away from the surface. The disso- lution of calcite by acetic acid was found to be influenced by the rate of transport of reactants to the surface and the rate of transport of products away from the surface (Fredd and Fogler, 1998~). The interplay between the two transport processes caused transport limitations much more significant than either limitation independently. The kinetics of the sur- face reaction was shown to be a significant limitation at pH values greater than about 3.7.
In the presence of calcium chelating agents, the rate of dissolution is influenced predominantly by the rate of trans- port of reactants to the surface and the kinetics of the sur- face reactions (Fredd and Fogler, 1998b). Although the chelation reactions are essentially irreversible, there is a slight influence of the rate of transport of products away from the surface. This influence of products transport is due to the adsorption of products on the surface and subsequent block- ing of surface sites involved in the reaction. The rate of disso- lution varies considerably with pH and type of chelating agent due to changes in the ionic form of the chelating agent (refer to the following section) and to the influence of hydrogen ion attack.
Calcite dissolution and chelating agents Chelating agents are negatively charged organic molecules
that have the ability to combine with metal ions through co- ordination bonds. The process of chelation results in the for- mation of stable ringed structures that surround the metal ions and occupy all of their coordination sites, thus prevent- ing their interaction with other ions in solution. Aminopoly- carboylic acids are one of a few classes of chelating agents that are capable of forming stable chelates with alkaline-earth metals such as calcium (Martell and Calvin, 1956). The equi-
Vol. 44, No. 9 1935
Table 1. Chemical Structures and Equilibrium Constants for Metal/Ligand Chelates of CDTA, DTPA, and EDTA at 25°C
Chelating Agent K M Y
cn,co,n Ca 12.3 11.34 9.84
no,ccn, Mg n Sr CDTA
DTPA cn,co,n I cn,co,n no,ccn,
no2ccn, cn,co,n > NCH,CH,NCH,CH,N < Ca Mg Sr Ba
10.34 8.92 9.14 8.87
EDTA cn,co,n CH,CO,H
> NCH,CH,N < no,ccn, no,ccn,
Ca
Sr Ba
Mg 10.59 8.69 8.63 7.76
*Courtesy of Martell and Calvin (1956) and Grimes (1976).
librium constants for various metal/ligand chelates of 1,2- cyclohexanediaminetetraacetic acid (CDTA), diethylenetri- aminepentaacetic acid (DTPA), and ethylenediaminete- traacetic acid (EDTA) are listed in Table 1, along with the chemical structures of the respective chelating agents. These chelating agents form stable chelates (Log K , w y values greater than about 8) with calcium.
The stability of the calcium chelate influences the ability of the chelating agent to dissolve calcite. Strong calcium chelat- ing agents such as CDTA, DTPA, and EDTA exhibit a rela- tively high rate of dissolution in the pH range of 8.4 to 12 (Fredd and Fogler, 1998b). In contrast, weak calcium com- plexing agents, such as acetate, have no significant effect on the rate of dissolution over the same pH range (Fredd and Fogler, 1998~). In addition, nitrilotriacetic acid (NTA), which forms a relatively weak chelate with calcium [Log K,wy of 8.18 (Martell and Calvin, 19.5611, was found to be ineffective for calcium carbonate stimulation (Fredd, 1998).
The influence of chelating agents on the rate of calcite dis- solution is highly dependent upon the pH of the solution and the type of chelating agent. For aminopolycarboxylic acids, these variations are due primarily to changes in the ionic species involved in the surface reaction (Fredd and Fogler, 1998b). The form of the ionic species is dictated by a series of dissociation reactions, which for a chelating agent with four carboxylic acid groups are
where H,,Y"- represents the chelating agent molecule and the m hydrogens are those of the carboxylic acid groups. The distribution of ionic species depends on the equilibrium con- stants for each of the dissociation reactions and on the solu- tion pH. The distributions of ionic species for DTPA and EDTA (Figure 2) were calculated at 25°C using the p K val- ues obtained from the literature (Martell and Calvin, 1956; Grimes, 1976). As the pH is increased from about 4.5 to 8.5 to 13, EDTA successively deprotonates from H,Y - 2 to HY to Y -4. Thus, the corresponding overall surface reactions with
calcite are
H ,Y- '+CaC0 ,+CaY-2+H,0+C0 , (8)
HY ' + CaCO, + CaY ' + HCO,
Y-'+CaCO,+CaY-'+CO;' (10)
(9)
Analogous surface reactions can be written for CDTA and
0 2 4 6 8 1 0 1 2 1 4
PH
0 2 4 6 8 1 0 1 2 1 4
PH
(b) Figure 2. Distribution of ionic species of (a) DTPA and
(b) EDTA at 25°C.
1936 September 1998 Vol. 44, No. 9 AIChE Journal
FDS-210 Pump F - 7
Back
Water inlet
Inlet pressure aauae I
Figure 3. Linear coreflood apparatus.
DTPA. However, the distribution of ionic species is more complicated <it low p H for DTPA, where the predominant species is H,Y ’ near p H 4. The distribution of ionic species for CDTA is similar to that of EDTA. In general, the rate of calcite dissolution increases as the number of hydrogen ions associated with the chelating agent increases (Fredd and Fogler, 1998b).
Experimental Methods Linear coreflood experiments
Linear coreflood experiments were performed using the apparatus shown in Figure 3. Limestone cores of approxi- mately 3.8 cm in diameter and 10.2 cm in length were used in this study. The cores had porosities between 15% and 20% and permeabilities in the range of 0.8 to 2 md. The cores were vacuum-saturated with deionized water prior to being mounted in a standard Hassler. An overburden pressure of at least 15.2 MPa (2,200 psi) was applied to ensure that flow did not bypass the core. Fluid was injected axially through the core at a constant rate using a FDS-210 pump. Deionized water was first injected through the core at the desired flow rate. When the flow stabilized, reactant injection was started. To avoid contacting the pump with the reactant, the fluid was displaced by water from a piston accumulator. The pressure drop A P across the length of the core L was monitored by a differential pressure transducer and recorded by a personal computer. Thcsc: data were used to calculate the permeabil- ity k as a function of fluid volume injected using Darcy’s law
Q P L k = - A PA
(11)
wherc A is the cross-sectional area and p is the fluid viscos- ity. Gaseous reaction products, specifically CO,, were kept in solution by maintaining a system pressure of at least 6.9 MPa (1,000 psi) with a back pressure regulator. The experiment was terminated when the wormhole broke through the core, as evidenced by a negligible pressure drop.
Experiments were conducted at ambient laboratory tem- perature (22°C 2) with 0.25-M CDTA, DTPA, and EDTA, as well as with 0.5-M HAc and HCI. Note that all of these solutions have the same effective acid capacity, or dissolving power. EDTA solutions were prepared from the reagent
grade disodium salt dihydrate of ethylenediaminetetraacetic acid. Addition of EDTA to deionized water resulted in a pH of about 4.6. Sodium hydroxide or hydrochloric acid was used to adjust the p H to the desired value. Solutions of CDTA and DTPA were made in a similar manner.
Neutron radiography Neutron radiography and the Wood’s metal casting tech-
nique (Hoefner and Fogler, 1988) were used to image the wormhole structures formed during linear coreflood experi- ments. The Wood’s metal casting technique utilized a vac- uum oven to dry and evacuate the acidized core5 and then to inject molten Wood’s metal at 100°C. The injection pressure was controlled to ensure that the metal invaded only the pore spaces that were enlarged by dissolution. Once invaded, the metal was allowed to solidify, thereby forming a casting of the wormhole channels. The Wood’s metal-filled cores were placed in a beam of thermal neutrons, and the film radiogra- phy method was used to record the neutron flux onto a pho- tographic film as shown in Figure 4. Wood’s metal contains cadmium, which is an excellent neutron absorber and, thus, provides high contrast between the dissolution channels and the virtually transparent consolidated porous medium. Be- cause thermal neutrons cannot directly expose the film, an intermediate screen was used to absorb the neutrons and generate a secondary form of radiation (such as electrons, gamma rays, or visible light). In this study, a gadolinium oxi- sulfide screen was used to expose Kodak Azo black and white film. An exposure time of about 40 s was required and the photographic film was developed using standard procedures. This imaging technique is capable of detecting structures of the order of 0.5 micron. Neutron radiography is described in more detail in the literature (Jasti and Fogler, 1992; Lindsay et al., 1990).
Results and Discussion Typical permeability responses obtained during linear
coreflood experiments with 0.25-M EDTA injected at p H 4 are shown in Figure 5. Corresponding neutron radiographs are shown in Figure 1. The rapid increase in permeability is due to the formation of a dominant flow channel that perco- lates the porous medium and causes a significant reduction in the resistance to flow. At the relatively low injection rate of 0.01 cmymin, a negligible increase in permeability was ob- served even after injecting 18 pore volumes of fluid, due to
Figure 5. Permeability response from linear coreflood experiments with 0.25-M EDTA injected at pH 4.
the formation of a large conical-shaped dissolution channel. As the injection rate was increased from 0.01 to 0.06 cm'/min, there was a decrease in the number of pore volumes required to break through, as a single dominant wormhole channel eventually formed. (The number of pore volumes to break through was defined as the point at which the permeability ratio reached 100.) As the injection rate was increased above 0.06 cmymin, the number of pore volumes to break through increased due to the formation of increasingly branched dis- solution structures. This trend in the permeability responses, and the typical transition from face dissolution to a single dominant wormhole channel to ramified wormhole struc- tures, was observed with all the fluids investigated in this study. Refer to Fredd (1998) for additional neutron radio- graphs.
The dependence of the number of pore volumes required to break through on the injection rate is better illustrated in Figure 6. The figure includes data from linear coreflood ex- periments with 0.25-M CDTA (pH 4.41, 0.25-M DTPA (pH 4.3), 0.25-M EDTA (pH 4 and 13), 0.5-M HAc, and 0.5-M HCI. All the fluids exhibit an optimum injection rate at which the number of pore volumes required to break through is minimized. This optimum is consistent with results obtained previously with HCl (Hoefner and Fogler, 1988: Wang et al., 1993; Mostofizadeh and Economides, 1994; Frick et al., 1994; Bazin et al., 1995; Huang et al., 1997). Notice that as the diffusion coefficient was decreased with fluid type from HCl (3.6 x l ops cm2/s) to HAc (1.1 x lo-' cm2/s) to the chelating agents [EDTA (6X lo-' cm2/s), CDTA (4.5 X lo-' cm2/s), DTPA (4X cm*/s)], the optimum injection rate de- creased. (References for diffusion coefficients are given in Table 2.) When injected at rates below about 0.2 cm3/min, the effectiveness of acetic acid and the chelating agents as alternative stimulation fluids is demonstrated by fewer pore volumes of fluid being required to break through than with HC1. Therefore, in shallow or tight formations where low in- jection rates are required to prevent fracturing the forma- tion, these alternative fluids are more effective than HC1.
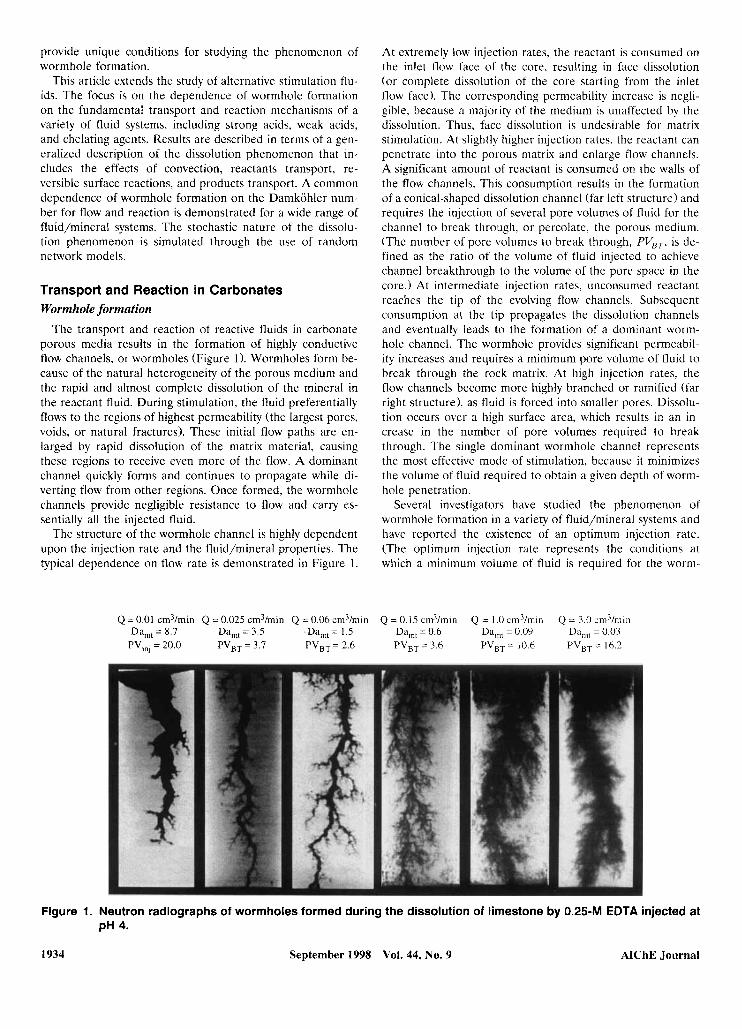
Previous work has shown that the phenomenon of worm- hole formation is dependent upon the Damkohler number for flow and reaction (Hoefner and Fogler, 1988). Figure 7
1938 September 1998
+ 0.25 M DTPA, pH=4.3 A 0.25 M EDTA, pH=13 o 0.25 M EDTA, pH=4 x 0.25 M CDTA, pH=4.4
0 m 0.5 M HAc o 0.5 M HCI
/A
1
22 0 a
1 o - ~ I ' ' """I ' ' """I ' ' """I ' "'I
10-2 10'' loo 10' lo2
Injection rate [cm3/min]
through for a variety of stimulation fluids. Figure 6. Number of pore volumes required to break
shows the number of pore volumes required to break through plotted vs. the inverse of the Damkohler number as defined in Eq. I (that is, assuming dissolution limited by the transport of reactants to the surface). The Damkohler number has been defined based on the final macroscopic dimensions of the wormhole ( d and I ) , as discussed in the following section. (Note that the x-axis in Figure 7 still depicts increasing injec- tion rates from left to right.) All of these fluids exhibit an optimum Damkohler number at which the number of pore volumes to break through is minimized. When referring back to Figure 6, one can see that the curves for the chelating agents and HAc have been shifted slightly towards that of HC1. However, the minimums of the curves do not occur at the same Damkohler number. As a result, different worm- hole structures are obtained for the same value of the
Table 2. Parameters Used to Calculate the Overall Dissolution Rate Constant
*Estimated from the Stokes-Einstein equation.
'From Fredd and Fogler (1998b).
*From Lund et al. (1975).
'Assumed, based on value for Ru-EDTA (Jiang and Anson. 1Y92).
**Assumed to be equal to diffusion coefficient of EDTA at pH 13.
"From Vitagliano and Lyons (1956).
**Assumed, based on D, and value for Ca-EDTA.
"Estimated from ionic diffusion coefficients (Cussler. 1984). "'From Fredd and Fogler (1998~).
"""Assumed. based o n irreversibility of surface reactions (cf. Table 1).
Vol. 44, No. 9 AIChE Journal
l o o /
';i 1 - j
- 0.25 M DTPA. pH=4.3 A 0.25 M EDTA. pH=13 o 0.25 M EDTA. pH=4 x 0.25 M CDTA. pH=4.4
0.5 M HAc o 0.5 M HCI
m,' """ ' I ' """ ' I ' " " " ' I ''"7 113 ' 1 oo 10' 1 o2 1 o3
1,'Damkohler number (transport limited)
Figure 7. Number of pore volumes to break through plotted vs. the inverse of the Damkahler num- ber as defined by Eq. 1.
Damkiihler number. Near the optimum Damkohler number for HCI, a single dominant wormhole channel is observed, while more ramified structures are observed with the other fluids at the \ame Damkohler number. (The discrepancy is more severe when the data are plotted vs. the Damkohler number for reaction rate limitations.) In other words, the Damkohler number defined for dissolution limited by the transport of reactants to the surface does not provide a gen- eral description of the dissolution phenomenon for the vari- ous fluid systems. This discrepancy is due to the dissolution being influenced by the transport of reactants to the surface, the reversible surface reactions, and the transport of prod- ucts away from the surface. Therefore, the effects of the various transport and reaction processes must be considered simultaneously to describe the phenomenon of wormhole formation.
C Bulk fluid
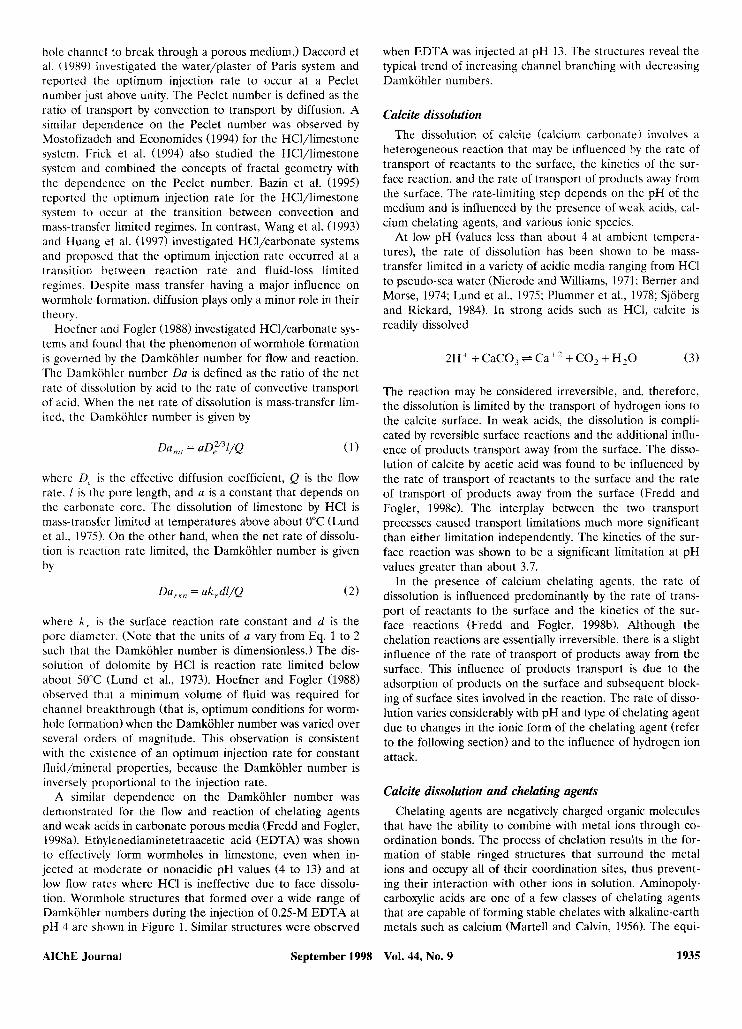
Figure 8. Reactant transport to surface, reversible sur- face reaction, and product transport away from surface.
Development of a Comprehensive Dissolution Model
The overall carbonate dissolution mechanism has been modeled as three sequential processes, as shown in Figure 8. These processes include the mass transfer of reactants to the carbonate surface, the reversible surface reactions, and the mass transfer of products away from the carbonate surface. To simplify the illustration of this development, the surface reactions have been generalized as
Reactants + CaCO, * Products (12)
Assuming the dissolution occurs by a first-order heteroge- neous chemical reaction, the rate of dissolution ( r J is then given by
where k , is the effective forward reaction rate constant, K,, is the effective equilibrium constant, and C, and CpI, are the reactants and products concentrations at the solid-liquid in- terface, respectively. The effective reaction rate and equilib- rium constants for this generalized reaction depend on which reaction mechanism is dominating the dissolution and, there- fore, depend on the pH and the type of species present. This generalized expression was shown to describe the rate of cal- cite dissolution by acetic acid (Fredd and Fogler, 1998~). It can be applied to calcite dissolution by aminopolycarboxylic- type chelating agents if the relatively slight influence of prod- ucts adsorption and site blocking is assumed negligible.
At steady state, the rates of the three sequential processes are equal and the rate of reactant consumption ( r 4 ) is given by
rA = vrD
= K,(C - C,)
where v is the stoichiometric ratio of reactants consumed to products produced, and K , and K , are the mass-transfer coefficients for the reactants and products, respectively. These expressions were solved simultaneously for the inter- face concentrations, which were then substituted back into Eq. 14. The concentration of products in the bulk solution at steady state is given by
( C , - c> c, = V
(15)
where Co is the initial reactant concentration. Making the additional substitution for C p in Eq. 14, the rate of reactant consumption can then be expressed as
where the overall dissolution rate constant K depends on the
AIChE Journal September 1998 Vol. 44, No. 9 1939
I4 I 4 Figure 9. Idealized wormhole channel.
sum of resistances in series and is given by
1
The dissolution of the porous medium was then modeled as the dissolution of a representative cylindrical tube. The cylindrical tube represents the dominant flow channels within the porous medium (that is, the wormholes), as shown in Fig- ure 9. Convection and reaction in the tube were included in a reactant mass balance, where Eq. 16 was used for the rate of reactant consumption. Solution of the reactant mass balance equation resulted in an expression for the concentration pro- file along the length of the channel which was dependent upon the Damkohler number
Here, the Damkohler number is defined as
where d and 1 are the diameter and length of the capillary tube, respectively, and u is the superficial velocity in the cap- illary tube. Because of the dependence on the overall dissolu- tion rate constant, this Damkohler number includes the ef- fects of reactants transport, reversible surface reactions, and products transport. Physically, the Damkohler number pro- vides a measure of the amount of reactant being consumed on the walls of the wormhole, as opposed to being trans- ported to the tip of the wormhole where it can be consumed efficiently.
To determine the overall dissolution rate constant, the mass-transfer coefficients were obtained from Levich’s solu- tion of the convective diffusion equation for laminar flow in a cylindrical tube (Levich, 1962). The average mass-transfer co- efficient along the length of a tube is given by
(20)
where K,,,, is for either reactants or products ( K , or K 3 ) , depending on the value of the diffusion coefficient. Because the diameter and length of the capillary tube, or wormhole channel, change with time. the mass-transfer coefficients and the Damkiihler number were evaluated based on the final wormhole dimensions. The diameter was measured from neutron radiographs. Typical diameters were of the order of 0.06 cm. The length was assigned a representative length of the wormhole (one-half the length of the core). Thc effcctive surface reaction rate constant and the effective equilibrium constant were obtained from the independent kinetic studies using a rotating disk (Fredd and Fogler, 1998b,c). The effec- tive constants are listed in Table 2. along with values for the diffusion coefficients of reactants and products. Values for K,, include the interface concentration of the carbonate ions which were assumed to be independent of the hydrodynam- ics. For the case of HCI and the three chelating agents, K,, is relatively high so the products transport and revcrse reac- tion terms become negligible. Note that Eq. 19 reduces to Eq. 1 and Eq. 2 for reactants transport limited ( K = K , ) and reaction rate limited ( K = k,) dissolution, respectively, and is, therefore, consistent with the previous definitions by Hoefner and Fogler (1988).
Optimum Damkohler number The number of pore volumes required to break through
are shown as a function of the inverse of the Damkohler number (as defined in Eq. 19) in Figure 10. One can see that the curves for the chelating agents and acetic acid have been shifted to the right (when compared to Figure 7), such that the minimum number of pore volumes to break through oc- cur at about the same Damkohler number as with HCI. Thus, these fluids are all characterized by the samc optimum Damkohler number. This optimum is observed for fluid/ limestone systems that range from reactants transport limited
+ 0.25 M DTPA, pH=4.3 A 0.25 M EDTA. pH=13 v Water/Plaster (Daccord et al., 1989) o 0.25 M EDTA, pH=4 x 0.25 M CDTA, pH=4.4
1 oo 10‘ 1 o2 l/Damkohler number
Figure 10. Number of pore volumes to break through plotted vs. the inverse of the Damkohler number as defined by Eq. 19.
1940 September 1998 Vol. 44, No. 9 AIChE Journal
o,5 HCI o,5 H k 0.25 M CDTA 0.25 M EDTA 0.25 M EDTA 0.25 M DTPA PV,, = 13.3 pH=4.4 pH=4 pH=13 pH=4 3
Figure 11. Neutron radiographs of wormholes formed during the dissolution of limestone by various fluids injected at a Darnkahler number of approximately 1.5.
(HCI) to reactants transport and surface reaction influenced (chelating agents) to reactants and products transport limited (HAc). Also included in this plot are data from Daccord et al. (1989) for the dissolution of plaster of Paris by water. This system, which i s limited by the transport of products away from the surface (Christofferson and Christofferson, 19761, also exhibits the same optimum Damkohler number. For this wide range of fluid/mineral systems, the optimum Damkohler number occurs at a value of approximately 0.29.
The dependence of the wormhole structure on the Dam- kohler number is shown in Figures 11, 12, and 13. The neu- tron radiographs show wormhole structures formed at Damkiihler numbers of approximately 1.5, 0.29 (optimum), and 0.04. Notice that the wormhole structures formed by the
various fluids exhibit similarities in the amount and type of channel branching at each of these Damkohler numbers. As the Damkohler number is decreased, the wormhole struc- tures change from conical-shaped channels, with large diame- ters and little branching, to single dominant channels to highly ramified channels. Thus, the Damkohler number dictates the structure of dissolution channels formed by systems with a wide range of mass-transfer and reaction limitations.
Because all of the fluids exhibit a common dependence on the Damkohler number and similar trends in the number of pore volumes to break through and wormhole structures, a single description of the dissolution phenomenon is possible. This description is obtained by normalizing the number of pore volumes to break through data by the minimum number
0.5 M HCI 0.5 M HAc 0.25 M CDTA 0.25 M EDTA 0.25 M EDTA 0.25 M DTPA PVBT = 0.8 PV,T = 1.7 pH=4.4 pH=4 pH= 1 3 pH=4.3
PVB, = 2.9 PVBT = 2.9 PV,, = 6.4 PV,, = 8.6
Figure 12. Neutron radiographs of wormholes formed during the dissolution of limestone by various fluids injected at a Damkohler number of approximately 0.29 (optimum).
AIChE Journal September 1998 Vol. 44, No. 9 1941
0.5 M HCI 0.5 M HA^ 0.25 M EDTA 0.25 M CDTA 0.25 M EDTA 0.25 M DTPA PVBT = 6.7 PVBT = 1 1 .I pH =
Figure 13. Neutron radiographs of wormholes formed during the dissolution of limestone by various fluids injected at a Damkohler number of approximately 0.04.
of pore volumes to break through for the respective fluids. The normalized number of pore volumes to break through are plotted vs. the inverse of the Damkohler number in Fig- ure 14. The results reveal a single curve for a wide range of fluid/mineral systems, including different fluid types, p H val- ues, and temperatures. This single curve provides a means of estimating the entire pore-volumes-to-breakthrough curve and the wormhole structures from a single coreflood experi- ment near the optimum Damkohler number. Thus, the need for exhaustive coreflood s tudies t o de te rmine the effectiveness of a fluid under particular reservoir conditions is eliminated.
m 0.25 M DTPA, pHs12.5 + 0.25 M DTPA, pH4.3 A 0.25 M EDTA, pH=13 v Water/Plaster
(Daccord et al., 1989) 4 0.25 M EDTA, pH=4 x 0.25 M CDTA, pH=4.4
0.5 M HAc 0.5 M HCI, 50°C
o 0SM HCI
0.25 M EDTA (pH 4), 50°C
1 oo 10' 1 o2 l/Damkohler number
Figure 14. Normalized number of pore volumes to break through plotted vs. the inverse of the gener- alized Damkohler number for a wide range of fluid/mineral systems.
1942 September 1998
Network Modeling Wormhole formation occurs because the dissolution ic in-
fluenced significantly by transport processes. Thus, the phe- nomenon is strongly dependent upon the flow profile in- duced by pore-scale heterogeneity. The necessity to account for the pore-scale heterogeneity precludes the use of contin- uum models, which require macroscopically uniform proper- ties. Network models have the advantage of accounting for such pore-scale heterogeneity and simulating their effects on macroscopic phenomena. Network models were first used by Fatt (1956) to simulate flow in porous media and have since been used to simulate a variety of macroscopic phenomena in porous media, such as fluid displacement, dispersion, deep- bed filtration, and particulate straining. Hoefner and Fogler (1988) were the first to apply network models to carbonate stimulation and were able to qualitatively Gmulate the phe- nomenon of wormhole formation. An extensive review of net- work models used to simulate flow phenomena in porous me- dia is given by Sahimi et al. (1990).
This work applies a two-dimensional (2-D) random nct- work model and a 3-D physically representative network model to simulate the phenomenon of wormhole formation. The existence of an optimum Damkohler number is substan- tiated with both models.
2 - 0 network model The 2-D network model developed by Hoefner and Fogler
(1988) was successful in qualitatively predicting the effects of the Damkohler number on the wormhole structure and pcr- meability response for the extreme cases of mass-transfer and surface reaction limited dissolution. We have extended the network model to include the effects of reactants transport, reversible surface reactions, and products transport on the dissolution phenomenon.
2-0 Model Description. A brief description of the network model is given here; additional details are described in the literature (Hoefner and Fogler, 1988). The network consists
Vol. 44, No. 9 AIChE Journal
of a regular 2-1) array of nodes that are connected by bonds of cylindrical tubes (triangular network with coordination number 6). The nodes represent the pore space and serve as fluid-mixing sitcs, while the bonds represent the pore throats and provide a means of simulating viscous resistances to flow. The resistance to flow is controlled by the bond diameters. The diameters are assigned according to a log-normal distri- bution over the diameter range of 0.03 to 4.0 ,urn. This pore- size distribution is consistent with that found in Indiana lime- stone as determined from mercury porosimetry (Hoefner and Fogler, 1988). The bonds were assigned a uniform length that was scaled to the core dimension (in the case of a 30x50 node network. I = core length/50).
The network is assigned a condition of constant volumetric flow rate at thc inlet flow face. The pressure at the opposite face is taken to be zero, and periodic boundary conditions are assigned to the sides of the array. The flow profile is calculated from fluid conservation equations at each node i,
where gL,, is the fluid conductivity in bond j (calculated based on Eq. 22). The fluid conservation equations provide a sys- tem of linear algebraic equations that are solved simultane- ously for the pressure p at each node using a Gauss-Seidel method with overrelaxation. The flow rate through each bond is then calculated based on the Hagen-Poiseuille relationship for laminar flow through a cylindrical tube
where d is the bond diameter, 1 is the bond length, and A p is the pressure drop across the length of the bond.
Once the flow profile is calculated, transport and reaction within the net- work are simulatcd. The reactant concentration is set equal to the initial concentration at the inlet flow face. The flow profile is used to calculate the volume of fluid advancing through each bond within a given time step. The time step size is selected such that reactant consumption is quasi- steady. The amount of reactant consumed in each bond is calculated from the solution for transport and reaction in a cylindrical tube (Eq. 18) and, therefore, is a function of the Damkohler number (defined based on the bond dimensions). The effluent concentration from each bond is calculated from the concentration in the connected upstream pore. As the reactant enters a downstream pore, the fluid is mixed with fluid entering from other bonds to give an average concentra- tion of reactant in that pore. This concentration then serves as the inlet Concentration for the subsequent downstream pore throats.
The dissolution is simulated by allowing the bonds to grow in diameter as the reactant is consumed. The bond growth rate is assumed to be proportional to the total rate of reac- tant consumption per unit length of the bond, to be uniform along the length of the bond, and to be quasisteady with re- spect to reactant consumption. These assumptions give the
Transpofl and Reaction in the 2-0 Model.
change in bond volume
where y is the ratio of rock volume dissolved to moles of reactant consumed and At is the time step size. As the bond diameters increase, the conductivities are recalculated and the flow profile is updated. Redistribution of flow and continued dissolution eventually lead to a few bonds dominating the network and the formation of highly conductive flow chan- nels.
Simulations were run with 30 X50 networks. [Results were shown to be independent of network size when perturbed about this size (Hoefner and Fogler, 19881.1 The simulations presented here are based on a single realization of the network, so the results are influ- enced only by changes in the Damkohler number.
Network model simulations of dissolution structures formed by the injection of 0.25-M EDTA at p H 4 are shown in Fig- ure 15. The simulations represent a span of over three orders of magnitude in the Damkohler number. As the Damkohler number was decreased, the typical transition from face disso- lution to a single dominant wormhole channel to ramified wormhole structures was observed. [The dissolution struc- tures were slightly different when generated from different realizations, but they exhibited the same transition, as ob- served previously by Hoefner (19871.1 The simulated dissolu- tion structures are in qualitative agreement with the radio- graphs obtained experimentally (Figure 1).
Simulations of the number of pore volumes required to break through are plotted vs. the injection rate and the in- verse of the Damkohler number in Figure 16. Results for 0.25-M EDTA at p H 4 and 0.5-M HC1 depict the characteris- tic optimum injection rate, which decreased as the diffusion coefficient was decreased from HCI to EDTA. The optimum injection rates for EDTA and HC1 are consistent with experi- mentally observed values. The optimum injection rate was controlled by scaling the Damkohler number by a factor of 0.002. The same scaling parameter was used for all simula- tions. Simulations also predicted the same optimum Damkohler number for both fluids. (Note that, as with the experimental data, the results are plotted with the Damkohler number based on the final wormhole dimensions.) These re- sults are consistent with experimental observations. However, the simulations did not predict the experimentally observed
2 - 0 Network Model Results.
Decreasing Damkohler number (Increasing injection rate)
Figure 15. 2-D network model simulations of dissolu- tion structures formed by 0.25-M EDTA in- jected at pH 4.
AIChE Journal September 1998 Vol. 44, No. 9 1943
10000 3
10000 _I
Figure 16.
lo-’ 1 oo 10’ 1 o2 1lDarnkohler number
(b) Number of pore volumes required to break through vs. (a) injection rate and (b) Damkohler number. Network model simulations with 0.25-M EDTA at pH 4 and 0.5-M HCI.
increase in the number of pore volumes to break through as the fluid was changed from HCI to EDTA.
The inability of the network model to predict the depend- ence of the number of pore volumes to break through on the fluid type can be attributed to the network maintaining its topological structure during the dissolution. As pores are dis- solved in natural porous media, they grow and eventually merge with neighboring pores. This merging of pores results in a decrease in the number of pores and a significant change in the pore-size distribution, as described by Schechter and Gidley (1969). However, in the 2-D network model, the merg- ing of pores is not taken into account as a constant number of bonds continue to grow on the regular lattice. The result is a lack of physical basis for the topological evolution of the network as it is dissolved. The model provided qualitative predictions of channel structure and permeability, because the network was decorated with bonds that simulated the hetero- geneity of natural porous media. That is, the model captured the effects of the heterogeneous flow profile on a dissolution phenomenon that is influenced significantly by transport processes. For quantitative predictions, a network model that more accurately captures the physical characteristics of the dissolution must be utilized, as is the case with the 3-D model described in the following sections.
3-0 physically representative network model A 3-D physically representative network (PRN) model
(Bryant et al., 1993; Thompson and Fogler, 1997) for single-
1944 September 1998
phase flow in disordered packed beds was extended to simu- late transport and reaction in carbonate porous media. The PRN model is based on a packed-bed representation of the porous medium. The model includes a complete topological description of the porous medium and a fundamental de- scription of the pore-scale hydrodynamics. Thc PRN model was developed by Bryant et al. (1993) and used to simulate flow through consolidated sandstone. They introduced com- paction and consolidation of the packed bed and simulated the permeability of an outcrop of Fontainebleau sandstone from a fundamental knowledge of the pore-scale morphol- ogy. Quantitative predictions of permeability spanning sev- cral orders of magnitude were obtained without any ad- justable parameters. The PRN model was extended by Thompson and Fogler (1997) to simulate multiphase flow and interfacial gelation reactions in porous media. They obtained quantitative predictions of residence time distributions ob- tained from packed-bed experiments with various bed ar- rangements (including layered beds and voids). These results indicate the ability of the PRN model to quantitatively pre- dict macroscopic phenomena from a knowledge of the pore- scale processes.
This work incorporates transport and reaction in thc PRN model developed by Thompson and Fogler (1997). The major objective of this extension is to take advantage of the physi- cally meaningful representation of the porous medium. The effects of reactants transport, reversible surface reactions, and products transport are included in the PRN model.
Due to the complex nature of the PRN model, only an overview of the bed generation and hy- drodynamic calculations is given here. The reader is referred to Thompson and Fogler (1997) for additional details.
The PRN model is based on a 3-D packed bed of spheres. The bed is generated from the physical properties of the bed (mean sphere size, standard deviation in sphere diameter, cross-sectional area of the bed, and the number of particles in the bed) using a drop-and-roll algorithm, which simulates random packing in a specified volume. Edge effects associ- ated with irregular packing at the bed boundaries are re- duced by generating a bed larger than specified and using the interior packing for the simulation. A complete description of the packed bed is provided by knowledge of the x, y . and z coordinates and radius of every sphere in the pack.
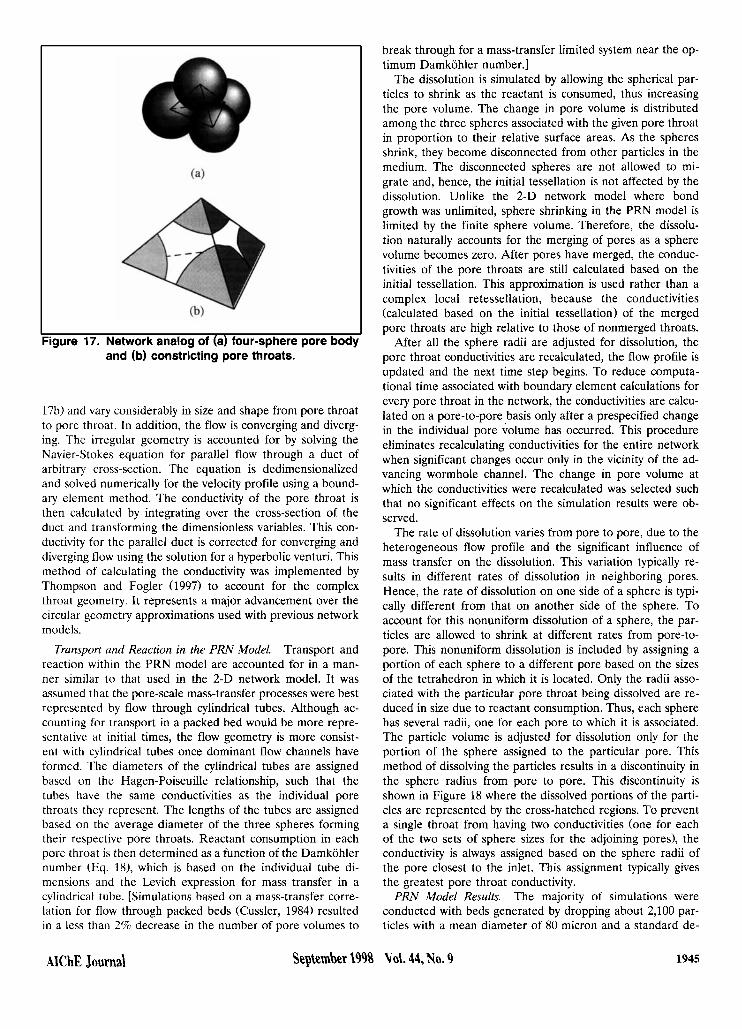
Once the bed is generated, it is transformed onto a net- work using a Delaunay tessellation as described by Bryant et al. (1993). The Delaunay tessellation results in a space-filling array of tetrahedrons, each having vertices at sphere centers as shown in Figure 17. The tetrahedrons define both the indi- vidual pores and the interconnectivity of the network. The region of space in the center of the four spheres associated with a tetrahedron represents the network analog of the pore body. The faces of the tetrahedron represent the narrow con- strictions through which fluid must flow to enter the pore body and, hence, represent the network analog of pore throats or bonds (Figure 17b).
The flow and pressure profiles are calculated based on the fluid conservation equations as described for the 2-D nct- work model. The solution strategy is identical. However, the pore throat geometry is no longer quite so simple, so the throat conductivities cannot be determined from an analyti- cal solution. The throat cross-sections are irregular (Figure
PRN Model Description.
Vol. 44, No. 9 AIChE Journal
I
Figure 17. Network analog of (a) four-sphere pore body and (b) constricting pore throats.
17b) and vary considerably in size and shape from pore throat to pore throat. In addition, the flow is converging and diverg- ing. The irregular geometry is accounted for by solving the Navier-Stokes equation for parallel flow through a duct of arbitrary cross-section. The equation is dedimensionalized and solved numerically for the velocity profile using a bound- ary element method. The conductivity of the pore throat is then calculated by integrating over the cross-section of the duct and transforming the dimensionless variables. This con- ductivity for the parallel duct is corrected for converging and diverging flow using the solution for a hyperbolic venturi. This method of calculating the conductivity was implemented by Thompson and Fogler (1997) to account for the complex throat geometry. It represents a major advancement over the circular geometry approximations used with previous network models.
Transport and reaction within the PRN model are accounted for in a man- ner similar to that used in the 2-D network model. It was assumed that the pore-scale mass-transfer processes were best represented by flow through cylindrical tubes. Although ac- counting for transport in a packed bed would be more repre- sentative at initial times, the flow geometry is more consist- ent with cylindrical tubes once dominant flow channels have formed. The diameters of the cylindrical tubes are assigned based on the Hagen-Poiseuille relationship, such that the tubes have the same conductivities as the individual pore throats they represent. The lengths of the tubes are assigned based on the average diameter of the three spheres forming their respective pore throats. Reactant consumption in each pore throat is then determined as a function of the Damkohler number (Eq. 18), which is based on the individual tube di- mensions and the Levich expression for mass transfer in a cylindrical tube. [Simulations based on a mass-transfer corre- lation for flow through packed beds (Cussler, 1984) resulted in a less than 2% decrease in the number of pore volumes to
Trunsport and Reaction in the PRN Model.
break through for a mass-transfer limited system near the op- timum Damkohler number.]
The dissolution is simulated by allowing the spherical par- ticles to shrink as the reactant is consumed, thus increasing the pore volume. The change in pore volume is distributed among the three spheres associated with the given pore throat in proportion to their relative surface areas. As the spheres shrink, they become disconnected from other particles in the medium. The disconnected spheres are not allowed to mi- grate and, hence, the initial tessellation is not affected by the dissolution. Unlike the 2-D network model where bond growth was unlimited, sphere shrinking in the PRN model is limited by the finite sphere volume. Therefore, the dissolu- tion naturally accounts for the merging of pores as a sphere volume becomes zero. After pores have merged, the conduc- tivities of the pore throats are still calculated based on the initial tessellation. This approximation is used rather than a complex local retessellation, because the conductivities (calculzted based on the initial tessellation) of the merged pore throats are high relative to those of nonmerged throats.
After all the sphere radii are adjusted for dissolution, the pore throat conductivities are recalculated, the flow profile is updated and the next time step begins. To reduce computa- tional time associated with boundary element calculations for every pore throat in the network, the conductivities are calcu- lated on a pore-to-pore basis only after a prespecified change in the individual pore volume has occurred. This procedure eliminates recalculating conductivities for the entire network when significant changes occur only in the vicinity of the ad- vancing wormhole channel. The change in pore volume at which the conductivities were recalculated was selected such that no significant effects on the simulation results were ob- served.
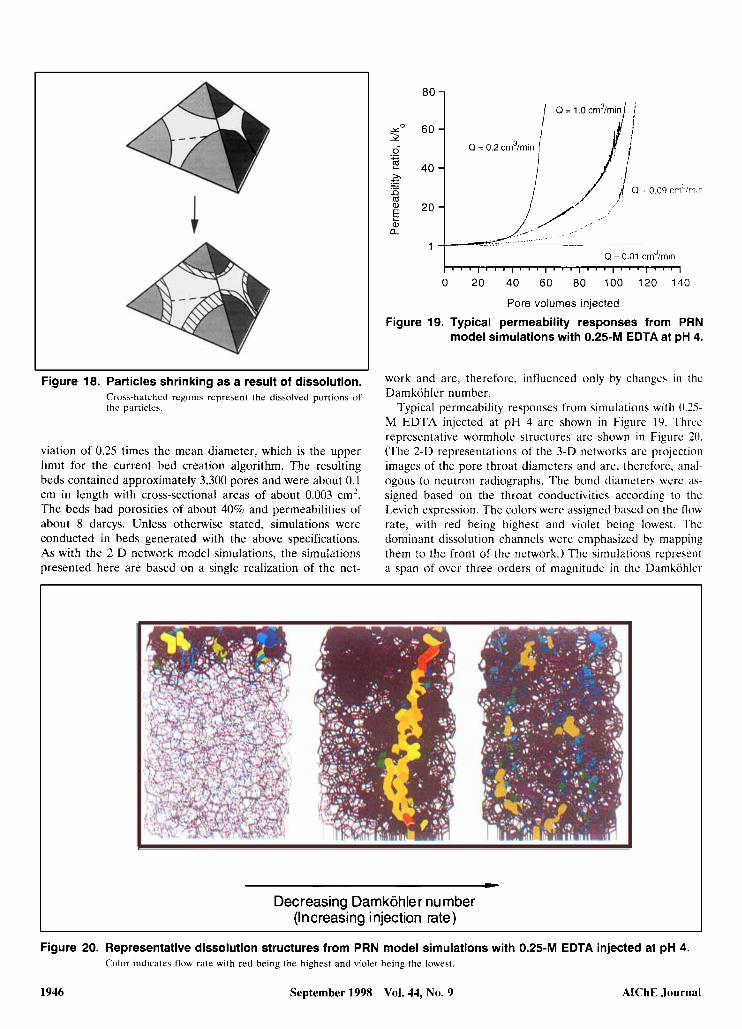
The rate of dissolution varies from pore to pore, due to the heterogeneous flow profile and the significant influence of mass transfer on the dissolution. This variation typically re- sults in different rates of dissolution in neighboring pores. Hence, the rate of dissolution on one side of a sphere is typi- cally different from that on another side of the sphere. To account for this nonuniform dissolution of a sphere, the par- ticles are allowed to shrink at different rates from pore-to- pore. This nonuniform dissolution is included by assigning a portion of each sphere to a different pore based on the sizes of the tetrahedron in which it is located. Only the radii asso- ciated with the particular pore throat being dissolved are re- duced in size due to reactant consumption. Thus, each sphere has several radii, one for each pore to which it is associated. The particle volume is adjusted for dissolution only for the portion of the sphere assigned to the particular pore. This method of dissolving the particles results in a discontinuity in the sphere radius from pore to pore. This discontinuity is shown in Figure 18 where the dissolved portions of the parti- cles are represented by the cross-hatched regions. To prevent a single throat from having two conductivities (one for each of the two sets of sphere sizes for the adjoining pores), the conductivity is always assigned based on the sphere radii of the pore closest to the inlet. This assignment typically gives the greatest pore throat conductivity.
The majority of simulations were conducted with beds generated by dropping about 2,100 par- ticles with a mean diameter of 80 micron and a standard de-
PRN Model Results.
AIChE Journal September 1998 Vo\. 44, No. 9 1945
Figure 18. Particles shrinking as a result of dissolution. Cro\+hatched regions represent the dissolved portion5 of the particles
viation of 0.25 times the mean diameter, which is the upper limit for the current bed creation algorithm. The resulting beds contained approximately 3,300 pores and were about 0.1 cm in length with cross-sectional areas of about 0.003 em2. The beds had porosities of about 40% and permeabilities of about 8 darcys. Unless otherwise stated, simulations were conducted in beds generated with the above specifications. As with the 2-D network model simulations, the simdations presented here are based on a single realization of the net-
Q = 1.0 crn3/rnin/ j 8o 1
Q = 0.01 crn3irnin I " ' I ' " I " ' I " ' I " ' I ' " i
0 20 40 60 80 100 120 140
Pore volumes injected
Figure 19. Typical permeability responses from PRN model simulations with 0.25-M EDTA at pH 4.
work and are, therefore, influenced only by changes in thc Damkohler number.
Typical permeability responses from simulations with 0.7.5- M EDTA injected at p H 4 are shown in Figure 19. Three representative wormhole structures arc shown in Figure 20. (The 2-D representations of the 3-D networks are projection images of the pore throat diameters and are, therefore, anal- ogous to neutron radiographs. The bond diameters were as- signed based on the throat conductivitics according to the Levich expression. The colors were assigned based on the flow rate, with red being highest and violet bcing lowest. The dominant dissolution channels were emphasized by mapping them to the front of the network.) The simulations represent a span of over three orders of magnitude in the Damkijhlcr
Decreasing Damkohler number (Increasing injection rate)
Figure 20. Representative dissolution structures from PRN model simulations with 0.25-M EDTA injected at pH 4. Color indicates flow rate with red heing the highest and violet heing the lowest.
1946 September 1998 Vol. 44, No. 9 AIChE Journal
i a, a
HCI
1000 7
a, a
o EDTA.pH4 \ o HCI
100 10' 102 1 o3 l/Darnkohler number
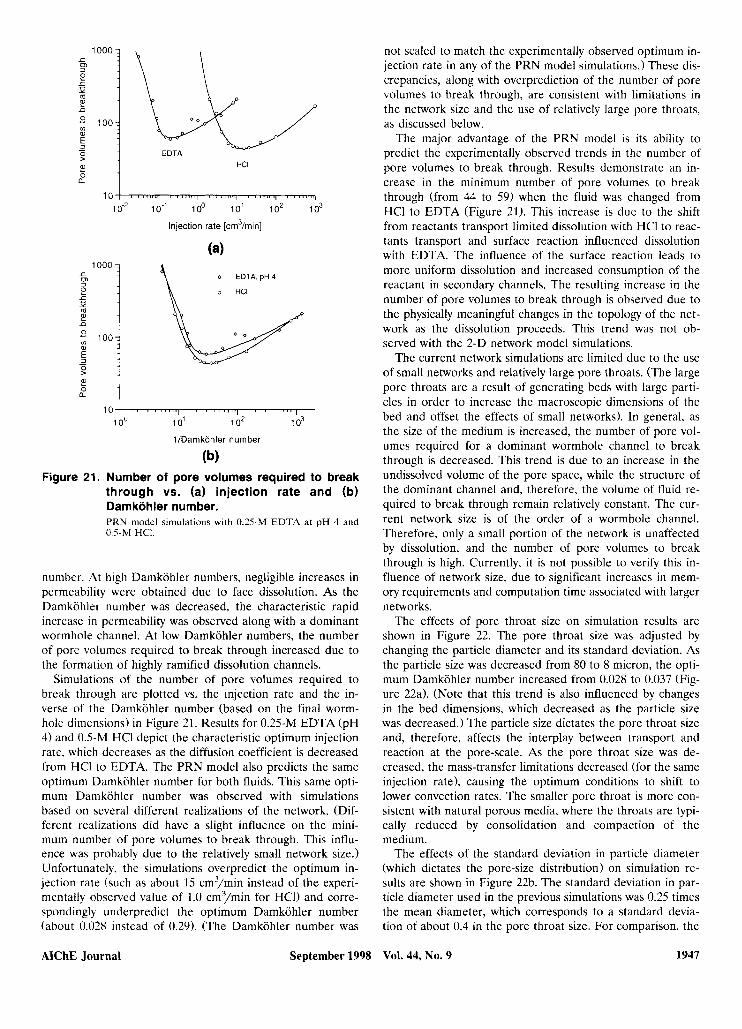
(b) Figure 21. Number of pore volumes required to break
through vs. (a) injection rate and (b) Damkohler number. PRN model simulations with 0.25-M EDTA at pH 4 and 0.5-kf HCI.
number. At high Damkohler numbers. negligible increases in permeability were obtained due to face dissolution. As the Damkohler number was decreased, the characteristic rapid increase in permeability was observed along with a dominant wormhole channel. At low Damkohler numbers, the number of pore volumes required to break through increased due to the formation of highly ramified dissolution channels.
Simulations of the number of pore volumes required to break through are plotted vs. the injection rate and the in- verse of the Damkohler number (based on the final worm- hole dimensions) in Figure 21. Results for 0.25-M EDTA (pH 4) and 0.5-M HCI depict the characteristic optimum injection rate, which decreases as the diffusion coefficient is decreased from HCI to EDTA. The PRN model also predicts the same optimum Damkohler number for both fluids. This same opti- mum Damkohler number was observed with simulations based on several different realizations of the network. (Dif- ferent realizations did have a slight influence on the mini- mum number of pore volumes to break through. This influ- ence was probably due to the relatively small network size.) Unfortunately, the simulations overpredict the optimum in- jection rate (such as about 1.5 cm3/min instead of the experi- mentally observed value of 1.0 cmymin for HCI) and corre- spondingly underpredict the optimum Damkohler number (about 0.028 instead of 0.29). (The Damkohler number was
not scaled to match the experimentally observed optimum in- jection rate in any of the PRN model simulations.) These dis- crepancies, along with overprediction of the number of pore volumes to break through, are consistent with limitations in the network size and the use of relatively large pore throats. as discussed below.
The major advantage of the PRN model is its ability to predict the experimentally observed trends in the number of pore volumes to break through. Results demonstrate an in- crease in the minimum number of pore volumes to break through (from 44 to 59) when the fluid was changed from HC1 to EDTA (Figure 21). This increase is due to the shift from reactants transport limited dissolution with HC1 to reac- tants transport and surface reaction influenced dissolution with EDTA. The influence of the surface reaction leads to more uniform dissolution and increased consumption of the reactant in secondary channels. The resulting increase in the number of pore volumes to break through is observed due to the physically meaningful changes in the topology of the net- work as the dissolution proceeds. This trend was not ob- served with the 2-D network model simulations.
The current network simulations are limited due to the use of small networks and relatively large pore throats. (The large pore throats are a result of generating beds with large parti- cles in order to increase the macroscopic dimensions of the bed and offset the effects of small networks). In general, as the size of the medium is increased, the number of pore vol- umes required for a dominant wormhole channel to break through is decreased. This trend is due to an increase in the undissolved volume of the pore space, while the structure of the dominant channel and, therefore, the volume of fluid re- quired to break through remain relatively constant. The cur- rent network size is of the order of a wormhole channel. Therefore, only a small portion of the network is unaffected by dissolution, and the number of pore volumes to break through is high. Currently, it is not possible to verify this in- fluence of network size, due to significant increases in mem- ory requirements and computation time associated with larger networks.
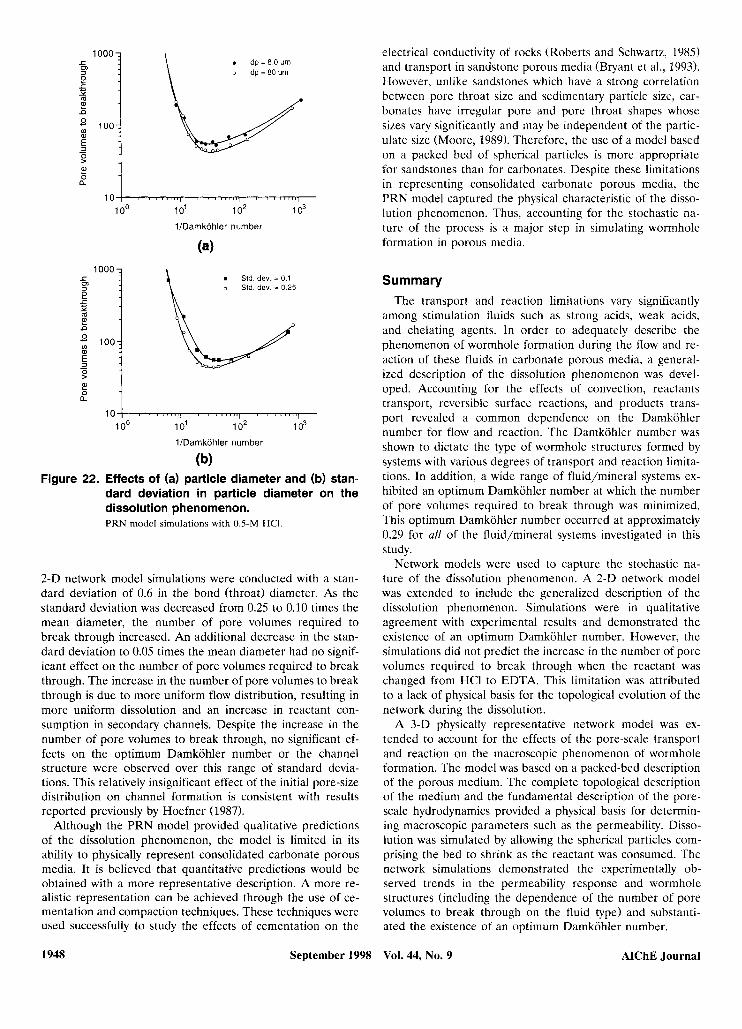
The effects of pore throat size on simulation results are shown in Figure 22. The pore throat size was adjusted by changing the particle diameter and its standard deviation. As the particle size was decreased from 80 to 8 micron, the opti- mum Damkohler number increased from 0.028 to 0.037 (Fig- ure 22a). (Note that this trend is also influenced by changes in the bed dimensions, which decreased as the particle size was decreased.) The particle size dictates the pore throat size and, therefore, affects the interplay between transport and reaction at the pore-scale. As the pore throat size was de- creased, the mass-transfer limitations decreased (for the same injection rate), causing the optimum conditions to shift to lower convection rates. The smaller pore throat is more con- sistent with natural porous media, where the throats are typi- cally reduced by consolidation and compaction of the medium.
The effects of the standard deviation in particle diameter (which dictates the pore-size distribution) on simulation re- sults are shown in Figure 22b. The standard deviation in par- ticle diameter used in the previous simulations was 0.25 times the mean diameter, which corresponds to a standard devia- tion of about 0.4 in the pore throat size. For comparison, the
AIChE Journal September 1998 Vol. 44, No. 9 1947
\ . d D = 8 0 u m
a, a
10 100 1 01 102 1 o3
l/Damkohler number
(b) Figure 22. Effects of (a) particle diameter and (b) stan-
dard deviation in particle diameter on the dissolution phenomenon. PRN model simulations with 0.5-M HCI.
2-D network model simulations were conducted with a stan- dard deviation of 0.6 in the bond (throat) diameter. As the standard deviation was decreased from 0.25 to 0.10 times the mean diameter, the number of pore volumes required to break through increased. An additional decrease in the stan- dard deviation to 0.05 times the mean diameter had no signif- icant effect on the number of pore volumes required to break through. The increase in the number of pore volumes to break through is due to more uniform flow distribution, resulting in more uniform dissolution and an increase in reactant con- sumption in secondary channels. Despite the increase in the number of pore volumes to break through, no significant ef- fects on the optimum Damkohler number or the channel structure were observed over this range of standard devia- tions. This relatively insignificant effect of the initial pore-size distribution on channel formation is consistent with results reported previously by Hoefner (1987).
Although the PRN model provided qualitative predictions of the dissolution phenomenon, the model is limited in its ability to physically represent consolidated carbonate porous media. It is believed that quantitative predictions would be obtained with a more representative description. A more re- alistic representation can be achieved through the use of ce- mentation and compaction techniques. These techniques were used successfully to study the effects of cementation on the
electrical conductivity of rocks (Roberts and Schwartz, 1985) and transport in sandstone porous media (Bryant et al., 1993). However, unlike sandstones which have a strong correlation between pore throat size and sedimentary particle size, car- bonates have irregular pore and pore throat shapes whose sizes vary significantly and may be independent of the partic- ulate size (Moore, 1989). Therefore, the use of a model based on a packed bed of spherical particles is more appropriate for sandstones than for carbonates. Despite these limitations in representing consolidated carbonate porous media, the PRN model captured the physical characteristic of the disso- lution phenomenon. Thus, accounting for the stochastic na- ture of the process is a major step in simulating wormhole formation in porous media.
Summary
The transport and reaction limitations vary cignificantly among stimulation fluids such as strong acids, weak acids, and chelating agents. In order to adequately describe the phenomenon of wormhole formation during the flow and re- action of these fluids in carbonate porous media, a general- ized description of the dissolution phenomenon was devel- oped. Accounting for the effects of convection, reactants transport, reversible surface reactions, and products trans- port revealed a common dependence on the Damkohler number for flow and reaction. The Damkohler number was shown to dictate the type of wormhole structures formed by systems with various degrees of transport and reaction limita- tions. In addition, a wide range of fluid/mineral systems ex- hibited an optimum Damkohler number at which the number of pore volumes required to break through was minimized. This optimum Damkohler number occurred at approximately 0.29 for all of the fluid/mineral systems investigated in this study.
Network models were used to capture the stochastic na- ture of the dissolution phenomenon. A 2-D network model was extended to include the generalized description of the dissolution phenomenon. Simulations were in qualitative agreement with experimental results and demonstrated the existence of an optimum Damkohler number. However, the simulations did not predict the increase in the number of pore volumes required to break through when the reactant was changed from HCI to EDTA. This limitation was attributed to a lack of physical basis for the topological evolution of the network during the dissolution.
A 3-D physically representative network model was ex- tended to account for the effects of the pore-scale transport and reaction on the macroscopic phenomenon of wormhole formation. The model was based on a packed-bed description of the porous medium. The complete topological description of the medium and the fundamental description of the pore- scale hydrodynamics provided a physical basis for determin- ing macroscopic parameters such as the permeability. Disso- lution was simulated by allowing the spherical particles com- prising the bed to shrink as the reactant was consumed. The network simulations demonstrated the experimentally ob- served trends in the permeability response and wormhole structures (including the dependence of the number of pore volumes to break through on the fluid type) and substanti- ated the existence of an optimum Damkohler number.
1948 September 1998 Vol. 44, No. 9 AIChE Journal
Acknowledgments The authors acknowledge the Industrial Affiliates Program for
Flow and Reaction in Porous Media at the University of Michigan for support of this work. Contributing companies include Aramco Services, ARC0 Exploration and Production Technology, Chevron Petroleum Technology Company, Conoco Production and Research Division, Dowel1 Schlumberger, Halliburton Services, INTEVEP, Mobil Technology Company, and Unocal Corporation.
Literature Cited Bazin, B., C. Roque, and M. Bouteca, “A Laboratory Evaluation of
Acid Propagation in Relation to Acid Fracturing: Results and In- terpretation,” SPE 30085, Euro. Formation Damage Conf., The Hague, The Netherlands (May 15-16, 1995).
Berner, R. A., and J. W. Morse, “Dissolution Kinetics of Calcium Carbonate in Sea Water IV. Theory of Calcite Dissolution,” Amer. J . Sci., 274, 108 (1974).
Bryant, S. L., D. W. Mellor, and C. A. Cade, “Physically Representa- tive Network Models of Transport in Porous Media,” AIChE J., 39, 387 (1993).
Christofferson, J., and M. R. Christofferson, “The Kinetics of Disso- lution of Calcium Sulphate Dihydrate in Water,” J . Crystal Growth, 35, 79 (1976).
Cussler, E. L., Diffusion: Mass Transfer in Fluid Systems, Cambridge Univ. Press. New York (1984).
Daccord, G., E. Touboul, and R. Lenormand, “Carbonate Acidizing: Toward a Quantitative Model of the Wormholing Phenomena,” SPE Production Eng., 63 (1989).
Fatt, I., “The Network Model of Porous Media. I, 11, 111,” Per. Trans. AIME, 207, 144 (1956).
Fredd, C. N., “The Influence of Transport and Reaction on Worm- hole Formation in Carbonate Porous Media: A Study of Alterna- tive Stimulation Fluids,” PhD Thesis, Univ. of Michigan, Ann Ar- bor (1998).
Fredd, C. N., and H. S. Fogler, “Alternative Stimulation Fluids and Their Impact on Carbonate Acidizing,” SPE J. , 13, 34 (1998a).
Fredd, C. N., and H. S. Fogler, “The Influence of Chelating Agents on the Kinetics of Calcite Dissolution,” J . Colloid Inter. Sci., 204, 187 (1998b).
Fredd, C. N., and H. S. Fogler, “The Kinetics of Calcite Dissolution in Acetic Acid Solutions,” Chem. Eng. Sci., in press (1998~).
Frick, T. P., B. Mostofizadeh, and M. J. Economides, “Analysis of Radial Core Experiments for Hydrochloric Acid Interaction with Limestones,” SPE 27402, SPE Int. Symp. on Formation Damage Control, Lafayette, LA (Feb. 7-10, 1994).
Grimes, J. H., “Chelating Agents in the Removal of Radioisotopes from Humans,” Diagnosis and Treatment of Incorporated Radionu- clides, Int. Atomic Energy Agency, Vienna, p. 419 (1976).
Hoefner, M. L., “Matrix Acidizing in Carbonates Using Microemul- sions: The Study of Flow, Dissolution, and Channeling in Porous Media,” PhD Thesis, Univ. of Michigan, Ann Arbor (1987).
Hoefner, M. L., and H. S. Fogler, “Pore Evolution and Channel For- mation During Flow and Reaction in Porous Media,” AIChE J., 34, 45 (1988).
Huang, T., A. D. Hill, and R. S. Schechter, “Reaction Rate and Fluid
Loss: The Keys to Wormhole Initiation and Propagation in Car- bonate Acidizing,” SPE 37312, Int. Symp. on Oilfield Chemistry, Houston (Feb. 18-21, 1997).
Jasti, J. K., and H. S. Fogler, “Application of Neutron Radiography to Image Flow Phenomena in Porous Media,” AIChE J . , 38, 481 (1992).
Jiang, R., and F. C. Anson, “Association of Electroactive Counter- ions with Polyelectrolytes. 4. Coordinate Binding of Ru (EDTA) to Poly (4-Vinylpyridine),” J . Phys. Chem., 96, 452 (1992).
Lindsay, J. T., J. Jasti, H. S. Fogler, and C. W. Kauffman, “Neutron Radiography Applications at the University of Michigan, Phoenix Memorial Laboratory,” Neutron Radiography (3), Proc. 3rd World Conf, J. P. Barton, ed., Gordon and Breach Science, Boston, p. 621 (1990).
Lund, K., H. S. Fogler, and C. C. McCune, “Acidization: I. The Dis- solution of Dolomite in Hydrochloric Acid,” Chem. Eng Sci., 28, 691 (1973).
Lund, K., H. S. Fogler, C. C. McCune, and J. W. Auk, “Acidization: 11. The Dissolution of Calcite in Hydrochloric Acid,” Chem. Eng. Sci., 30, 825 (1975).
Martell, A. E., and M. Calvin, Chemistly of Metal Chelate Com- pounds, Prentice-Hall, Englewood Cliffs, NJ (1956).
Moore, C. H., Carbonate Diagenesis and Porosity, Elsevier Science, New York (1989).
Mostofizadeh, B., and M. J. Economides, “Optimum Injection Rate from Radial Acidizing Experiments,” SPE 28547, SPE Technical Conf. and Exhib., New Orleans (Sept. 25-28, 1994).
Nierode, D. E., and B. B. Williams, “Characteristics of Acid Reac- tion in Limestone Forrnations,”SPE J. , 406 (1971).
Plummer, L. N., T. M. L. Wigley, and D. L. Parkhurst, “The Kinetics of Calcite Dissolution in C0,-Water Systems at 5” to 60°C and 0.0 to 1.0 atm CO,,” Amer. J . Sci., 278, 179 (1978).
Roberts, J., and L. Schwartz, “Grain Consolidation and Electrical Conductivity in Porous Media,” Phys. Reu. B , 31, 5990 (1985).
Sahimi, M., G. R. Gavalas, and T. T. Tsotsis, “Statistical and Contin- uum Models of Fluid-Solid Reactions in Porous Media,” Chem. Eng. Sci., 45, 1443 (1990).
Schechter, R. S., and J. L. Gidley, “The Change in Pore Size Distri- bution from Surface Reactions in Porous Media,” AIChE J., 15, 339 (1969).
Sjoberg, E. L., and D. T. Rickard, “Calcite Dissolution Kinetics: Sur- face Speciation and the Origin of the Variable pH Dependence,” Chem. Geol., 42, 119 (1984).
Thompson, K. E., and H. S. Fogler, “Modeling Flow in Disordered Packed Beds from Pore-Scale Fluid Mechanics,” AIChE J., 43, 1377 (1997).
Vitagliano, V., and P. A. Lyons, “Diffusion in Aqueous Acetic Acid Solutions,” J . Amer. Chem. Soc., 78, 4538 (1956).
Wang, Y., A. D. Hill, and R. S. Schechter, “The Optimum Injection Rate for Matrix Acidizing of Carbonate Formations,” SPE 26578, Technical Conf. and Exhib., Houston (Oct. 3-6, 1993).
Manuscript receiwd Jan. 15, 1998, and revision receiwd June 16, 1998