Influence Strategies for Systems of Systems Nirav Shah, MIT Aero-Astro, SEAri Prof. Joseph Sussman, MIT ESD, Civil and Env. Eng. Dr. Donna Rhodes, MIT ESD, SEAri Prof. Daniel Hastings, MIT ESD, Aero-Astro July 18, 2012
Transcript
Influence Strategies for Systems of Systems
Nirav Shah, MIT Aero-Astro, SEAri Prof. Joseph Sussman, MIT ESD, Civil and Env. Eng.
Dr. Donna Rhodes, MIT ESD, SEAri Prof. Daniel Hastings, MIT ESD, Aero-Astro
July 18, 2012
Agenda
• Background and Questions • A principal-agent framing of constituent
and SoSE decision making • Five basic influences • Case Study: Intermodal Transport • Conclusions and Research Opportunities
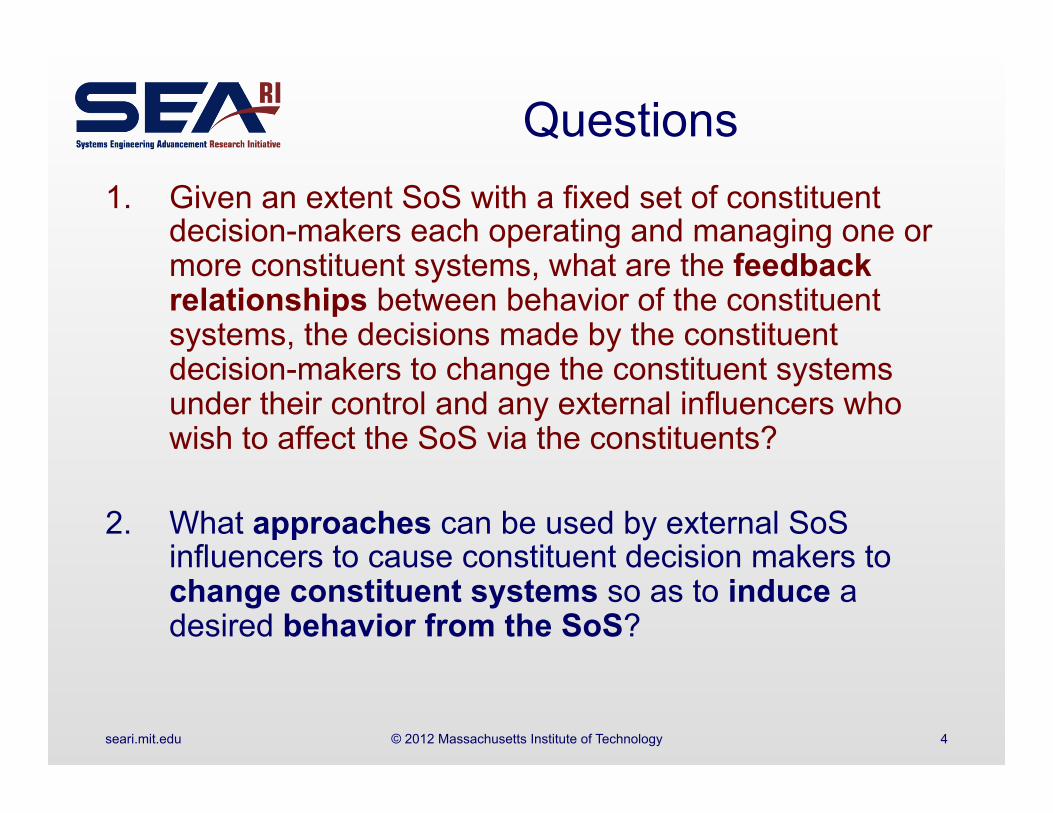
Questions 1. Given an extent SoS with a fixed set of constituent
decision-makers each operating and managing one or more constituent systems, what are the feedback relationships between behavior of the constituent systems, the decisions made by the constituent decision-makers to change the constituent systems under their control and any external influencers who wish to affect the SoS via the constituents?
2. What approaches can be used by external SoS influencers to cause constituent decision makers to change constituent systems so as to induce a desired behavior from the SoS?
Implementation/Operation Process Constituent Actions
Pos
t-fac
to F
eedb
ack
Obs
erva
tion
Constituent Interaction
Extended from Schneeweiss (2003) Distributed Decision Making
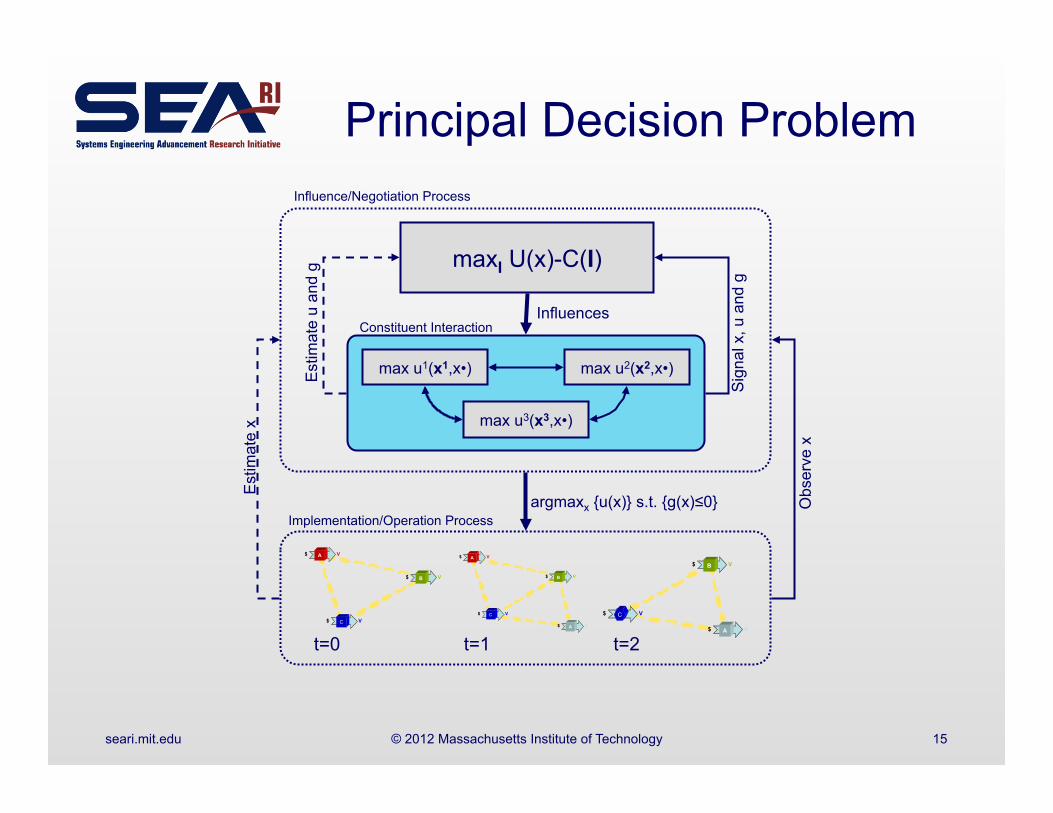
• Decisions in an SoS are distributed among a set of constituents and SoS influencer(s)
• Anticipation and reaction between these two result in the choices (actions) taken by the constituent that lead to changes in SoS structure and operation
• Anticipation is the feed-forward belief of the SoS stakeholder regarding the constituent response to a set a set of influences
• Reaction is the feed-back response of the constituents to those influences
• Anticipation and reaction form a negotiation process between these two groups that determines which constituent actions are implemented
Anticipation-Influence-Reaction Framework Social Interaction
Research Questions 1. Given an extent SoS with a fixed set of constituent
decision-makers each operating and managing one or more constituent systems, what are the feedback relationships between behavior of the constituent systems, the decisions made by the constituent decision-makers to change the constituent systems under their control and any external influencers who wish to affect the SoS via the constituents?
2. What approaches can be used by external SoS influencers to cause constituent decision makers to change constituent systems so as to induce a desired behavior from the SoS?
• Incentives – Provide easier access to map tools thereby increasing value to
website builders • Information
– Use API keys to track and make websites aware of usage level • Integration
– Off load certain functions such as smart caching onto Google so that usage works better with Google infrastructure
• Infrastructure – Provide API functions to standardize use of maps and thereby
introduce control points into the interaction with websites • Institutions
– Use the API terms of service to formalize the relationship between websites and Google to provide transparency in terms of QoS and responsibilities of each party to ensure mutual benefit
• Transportation system that involves multiple modes (i.e. rail + road)
• Key issue in supplying the hinterland regions that are not easily accessible from border/seaports
• Van Der Horst(2008), looking at the Netherlands, found a variety of coordination mechanism are in use to connect mode operators into intermodal chains
– Some arose endogenously from within the SoS, while others required an external party to support the effort
• Good example for SoS as the constituents are truly operationally and managerially independent companies whose participation is not assured
Challenge • Intermodal traffic is increasing due to
improvements in technology and shipper’s pressure for lower costs
– Better IT for coordination – More efficient container handling
• Shippers want more choices with truck-like service quality and rail-like cost
• Governments have an interest in increasing intermodal freight usage to reduce logistics cost and encourage economic growth
Van Der Horst, M. R. and De Langen, P. W. (2008). Coordination in hinterland transport chains: A major challenge for the seaport community. Maritime Econ Logistics, 10(1-2):108–129.
How can a government or similar actor influence mode operators to change
service offerings so as to increase the shipper traffic flow on underutilized
intermodal railroad links?
AIR in the case study
• Anticipation – Modeling the intermodal systems
• Influence – Assessing various influence strategies within
the model • Reaction
– Comparing the impact on different stakeholders of the influences
• Objective: Create a notional SoS representation of an intermodal transport network to examine intervention strategies that can influence constituent behavior
• Control Variables: Reorder Quantity (Q), Trigger Level (s), transport route
• Approach: 1. Observe services between desired O and D. 2. Minimize expected TLC for each routing 3. Allocate traffic to routing with smallest TLC 4. Should all traffic not fit on best solution, allocate remainder to
second best and so on. 5. Re-evaluate routing choice after a specified contract period
• Key Assumptions: – Use computed mean TLC for choosing routes – Require at least 0.5% change in TLC to shift from current route to
a new route – No inventory size constraint
• Example: – Shipping 10,000 units over 90 days worth $5000 / unit – Inventory and shortfall cost are 40% of the per unit value – Transport option is intermodal with mean travel time 0.8 +/- 0.13
days – Optimum reorder level: s=191 units – Optimum reorder quantity: Q=84 units – minimum mean TLC = $5.2 million
300 400 500 600 700 800 9005.7
5.8
5.9
6
6.1
6.2
6.3
6.4 x 10⁶ Re-order Quantity optimization
Re-order Quantity [TEUs]
Tota
l Log
istic
s Co
st [$
]
Monte Carlo TrialsAnalytically Computed Mean TLCS=100
Objective: Minimize Total Logistics Cost TLC(reorder quantity, trigger level) = Order Cost + Inventory Cost + In-transit Inventory Cost +
Objective: max profit = revenue - cost Control Variables: Price Approach:
1. Estimate each players future actions by exponentially forecasting (two period delay) from their past pricing decisions
2. Find new price using a heuristic that combines the carrier experienced cash flow, the pricing trend seen in the market and a four estimated profit/price pairs
Key assumptions – Independent owner/operator cost model – Carriers can source trucks/drivers as
needed don’t need to keep a fleet – Not capacity constrained – 75% duty cycle
Objective: max profit = revenue - cost Control Variables: Train Freq, Price Approach:
1. Estimate each players future actions by exponentially forecasting (two period delay) from their past pricing decisions
2. For various train freq (+/- 2 from current freq) compute new price using heuristic
• There are 50 shippers moving a total of 100,000 truckloads per quarter
• Half ship O1 to D1 and half O2 to D2 • Inventory costs uniformly distributed between 10% and 40% • Shipment value varies logarithmically from $2000 to $100000 • All other costs are constant across shippers
• Total revenue, cost and profit are shown in $B • Consider three stakeholder groups:
– Shippers: Lowest transport costs under co-op strategy – Truckers: Make more in tax case. Traffic moved to short haul routes where they had
greater price leverage. Really dislike coop option as it is in effect a wealth transfer to the railroads
– Railroad: Make more in co-op case. They have control over the common portion of co-op routes and can get a better share than they would having to sell ala carte service.
• Which is best? Is there a best?
Truck Revnue
Railroad Revenue
Truck Cost
Railroad Cost
Truck Profit
Railroad Profit
Uni-modal Truck %
Inter-modal %
2.454 0.937 2.119 0.991 0.335 -0.054Total 3.391 Total 3.111 Total 0.2812.463 0.945 2.105 1.000 0.358 -0.056Total 3.408 Total 3.106 Total 0.3022.446 0.948 2.100 1.007 0.346 -0.059Total 3.394 Total 3.107 Total 3.392.613 1.168 2.084 1.149 0.530 0.019Total 3.781 Total 3.232 Total 0.5491.780 1.291 1.576 1.264 0.264 0.026Total 3.071 Total 2.840 Total 0.291
Conclusions • Decision making in systems of systems
can be characterized as the interplay between a network of social interactions between constituents (and influencers) and a network of technical interfaces between systems that they operate and manage
• Influencers can use a variety of strategies to change the behavior of constituents including: incentives, information, integration, institutions and infrastructures
• Modeling can aid in understanding the interactions between decision strategies that are being employed by constituent and their responses to influences, however, it is unlikely to be fully predictive
• Successful implementation of influence strategies depends upon understanding the effect of strategies on all involved stakeholders
• What about constituent participation choice? Case study assumed fixed constituent population. What if constituents can enter/leave?
• Framework took the view that decision making is a value maximizing activity. What about stakeholders who are satisficing while minimizing risk? Potentially true for infrastructural elements in SoS.
• What about multiple influencers who are acting at the same (or different) time either competitively or cooperatively?
• Does this approach scale, or will constituents needed to be grouped into populations as larger SoS are considered? How does the principal/agent problem change as the number of agents and/or principals becomes large?