Influences of group Identity on Smoking, Alcohol, and Drug Use Kirsten Verkooijen, Ph.D. student Dep. of Health Promotion Research University of Southern Denmark Esbjerg Gert A. Nielsen, Ph.D. Dep. of Prevention and Documentation Danish Cancer Society Copenhagen
Transcript
Influences of group Identity on Smoking, Alcohol, and Drug Use
Kirsten Verkooijen, Ph.D. student
Dep. of Health Promotion Research
University of Southern Denmark
Esbjerg
Gert A. Nielsen, Ph.D.
Dep. of Prevention and Documentation
Danish Cancer Society
Copenhagen
AdolescenceIncreased engagement in risk behaviourIncreased affiliation with peers
Focus of this study:How is adolescents’ engagement in smoking, hash and alcohol use related to group membership?
Group membershipSubculture: a social group within a national culture that has distinctive patterns of behavior and beliefs (hyperdictionary)Related terms: peer group, crowd, youth culture, clique, etc.Function of peer groups (Urberg):
Source of identityChannel for friendship selection
The balanced Identity Design(Greenwald et al., 2002)
Reciprocal associations between the self, group and behaviour:1. Self - Group 2. Group - Behaviour 3. Behaviour - Self
People tend to keep the 3 associations balanced!
Greenwald, A.G., Banaji, M.R., Rudman, L.A., Farnham, S.D., Nosek, B.A., Mellott, D.S. (2002). A unified theory of implicit attitudes, stereotypes, self-esteem, and self-concept. Psychological Review, 109, 3-25.
Data collectionWhen: November 2002
What: MULD (Monitoring of Young people’s Lifestyle and Everyday life) survey conducted by The Danish Cancer Society and Danish Board of Health
Who: 3956 Danes in the age of 16-20 completed the posted questionnaire (response-rate 60%)
Self-report meassuresItems on smoking, alcohol and drug useGroup identity items: ’would you agree if a friend called you [...]?’Perceived group behaviour items: ’how likely is a member of [...] to smoke/use hash?’9 group names, based on prior discussions with the target population, were provided: sporty, pop boy/girl, hip-hopper/skater, bodybuilder, quiet boy/girl, techno freak, computer nerd, religious, hippie.
Answers were given on a 5-point scale
ResultsThe data analysis included only subjects with 1 single group affiliation (N=1444; 38,3% of the original sample)
sporty (n=608) pop (n=160) skate/hiphop (n=61) quiet (n=296) techno (n=45) religious (n=60) hippie (n=136) computer nerds (n=59)Bodybuilders (n=19) were left out as their sample was too small
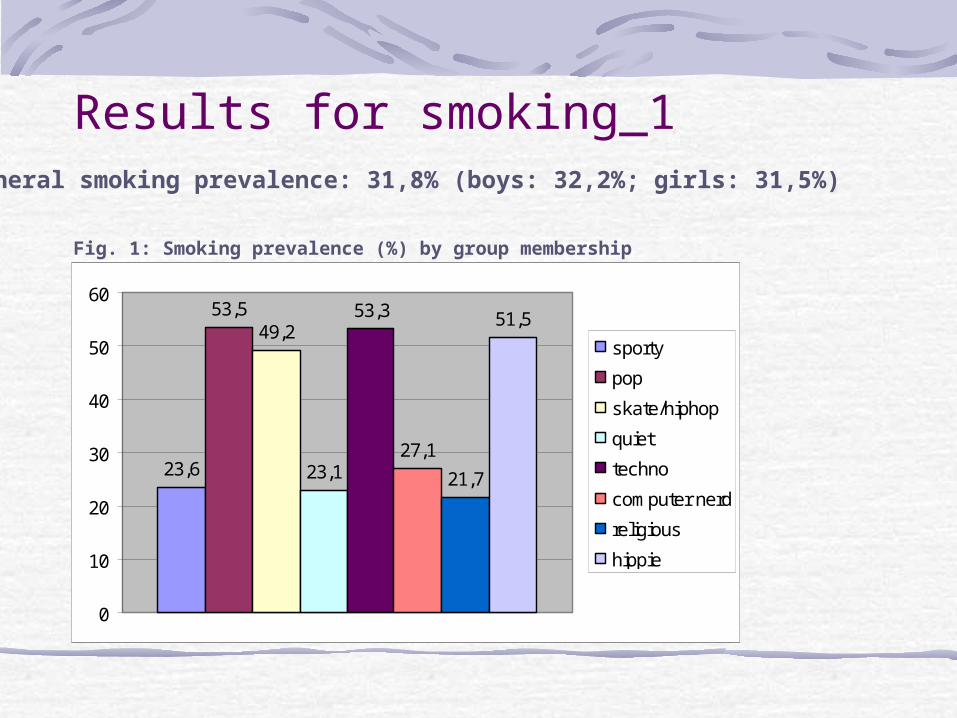
Results for smoking_1
23,6
53,549,2
53,3
27,1
21,7
51,5
23,1
0
10
20
30
40
50
60
sporty
pop
skate/hiphop
quiet
techno
computer nerd
religious
hippie
General smoking prevalence: 31,8% (boys: 32,2%; girls: 31,5%)
Fig. 1: Smoking prevalence (%) by group membership
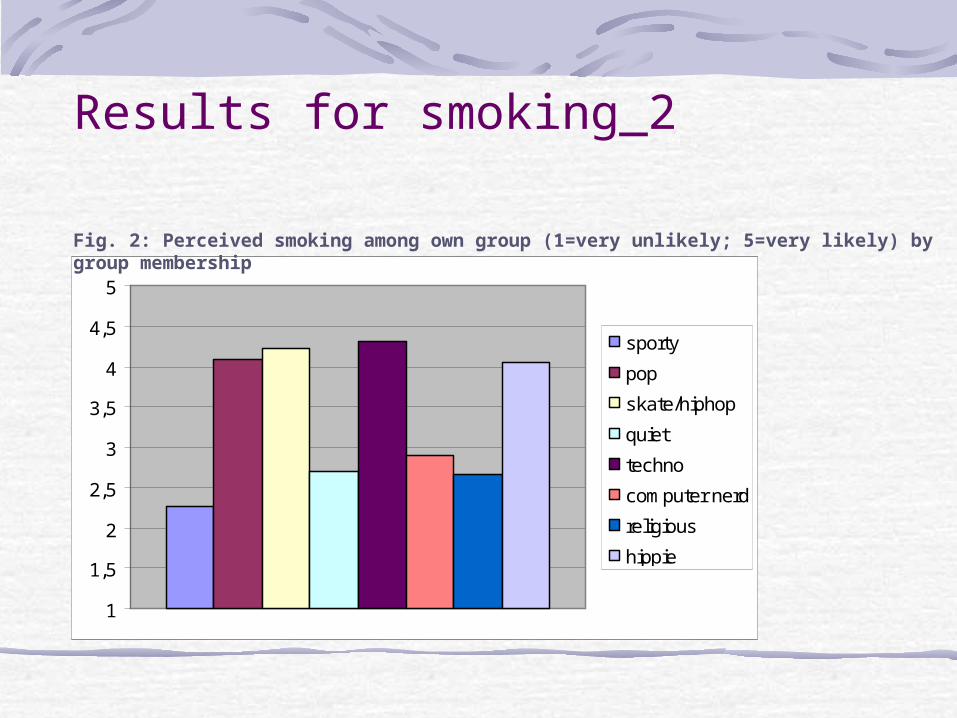
Results for smoking_2
1
1,5
2
2,5
3
3,5
4
4,5
5
sporty
pop
skate/hiphop
quiet
techno
computer nerd
religious
hippie
Fig. 2: Perceived smoking among own group (1=very unlikely; 5=very likely) by group membership
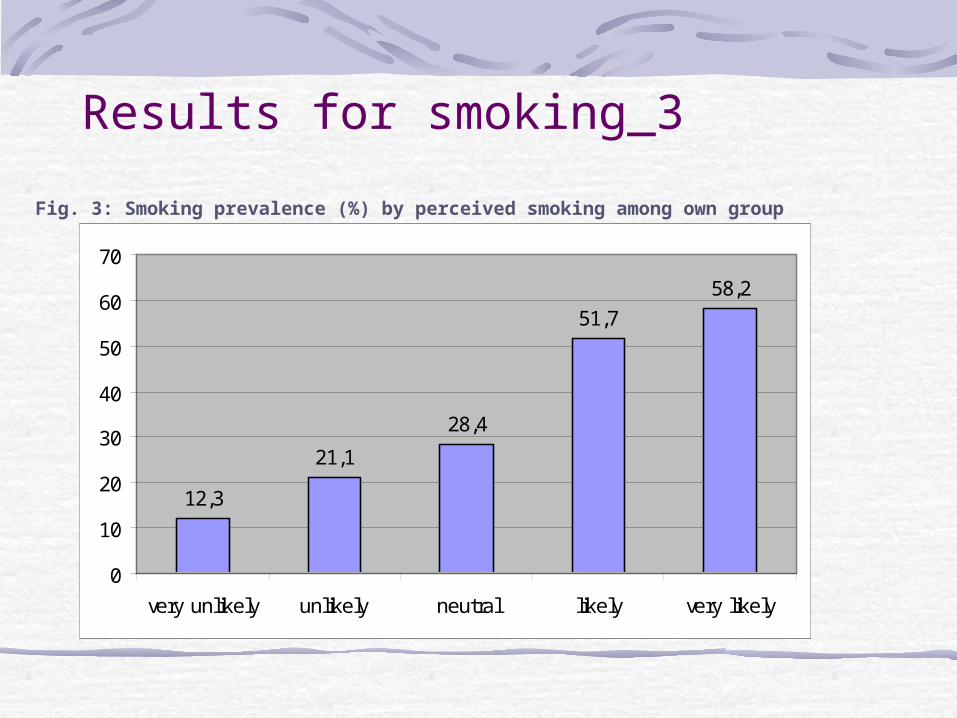
Results for smoking_3
12,3
21,1
28,4
51,7
58,2
0
10
20
30
40
50
60
70
very unlikely unlikely neutral likely very likely
Fig. 3: Smoking prevalence (%) by perceived smoking among own group
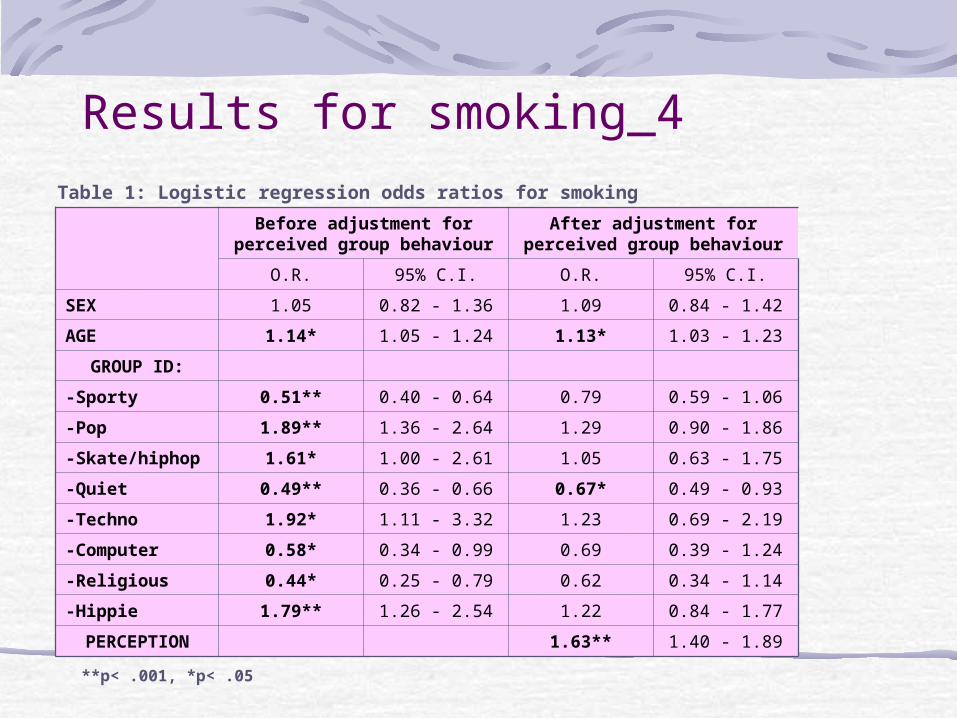
Results for smoking_4
Before adjustment for perceived group behaviour
After adjustment for perceived group behaviour
O.R. 95% C.I. O.R. 95% C.I.
SEX 1.05 0.82 - 1.36 1.09 0.84 - 1.42
AGE 1.14* 1.05 - 1.24 1.13* 1.03 - 1.23
GROUP ID:
-Sporty 0.51** 0.40 - 0.64 0.79 0.59 - 1.06
-Pop 1.89** 1.36 - 2.64 1.29 0.90 - 1.86
-Skate/hiphop 1.61* 1.00 - 2.61 1.05 0.63 - 1.75
-Quiet 0.49** 0.36 - 0.66 0.67* 0.49 - 0.93
-Techno 1.92* 1.11 - 3.32 1.23 0.69 - 2.19
-Computer 0.58* 0.34 - 0.99 0.69 0.39 - 1.24
-Religious 0.44* 0.25 - 0.79 0.62 0.34 - 1.14
-Hippie 1.79** 1.26 - 2.54 1.22 0.84 - 1.77
PERCEPTION 1.63** 1.40 - 1.89
Table 1: Logistic regression odds ratios for smoking
**p< .001, *p< .05
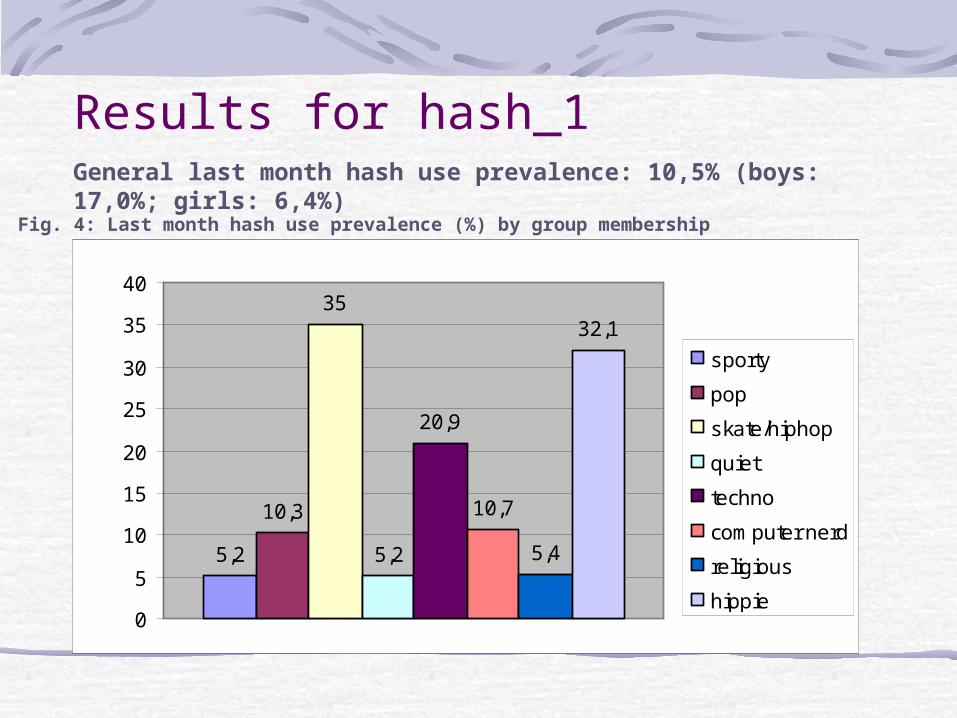
Results for hash_1
5,2
10,3
35
5,2
20,9
10,7
5,4
32,1
0
5
10
15
20
25
30
35
40
sporty
pop
skate/hiphop
quiet
techno
computer nerd
religious
hippie
Fig. 4: Last month hash use prevalence (%) by group membership
General last month hash use prevalence: 10,5% (boys: 17,0%; girls: 6,4%)
Results for hash_2
1
1,5
2
2,5
3
3,5
4
4,5
5
sporty
pop
skate/hiphop
quiet
techno
computer nerd
religious
hippie
Fig. 5: Perceived group hash use (1=very unlikely; 5= very likely) by group membership
Results for hash_3
1,4
5,9
10,9
15,1
37,3
0
5
10
15
20
25
30
35
40
very unlikely unlikely neutral likely very likely
Fig. 6: % hash users (last month) by perceived group hash use
Results for hash_4
Before adjustment for perceived group behaviour
After adjustment for perceived group behaviour
O.R. 95% C.I. O.R. 95% C.I.
SEX 3.60** 2.39 – 5.41 3.58** 2.35 – 5.45
AGE 1.17* 1.02 – 1.33 1.12 0.97 – 1.28
GROUP IDENTITY:
-Sporty 0.40** 0.26 – 0.60 0.66 0.41 – 1.06
-Pop 1.02 0.59 – 1.75 0.79 0.44 – 1.41
-Skate/hiphop 2.89** 1.66 – 5.02 1.30 0.69 – 2.45
-Quiet 0.44* 0.26 – 0.76 0.65 0.35 – 1.12
-Techno 1.77 0.86 – 3.63 1.30 0.61 – 2.78
-Computer 0.52 0.23 – 1.16 0.65 0.28 – 1.51
-Religious 0.41 0.14 – 1.19 0.82 0.28 – 2.51
-Hippie 4.85** 3.10 – 7.61 2.05* 1.18 – 3.57
PERCEPTION 1.73** 1.18 – 3.57
Table 2: Logistic regression odds ratios for hash use
**p< .001, *p< .05
Results for alcohol_1
71,275,2 78,3
54
71,165,5
39,7
85
0
10
20
30
40
50
60
70
80
90
100
sporty
pop
skate/hiphop
quiet
techno
computer nerd
religious
hippie
General last month drunkeness prevalence: 68,3% (boys: 74,8%; girls: 64,3%)
Fig. 7: % been drunk (last month) by group membership
Results for alcohol_2
O.R. 95% C.I.
SEX 1.76** 1.36 – 2.27
AGE 1.11* 1.02 – 1.20
GROUP IDENTITY:
-Sporty 1.13 0.88 – 1.46
-Pop 1.47* 1.00 – 2.16
-Skate/hiphop 1.38 0.77 – 2.46
-Quiet 0.55** 0.42 – 0.74
-Techno 1.08 0.59 – 1.99
-Computer 0.64 0.38 – 1.09
-Religious 0.29** 0.17 – 0.48
-Hippie 2.85** 1.78 – 4.56
Table 3: Logistic regression odds ratios for last month drunkenness
**p< .001, *p< .05
Summary resultsGroup membership related to all 3 risk behavioursResults showed 4 ’high-risk’ groups and 4 ’low-risk’ groups. This distinction was most evident for smoking and least evident for alcoholGroup perception related strongly to personal behaviour
Smoking
Hash Alcohol
Quiet
Sporty
Religious
Computer
Techno
Skate/hiphop
Pop
Hippie
Boys vs girls
Significant lower risk Significant higher risk
Discussion (1)Possible implications for health
promotion: tailored activities to specific identity groupsfocus on undesirable group perceptions
…however some essential questions are still unsolved…
Discussion (2)Unsolved questions:
What underlies the different groups, what is the deeper meaning of risk behaviour to each group?High-risk groups more outgoing/more in contact with peers?How stable are group memberships over time?What are the directions of the observed relationships?Can group perceptions be manipulated?
Conclusion... more research is needed
especially a longitudinal study may provide useful information..