Learn How to Create and Use Data Visualization Fordham Faculty Technology Center www.fordham.edu/ftc Kristen Treglia Senior Instructional Technologist creative commons licensed (BY-NC) flickr photo by caruba
Transcript
Learn How to Create and Use
Data Visualization
Fordham Faculty Technology Center www.fordham.edu/ftc
Kristen Treglia Senior Instructional Technologist
creative commons licensed (BY-NC) flickr photo by caruba
@kris10_
Kristen TregliaPassionate Educator and Technologist
kristentreglia.wordpress.com
EdTechBible.com
What was your favorite part about today’s workshop?
To: 37607
TECH4TEACHING+
message
Goals, Introduction, & Context Data Story Design Pulling it all together Creating Infographics Additional Resources
Agenda
Goals
Understand what makes a successfuland engaging infographic
Goals
Know where to find infographics
Goals
Plan and create your own infographic
Goals
High School Community College University
Study Abroad Grad Classes
Education
Budget“ by rbbaird
under creative comm
ons license BY
-NC
Math Teacher
10years
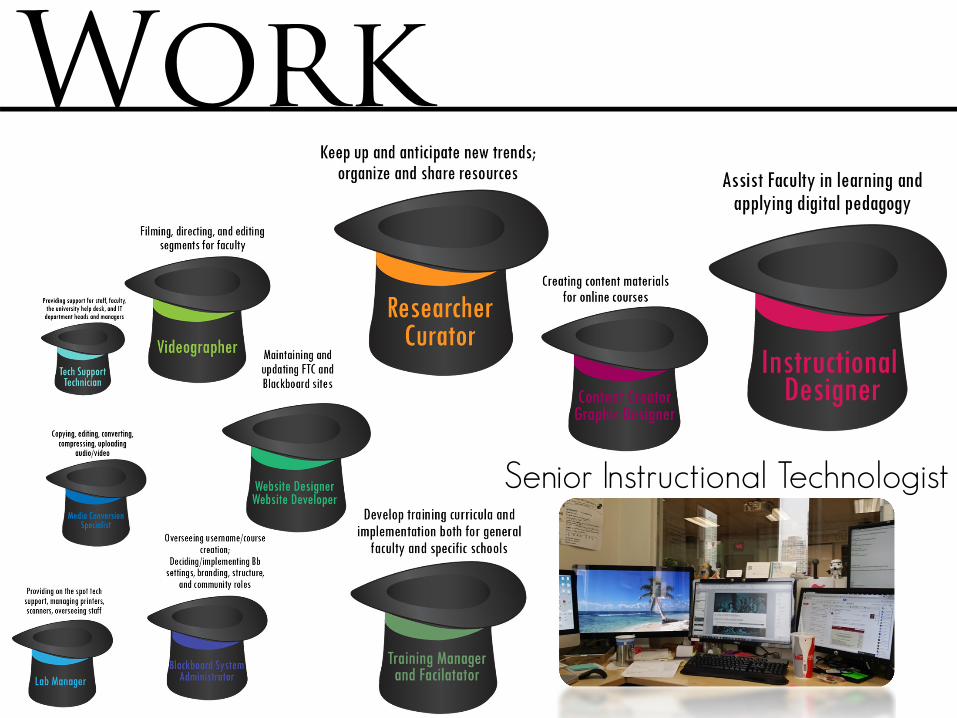
Work
Senior Instructional Technologist
6 years
Work
Senior Instructional Technologist
Work
Work
A little context first
4 Information Ages
4 Information Ages
4 Information Ages
4 Information Ages
It’s the Wild, Wild West
of a new information age
4000 1000 0 2000
Internet 1992
What makes a “good” infographic?
Data
Design
Story
flickr photo by srqpixshared under a Creative Commons (BY) license
Collect
Google drive icon by Froyounder a cc attribution 4.0 license
Analyze
don’t forget the
Citations!
flickr photo by B Rosenunder a Creative Commons (BY-ND) license
flickr photo by Dave Dugdale shared under a Creative Commons (BY-SA) license
flickr photos by ALI MAC55, Curtis Gregory Perry, and Peter Kaminski;
all photos shared under a Creative Commons license
Hook
flickr photos by ALI MAC55, Curtis Gregory Perry, and Peter Kaminski;
all photos shared under a Creative Commons license
The Problem
Hook
flickr photos by ALI MAC55, Curtis Gregory Perry, and Peter Kaminski;
all photos shared under a Creative Commons license
The Problem
Data
Hook
flickr photos by ALI MAC55, Curtis Gregory Perry, and Peter Kaminski;
all photos shared under a Creative Commons license
The Problem
Data
Hook
flickr photo by amesisshared under a Creative Commons (BY-NC-ND) license
flickr photo by Kalexandersonshared under a Creative Commons (BY-NC-ND) license
Putting it all
Which Infographic Type
Should You Choose?
Infographic designed by NEO MAMMALIAN STUDIES
Which Infographic Type Should You Choose?
Infographic designed by NEO MAMMALIAN STUDIES
Which Infographic Type Should You Choose?
Infographic designed by NEO MAMMALIAN STUDIES
Which Infographic Type Should You Choose?
Infographic designed by NEO MAMMALIAN STUDIES
Which Infographic Type Should You Choose?
Infographic designed by NEO MAMMALIAN STUDIES
Which Infographic Type Should You Choose?
Infographic designed by NEO MAMMALIAN STUDIES
Which Infographic Type Should You Choose?
Infographic designed by NEO MAMMALIAN STUDIES
Which Infographic Type Should You Choose?
Infographic designed by NEO MAMMALIAN STUDIES
Which Infographic Type Should You Choose?
Infographic designed by NEO MAMMALIAN STUDIES
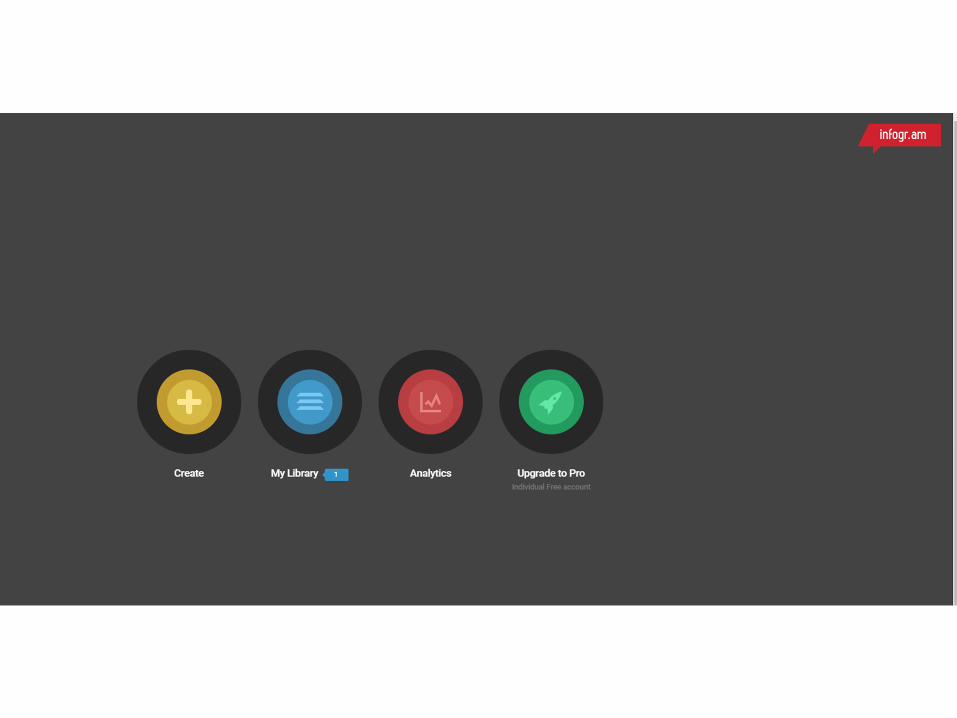
Infographics!flickr photo by shutrbugr
shared under a Creative Commons (BY-NC-SA) license
Let’s create some
Use PowerPoint
to create an
Infographic
Step Five Design by adding charts, graphs & images
Step Six Export by choosing to “Save As” an imagefile, or “Print” to PDF
Infographic by Ayman Sadiq via Slideshare
Look at Infographics for Ideas!
flickr photo by ogginshared under a Creative Commons (BY-NC) license
What was your favorite part about today’s workshop?