1 Information Efficiency of the U.S. Credit Default Swap Market: Evidence from Earnings Surprises Abstract The Credit Default Swap (CDS) market attracted much debate during the 2008 financial crisis. Opponents of CDS argue that CDS could lead to financial instability as it allows speculators to bet against companies and make the crisis worse. Proponents of CDS believe that CDS could increase market competition and benefit hedging activities. Moreover, an efficient CDS market can serve as a barometer to regulators and investors regarding the credit health of the underlying reference entity. We investigate information efficiency of the U.S. CDS market using evidence from earnings surprises. Our findings confirm that negative earnings surprises are well anticipated in the CDS market in the month prior to the announcement, with both economically and statistically stronger reactions for speculative-grade firms than for investment- grade firms. On the announcement day, for both positive and negative earnings surprises, the CDS spread for speculative-grade firms presents abnormal changes. Moreover, there is no post- earnings announcement drift in the CDS market, which is in direct contrast to the well- documented post-earnings drift in the stock market. Our evidence supports the efficiency of the CDS market.
Transcript
1
Information Efficiency of the U.S. Credit Default Swap Market:
Evidence from Earnings Surprises
Abstract
The Credit Default Swap (CDS) market attracted much debate during the 2008 financial
crisis. Opponents of CDS argue that CDS could lead to financial instability as it allows
speculators to bet against companies and make the crisis worse. Proponents of CDS believe that
CDS could increase market competition and benefit hedging activities. Moreover, an efficient
CDS market can serve as a barometer to regulators and investors regarding the credit health of
the underlying reference entity. We investigate information efficiency of the U.S. CDS market
using evidence from earnings surprises. Our findings confirm that negative earnings surprises are
well anticipated in the CDS market in the month prior to the announcement, with both
economically and statistically stronger reactions for speculative-grade firms than for investment-
grade firms. On the announcement day, for both positive and negative earnings surprises, the
CDS spread for speculative-grade firms presents abnormal changes. Moreover, there is no post-
earnings announcement drift in the CDS market, which is in direct contrast to the well-
documented post-earnings drift in the stock market. Our evidence supports the efficiency of the
CDS market.
2
1. INTRODUCTION
A credit default swap (CDS) is a credit derivative contract where the buyer makes
periodic payments (CDS spread) in exchange for protection against default or other credit events
of the underlying corporate or sovereign entity specified in the contract. The CDS market started
to grow in the late 1990s, more than doubled in size each year, and, by the end of 2007, the CDS
market had a notional value of $62.2 trillion (ISDA, 2010). However, the CDS market attracted
considerable concern from regulators after the collapse of several large financial institutions
during the 2008 financial crisis.
Opponents of CDS argue that CDS could lead to financial instability as it allows
speculators to bet against companies or countries and may make the crisis worse.1 For example,
CDS was blamed as a cause of Bear Stearns’ collapse as the surge in its CDS spread indicated
the weakness of the bank thereby restricting its access to the wholesale capital market, leading to
its forced sale to JP Morgan in March 2008. The rescue of Fannie Mae and Freddie Mac in
September 2008 and the bankruptcy of Lehman Brothers triggered billions of dollars of payables
to the buyers of the CDS protection, leading to huge losses by insurance companies who sold
CDS contracts on these financial institutions. In particular, the insurance giant, American
International Group (AIG), had been excessively selling CDS protection, exposing itself to
potential losses over $100 billion. The federal bailout of AIG made regulators concerned about
the role of CDS in financial stability. They began to consider ways to reduce the risk involved in
CDS transactions.
Alternatively, proponents of CDS believe that CDS could increase market competition
and benefit hedging activities, while helping banks to reduce the concentration of credit risk. For
1 For example, see George Soros (March 24, 2009), "Opinion: One Way to Stop Bear Raids," Wall Street Journal, and Stevenson Jacobs, (March 10, 2010), "Greek Debt Crisis Is At The Center Of The Credit Default Swap Debate," Huffington Post.
3
example, during the 2000-2001 market crash, U.S. banks suffered limited damage from the burst
of the dotcom bubble and telecommunication bubble since credit risk was diversified to the
insurance industry in Europe and America.2 The CDS contract per se should not be blamed for
the financial crisis. The major problem for large financial institutions was that they
underestimated the risk exposure of operating in the CDS market where illiquidity, counterparty
risk, and systemic risks could be substantial. For example, AIG underestimated the default
probabilities of the reference entities that it sold extensively to collect CDS premiums. In
addition, the minimum Basel capital ratio was not required for banks operating in the credit
derivatives market due to its off balance nature. Greater regulation should increase capitalization
requirements and market transparency in order to reduce potential risk of the credit derivatives
market.3
Moreover, proponents of CDS hold that an efficient CDS market can serve as a
barometer to regulators and investors regarding the credit health of a company.4 In the case of
Bear Stearns, the widening of their CDS spread was a symptom rather than a cause of its collapse
as investors sought to hedge their exposure to the bank or speculate on its collapse.
2 Wagner and Marsh (2006) find that the incentive of banks to transfer credit risk is aligned with the regulatory objective of improving financial stability. As such, the development of credit derivative instruments should be welcomed. They also find the transfer of credit risk from banks to non-banks to be more beneficial than credit risk transfer within the banking sector. 3 See "E.U. Derivatives Ban Won’t Work, U.S. Says," New York Times. March 17, 2010. Duca et al. (2010) argue that lessons from the crisis include recognizing the importance of financial innovation and improving regulation. Cukierman (2011) suggests that one of the major problems leading to the current financial crisis is the growth of a poorly regulated shadow financial system. The Dodd-Frank Act that was passed in 2010 pointed out two problems encountered in the 2007-2009 crises with the credit derivative market. The first is that the regulatory capital requirements for banks did not reflect the risk exposure of operating in the credit derivatives. Another problem was the opacity of exposure in OTC derivatives. It was proposed that credit derivative should be traded in centralized trading platforms where margin and transparency requirements would be imposed by the platforms (Krainer, 2011). 4 Litan, Robert E. (April 7, 2010), "The Derivatives Dealers’ Club and Derivatives Markets Reform: A Guide for Policy Makers, Citizens and Other Interested Parties," (PDF) Brookings Institution.
4
Indeed, anecdotal evidence suggests that the CDS demonstrates dramatic spread
widening in anticipation of adverse credit events in the years prior to the 2008 financial crisis.5
The changing CDS spread reflects the dynamic risk profile of the underlying entity and its debt
instrument. Existing studies find that CDS spread plays a leading role in responding to changes
in credit conditions, such as future rating events (Hull et al., 2004; Norden and Weber, 2004), and
adverse credit events such as M&A, SEC probe or accounting irregularities, and leverage buyouts
(Zhang, 2009). The leading role of the CDS market may be due to the absence of funding and
short-sale restrictions in the derivatives market and large institutional investors with privileged
information (Acharya and Johnson, 2007).
In this paper, we provide further evidence regarding the information efficiency of the U.S.
CDS market around earnings news. An earnings announcement is the most fundamental news
regarding a firm’s value. We conduct a systematic study on whether the U.S. CDS market could
incorporate earnings announcements in a timely fashion. Specifically, does the CDS market
anticipate subsequent earnings surprises? Does the market response vary across firms with
different credit risks and vary across positive and negative earnings? Is there post-earnings drift
in the credit market, as in the equity market?
First, should earnings news be incorporated in CDS prices? If so, what type of earnings
news elicits stronger market reactions? What type of firm is more likely to be affected?
Analogous to bond yield spread, CDS spread is a function of the debt-to-firm value ratio, or
leverage, term to maturity and volatility. An unexpected change in earnings will result in an
unexpected change in future cash flow and, as such, the firm value, leading to a change in the
5 For example, the CDS price for First Data mysteriously rose by 62% in two weeks just before its board announced that the firm was acquired by KKR on April 2, 2007 (Scheer, 2007). The Wall Street Journal (WSJ) article (October 4, 2006), “Trading in Harrah’s Contracts Surges Before LBO Disclosure,” reported that CDS spreads of Harrah experienced a dramatic spike two days prior to the announcement, whereas the stock market was much slower to respond.
5
leverage ratio. Therefore, we would expect the CDS spread to increase in the case of negative
earnings surprises and to decrease for positive earnings news. Given limited upside potential, but
substantial downside risk for bondholders, negative earnings surprises should have a stronger
effect on the CDS spread than positive ones. Moreover, simulation results from Merton (1974)
indicate that there is a convex relation between risk premium and leverage ratio.6. Given a
monotonic correlation between leverage and credit ratings (Standard and Poor’s, 2003), we
expect that speculative-grade firms are more severely affected by earnings surprises than
investment-grade firms.
Additionally, can the CDS market anticipate earnings surprises? The CDS market is an
unregulated OTC market for institutional investors and dominated by large banks, insurance
companies, and hedge funds. They usually have information advantages due to greater research
resources or simply by possessing insider information. Given informed market participants,
embedded leverage, and its market opacity, the CDS market may be a preferred channel for
informed trading. Since banks and other sophisticated investors may have information
advantages with respect to earnings numbers, CDS spreads may respond ahead of actual earnings
announcements, particularly in the case of negative earnings surprises and for speculative-grade
firms.
Moreover, if the CDS market is efficient, we should not observe post-earnings drift. It
has been well documented that stock market reactions drift post earnings announcement (Ball
and Brown, 1968). One explanation is that this is largely driven by noisy trading by uninformed
investors. Different from the stock market where there are both informed and uninformed
6 As demonstrated in Table 1 and Figure 1 in Merton (1974), on the far right end, when debt-to-firm-value ratio d rises to an extremely high level, the curve turns concave. However, it is likely the case when firms go bankrupt and, as such, not empirically observable.
6
investors, the CDS market is dominated by informed investors who may interpret information
more accurately. Thus, post-earnings drift is less likely to exist in the CDS market.
Using a sample of 6,236 earnings surprises observations on 633 firms from the IBES
database. We find an asymmetric impact of earnings surprises on CDS spreads. Specifically,
there is a significant impact on CDS spreads in the [-1, 1] event window for speculative-grade
firms, but not for investment-grade firms. For speculative-grade firms, CDS spreads increase by
2.5 basis points (bp) for negative earnings surprises and decline by 2.6bp for positive surprises
around earnings announcements. The results suggest that the credit market views earnings
surprises as an important element in the pricing of speculative-grade firms, which are closer to
the default boundary, but not for investment-grade firms.
Additionally, we find that the CDS market only anticipates one type of earnings surprises,
the negative ones. Specifically, negative earnings surprises are associated with a dramatic 10.5bp
widening of the CDS spread in the one-month window of (-30,-2) leading up to the
announcement day, but no significant CDS spread change is detected for positive earnings
surprises before the earnings announcement. The pre-event asymmetric response is consistent
with the finding in Acharya and Johnson (2007) that information leakage (likely due to insider
trading) in the CDS market happens to negative credit news only.
More importantly, we find there is no post-earnings announcement drift for the full
sample in the CDS market, supporting the efficiency of the CDS market. This is in direct contrast
to the well documented post-announcement drift in the stock market. We attribute this finding to
the fact that the players in this market are sophisticated financial institutions with an information
advantage.
7
Furthermore, we examine how CDS spreads are related to earnings surprises after
controlling for market, firm, and security-specific characteristics in a multivariate regression. We
find that for each percentage increase in positive earnings surprise, the CDS spread for
speculative-grade firms will decrease by 2.9bp during the [-1,1] window.
This research contributes to several streams of literature. First, this study provides
evidence of information efficiency of the CDS market around the earnings announcement.
Therefore, we support the view that the CDS market is an efficient indicator of a company’s
creditworthiness.7 Additionally, it extends the earnings surprise literature (Datta and Dhillion,
1993) in a new credit derivatives market setting, and demonstrates asymmetric effects for
investment-grade firms and speculative-grade firms. Moreover, our analysis indicates the
importance of incorporating a firm’s fundamental information into the pricing of speculative-
grade CDS. Prior studies regarding the pricing of CDS (Hull and White, 2000; Chen and
Sopranzetti, 2002) largely ignore the effects of accounting information.
The remainder of the paper is organized as follows. Section 2 introduces the CDS market.
Section 3 reviews the literature and develops hypotheses. Section 4 presents the data, method,
and the results, while Section 5 provides our conclusions.
2. BACKGROUND INFORMATION ON CREDIT DEFAULT SWAP
Credit default swap (CDS) is an important innovation in the credit derivative market and
is used to manage credit risk. The underlying security of a CDS contract can be a corporate bond
or a sovereign or municipal bond. The buyer of a CDS contract makes annual payments to the
seller and is compensated in full when there is a default or another credit event. This annual
7 As pointed out by Cao et al. (2010, 2011) and Berndt and Ostrovnaya (2008), the information content of an equity option could also be a timely signal of firm volatility and credit risk to sophisticated institutional investors.
8
payment, quoted in basis points on an annual basis with a notional contract value of $10 million,
is called the CDS spread. For example, the five-year CDS spread for Countrywide Financial
Corporation on August 16, 2007, is 571 basis points. This indicates that the CDS buyer will pay
$571,000 every year over the next five years to the seller in order to enjoy protection on his or
her Countrywide bonds with a $10 million face value. Essentially, the CDS market allows the
seller to provide an insurance policy to the buyer and helps to diversify credit risk among
different financial institutions.
The credit derivatives market has experienced a phenomenal growth since 1996. By the
end of 1996, the CDS market size was only around $40 billion in nominal value. However, by
the end of 2007, the nominal value of all outstanding CDS contracts had reached $62.2 trillion.
According to a news report in Bloomberg, credit default swaps had become the “dominant
instrument” in the global derivatives market (about 12% of the notional amount of all
derivatives) and accounted for 88% of the total credit derivatives by the end of 2007.8 After the
financial crisis in 2008, the outstanding CDS notional amount shrank to $31.22 trillion as of
mid-2009 due to market consolidation (ISDA, 2010). The most active participants in the credit
derivatives market include banks, insurance companies, pension funds, hedge funds, and other
asset managers. According to Fitch Ratings (2006), banks and broker-dealers accounted for the
vast majority of the outstanding credit derivative protection. Protection buying is dominated by
large sophisticated banks to manage exposure concentrations and transfer credit risk. Insurance
firms and financial guarantors are major contract writers in this market. Fitch (2006) estimates
hedge funds account for up to 30% of the credit derivative trading volume.
Our CDS data are obtained from the Markit Group Ltd., whose comprehensive database
8 “Global Derivatives Market Expands to $516 Trillion” by Kabir Chibber. Bloomberg LLP (November 22, 2007).
9
covers over 1,000 American publicly traded corporations.9 CDS contracts have different
maturities, ranging from three months to 30 years with the most liquid five-year contract
accounting for 85% of the CDS market. We use five-year CDS spreads to isolate the maturity
issue and minimize liquidity noise. To maintain uniformity in contracts, we only keep CDS
quotations for senior unsecured debt with a modified restructuring (MR) clause, denominated in
U.S. dollars.10
Prior studies indicate that the CDS market leads the bond market in incorporating the
default risk of underlying credit. Blanco et al. (2005) and Zhu (2006) provide empirical
evidence that the CDS market leads the bond market in terms of price discovery. CDS spread is
a good measure of credit spread, free from the liquidity, taxation, and risk free rate mismatch
problems in empirical bond data (Hull et al. 2004), while bond prices may include liquidity
components since bonds are not as actively traded as CDS contracts due to short-selling
restrictions and the nature of market participants.11
In addition, existing studies demonstrate that the CDS market is complementary to the
stock market as it provides incremental information beyond the stock price. Acharya and
Johnson (2007) examine the information content of CDSs by using the stock market as a
benchmark for public information. They find that due to insider information owned by informed
banks about the credit conditions of the underlying entity, there is information flow from the
CDS market to the equity market, especially for negative news. Fung et al. (2008) study the
relationship between the stock and CDS markets and find that there is valuable information
9 This dataset has been widely used in finance studies of the CDS market, most prominently by Zhu (2006), Cao et al. (2010), Jorion and Zhang (2007, 2009), and Kapadia and Pu (2010). 10 The Modified Restructuring clause was introduced in the ISDA standard contract in 2001. This limits the scope of opportunistic behavior by sellers in the event of a restructuring agreement to deliverable obligations with a maturity of 30 months or less. This clause applies to the majority of quoted CDS for North American entities. 11 Chen et al. (2006) find that the cross-section of yield spreads is strongly related to liquidity indicators such as bond bid-ask spreads.
10
content in the CDS spreads that can benefit stock market participants. Kapadia and Pu (2010)
report that there are common pricing discrepancies across firms’ equity and CDS prices arising
from impediments to arbitrage.
Our paper is closely related to the strand of literature that examines the information
efficiency of the CDS market. Hull et al. (2004) find that CDS levels and spread changes
anticipate negative rating events. Norden and Weber (2004) confirm that CDS and stock
markets anticipate the rating downgrades, but the CDS market reacts earlier than the stock
market in the case of reviews for downgrades. Zhang (2009) investigates CDS price reactions to
a variety of credit events including news of economic distress, financial distress, M&A, SEC
probes or accounting irregularities, and leverage buyouts (LBO). The CDS spread indicates a
large spike of 37%-96% depending upon the event type on a single day and stays fairly flat the
month after, supporting the efficiency of the CDS market. We attempt to examine the efficiency
of the CDS market based on earnings surprise, the most fundamental news regarding a firm’s
value.
3. LITERATURE ON EARNINGS SURPRISES AND HYPOTHESES DEVELOPMENT
3.1. Literature on Earnings Announcements
Prior studies have explored stock market reactions to earnings announcements. Studies,
such as Ball and Brown (1968), Brown (1978), and Aharony and Swary (1980), demonstrate that
the stock market does anticipate most of the reported earnings. It is the earnings surprises that
provide new information and move stock prices around announcements. Bartov et al. (2002) find
that around the earnings announcement window, firms with positive earnings surprises
experience a higher stock return than firms with negative earnings surprises. However, research
11
regarding the impact of earnings surprises on the cost of debt is limited. One notable exception is
Datta and Dhillion (1993). They investigate bond price reactions to unexpected quarterly
earnings announcements demonstrating that bond prices react positively to large positive
earnings surprises and negatively to large negative earnings surprises.
Our investigation is related to that of Datta and Dhillion (1993) that examined bond price
reactions to earnings surprises, but differs in several ways. First, the use of continuous the daily
CDS spread enables us to do a cleaner event study and effectively control confounding events.
We can do a short-event window test and effectively control confounding events such as rating
changes, capital structure changes, and new bond offerings. All CDS quotes in our study are
uniformly based on a five-year contract term. Thus, our study controls the impact of maturity by
design. From the discussion in the previous section, the use of CDS spread has several
advantages over bond spread.
Additionally, they explore bond price reactions to large earnings surprises only
restricting their study to a small sample of 250 earnings announcements for 135 firms. This is
due to inactive trading in the corporate bond market and the exclusion of small earnings surprises.
They explore the bond price reactions to large earnings surprises only, while we use all earnings
surprises regardless of size. Our sample includes 6,236 firm-quarter earnings surprises from 633
firms. Also, the corporate CDS market has a wider range of names, enabling us to conduct a
thorough study conditional on the credit quality of firms and the nature and magnitude of
earnings surprises. Instead of eliminating all small earnings surprises, we investigate the impact
of the magnitude of earnings surprise based on the full sample within a multivariate regression
framework with additional control of market volatility, firm leverage, and macroeconomic
factors.
12
Most importantly, their study only examines bond reaction for the earnings
announcement day, but our study focuses on the efficiency of the CDS market by examining pre-,
at-, and post- announcement periods.
3.2. Hypothesis Development
Our first hypothesis concerns CDS spread reactions around earnings announcements.
Several papers have explored the determinants of CDS spreads, but the role of earnings is absent
in these studies. Though unexpected earnings surprise is not a factor in the structural model,
unexpected earnings drive the market value of equity resulting in unexpected leverage shifts,
which impact bond prices. Therefore, we expect that the CDS spread will decrease in reaction to
positive earnings surprises, but rise in reaction to negative earnings surprises around earnings
announcements.
Since bondholders will receive the larger of the face value of the bond and the firm’s
value, there is limited upward potential for bondholders when unexpected good earnings news
hits the market. In addition, these unexpected good earnings should benefit firms closer to the
default boundary, which are usually speculative-grade firms (since leverage ratio and credit
rating are highly correlated, see Jorion et al., 2007 and Kaplan and Urwitz, 1979) more so than
investment-grade firms.12 If there is actually negative unexpected earnings news, downside risk
will increase. This effect should be more pronounced for firms closer to the default boundary.
This leads to our first hypothesis:
12 Such intuition is consistent with the convex relation between credit spread (R – r) and leverage d from Merton’s (1974) simulation when maturity and asset volatility are held constant. We can use the leverage as a proxy for credit rating given their high correlation.
13
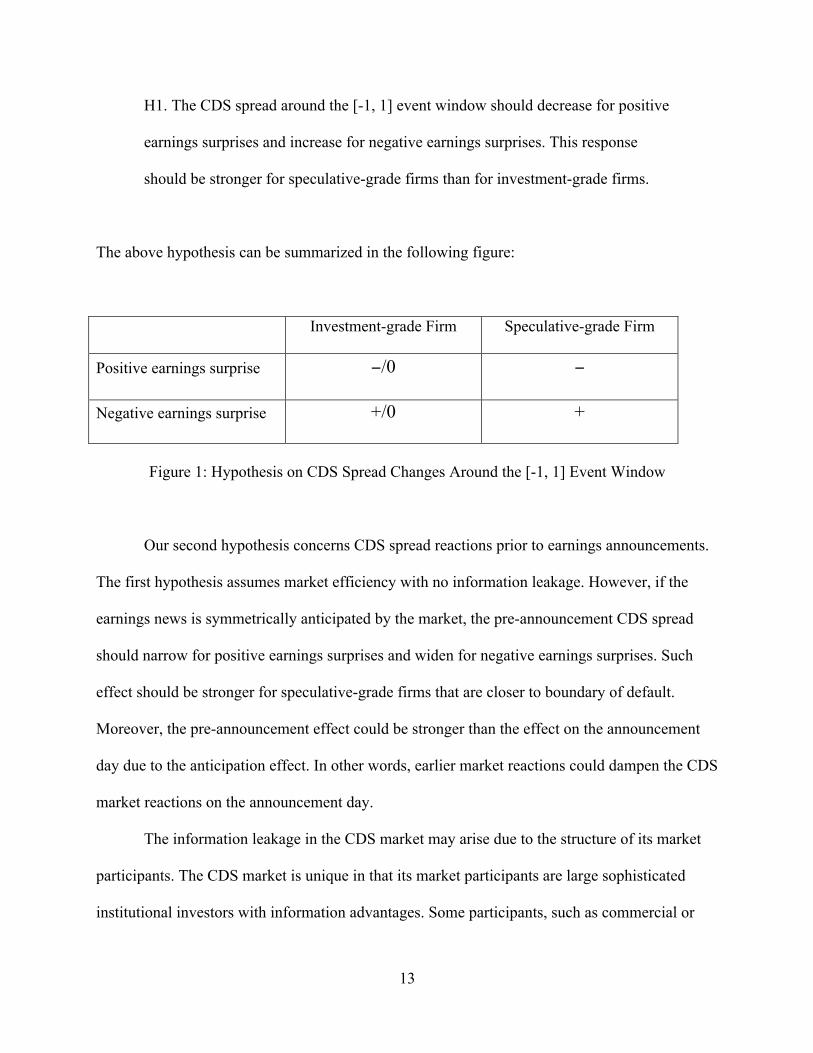
H1. The CDS spread around the [-1, 1] event window should decrease for positive
earnings surprises and increase for negative earnings surprises. This response
should be stronger for speculative-grade firms than for investment-grade firms.
The above hypothesis can be summarized in the following figure:
Investment-grade Firm Speculative-grade Firm
Positive earnings surprise −/0 −
Negative earnings surprise +/0 +
Figure 1: Hypothesis on CDS Spread Changes Around the [-1, 1] Event Window
Our second hypothesis concerns CDS spread reactions prior to earnings announcements.
The first hypothesis assumes market efficiency with no information leakage. However, if the
earnings news is symmetrically anticipated by the market, the pre-announcement CDS spread
should narrow for positive earnings surprises and widen for negative earnings surprises. Such
effect should be stronger for speculative-grade firms that are closer to boundary of default.
Moreover, the pre-announcement effect could be stronger than the effect on the announcement
day due to the anticipation effect. In other words, earlier market reactions could dampen the CDS
market reactions on the announcement day.
The information leakage in the CDS market may arise due to the structure of its market
participants. The CDS market is unique in that its market participants are large sophisticated
institutional investors with information advantages. Some participants, such as commercial or
14
investment banks, use CDS to transfer their corporate loan risk and, at the same time, have
constant access to inside information due to their lending or advising relationships. While there
are clear reporting requirements for corporate insider trading in the equity market, such
requirements are lacking for CDS trading. The CDS market is largely an unregulated over-the-
counter market on a global scale and information about the identities of trading parties is hard to
collect. According to Credit Derivative Research, for 57 buy-out transactions in 2006, their CDS
spreads experienced unusual upward shifts before the announcements of these deals. One case in
point is First Data, whose CDS spread experienced a 250% increase from December 1, 2006
(when KKR started secret talks with First Data) to March 23, 2007 (when the deal was finally
publicly announced).13
The anecdotal evidence is further confirmed by a recent study of Acharya and Johnson
(2007). Their results can be explained by bank hedging activity. Banks have privileged access to
their client firms’ information and use the CDS market to hedge against their lending exposure
against forthcoming bad news. Therefore, the CDS market is more likely to anticipate negative
earnings surprises, but not positive earnings surprises. In addition, since insiders should be more
alert and have a stronger incentive to hedge when firms are closer to default, information leakage
through the CDS market will be stronger for firms with lower ratings. Thus, our second
hypothesis is:
H2. If there is information leakage for a negative earnings announcement, the
CDS spread within the pre-announcement event window of [-30,-2] should
increase for negative earnings surprises, but not for positive earnings surprises.
13 See “Secrets to Keep: Insider Trading Hits Golden Age” by D. Berman. Source: Wall Street Journal, June 19, 2007 and “Insider Traders Concealed by Swaps, Options Boesky Never Used” by B. Drummond. Source: Bloomberg.com, June 20, 2007.
15
This effect should be more pronounced for speculative-grade firms than for
investment-grade firms. Moreover, the pre-announcement effect should be
stronger than the [-1, 1] event window due to the anticipation effect.
The above hypothesis can be summarized in the following figure:
Investment-grade Firm Speculative-grade Firm
Positive earnings surprise 0 0
Negative earnings surprise 0 +
Figure 2: Hypothesis on CDS spread changes around the [-30, -2] event window
Next, we develop our third hypothesis regarding CDS spread after the earnings
announcement. Due to the unique features of the CDS market as discussed above, we expect that
the CDS market is efficient in reflecting all publicly available information, such as earnings
surprises. Most CDS market participants are large and sophisticated investors who are privy to
the same information, so the market should timely and accurately interpret information
embedded in the earnings news. No one will have the ability to out-profit others. Therefore, we
expect no overreaction or under reaction in the CDS market in the wake of earnings news, unlike
the stock market where post-earnings drift may arise from noisy trading of uninformed investors.
This leads to our third hypothesis:
H3. The CDS spread within the post-earnings announcement window of [+2, +10]
should show no abnormal changes.
16
A large positive earnings surprise suggests that the default risk of a firm is greatly
reduced leading to a larger CDS spread change, especially for a speculative-grade firms. Datta
and Dhillion (1993) find that bond prices increase in response to large positive earnings surprises
and decrease for large negative earnings surprises. We will examine how CDS spread changes
are associated with the magnitude of earnings surprises. A large sample with both large and
small earnings surprises will provide variations for this purpose. Furthermore, CDS spreads for
speculative-grade firms should have greater sensitivity to the level of earnings surprises because
they are closer to default and have substantial downside risks. This is summarized in our fourth
hypothesis:
H4. For positive earnings surprises, the CDS spread changes in the [-1, 1] window
should be negatively associated with the magnitude of earnings surprise, holding
all else constant, and this effect should be stronger for speculative-grade firms
than for investment-grade firms.
4. DATA, METHODS, AND RESULTS
4.1. Sample
We obtain our daily credit default swap quotes from the Markit Company, a prominent
information provider in the credit derivative industry. The database includes daily CDS spreads,
the maturity of the related CDS contract, the number of dealers contributing to the quote, an
estimated recovery rate, and the firm’s composite rating from Moody’s, Standard & Poor’s and
Fitch. The data spans the time period from 2001 to 2005. We extract earnings data from I/B/E/S
17
and various accounting information from COMPUSTAT. We also use Factiva news service to
exclude observations that experience confounding credit events during a period of 30 days prior
to and 10 days after the earnings announcement. These events include credit rating changes,
capital structure changes, mergers and acquisitions, spin-offs, seasoned equity offerings, new
bank loans and new bond offerings, and changes in dividends. Our final sample size is 6,236
firm-quarter pairs of observations for 633 firms.
Table 1-A presents the frequency of observations across years, with the number of
observations gradually increasing over the years. Table 1-B details the distribution of
observations across industries based on the two-digit SIC code. The sample is evenly distributed
over 60 industries.
[Insert Table 1]
We construct the major variable of interest, Earnings Surprise, following the approach
used by Doyle et al. (2006) and Kasznik and McNichols (2002). The variable Earnings-Surprisei,t
is firm i’s difference between the I/B/E/S actual earnings per share for quarter t and the most
recent I/B/E/S consensus forecast earnings per share before the earnings announcement, deflated
by the market price per share one month prior to the end of quarter t.14 If the actual quarterly
earnings per share is larger than the I/B/E/S consensus forecast, then that firm-quarter
observation is defined as a “positive earnings surprise” observation. If the actual quarterly
earnings per share are smaller than the I/B/E/S consensus forecast, then that firm-quarter
observation is defined as a “negative earnings surprise” observation.
14 We also performed this calculation with total assets per share from the previous quarter as the deflator and obtained similar results. The results are available upon request.
18
4.2. Results
4.2.1. CDS Spread Changes Around Earnings Announcement
Our main results are presented in Table 2. Panel A and B report CDS spread reactions
around earnings announcements for negative earnings surprises and positive earnings surprises,
respectively. In the upper section of each panel, we report results for the subsamples of firms
falling into five broad rating categories (AAA and AA, A, BBB, BB, B and CCC). In the lower
section of the panel, we report results for the full sample as well as the investment-grade
subsample and the speculative-grade subsample. The last line presents the mean difference in
CDS spread changes between a speculative-grade subsample and an investment-grade one. The
mean and t-statistics of cumulative spread changes are reported over the [-30, -2] and [-1, 1]
event windows for each case.
[Insert Table 2]
As demonstrated in Table 2, for the entire sample, CDS spreads increase by 0.81 basis
points (bp) for the three-day window for negative earnings surprise, and decrease by 0.66bp for
positive earnings surprise. However, when we partition the sample to speculative-grade and
investment-grade firms, the impact of earnings surprise is more pronounced for the speculative-
grade group. For negative earnings surprise, the three-day effect for the speculative-grade group
is an increase of 2.53bp (t=2.54). Relative to the average CDS level in the sample, the 2.53bp
effect for the speculative-grade group can be translated into an increase of CDS spread by 0.48%,
which seems economically modest.15 This effect is dampened, however, to the extent that the
15 This 2.53bp spread increase is comparable to the level of CDS spread change reported in other event studies using CDS spread to gauge credit risk. For example, Jorion and Zhang (2007) find that the industry competitors suffer an
19
earnings surprise is anticipated. In terms of investment-grade firms, there is an insignificant
increase of 0.13bp. The mean difference of 2.4bp in CDS spread changes between the
speculative-grade and investment-grade firms is significant.
A similar pattern is found for positive earnings surprise. The three-day effect for the
speculative-grade group is a narrowing of the CDS spread of 2.64bp (t=3.26) or a decrease by
1.05% relative to the CDS spread before the earnings announcement. The effect for the
investment-grade group is negative, but insignificant. Here, the difference of 2.48bp between the
speculative-grade and investment-grade groups is significant at the 1% level. Overall, the results
in Table 2 are consistent with our first hypothesis.
4.2.2. CDS Spread Changes Prior to Earnings Announcement
To test our second hypothesis, whether the CDS market anticipates negative earnings
news, we focus our attention on the [-30, -2] event window in Table 2. Panel A indicates that
CDS change increases by 3.76bp (t=3.76) for the entire sample of negative earnings surprises.
This suggests that the CDS market anticipates negative earnings shocks and responds in advance.
If we break down the sample into the speculative and investment-grade subsamples, the
difference in reaction is pronounced. On average, investment-grade firms suffer a 1.24bp
increase (which is marginally significant statistically). Speculative-grade firms suffer a 10.49bp
hike in CDS spread, on average, during the [-30, -2] event window and it is significant at the 1%
level. This represents a 1.99% increase in CDS spread, which is economically significant. The
mean test also demonstrates that the CDS change for speculative-grade firms is significantly
greater than that of investment-grade firms.
increase of 1.84bp in CDS spread during the [-1, 1] event window when a firm files for Chapter 11 bankruptcy. Jorion and Zhang (2009) report that the CDS spread of creditors increase by 2.11bp for the three-day event window when its borrower files for Chapter 11 bankruptcy.
20
In sharp contrast to the anticipation effect around negative earnings shocks in the CDS
market, there is muted response in the market prior to positive earnings shocks. As shown in the
left column in Panel B, there is no significant CDS change in the [-30, -2] window for the full
sample or any subsamples. These uni-variate results are consistent with our second hypothesis.
To provide further evidence that the CDS market anticipates negative earnings surprise
(H2), we perform a logistic regression to examine whether changes in the CDS spread in the [-
30,-2] window are useful for predicting a negative earnings surprise. The model is provided
below:
P= 1 / (1+ e-a-bx)
Here, x is the CDS spread change in the pre-announcement window [-30,-2] and P is the
probability of a negative earnings surprise event in the [-1, 1] window. We assign one to the
dependent variable if a negative earnings surprise is observed and zero for a positive one. We
estimate coefficients a and b with the maximum likelihood algorithm.
Table 3 reports results for the entire sample and the investment/speculative subsamples.
For the whole sample, the CDS spread changes before earnings announcements appear to be a
good predictor of the direction of earnings surprises. The coefficient on the CDS change variable,
b, is positive and significant at the 0.001 level. This suggests that an increase in CDS spread
change is positively associated with the likelihood that the earnings surprise is a negative one.
When we separate observations into investment-grade and speculative subsamples based on firm
credit ratings, the coefficients on the CDS change variable for both subsamples are still
significant.
21
[Insert Table 3]
In sum, evidence from both the event study and the logistic regression supports our
second hypothesis. It indicates that the CDS market seems to anticipate negative earnings
surprises well before such bad news is announced publicly. This corresponds to anecdotal
evidence in the financial press about information leakage in the CDS market. It also provides
independent evidence in support of insider trading in the CDS market as documented by Acharya
and Johnson (2007).
4.2.3. CDS Spread Changes Post Earnings Announcement
Finally, the CDS spread change in the [2, 10] window displays no significant reaction for
negative earnings surprises across all rating levels and for the whole sample, the investment-
grade subsample, and the speculative subsample. It suggests that the CDS market is indeed
efficient with respect to negative earnings news. When we compare that with the [2, 10] event
window result for positive earnings surprises in Table 2-B, we find similar results. Therefore, for
both the investment-grade subsample and the speculative subsample, and for both types of
earnings surprises, there is no significant post-earnings-announcement drift. That’s in sharp
contrast with the well documented post-earnings announcement drift in the equity market, which
was first reported by Ball and Brown (1968). The information efficiency of the CDS market may
arise from the absence of funding and short-sale restrictions in the credit derivatives market and
the fact that the CDS market is dominated by sophisticated and well informed banks and
institutional investors. Thus, it might be less subject to noise from naïve traders.
22
4.2.4. The Sensitivity of CDS Spread Changes Around Earnings Announcement to
Earnings Surprises
In this section, we further explore the correlation between the level of earnings surprises
and the magnitude of CDS spread changes around earnings announcements. To this end, we
conduct a multivariate regression with the [-1, 1] CDS spread changes as the dependent variable,
and the level of earnings surprises as an explanatory variable, controlling for market and firm
characteristics. To test whether the CDS spread of speculative-grade firms has a different
sensitivity to earnings surprises from that of investment-grade firms, we create an interaction
term by multiplying the earnings surprise with a dummy variable, which is equal to one for a
speculative-grade firm and zero otherwise.
The choice of control variables is based on Merton (1974) and prior studies on
determinants of CDS spread (Cao et al., 2010; Ericsson et al., 2009).
Market risk variables are:
Treasury Rate is the 10-year U.S. Treasury constant maturity yield obtained from the Federal
Reserve Bank in St. Louis.
Yield Curve Slope is the difference between a 10-year and two-year U.S. Treasury yield.
Market Implied Volatility is the implied volatility for S&P 500 index options (VIX) extracted
from CBOT.
Firm characteristics are:
23
Volatility change over the [-1, 1] window is calculated using 250-day historical daily stock
returns for both the -1 date and also the +1 date.16
Leverage is the total liabilities of firm i for the preceding quarter divided by the sum of its total
liabilities and the market value at t-1.17
Equity return is the stock return over the event window [-1, 1].
Table 4 reports the descriptive statistics of all variables for the speculative-grade and
investment-grade subsamples. Our final regression sample consists of 6,236 firm-quarters in total
(4,005 with positive earnings surprises and 2,231 with negative earnings surprises). The average
negative earnings surprise scaled by market price is -0.003, with a lowest value of -0.158. The
average positive earnings surprise is 0.002, with a highest value of 0.09. For the positive
earnings subsample, we find that the CDS spread changes have a significant correlation of -0.075
with the level of earnings surprise and a correlation of -0.081 with the speculative-grade
dummy.18 This provides partial support for our fourth hypothesis. However, for the negative
earnings surprises subsample, we only find a significant positive correlation of 0.072 with the
dummy variable, but no correlations with earnings surprise. This may be due to weak market
reaction during the three-day window around negative earnings news. Next, we turn to
multivariate regressions for more rigorous evidence.
[Insert Table 4]
16 We adhere to Cao et al. (2010) and use 250-day daily stock returns to calculate volatility changes. We also tested alternative measures of historical stock volatility based on 90-day stock returns and 180-day stock returns. Regression results are similar; thus, we do not report these variables and their results in our tables. 17 We finally decide to follow Cao et al. (2010) and keep only equity return in our regression model. We also try an accounting-based leverage ratio, such as the total liabilities-total assets ratio or the liability-equity ratio and get similar results. 18 Correlation matrix is not reported to save space, but is available upon request.
Volatility changei,t + α8 Leveragei,t +α9 Equity returni,t + α10 to α13 Year dummies
+ ε
Since the dataset contains both time-series and cross-sectional observations, there are two
types of correlations that may affect the statistical inference. First, observations from the same
firm appear several times in our dataset and, as such, should not be treated as independent as in a
typical OLS. Additionally, the same macroeconomic conditions affect all firms in the same year.
Therefore, it is important to control for the time effect, as well. Following Peterson (2009), we
estimate the equation using the panel regression adjusted for firm clustering effect, and
introducing year dummies to account for the time effect.
The regression results are presented in Table 5. For the positive earnings surprise
subsample, the coefficient on Earnings Surprise is not significant, but the speculative dummy
variable is significant at the 5% level. The impact of positive earnings surprise on the CDS
spreads of speculative-grade firms is –291.79 (-477.22 + 185.43) and is statistically significant at
the 5% level. This implies that for every 1% increase (deflated by the stock price per share) in
positive earnings surprise, the CDS spread for speculative-grade firms will drop by 2.9bp. In
summary, investment-grade firms and speculative-grade firms do react differently to positive
earnings surprises, consistent with H4. Results for the positive earnings surprise subsample
25
confirm our findings in the uni-variate test. There is no significant reaction to positive earnings
surprise for the investment-grade firms, since they are far from financial distress. Good earnings
news has little incremental impact on credit risk. However, for speculative-grade firms, better
than expected earnings increase expected future cash inflow and reduce the risk of a covenant
violation with immediate relief for bondholders. We also separate observations into two groups,
investment-grade firms and speculative-grade firms, and run two separate regressions and reach
the same conclusion.
[Insert Table 5]
Consistent with our expectation, the regression for the negative earnings surprise
subsample reports no significant relationship between earnings surprise and the CDS spread
change in the [-1, 1] event window. This is likely due to information leakage prior to the
announcement.
4.2.5. The Sensitivity of CDS Spread Changes Prior to Earnings Announcement to Market
and Firm Characteristics
Given the relatively limited CDS spread changes around the event window, it is
interesting to investigate how the CDS run-ups before the earnings announcement are related to
cross-sectional differences in firm characteristics.19 We construct a multivariate regression,
where the dependent variable is the CDS spread changes during the [-30, -2] event window. The
independent variables are similarly constructed as in Section 4.2.4., with the additional variable
of the equity bid-ask spread to proxy for information asymmetry of firms announcing earnings 19 We thank a referee for their suggestion to investigate this issue.
26
news. Bid-ask spread is the average of stock bid-ask spreads scaled by the middle prices during
the [-30, -2] event window.
Prior theoretical work suggests that higher information asymmetry is associated with
wider credit spreads (Duffie and Lando, 2001; Cetin et al., 2004). This has been supported by a
number of empirical works, such as Bhojraj and Sengupta (2003) and Wang and Zhang (2009).
Therefore, we expect that higher information asymmetry is positively associated with CDS
spread changes prior the earnings announcement, holding other things constant.
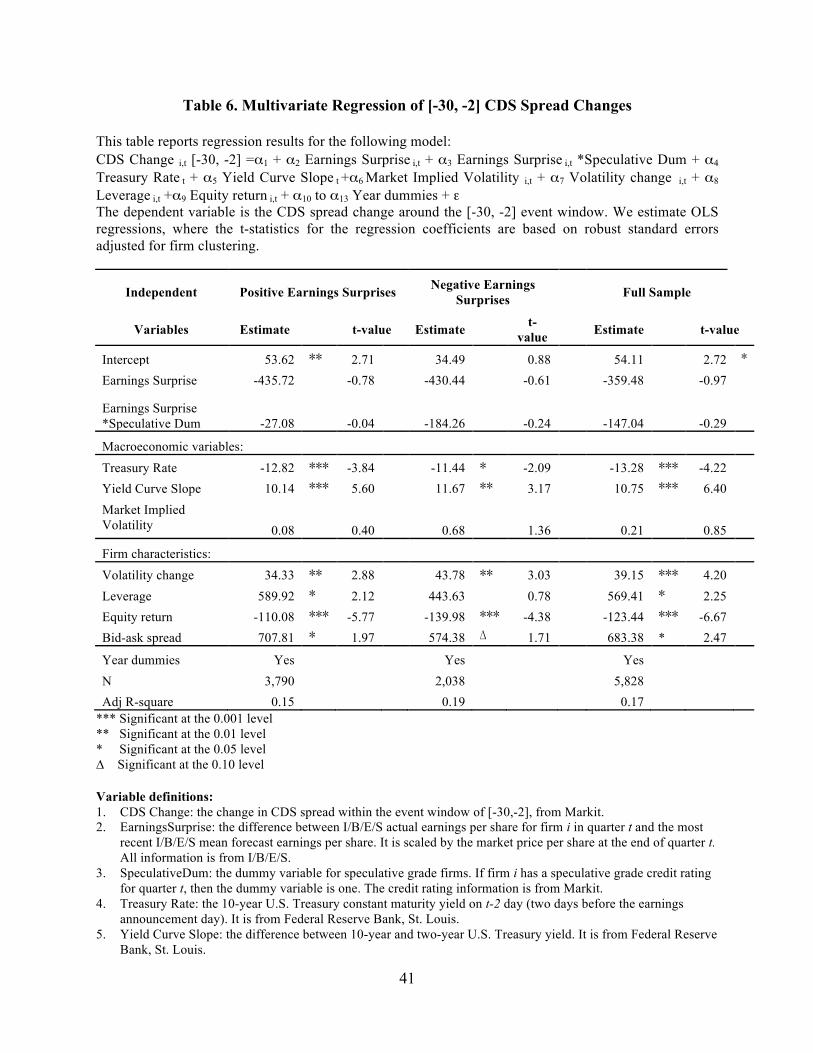
Table 6 reports the regression results. Several points are noteworthy. First, the coefficient
for bid-ask spread is positive and significant at the 5% (10%) level for the positive (negative)
earnings surprise subsample after controlling for other market and firm characteristics. Overall,
for the entire sample, the greater bid-ask spread is significantly related to a higher CDS spread
change during the [-30, -2] event window, as expected. This indicates that information
asymmetry presented in the equity market is useful in explaining CDS spread changes prior to
earnings announcements.
Additionally, volatility change and equity return during the [-30, -2] event window are
important variables to explain pre-announcement CDS spread changes. The magnitude of
earnings surprises is not significant in regressions of both subsamples suggesting that the CDS
market is unable to predict the exact extent of earnings surprises. The interaction variable
between earnings surprises and the speculative dummy is not significant. In terms of market
variables, the pre-announcement CDS spread is sensitive to the Treasury Rate and to the Yield
Curve Slope.
27
Moreover, the adjusted R-squares are 15% and 17% for positive and negative earnings
surprise subsamples, respectively. This is much larger than the explanatory power (with the
adjusted R-squares of 2%) for the regression of the [-1, 1] CDS spread changes in Table 5.
[Insert Table 6]
5. CONCLUSION
Although credit default swaps have been criticized by some for their role in the recent
financial crisis, it is also held by others that CDS is a useful hedging device and a market
barometer to reflect credit risk. Using earnings surprises, the most fundamental news concerning
firms’ value, we provide strong empirical evidence supporting the information efficiency of the
CDS market.
Our study finds that negative earnings surprises lead to an increase in the CDS spread as
early as one month prior the announcement for all firms, but the CDS spread for the speculative-
grade subsample tends to increase more. We also confirm that positive earnings surprises do help
to reduce the CDS spread when the news is released to the public, but this holds for speculative-
grade firms only. Our results suggest that earnings news is more important for the CDS pricing
of firms with low credit quality, consistent with the nature of the CDS contract. Moreover, we
find there is no post-earnings announcement drift that was documented for the equity market in
the CDS market, suggesting greater information efficiency of the CDS market.
This study extends research on the information efficiency of the CDS market by
examining the market reaction to earnings news. The CDS market, with more active trades and
relatively high liquidity, overcomes several limitations found in bond studies of price reaction to
28
earnings surprises. The results contrast with conclusions from earnings research in the equity
market and single out the asymmetrical pattern of response in the CDS market between
investment-grade firms and speculative-grade firms. Overall, our evidence supports the role of
the CDS market in timely reflecting credit risk of the underlying reference entities, which should
play an active role in increasing financial stability if properly used and regulated.
29
References
Acharya, V., Johnson, T., 2007, Insider trading in credit derivatives, Journal of Financial
Economics 84, 110-141.
Aharony, J., Swary, I., 1980, Quarterly dividend and earnings announcements and stockholders’
returns: An empirical analysis, Journal of Finance 35, 1-12.
Ball, R., Brown, P., 1968, An empirical evaluation of accounting income numbers, Journal of
Accounting Research 6, 159-177.
Bartov, E., Givoly, D., Hayn, C., 2002, The reward to meet or beat earnings expectations,
Journal of Accounting and Economics 2, 173-204.
Berndt, A., Ostrovnaya, A., 2008, Do equity markets favor credit markets news over option
market news?, Carnegie Mellon University Working Paper.
Bhojraj, S., Sengupta, P., 2003, Effect of corporate governance on bond ratings and yields: The
role of institutional investors and outside directors, Journal of Business 76(3), 455-475.
Blanco, R., Brennan, S., Marsh, I., 2005, An empirical analysis of the dynamic relationship
between investment-grade bonds and credit default swaps, Journal of Finance 60, 2,255-2,281.
30
Brown, S., 1978, Earnings changes, stock prices and market efficiency, Journal of Finance 33,
17-28.
Cao, C., Yu, F., Zhong, Z., 2010, The information content of option-implied volatility for credit
default swap valuation, Journal of Financial Markets 13(3), August 2010, 321-343.
Cetin, U., Jarrow, R., Protter, P., Yildirim, Y., 2004, Modeling credit risk with partial
information, The Annals of Applied Probability 14(3), 1,167-1,178.
Chen, R. and Sopranzetti, B., 2002, The valuation of default-triggered credit derivatives, Journal
of Financial and Quantitative Analysis 38(2), 359-382.
Cukierman, A., 2011, Reflections on the crisis and on its lessons for regulatory reform and for
central bank policies, Journal of Financial Stability 7(1), January 2011, 26-37.
Datta, S., Dhillion, U., 1993, Bond and stock market response to unexpected earnings
announcements, Journal of Financial and Quantitative Analysis 28(4), 565-577.
Doyle, J., Lundholm, R., Soliman, M., 2006, The extreme future stock returns following I/B/E/S
earnings surprises, Journal of Accounting Research 5, 849-887.
31
Duca, J.V., Muellbauer J., Murphy, A., 2010, Housing markets and the financial crisis of 2007-
2009: Lessons for the future, Journal of Financial Stability 6(4), December 2010, 203-217.
Duffie, D., Lando, D., 2001, Term structure of credit spreads with incomplete accounting
information, Econometrica 69, 633-664.
Ericsson, J., Jacobs, K., Oviedo, R., 2009, The determinants of credit default swap premia,
Journal of Financial and Quantitative Analysis 44(1), February 2009, 109-132.
Fung, H., Sierra, G., Yau, J., Zhang, G., 2008, Are the U.S. stock market and credit default swap
market related? Evidence from the CDX indices, Journal of Alternative Investments Summer, 43-61.
Hull, J., Predescu, M., White, A., 2004, The relationship between credit default swap spreads,
bond yields, and credit rating announcements, Journal of Banking and Finance 28(11), 2,789-
2,811.
Hull, J., White, A., 2000, Valuing credit default swaps I: No counterparty default risk, Journal of
Derivatives 8(1), 29-40.
ISDA Market Survey (2010), Notional amounts outstanding at year-end, all surveyed contracts,
1987-present, International Swaps and Derivatives Association (ISDA).
32
Jorion, P., Zhang, G., 2007, Good and bad credit contagion: Evidence from credit default swaps,
Journal of Financial Economics 84(3), 860-883.
Jorion, P., Zhang, G., 2009, Credit contagion from counterparty risk, Journal of Finance 64(5),
October 2009, 2,053-2,087.
Jorion, P., Shi, C., Zhang, S., 2009, Tightening credit standards: The role of accounting quality,
Review of Accounting Studies 14(1), 123-160.
Kapadia, N., Pu, X., 2010, Limited arbitrage between equity and credit markets, University of
Massachusetts Working Paper.
Kasznik, R., McNichols, M., 2002, Does meeting earnings expectations matter? Evidence from
analyst forecast revisions and share prices, Journal of Accounting Research 40, 727-759.
Krainer, R.E., 2011, Regulating Wall Street: The Dodd-Frank Act and the new architecture of
global finance, a review, Journal of Financial Stability, forthcoming.
Merton, R.C., 1974, On the pricing of corporate debt: The risk structure of interest rates, Journal
of Finance 29(2), 449-470.
Norden, L., Weber, M., 2004, Informational efficiency of credit default swap and stock markets:
The impact of credit rating announcements, Journal of Banking and Finance 28(11), 2,813-2,843.
33
Peterson, M., 2009, Estimating standard errors in finance panel data sets: Comparing approaches,
Review of Financial Studies 22(1), 435-480.
Scheer, D., 2007, SEC investigating insider trading in credit-default swaps’, Bloomberg LLP,
June 22.
Standard and Poor’s, 2003, Corporate Ratings Criteria, New York, NY: S&P.
Wagner, W., Marsh, I.W., 2006, Credit risk transfer and financial sector stability, Journal of
Financial Stability 2(2), June 2006, 173-193.
Wang, A.W., Zhang, G., 2009, Institutional ownership and credit spreads: An information
asymmetry perspective, Journal of Empirical Finance 16, 597-612.
Zhang, G., 2009, Informational efficiency of credit default swap and stock markets: The impact
of adverse credit events, International Review of Accounting, Banking and Finance, 1(1) April,
1-15.
Zhu, H., 2006, An empirical comparison of credit spreads between the bond market and the
credit default swap market, Journal of Financial Services Research 29(3), 211-235.
34
Table 1. Descriptive Statistics of Earnings Observations
This table breaks down earnings observations by year in Panel A and by industries (2-digit SIC code) in Panel B.
Panel A. Frequency of Observations across Years
Year Number Percent 2001 478 7.6% 2002 958 15.4% 2003 1,198 19.2% 2004 1,717 27.5% 2005 1,885 30.2%
6,236 100%
Panel B Frequency of Observations Across Industries
2-Digit SIC Code Industry Number Percent 1 Agricultural Production 5 0.1% 7 Agricultural Services 16 0.3% 10 Metal Mining 38 0.6% 12 Coal Mining 9 0.1% 13 Oil and Gas Extraction 306 4.9% 14 Nonmetallic Minerals 20 0.3% 15 General Building Contractors 97 1.6% 16 Heavy Construction Excluding Building 18 0.3% 20 Food and Kindred Products 263 4.2% 21 Tobacco Products 30 0.5% 22 Textile Mill Products 15 0.2% 23 Apparel and Other Textile Products 72 1.2% 24 Lumber and Wood Products 49 0.8% 25 Furniture and Fixtures 40 0.6% 26 Paper and Allied Products 204 3.3% 27 Printing and Publishing 110 1.8% 28 Chemical and Allied Products 590 9.5% 29 Petroleum and Coal Products 99 1.6% 30 Rubber and Miscellaneous Plastics Products 92 1.5% 32 Stone, Clay, and Glass Products 21 0.3% 33 Primary Metal Industries 143 2.3% 34 Fabricated Metal Products 80 1.3% 35 Industrial Machinery and Equipment 297 4.8% 36 Electronic & Other Electric Equipment 228 3.7% 37 Transportation Equipment 271 4.3% 38 Instruments and Related Products 176 2.8% 39 Miscellaneous Manufacturing Industries 45 0.7%
35
40 Railroad Transportation 87 1.4% 42 Trucking and Warehousing 29 0.5% 44 Water Transportation 2 0.0% 45 Transportation by Air 51 0.8% 46 Pipelines, Except Natural Gas 5 0.1% 47 Transportation Services 5 0.1% 48 Communications 324 5.2% 49 Electric, Gas, and Sanitary Services 483 7.7% 50 Wholesale Trade-Durable Goods 60 1.0% 51 Wholesale Trade-Nondurable Goods 57 0.9% 52 Building Materials & Garden Supplies 35 0.6% 53 General Merchandise Stores 128 2.1% 54 Food Stores 72 1.2% 55 Automotive Dealers & Service Stations 29 0.5% 56 Apparel and Accessory Stores 51 0.8% 57 Furniture and Homefurnishings Stores 30 0.5% 58 Eating and Drinking Places 72 1.2% 59 Miscellaneous Retail 81 1.3% 60 Depository Institutions 120 1.9% 61 Non-depository Institutions 42 0.7% 62 Security and Commodity Brokers 139 2.2% 63 Insurance Carriers 330 5.3% 64 Insurance Agents, Brokers, & Service 23 0.4% 67 Holding and Other Investment Offices 117 1.9% 70 Hotels and Other Lodging Places 44 0.7% 72 Personal Services 18 0.3% 73 Business Services 227 3.6% 75 Auto Repair, Services, and Parking 19 0.3% 78 Motion Pictures 9 0.1% 79 Amusement & Recreation Services 79 1.3% 80 Health Services 90 1.4% 87 Engineering & Management Services 11 0.2% 99 Non-classifiable Establishments 33 0.5% 6,236 100.0%
36
Table 2. CDS Spread Changes around Earnings Surprises
This table presents the mean changes in CDS spread for three event windows, [-30, -2], [-1, 1] and [2, 10] around negative earnings surprises in Panel A and around positive earnings surprises in Panel B. The mean changes are reported for five rating categories, AAA, A, BBB, BB, B/CCC, for investment-grade and speculative-grade firms, respectively, and for the full sample. The differences and mean test of differences in CDS spread changes between investment-grade and speculative-grade firms are presented.
Panel A. Mean Changes in CDS Spread around Negative Earnings Surprises
Mean Test Between Investment and Speculative Grade -1.09 -0.44 -2.48 ** -3.02 -0.69 -0.40
*** Significant at the 0.001 level ** Significant at the 0.01 level * Significant at the 0.05 level ∆ Significant at the 0.10 level
37
Table 3. CDS Change in the [-30,-2] as a Predictor of Negative Earnings Surprises This table presents the regression results of the following logistic regression model:
P=1/ (1+e –a-bx). Where x is the change in CDS spread for the time period [-30, -2] and P is the probability of a negative earnings surprise in the [-1, 1] event time period. We also report McFadden LRI, the McFadden’s likelihood ratio index (McFadden R-square), that is used to gauge the model’s overall fit in the logistic regression.
*** Significant at the 0.001 level ** Significant at the 0.01 level * Significant at the 0.05 level ∆ Significant at the 0.10 level
38
Table 4. Summary Statistics for Regression Variables
This table reports the summary statistics for major variables used in multivariate regressions for the negative earnings surprise sample in Panel A and the positive earnings surprise sample in Panel B.
Variable Definitions 1. CDS Change: the change in CDS spread within the event window of [-1,1], from Markit. 2. EarningsSurprise: the difference between I/B/E/S actual earnings per share for firm i in quarter t and the most
recent I/B/E/S mean forecast earnings per share. It is scaled by the market price per share at the end of the quarter t. All information is from I/B/E/S.
3. SpeculativeDum: the dummy variable for speculative grade firms. If firm i has a speculative grade credit rating for quarter t, then the dummy variable is one. The credit rating information is from Markit.
4. Treasury Rate: the 10-year U.S. Treasury constant maturity yield on t-2 day (two days before the earnings announcement day). It is from Federal Reserve Bank, St. Louis.
5. Yield Curve Slope: the difference between 10-year and two-year U.S. Treasury yield. It is from Federal Reserve Bank, St. Louis.
6. VIX for S&P 500: the implied volatility on the t-2 day for the S&P 500 index, from CBOT. 7. Volatility change: the change in historical volatility over the event window [-1, 1] for firm i. It is difference
between the 250-day historical volatility on t+2 day and t-2 day, based on daily stock returns from CRSP. Here, t is the earnings announcement date.
8. Leverage: the total liabilities of firm i for quarter t-1 divided by the sum of its total liabilities and the market value two days before the earnings release.
9. Equity return: the stock buy-and-hold return over the event window [-1, 1] for firm i.
39
Table 5. Multivariate Regression of [-1, 1] CDS Spread Changes This table reports regression results for the following model: CDS Changei,t [-1, 1] =α1 + α2 Earnings Surprisei,t + α3 Earnings Surprisei,t *Speculative Dum + α4 Treasury Ratet + α5 Yield Curve Slope t +α6 Market Implied Volatilityi,t + α7 Volatility changei,t + α8 Leveragei,t +α9 Equity returni,t + α10 to α13 Year dummies + ε The dependent variable is the CDS spread change around the [-1, 1] event window. We estimate OLS regressions, where the t-statistics for the regression coefficients are based on robust standard errors adjusted for firm clustering.
*** Significant at the 0.001 level ** Significant at the 0.01 level * Significant at the 0.05 level ∆ Significant at the 0.10 level Variable definitions: 1. CDS Change: the change in CDS spread within the event window of [-1, 1], from Markit. 2. EarningsSurprise: the difference between I/B/E/S actual earnings per share for firm i in quarter t and the most
recent I/B/E/S mean forecast earnings per share. It is scaled by the market price per share at the end of quarter t. All information is from I/B/E/S.
3. SpeculativeDum: the dummy variable for speculative grade firms. If firm i has a speculative grade credit rating for quarter t, then the dummy variable is one. The credit rating information is from Markit.
4. Treasury Rate: the 10-year U.S. Treasury constant maturity yield on t-2 day (two days before the earnings announcement day). It is from Federal Reserve Bank, St. Louis.
5. Yield Curve Slope: the difference between 10-year and two-year U.S. Treasury yield. It is from Federal Reserve Bank, St. Louis.
6. VIX for S&P 500: the implied volatility on the t-2 day for the S&P 500 index, from CBOT.
40
7. Volatility change: the change in historical volatility over the event window [-1, 1] for firm i. It is difference between the 250-day historical volatility on t+2 day and t-2 day, based on daily stock returns from CRSP. Here, t is the earnings announcement date.
8. Leverage: the total liabilities of firm i for quarter t-1 divided by the sum of its total liabilities and the market value two days before the earnings release.
9. Equity return: the stock buy-and-hold return over the event window [-1, 1] for firm i.
41
Table 6. Multivariate Regression of [-30, -2] CDS Spread Changes
This table reports regression results for the following model: CDS Change i,t [-30, -2] =α1 + α2 Earnings Surprise i,t + α3 Earnings Surprise i,t *Speculative Dum + α4 Treasury Rate t + α5 Yield Curve Slope t +α6 Market Implied Volatility i,t + α7 Volatility change i,t + α8 Leverage i,t +α9 Equity return i,t + α10 to α13 Year dummies + ε The dependent variable is the CDS spread change around the [-30, -2] event window. We estimate OLS regressions, where the t-statistics for the regression coefficients are based on robust standard errors adjusted for firm clustering.
Independent Positive Earnings Surprises Negative Earnings Surprises Full Sample
Year dummies Yes Yes Yes N 3,790 2,038 5,828 Adj R-square 0.15 0.19 0.17
*** Significant at the 0.001 level ** Significant at the 0.01 level * Significant at the 0.05 level ∆ Significant at the 0.10 level Variable definitions: 1. CDS Change: the change in CDS spread within the event window of [-30,-2], from Markit. 2. EarningsSurprise: the difference between I/B/E/S actual earnings per share for firm i in quarter t and the most
recent I/B/E/S mean forecast earnings per share. It is scaled by the market price per share at the end of quarter t. All information is from I/B/E/S.
3. SpeculativeDum: the dummy variable for speculative grade firms. If firm i has a speculative grade credit rating for quarter t, then the dummy variable is one. The credit rating information is from Markit.
4. Treasury Rate: the 10-year U.S. Treasury constant maturity yield on t-2 day (two days before the earnings announcement day). It is from Federal Reserve Bank, St. Louis.
5. Yield Curve Slope: the difference between 10-year and two-year U.S. Treasury yield. It is from Federal Reserve Bank, St. Louis.
42
6. VIX for S&P 500: the implied volatility on the t-30 day for the S&P 500 index, from CBOT. 7. Volatility change: the change in historical volatility over the event window [-30, -2] for firm i, where t is the
earnings announcement date. 8. Leverage: the total liabilities of firm i for quarter t-1 divided by the sum of its total liabilities and the market
value 30 days before the earnings release. 9. Equity return: the stock buy-and-hold return over the event window [-30,-2] for firm i. 10. Bid-ask spread: the average of stock bid-ask spreads scaled by the middle prices during the [-30, -2] event window.