Information Managment Services: Information Management Report Information Management Trends and Benchmarks 2011 by Jill Finger Gibson December 15 th 2011 Advancing the business of information
Transcript
Information Managment Services: Information Management Report
Why This Topic?Since 2000, Outsell has polled information management (IM) professionals about their operations in order to create the most comprehensive metrics and profile of IM functions available. The annual survey covers a host of topics including IM budgets and staffing, funding models, service and content offerings, user populations and scope of responsibility, functional evaluation and other managerial techniques, content acquisition, use of new content deployment platforms and mobile technologies, and major challenges to getting the job done. This report covers the most important findings from the 2011 IM survey and highlights some key trends and innovations.
This report will allow information managers to compare their own functions to others, and perhaps to get ideas about how to improve and streamline operations. Along with reporting on IM benchmarks, Outsell includes helpful observations and recommendations relative to our findings.
Methodology
Outsell’s 2011 survey was fielded in September and October and garnered responses from 446 organizations. Outsell distributed invitations to participate in the web-based survey to several distribution lists and membership associations that are relevant to information professionals, such as SLA, FEDLINK, and Library and Archives Canada. This response rate results in a confidence level of 95% ±5% at the total sample level. Please note that sector segmentations for some questions have lower bases (numbers of respondents), which may mean lower confidence levels for those figures. Data with low bases may not be fully representative and should be considered “directional” in nature.
The report covers government, academic, school, corporate, and other special libraries, and across the global regions of North America, Latin America, Europe, Asia/Pacific, and Africa/Middle East. For purposes of this report, Outsell has excluded the data from the 46 public library respondents in order to focus on the “special library” category: IM groups within corporate, non-profit, government, and healthcare settings, as well as academia. Non-profit organizations are included in the corporate segment. Results from healthcare organizations are not reported separately due to the low number of responses (8) Outsell received in that category – instead, they are included in the overall total category.
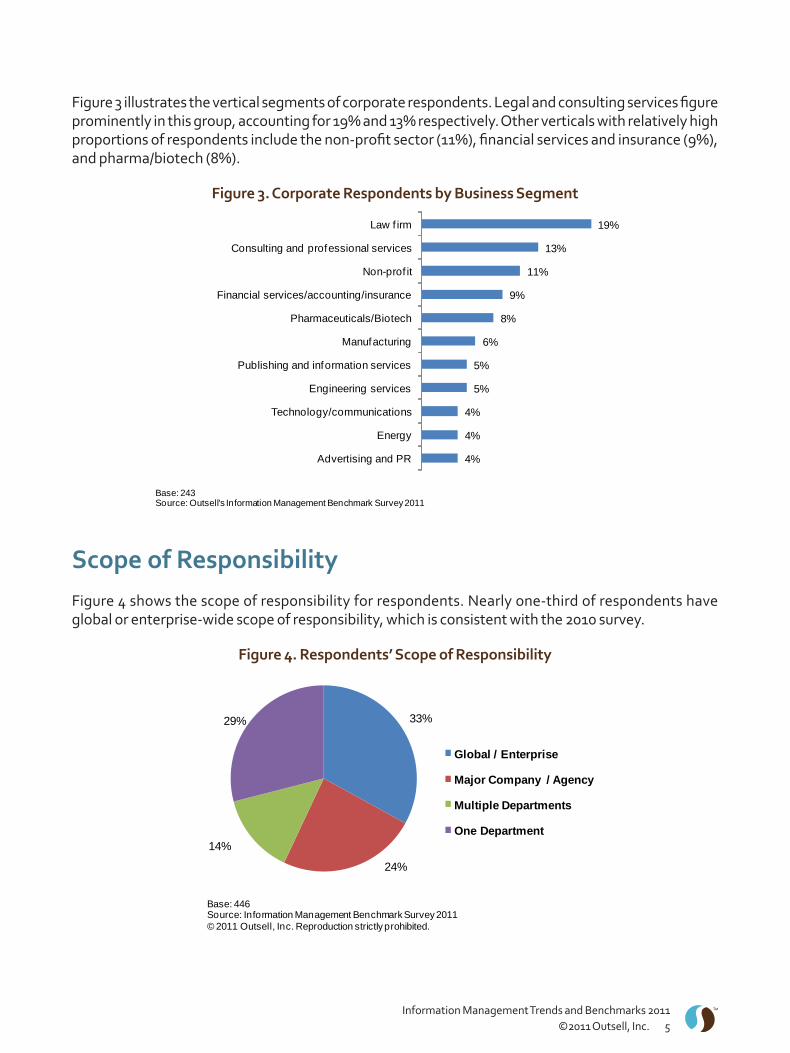
Figure 3 illustrates the vertical segments of corporate respondents. Legal and consulting services figure prominently in this group, accounting for 19% and 13% respectively. Other verticals with relatively high proportions of respondents include the non-profit sector (11%), financial services and insurance (9%), and pharma/biotech (8%).
Figure 3. Corporate Respondents by Business Segment
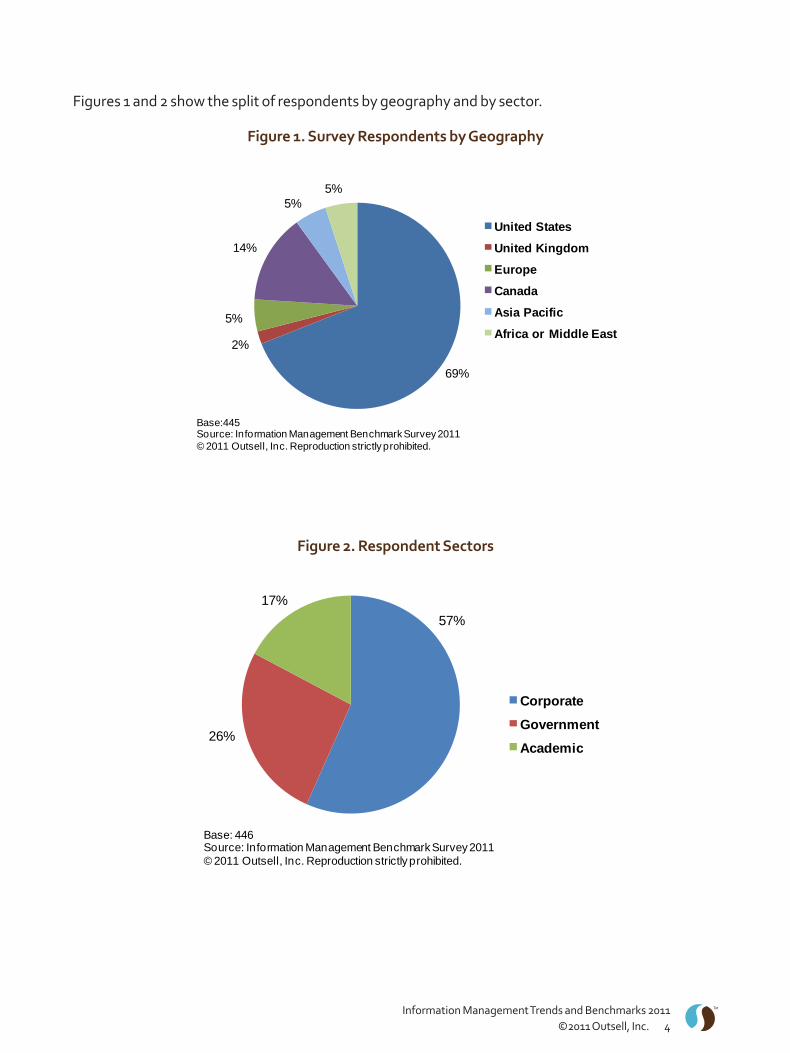
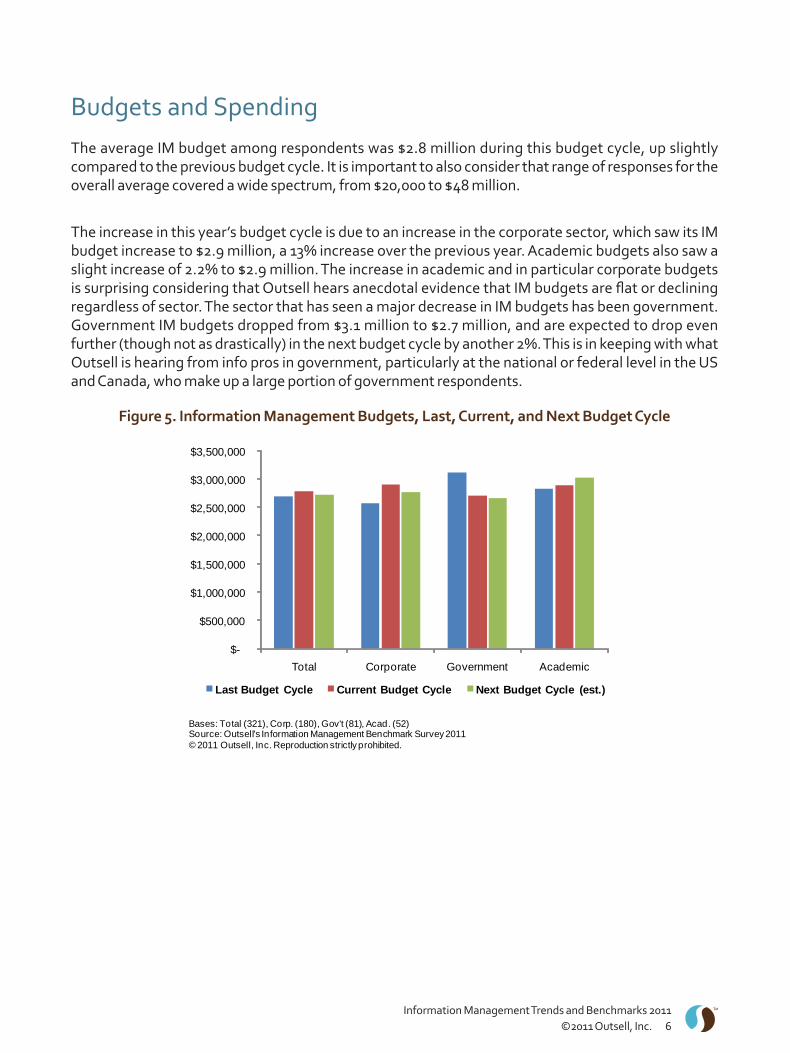
Scope of ResponsibilityFigure 4 shows the scope of responsibility for respondents. Nearly one-third of respondents have global or enterprise-wide scope of responsibility, which is consistent with the 2010 survey.
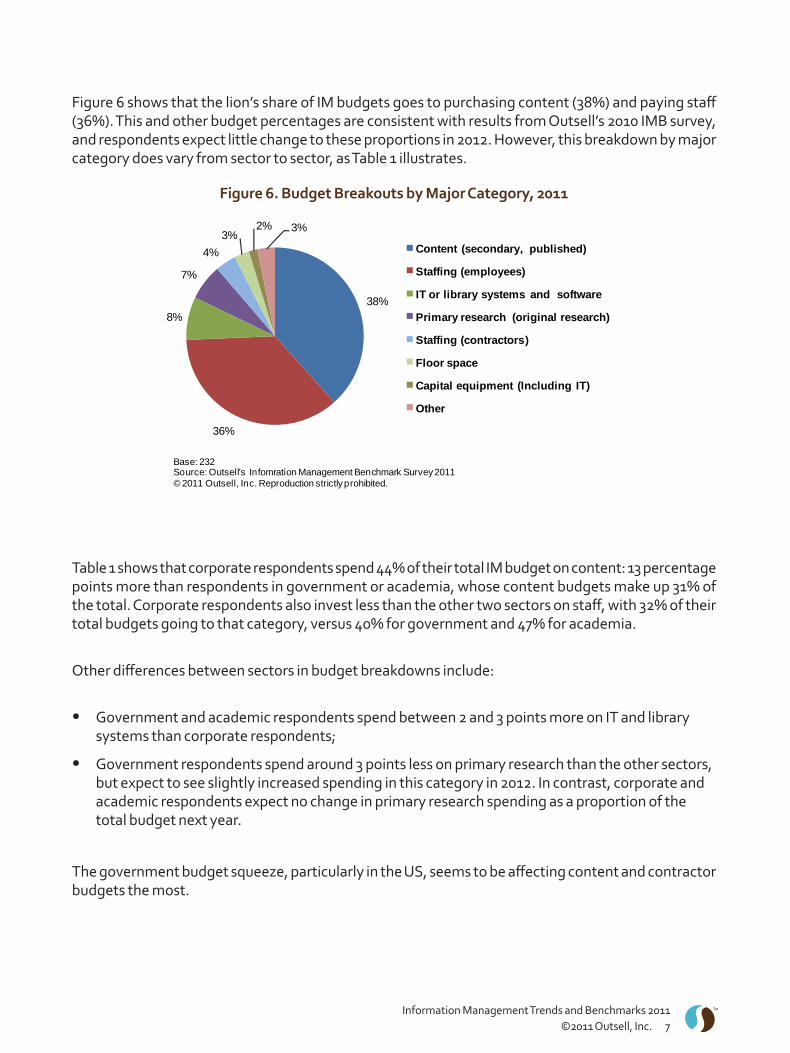
Budgets and SpendingThe average IM budget among respondents was $2.8 million during this budget cycle, up slightly compared to the previous budget cycle. It is important to also consider that range of responses for the overall average covered a wide spectrum, from $20,000 to $48 million.
The increase in this year’s budget cycle is due to an increase in the corporate sector, which saw its IM budget increase to $2.9 million, a 13% increase over the previous year. Academic budgets also saw a slight increase of 2.2% to $2.9 million. The increase in academic and in particular corporate budgets is surprising considering that Outsell hears anecdotal evidence that IM budgets are flat or declining regardless of sector. The sector that has seen a major decrease in IM budgets has been government. Government IM budgets dropped from $3.1 million to $2.7 million, and are expected to drop even further (though not as drastically) in the next budget cycle by another 2%. This is in keeping with what Outsell is hearing from info pros in government, particularly at the national or federal level in the US and Canada, who make up a large portion of government respondents.
Figure 5. Information Management Budgets, Last, Current, and Next Budget Cycle
$-
$500,000
$1,000,000
$1,500,000
$2,000,000
$2,500,000
$3,000,000
$3,500,000
Total Corporate Government Academic
Last Budget Cycle Current Budget Cycle Next Budget Cycle (est.)
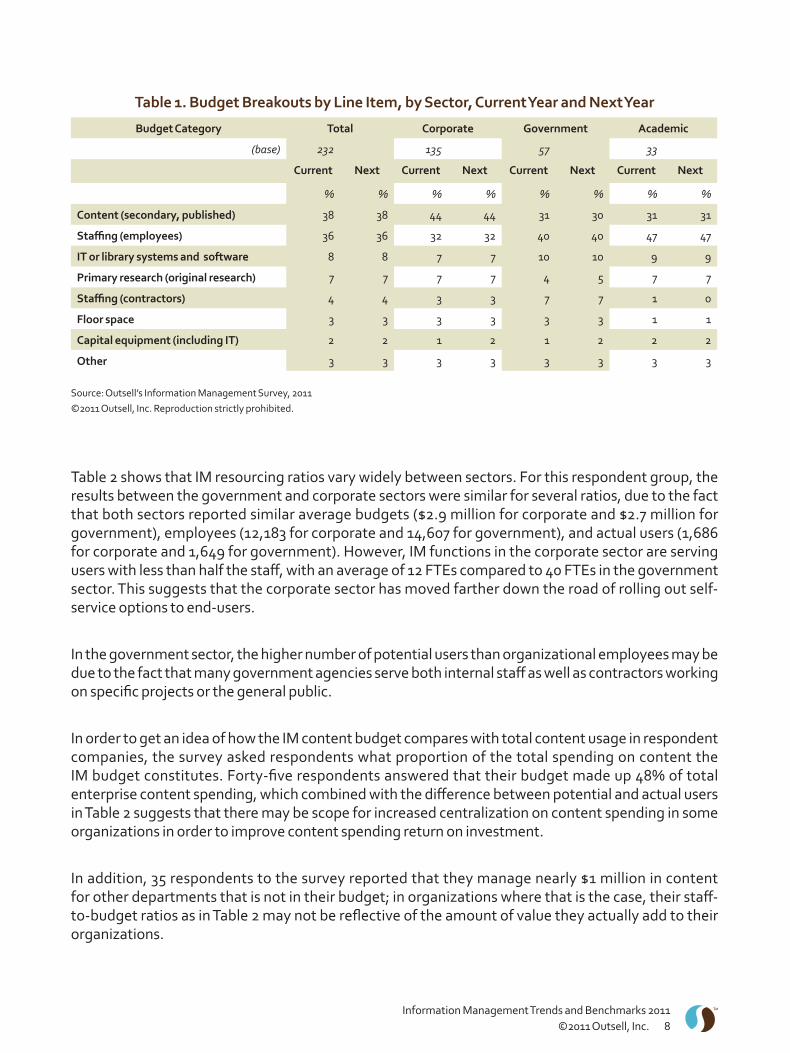
Figure 6 shows that the lion’s share of IM budgets goes to purchasing content (38%) and paying staff (36%). This and other budget percentages are consistent with results from Outsell’s 2010 IMB survey, and respondents expect little change to these proportions in 2012. However, this breakdown by major category does vary from sector to sector, as Table 1 illustrates.
Figure 6. Budget Breakouts by Major Category, 2011
Table 1 shows that corporate respondents spend 44% of their total IM budget on content: 13 percentage points more than respondents in government or academia, whose content budgets make up 31% of the total. Corporate respondents also invest less than the other two sectors on staff, with 32% of their total budgets going to that category, versus 40% for government and 47% for academia.
Other differences between sectors in budget breakdowns include:
Government and academic respondents spend between 2 and 3 points more on IT and library • systems than corporate respondents;
Government respondents spend around 3 points less on primary research than the other sectors, • but expect to see slightly increased spending in this category in 2012. In contrast, corporate and academic respondents expect no change in primary research spending as a proportion of the total budget next year.
The government budget squeeze, particularly in the US, seems to be affecting content and contractor budgets the most.
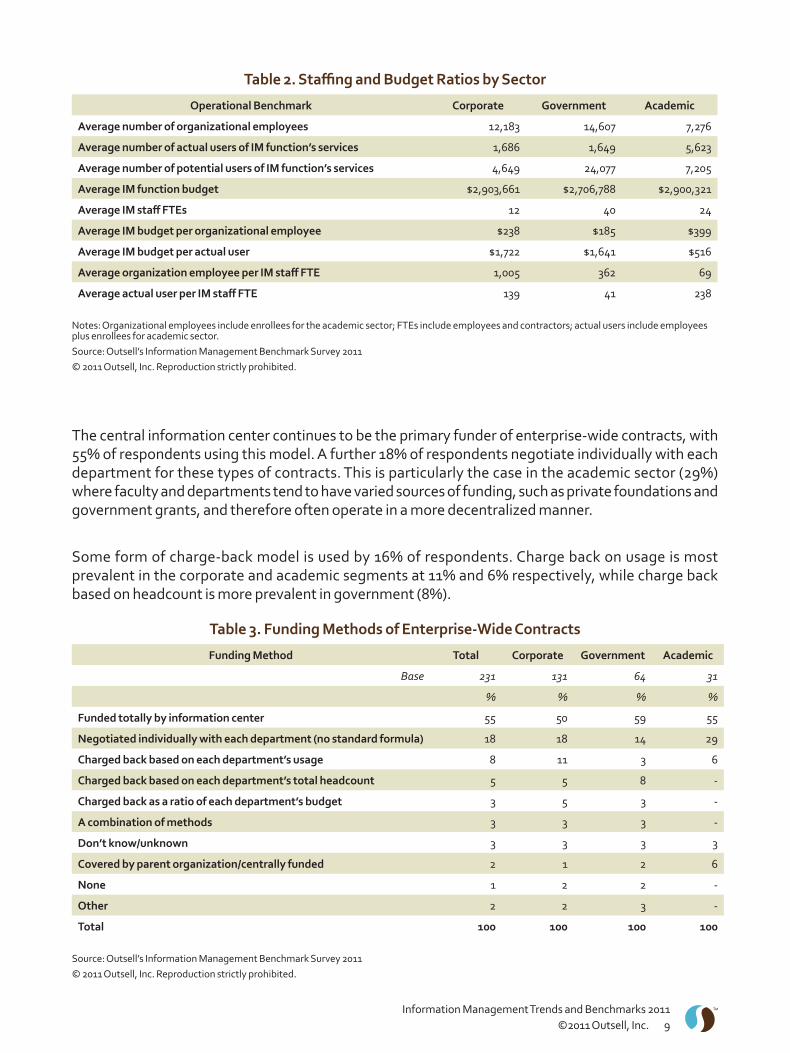
Table 2 shows that IM resourcing ratios vary widely between sectors. For this respondent group, the results between the government and corporate sectors were similar for several ratios, due to the fact that both sectors reported similar average budgets ($2.9 million for corporate and $2.7 million for government), employees (12,183 for corporate and 14,607 for government), and actual users (1,686 for corporate and 1,649 for government). However, IM functions in the corporate sector are serving users with less than half the staff, with an average of 12 FTEs compared to 40 FTEs in the government sector. This suggests that the corporate sector has moved farther down the road of rolling out self-service options to end-users.
In the government sector, the higher number of potential users than organizational employees may be due to the fact that many government agencies serve both internal staff as well as contractors working on specific projects or the general public.
In order to get an idea of how the IM content budget compares with total content usage in respondent companies, the survey asked respondents what proportion of the total spending on content the IM budget constitutes. Forty-five respondents answered that their budget made up 48% of total enterprise content spending, which combined with the difference between potential and actual users in Table 2 suggests that there may be scope for increased centralization on content spending in some organizations in order to improve content spending return on investment.
In addition, 35 respondents to the survey reported that they manage nearly $1 million in content for other departments that is not in their budget; in organizations where that is the case, their staff-to-budget ratios as in Table 2 may not be reflective of the amount of value they actually add to their organizations.
Table 2. Staffing and Budget Ratios by Sector
Operational Benchmark Corporate Government Academic
Average number of organizational employees 12,183 14,607 7,276
Average number of actual users of IM function’s services 1,686 1,649 5,623
Average number of potential users of IM function’s services 4,649 24,077 7,205
Average IM function budget $2,903,661 $2,706,788 $2,900,321
Average IM staff FTEs 12 40 24
Average IM budget per organizational employee $238 $185 $399
Average IM budget per actual user $1,722 $1,641 $516
Average organization employee per IM staff FTE 1,005 362 69
The central information center continues to be the primary funder of enterprise-wide contracts, with 55% of respondents using this model. A further 18% of respondents negotiate individually with each department for these types of contracts. This is particularly the case in the academic sector (29%) where faculty and departments tend to have varied sources of funding, such as private foundations and government grants, and therefore often operate in a more decentralized manner.
Some form of charge-back model is used by 16% of respondents. Charge back on usage is most prevalent in the corporate and academic segments at 11% and 6% respectively, while charge back based on headcount is more prevalent in government (8%).
Table 3. Funding Methods of Enterprise-Wide Contracts
Funding Method Total Corporate Government Academic
Base 231 131 64 31
% % % %
Funded totally by information center 55 50 59 55
Negotiated individually with each department (no standard formula) 18 18 14 29
Charged back based on each department’s usage 8 11 3 6
Charged back based on each department’s total headcount 5 5 8 -
Charged back as a ratio of each department’s budget 3 5 3 -
A combination of methods 3 3 3 -
Don’t know/unknown 3 3 3 3
Covered by parent organization/centrally funded 2 1 2 6
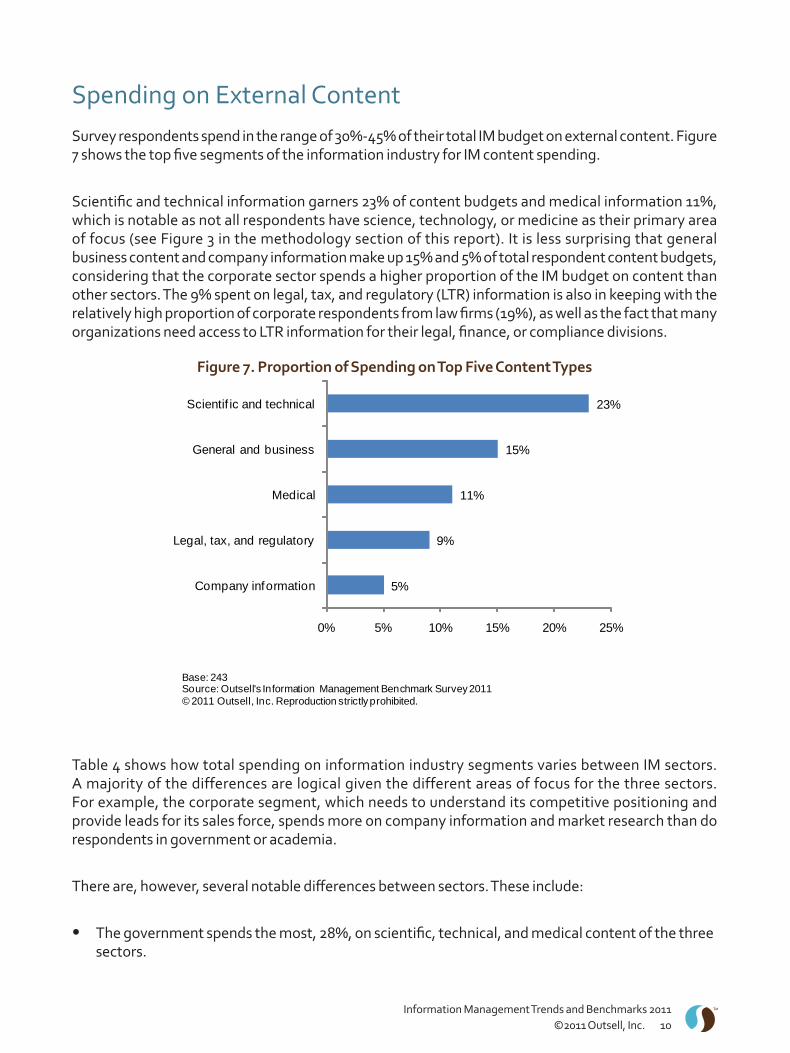
Spending on External ContentSurvey respondents spend in the range of 30%-45% of their total IM budget on external content. Figure 7 shows the top five segments of the information industry for IM content spending.
Scientific and technical information garners 23% of content budgets and medical information 11%, which is notable as not all respondents have science, technology, or medicine as their primary area of focus (see Figure 3 in the methodology section of this report). It is less surprising that general business content and company information make up 15% and 5% of total respondent content budgets, considering that the corporate sector spends a higher proportion of the IM budget on content than other sectors. The 9% spent on legal, tax, and regulatory (LTR) information is also in keeping with the relatively high proportion of corporate respondents from law firms (19%), as well as the fact that many organizations need access to LTR information for their legal, finance, or compliance divisions.
Figure 7. Proportion of Spending on Top Five Content Types
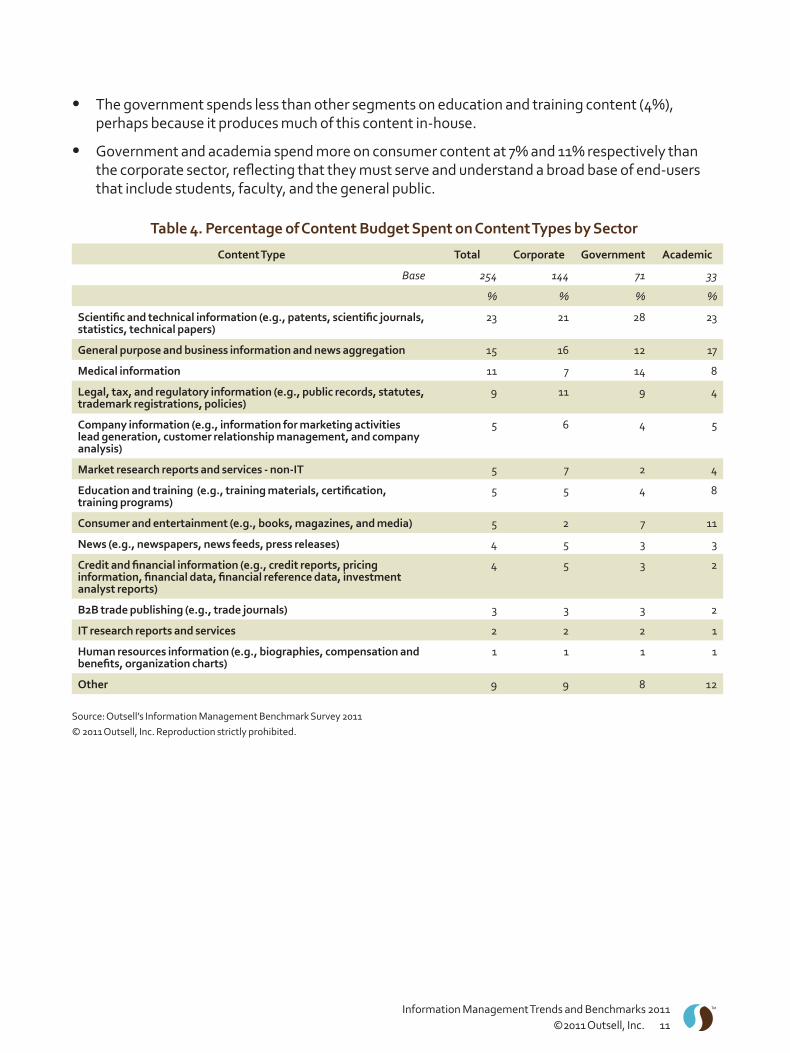
Table 4 shows how total spending on information industry segments varies between IM sectors. A majority of the differences are logical given the different areas of focus for the three sectors. For example, the corporate segment, which needs to understand its competitive positioning and provide leads for its sales force, spends more on company information and market research than do respondents in government or academia.
There are, however, several notable differences between sectors. These include:
The government spends the most, 28%, on scientific, technical, and medical content of the three • sectors.
The government spends less than other segments on education and training content (4%), • perhaps because it produces much of this content in-house.
Government and academia spend more on consumer content at 7% and 11% respectively than • the corporate sector, reflecting that they must serve and understand a broad base of end-users that include students, faculty, and the general public.
Table 4. Percentage of Content Budget Spent on Content Types by Sector
Content Type Total Corporate Government Academic
Base 254 144 71 33
% % % %
Scientific and technical information (e.g., patents, scientific journals, statistics, technical papers)
23 21 28 23
General purpose and business information and news aggregation 15 16 12 17
Medical information 11 7 14 8
Legal, tax, and regulatory information (e.g., public records, statutes, trademark registrations, policies)
9 11 9 4
Company information (e.g., information for marketing activities lead generation, customer relationship management, and company analysis)
5 6 4 5
Market research reports and services - non-IT 5 7 2 4
Education and training (e.g., training materials, certification, training programs)
5 5 4 8
Consumer and entertainment (e.g., books, magazines, and media) 5 2 7 11
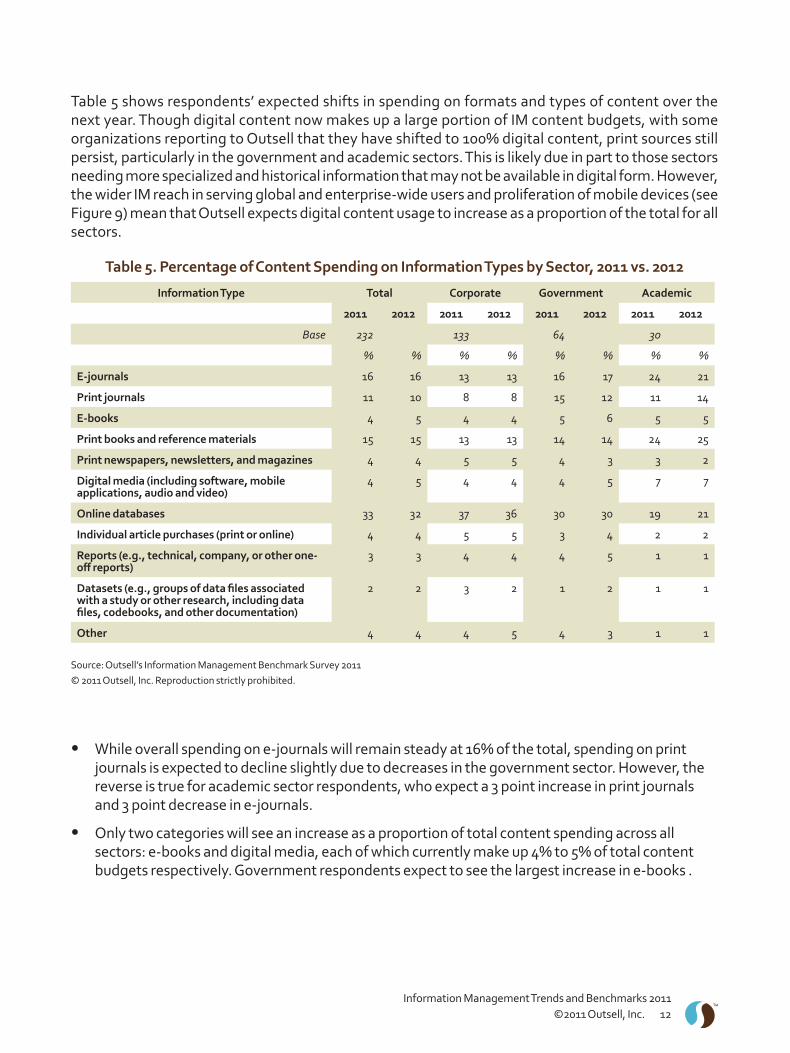
Table 5 shows respondents’ expected shifts in spending on formats and types of content over the next year. Though digital content now makes up a large portion of IM content budgets, with some organizations reporting to Outsell that they have shifted to 100% digital content, print sources still persist, particularly in the government and academic sectors. This is likely due in part to those sectors needing more specialized and historical information that may not be available in digital form. However, the wider IM reach in serving global and enterprise-wide users and proliferation of mobile devices (see Figure 9) mean that Outsell expects digital content usage to increase as a proportion of the total for all sectors.
Table 5. Percentage of Content Spending on Information Types by Sector, 2011 vs. 2012
Information Type Total Corporate Government Academic
While overall spending on e-journals will remain steady at 16% of the total, spending on print • journals is expected to decline slightly due to decreases in the government sector. However, the reverse is true for academic sector respondents, who expect a 3 point increase in print journals and 3 point decrease in e-journals.
Only two categories will see an increase as a proportion of total content spending across all • sectors: e-books and digital media, each of which currently make up 4% to 5% of total content budgets respectively. Government respondents expect to see the largest increase in e-books .
Despite the growth of e-books usage worldwide (see Outsell’s report,• Worldwide E-Books Market Size and Forecast Report, 2009-2013, from June 30, 2011), survey responses indicate that take up for e-books is happening more slowly in the enterprise. No sector is expecting to make a substantial decrease in spending on print books; in fact, academia will continue to spend nearly a quarter of its content budget on print books. This is consistent with anecdotal evidence Outsell is hearing from info pros in enterprises, who report confusion and frustration over the wide variety of technical standards, copyright restrictions, and variability of content for different end-user devices for e-books.
Online databases account for the largest single proportion of overall content spending due to the • fact that around one-third of both corporate and government content budgets go to this content type.
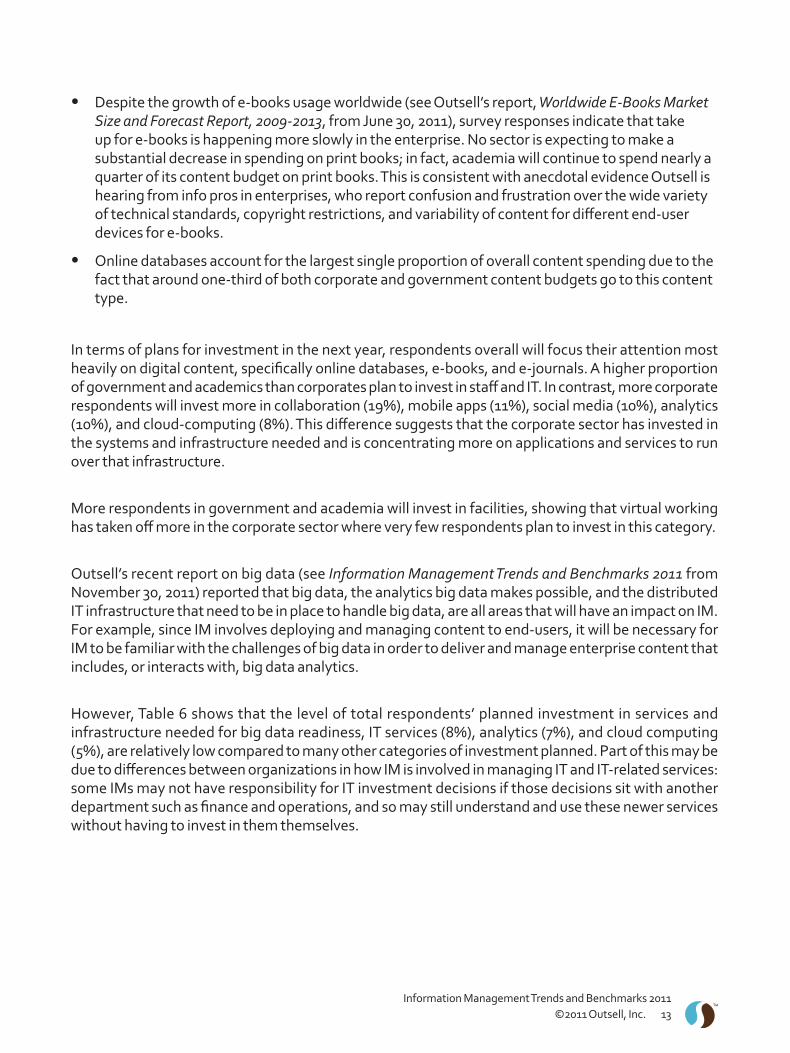
In terms of plans for investment in the next year, respondents overall will focus their attention most heavily on digital content, specifically online databases, e-books, and e-journals. A higher proportion of government and academics than corporates plan to invest in staff and IT. In contrast, more corporate respondents will invest more in collaboration (19%), mobile apps (11%), social media (10%), analytics (10%), and cloud-computing (8%). This difference suggests that the corporate sector has invested in the systems and infrastructure needed and is concentrating more on applications and services to run over that infrastructure.
More respondents in government and academia will invest in facilities, showing that virtual working has taken off more in the corporate sector where very few respondents plan to invest in this category.
Outsell’s recent report on big data (see Information Management Trends and Benchmarks 2011 from November 30, 2011) reported that big data, the analytics big data makes possible, and the distributed IT infrastructure that need to be in place to handle big data, are all areas that will have an impact on IM. For example, since IM involves deploying and managing content to end-users, it will be necessary for IM to be familiar with the challenges of big data in order to deliver and manage enterprise content that includes, or interacts with, big data analytics.
However, Table 6 shows that the level of total respondents’ planned investment in services and infrastructure needed for big data readiness, IT services (8%), analytics (7%), and cloud computing (5%), are relatively low compared to many other categories of investment planned. Part of this may be due to differences between organizations in how IM is involved in managing IT and IT-related services: some IMs may not have responsibility for IT investment decisions if those decisions sit with another department such as finance and operations, and so may still understand and use these newer services without having to invest in them themselves.
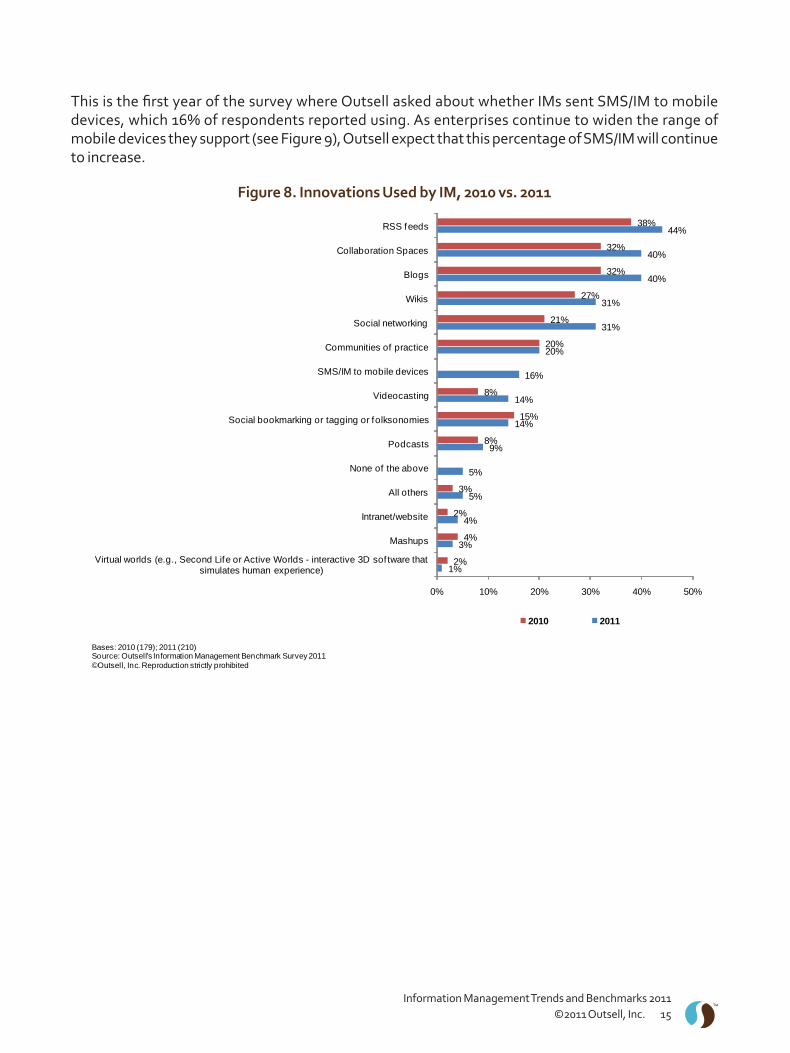
Devices and Content Delivery PlatformsFigure 8 shows that IM functions’ use of social media, mobile, and new content delivery platforms is on the rise over the last year. RSS feeds, collaboration spaces, blogs, and wikis continue to be the most popular, with feeds and wikis in particular suitable for the “one-to-many” delivery that IMs need to communicate and inform their end-users. RSS feeds, in particular, continue to show increased usage over the last year; however, this may be somewhat deceiving, as many IM functions use RSS feeds to populate portals, collaboration sites, and intranet sites. In other words, RSS is behind the scenes rather than for direct information delivery to individual users.
Social networking has seen a big jump in usage, nearly 10 points over the previous year, most likely due to more enterprises employing enterprise social media systems and technologies as well as more IMs becoming familiar with using public platforms such as LinkedIn groups.
This is the first year of the survey where Outsell asked about whether IMs sent SMS/IM to mobile devices, which 16% of respondents reported using. As enterprises continue to widen the range of mobile devices they support (see Figure 9), Outsell expect that this percentage of SMS/IM will continue to increase.
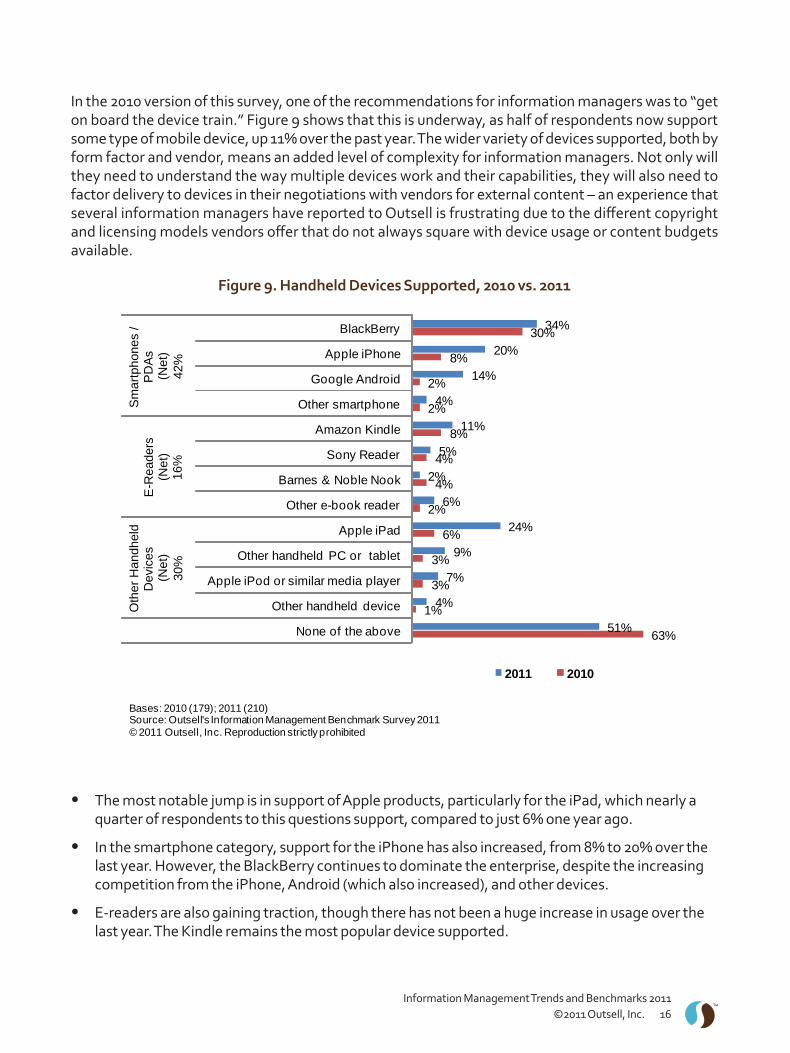
In the 2010 version of this survey, one of the recommendations for information managers was to “get on board the device train.” Figure 9 shows that this is underway, as half of respondents now support some type of mobile device, up 11% over the past year. The wider variety of devices supported, both by form factor and vendor, means an added level of complexity for information managers. Not only will they need to understand the way multiple devices work and their capabilities, they will also need to factor delivery to devices in their negotiations with vendors for external content – an experience that several information managers have reported to Outsell is frustrating due to the different copyright and licensing models vendors offer that do not always square with device usage or content budgets available.
Figure 9. Handheld Devices Supported, 2010 vs. 2011
The most notable jump is in support of Apple products, particularly for the iPad, which nearly a • quarter of respondents to this questions support, compared to just 6% one year ago.
In the smartphone category, support for the iPhone has also increased, from 8% to 20% over the • last year. However, the BlackBerry continues to dominate the enterprise, despite the increasing competition from the iPhone, Android (which also increased), and other devices.
E-readers are also gaining traction, though there has not been a huge increase in usage over the • last year. The Kindle remains the most popular device supported.
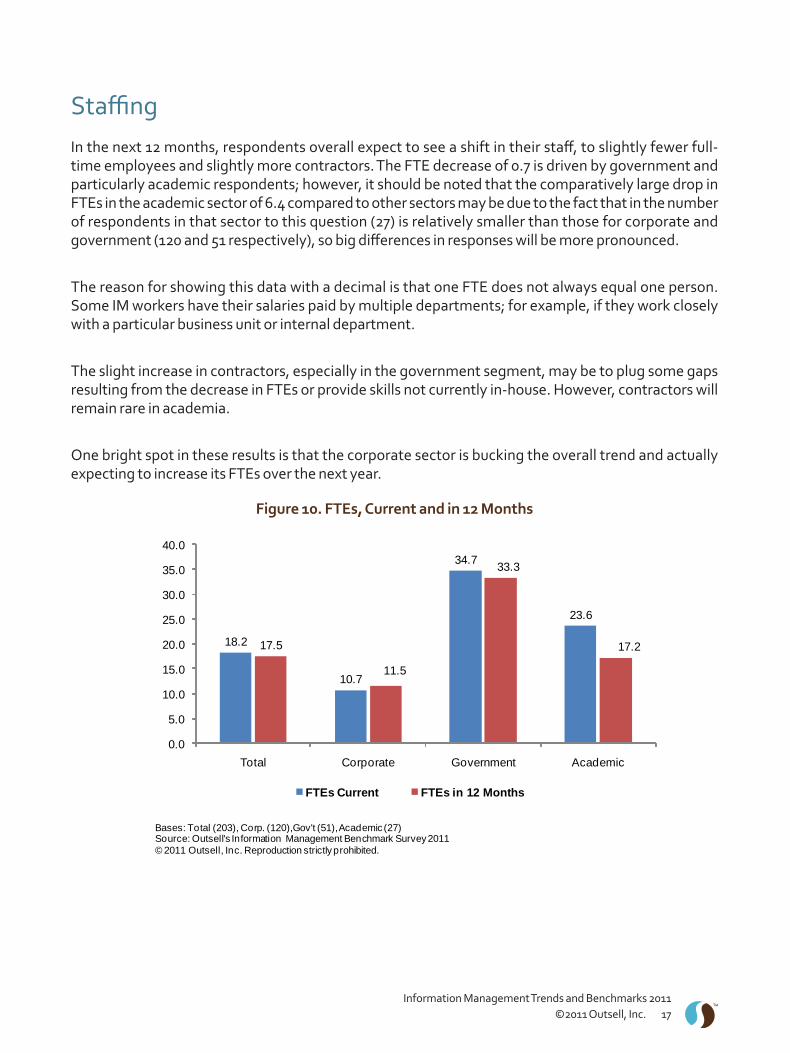
StaffingIn the next 12 months, respondents overall expect to see a shift in their staff, to slightly fewer full-time employees and slightly more contractors. The FTE decrease of 0.7 is driven by government and particularly academic respondents; however, it should be noted that the comparatively large drop in FTEs in the academic sector of 6.4 compared to other sectors may be due to the fact that in the number of respondents in that sector to this question (27) is relatively smaller than those for corporate and government (120 and 51 respectively), so big differences in responses will be more pronounced.
The reason for showing this data with a decimal is that one FTE does not always equal one person. Some IM workers have their salaries paid by multiple departments; for example, if they work closely with a particular business unit or internal department.
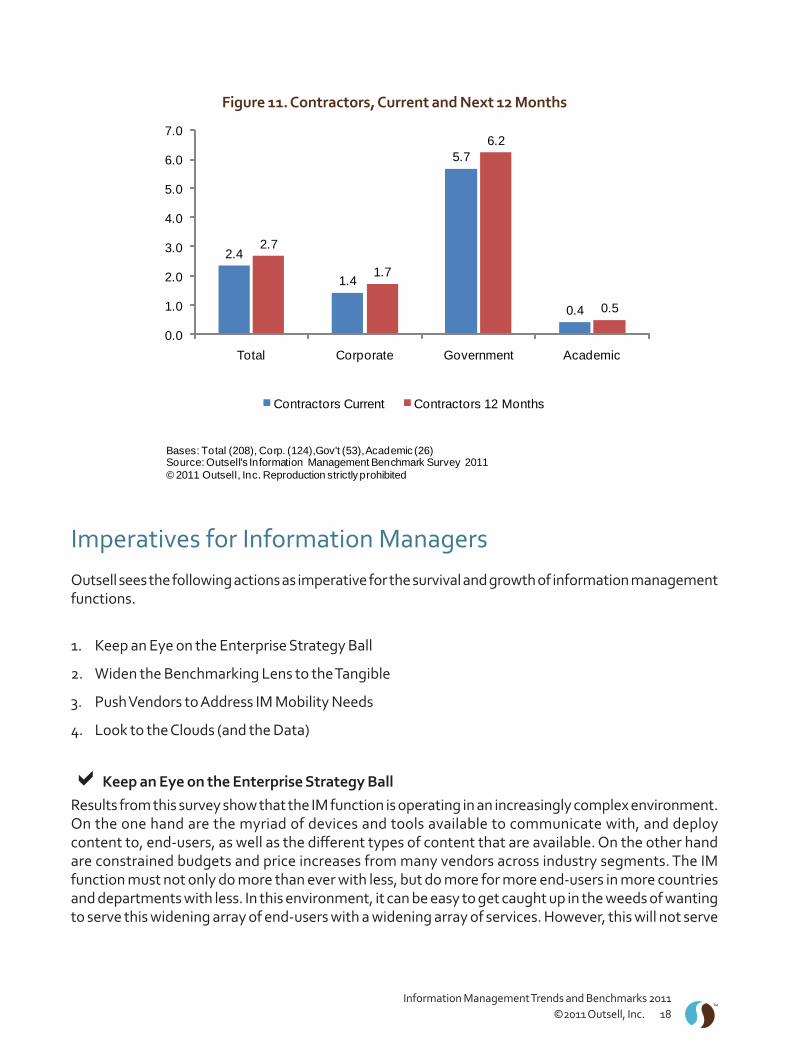
The slight increase in contractors, especially in the government segment, may be to plug some gaps resulting from the decrease in FTEs or provide skills not currently in-house. However, contractors will remain rare in academia.
One bright spot in these results is that the corporate sector is bucking the overall trend and actually expecting to increase its FTEs over the next year.
Figure 11. Contractors, Current and Next 12 Months
Imperatives for Information ManagersOutsell sees the following actions as imperative for the survival and growth of information management functions.
Keep an Eye on the Enterprise Strategy Ball1.
Widen the Benchmarking Lens to the Tangible2.
Push Vendors to Address IM Mobility Needs3.
Look to the Clouds (and the Data)4.
aKeep an Eye on the Enterprise Strategy BallResults from this survey show that the IM function is operating in an increasingly complex environment. On the one hand are the myriad of devices and tools available to communicate with, and deploy content to, end-users, as well as the different types of content that are available. On the other hand are constrained budgets and price increases from many vendors across industry segments. The IM function must not only do more than ever with less, but do more for more end-users in more countries and departments with less. In this environment, it can be easy to get caught up in the weeds of wanting to serve this widening array of end-users with a widening array of services. However, this will not serve
either IM or the enterprise well. Instead, IM should regularly take stock as to how its services are aligned with the organization’s core strategy. In the end, the decisions about IM tend to be made at the top of the organization, and changes at the top can be frequent, particularly in the private sector. IM needs to continue to demonstrate its value up as well as down and across the organization, and part of that is showing that IM activities are aligned with advancing the organization’s strategy.
aWiden the Benchmarking Lens to the TangibleThis report offers one set of useful benchmarks for IM to check how it is performing against its peers. However, there is another set of benchmarks that IM can look to in order to demonstrate its value to the organization, which is benchmarks for other departments within the same organization. One IM professional has told Outsell about how he provides data to his senior management comparing IM budgets and content costs with costs for more tangible items such as machinery and raw materials. This type of comparison might reveal some eye-opening contrasts, as $1 million on content used globally appears relatively small when compared to $40 million surplus chemicals that need to be written off for a single department. Unless one works directly and regularly with external content, it is often difficult to grasp its value, particularly if one is a procurement officer used to negotiating for trucks and computers. IMs may find it useful to explore making similar comparisons of tangible items and materials with content to better illustrate its value and relative cost.
aPush Vendors to Address IM Mobility Needs Outsell’s ongoing dialogue with information vendors about their product development process has shown that while many vendors are investing in mobile product development and ways of delivering their content to customers on mobile devices, others remain stubbornly in the model of designing products for desktop first, and mobile as an afterthought. This survey shows that enterprise mobility, and IM’s role in supporting it in its increasing complexity, is a reality that some vendors need to ramp up to meet in their product development efforts. Opportunities where IM can engage with senior executives and product managers at vendors will be necessary for vendors to get a better understanding of how important mobility is and how end-users want their content to be delivered to mobile devices. It is less likely that an account manager who appears once a year at renewal will have the influence necessary to fill the IM need for mobile services to where it needs to be; IMs will thus have to find ways to engage in a constructive dialogue with vendors on multiple levels.
aLook to the Clouds (and the Data)Outsell has identified cloud computing, analytics, and big data as three of the top trends for the information industry to watch. While IM may not be responsible for enterprise decisions on moving to these types of systems and applications, it will be important for IM to understand the strategic importance of these technology developments to their organizations as well as to the way these trends affect the information products and services to which they subscribe. End-users will be using or creating content that involves these technologies, and it is in the interest of IM to understand their potential as well as their limitations.
Outsell is the world’s only research and advisory firm focused solely on the information industry. We use a time-tested, quality-proven, top-secret blend of data, brains, community, and pizzazz to produce extraordinary value for our clients. Elite information industry executives from all over the world look to Outsell for trusted advice, bold insights, and confidential access to exclusive intelligence and decision support. Outsell has your back. You’ll stay more focused, save time, grow revenue in a fast-changing global digital environment, and sleep better at night. Guaranteed.
The information, analysis, and opinions (the “Content”) contained herein are based on the qualitative and quantitative research methods of Outsell, Inc. and its staff’s extensive professional expertise in the industry. Outsell has used its best efforts and judgment in the compilation and presentation of the Content and to ensure to the best of its ability that the Content is accurate as of the date published. However, the industry information covered by this report is subject to rapid change. Outsell makes no representations or warranties, express or implied, concerning or relating to the accuracy of the Content in this report and Outsell assumes no liability related to claims concerning the Content of this report.