INFORMATION TO USERS This manuscript has been reproduced from the microfilm master. UMI films the text directly from the original or copy submitted. Thus, some thesis and dissertation copies are in typewriter face, while others may t)e from any type of computer printer. The quality of this reproduction is dependent upon the quality of the copy submitted. Broken or indistinct print, colored or poor quality illustrations and photographs, print bleedthrough, substandard margins, and improper alignment can adversely affect reproduction. In the unlikely event that the author did not send UMI a complete manuscript and there are missing pages, these will be noted. Also, if unauthorized copyright material had to tie removed, a note will indicate the deletion. Oversize materials (e.g., maps, drawings, charts) are reproduced by sectioning the original, beginning at the upper left-hand comer and continuing from left to right in equal sections with small overiaps. Photographs included in the original manuscript have been reproduced xerographically in this copy. Higher quality 6" x 9" black and white photographic prints are available for any photographs or illustrations appearing in this copy for an additional charge. Contact UMI directly to order. ProQuest Information and Learning 300 North Zeeb Road, Ann Arbor. Ml 48106-1346 USA 800-521-0600
Transcript
INFORMATION TO USERS
This manuscript has been reproduced from the microfilm master. UMI films
the text directly from the original or copy submitted. Thus, some thesis and
dissertation copies are in typewriter face, while others may t)e from any type of
computer printer.
The quality of this reproduction is dependent upon the quality of the
copy submitted. Broken or indistinct print, colored or poor quality illustrations
and photographs, print bleedthrough, substandard margins, and improper
alignment can adversely affect reproduction.
In the unlikely event that the author did not send UMI a complete manuscript
and there are missing pages, these will be noted. Also, if unauthorized
copyright material had to tie removed, a note will indicate the deletion.
Oversize materials (e.g., maps, drawings, charts) are reproduced by
sectioning the original, beginning at the upper left-hand comer and continuing
from left to right in equal sections with small overiaps.
Photographs included in the original manuscript have been reproduced
xerographically in this copy. Higher quality 6" x 9" black and white
photographic prints are available for any photographs or illustrations appearing
in this copy for an additional charge. Contact UMI directly to order.
ProQuest Information and Learning 300 North Zeeb Road, Ann Arbor. Ml 48106-1346 USA
800-521-0600
STUDY OF VORTEX DYNAMICS IN HIGH TEMPERATURE
SUPERCONDUCTORS USING THE CORBINO GEOMETRY
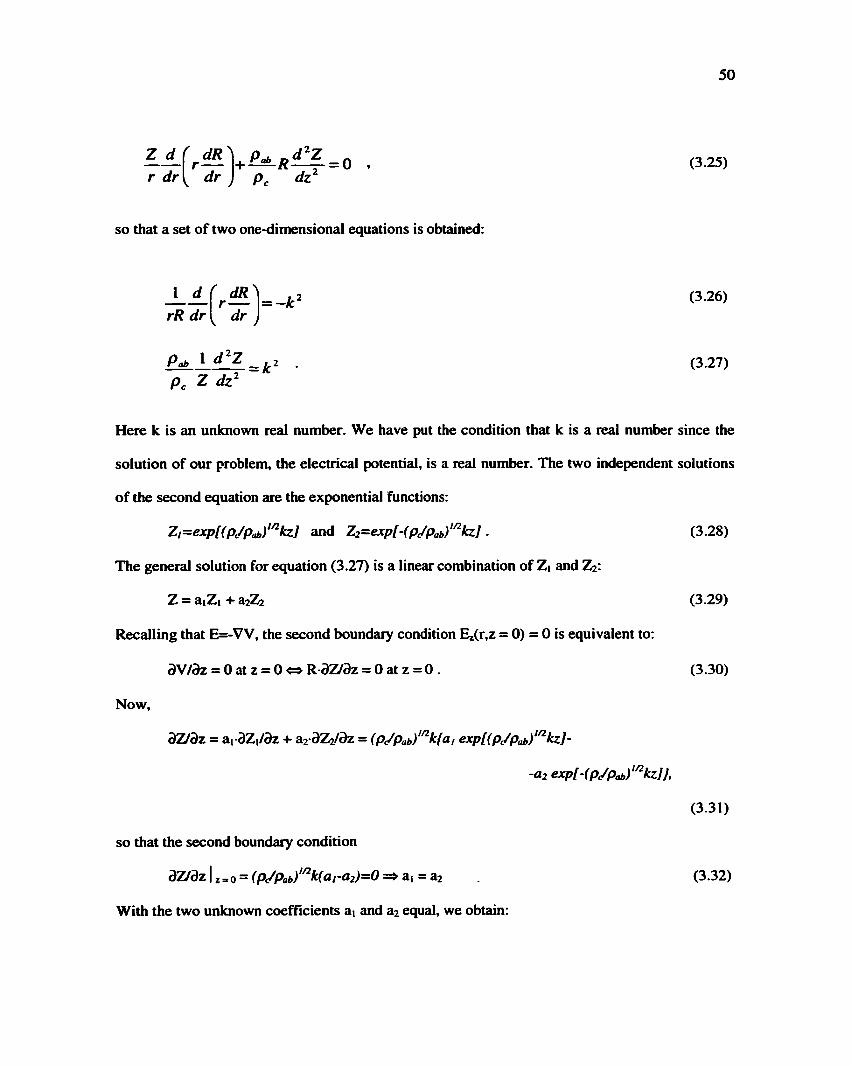
BY
ANAMAZILU M.S., University of Ulinois at Chicago, Chicago, 2000
THESIS
Submitted as partial fulfillment of the requirements for the degree of Doctor of Philosophy in Physics
in the Graduate College of the University of Dlinois at Chicago, 2001
Chicago, Dlinois
UMI Number 3032797
®
UMI UMI Microform 3032797
Copyright 2002 by Bell & Howell Information and Learning Company. All rights reserved. This microform edition is protected against
unauthorized copying under Title 17, United States Code.
Bell & Howell Information and Learning Company 300 North Zeeb Road
P.O. Box 1346 Ann Arbor. Ml 48106-1346
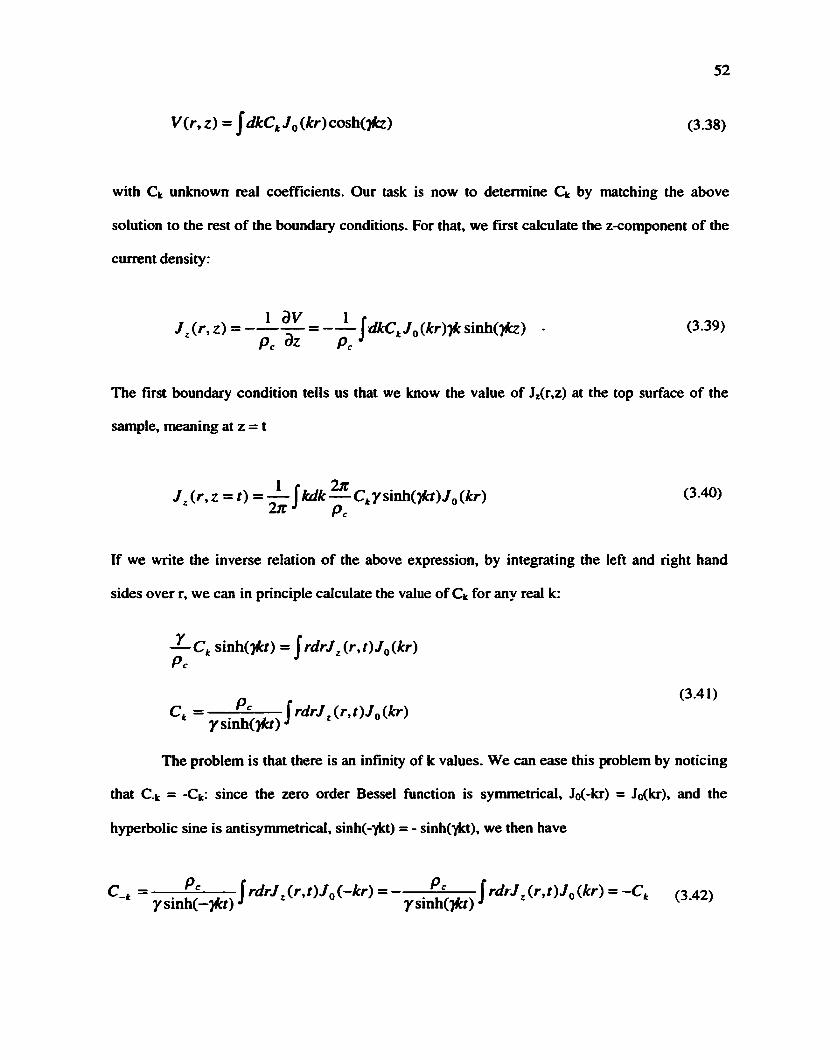
THE UNIVERSITY OF ILLINOIS AT CHICAGO Graduate College
CERTIFICATE OF APPROVAL
: - r / V r /
I hereby recommend that the thesis prepared under my supervision by ANA MAZILU
entitled STUDY OF VORTEX DYNAMICS IN HIGH TEMPERATURE
SUPERCONDUCTORS USING THE CORBINO GEOMETRY
be accepted in partial fulfillment of the requirements for the degree of DOCTOR OF PHILOSOPHY
/ concur with this recommendation
(A ? L Adviser (Chairperson of Defense Commitlee)
Departiront Hrad/Chair
Recommendaiion concurred in: j
i-cj Members of
Thesis or
Dissertalion
Defense
Comminee
UlC University of Illinois at Chicago
This thesis is dedicated to my parents, R. and D.-H., who lead my steps towards high education and to my husband. P., without wh^m my work would have never been completed.
iii
ACKNOWLEDGEMENTS
I would like to thank my committee, J. C. Campuzano, Jim Kouvei, John Marko, Hugo
Safar and Andreas Schroeder, for their support and assistance. I would like to bring special thanks
to my advisor, Andreas Schroeder, who corrected my thesis and guided me throughout my last
research years. I would also like to acknowledge Hugo Safar and Daniel Lopez for introducing
me to experimental vortex physics. This work could have not been completed without the help
and support provided by Wai-Kwong Kwok and George Crabtree from Materials Science
Division, Argonne National Laboratory, where I improved my experimental skills and expanded
my knowledge. The theoretical calculations presented in this thesis would have never been done
without the help Alex Koshelev. I would like to thank Maria Cristina Marchetti for her many
encouraging words and for sharing her ideas with me. There are many others who have been
helpful in my professional development; Andra Petrean, Goran Karapetrov, Bob Olsson, Helmut
Claus, ValentinaTobos, Lisa Paulius, Daniel Rosenmann, Reginald Ronningen. Thank you all!
iv
TABLE OF CONTENTS
CHAPTER PAGE
1. INTRODUCTION I
2. MATERIALS AND DESCRIPTION OF EXPERIMENTAL SETUPS 9 2.1 Introduction 9 2.2 Materials 10
3. THEORY OF THE CORBINO AND FOUR-PROBE GEOMETRIES 27 3.1 Introduction 27 3.2 Description of the Standard Four-probe Geometry 27 3.3 Description of the Corbino Geometry 31 3.4 Analysis Basis for the Corbino Data 37 3.5 Hydrodynamic Treatment of the Resistivity 41 3.6 Anisotropic Resistivity 44
4. STUDY OF THE SURFACE BARRIERS USING A CORBINO DISK 58 4.1 Introduction 58 4.2 BSCCO 2212 Overview 58 4.3 Quality Check and Experiment Description 64 4.4 Experimental Results and Interpretation 68
5. EFFECTS OF THE COLUMNAR DEFECTS ON THE TRANSPORT PROPERTIES OF HTS 73 5.1 Introduction 73 5.2 Experiment description 74 5.3 Experimental Results 76
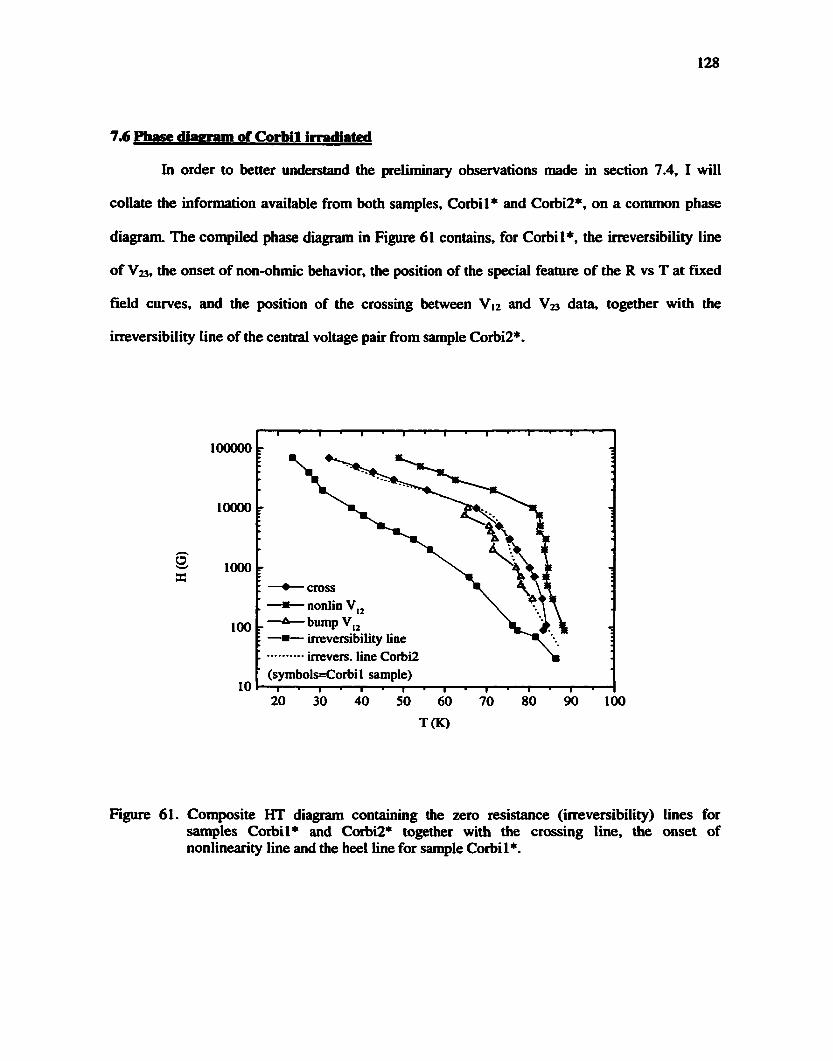
7. MEASUREMENTS OF VORTEX SHEAR VISCOSITY IN IRRADIATED CORBINO SAMPLES 105 7.1 Introduction 105 7.2 Irradiation Experimental Details 108 7.3 Theoretical Overview Ill 7.4 Observations from Measurements on Corbi 1 Irradiated 117 7.5 Irreversibility Line of Sample Corbi2 Irradiated 125 7.6 Phase Diagram of Sample Corbil Irradiated 128
V
TABLE OF CONTENTS (continued)
CHAPTER PAGE
7.7 The Healing Length 132
8. CONCLUSIONS 140
APENDK 144
CITED LITERATURE 146
VTTA 155
vi
LIST OF FIGURES
1. Temperature program for growth of single crystals of Y6a2Cu307-5 in gold crucibles 11
2. Arrangement of atoms in the Cu-O chains in twinned YBCO 12
3. Picture of a partially twinned YBCO single crystal 13
4. Picture of a fiilly detwinned YBCO single crystal 14
5. Arrangement of the Cu and O atoms before and after detwinning 15
6. Energy lost by a Au bombarding atom per unit length for various types of target materials.. 16
7. Drawing of the e cryostat, dewar and superconducting magnet 19
8. Experimental setup used for the crystal irradiation 24
9. Four-probe contact configuration used in sensittive transport experiments 28
10. Vortex dynamics in a standard bar geometry 29
11. Corbino disk configuration used in transport experiments 32
12. Current distributions in the Corbino disk geometry 32
13. Vortex dynamics in a Corbino disk geometry 34
14. Drawing and picture of a typical Corbino sample 38
15. Vortex velocity distribution in a Corbino disk geometry 41
16. Cross section of a Corbino disk showing the current distribution for BSCCO 2212 46
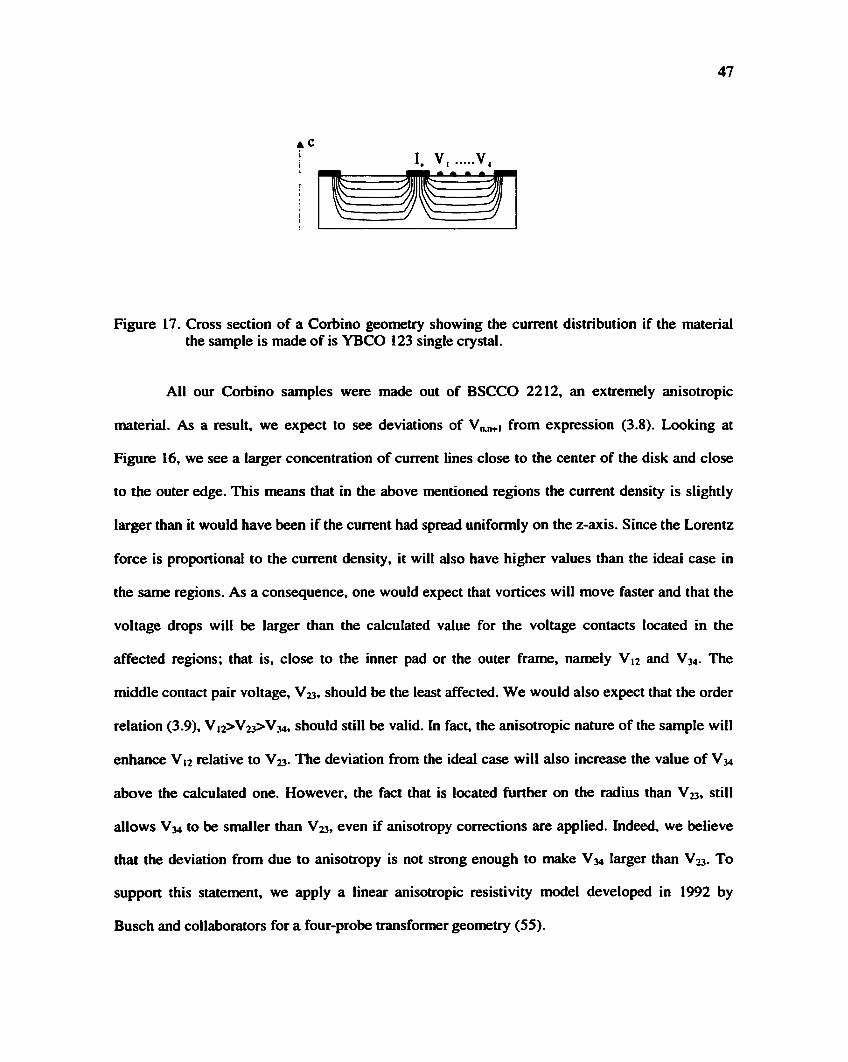
17. Cross section of a Corbino disk showing the current distribution for YBCO 123 47
18. 2D dimension diagram for a typical Corbino sample 49
19. Radial dependence of the ideal and corrected electrical potentials 54
20. Resistance versus temperature data measured on sample Corbil on all contact pairs at a
magnetic field of IT 55
21. Temperature dependence of the normalized electrical resistance of sample Corbil measured
at various applied magnetic fields 56
vii
22. Electrical resistance versus temperature measured on a BSCCO 2212 single crystal showed in
linear scale 59
23. Electrical resistance versus temperature measured on a BSCCO 2212 single crystal showed in
semilogarithmic scale 60
24. Drawing of a vortex and its image due to the boundary condition at the surface of the
superconductor 62
25. Initial stage of the vortex penetration at the superconductor's edge 64
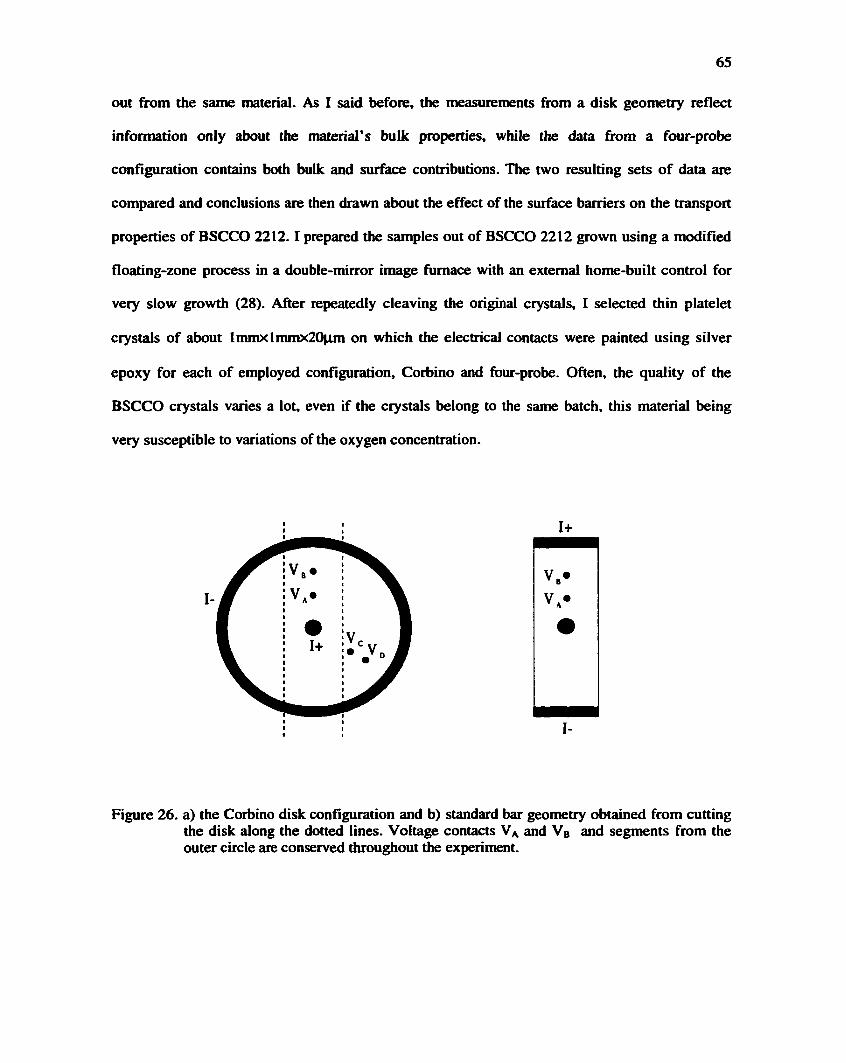
26. Description of the technique used in the surface barrier experiment 65
27. Normalized resistance measured in a BSCCO Corbino sample on radial and crossed pairs...67
28. Comparison of Corbino and four-probe data for the first Corbino sample 68
29. Comparison of Corbino and strip data for the second and third Corbino samples 69
30. Field dependence of the activation energy and irreversibility lines for Corbino and
rectangular samples 70
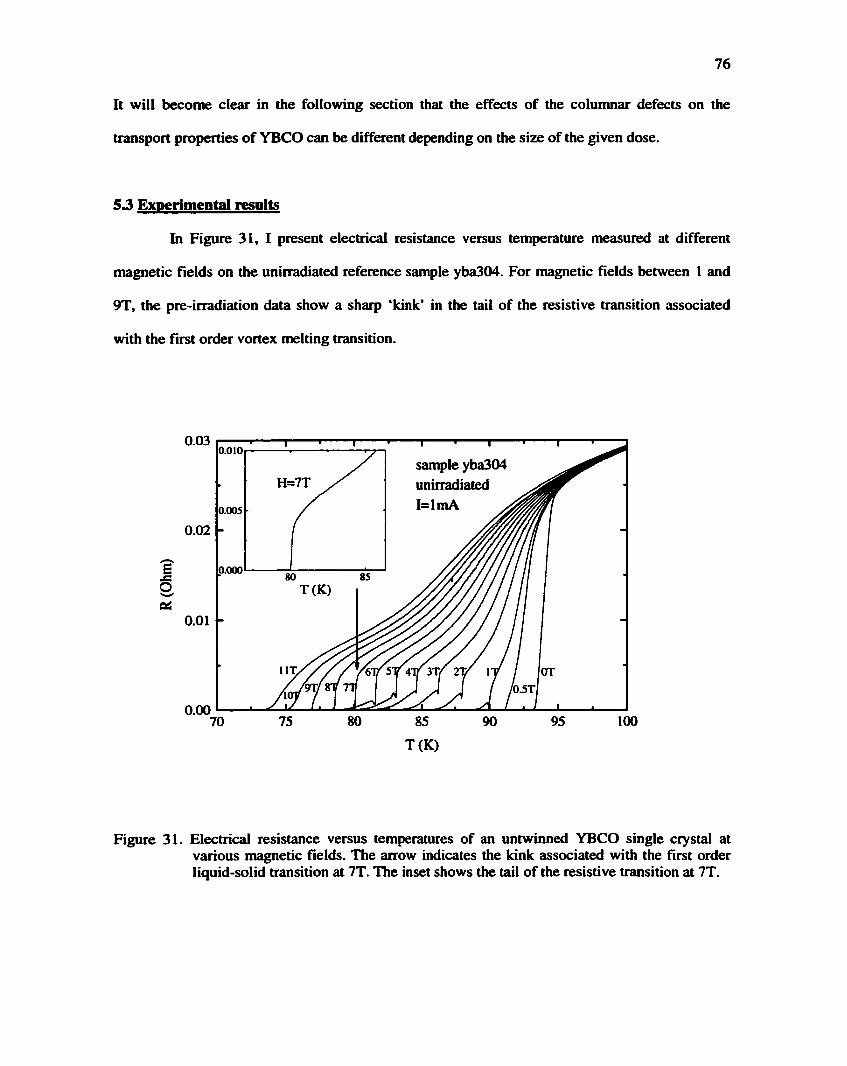
31. Electrical resistance versus temperature measured on a pristine YBCO 123 single crystal at
various applied magnetic fields 76
32. Electrical resistance versus temperature data measured on YBCO crystals irradiated with
0.05T and 0. IT doses 78
33. Comparison of the normalized electrical resistances measured in the vortex liquid state on the
pristine and low dose samples 79
34. Magnetization loops on an untwinned YBCO crystal before and after irradiation with a dose
of0.15T 81
35. Electrical resistance data measured on an YBCO crystal irradiated with IT dose 82
36. Electrical resistance data measured on an YBCO crystal irradiated with 6T dose 83
37. Melting and irreversibility lines for untwinned YBCO single crystals after irradiation 84
38. Melting and irreversibility lines for twinned YBCO thick films after irradiation 86
39. Typical Corbino sample used in the vortex viscosity experiment 88
viii
40. Electrical resistance versus temperature of a Corbino sample at various magnetic fields 89
41. Temperature dependence of two adjacent voltage pairs of sample Kado4 showing evidence of
correlated motion 91
42. Temperature dependence of two adjacent voltage pairs of sample Corbil showing evidence of
correlated motion 92
43. Temperature dependence of two adjacent voltage pairs of sample orbi2 showing evidence of
correlated motion 93
44. IV characteristics for all radial pairs of sample Corbil at different temperatures 95
45. Normalized electrical resistance measured on sample Corbil 96
46. Resistance data showing weak nonohmic behavior of the vortex liquid state at 0.01 IT in
sample Corbil 98
47. Resistance data showing weak non-ohmic behavior of the vortex liquid state at 0.05T and IT
in sample Corbil 99
48. Phase diagram of pristine sample Corbi 1 102
49. Drawing of sample and mask used in the boundary irradiation experiment 109
50. Explanatory drawing of the boundary irradiation setup 110
51. Theoretical radial profile of the electrical field in a Corbino sample with irradiated boundaries
for various viscosity strengths 115
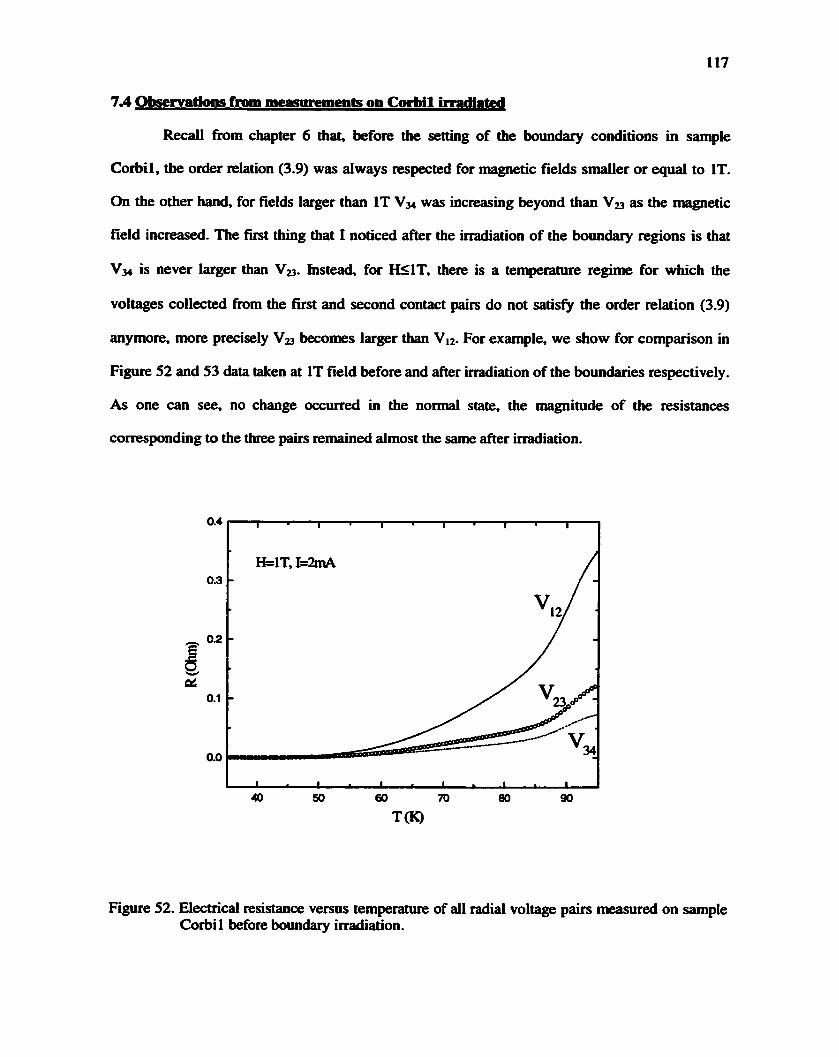
52. Resistance data measured on sample Corbil at IT before boundary irradiation II7
53. Resistance data measured on sample Corbil at IT after boundary irradiation 118
54. Experimental radial proflle of the electrical resistance of irradiated sample Corbi 1 119
55. Comparison of Corbil data taken before and after irradiation at 0.5T 120
56. Resistance data taken on all three radial contacts showing an anomalous feature close to the
boundaries 122
57. Resistance data showing strong non-ohmic behavior of the vortex liquid state at IT in sample
Corbil with irradiated boundaries 123
ix
58. Resistance data showing ohmic behavior of the vortex liquid state at IT in the fully irradiated
sample Corbi2 124
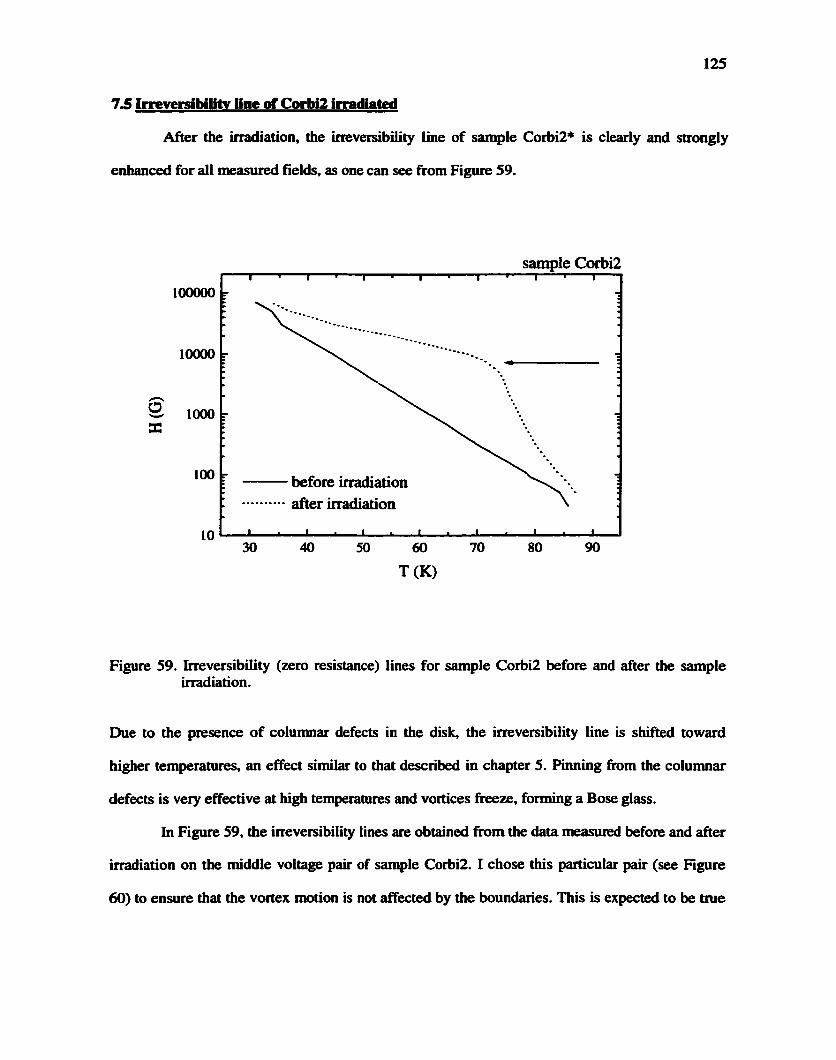
59. Irreversibility lines of sample Corbi2 before and after irradiation 125
60. Voltage contact configuration for sample Corbi2 126
61. Composite phase diagram for sample Corbi 1 with irradiated boundaries 128
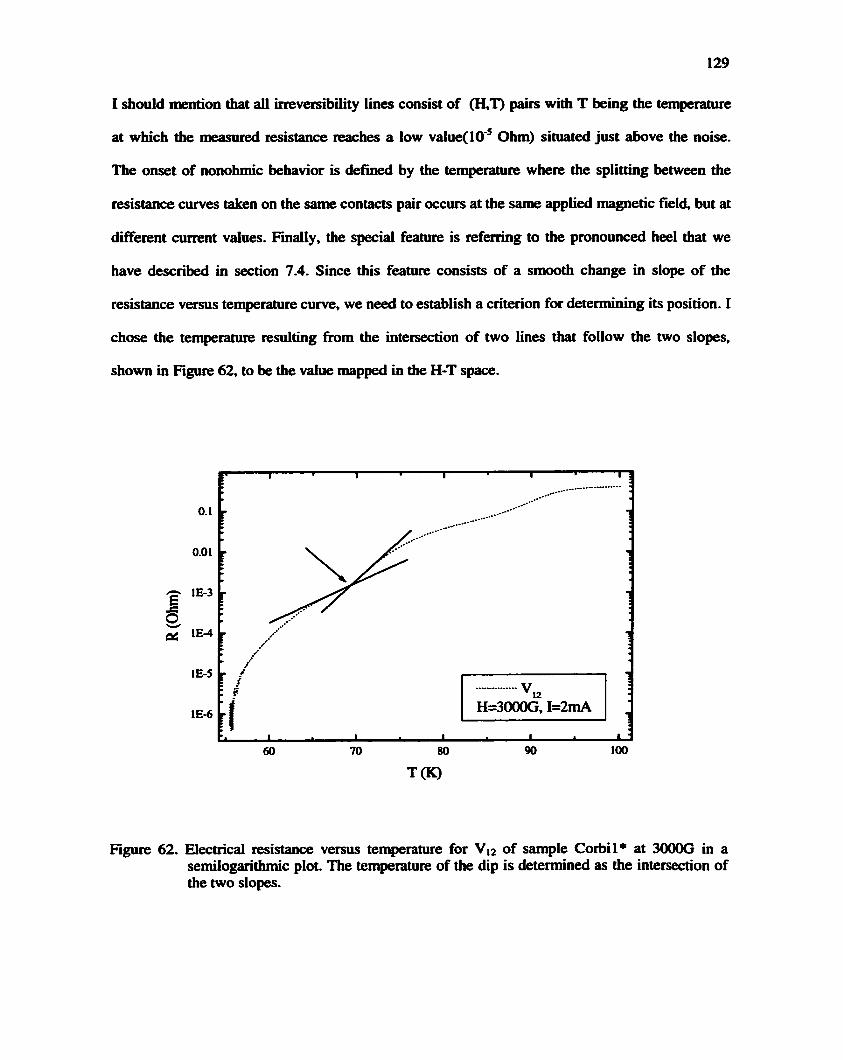
62. E)etermination of the position of the anomalous feature 129
63. Comparison between the irreversibility lines of samples Corbil and Corbi2 determined before
and after irradiation 130
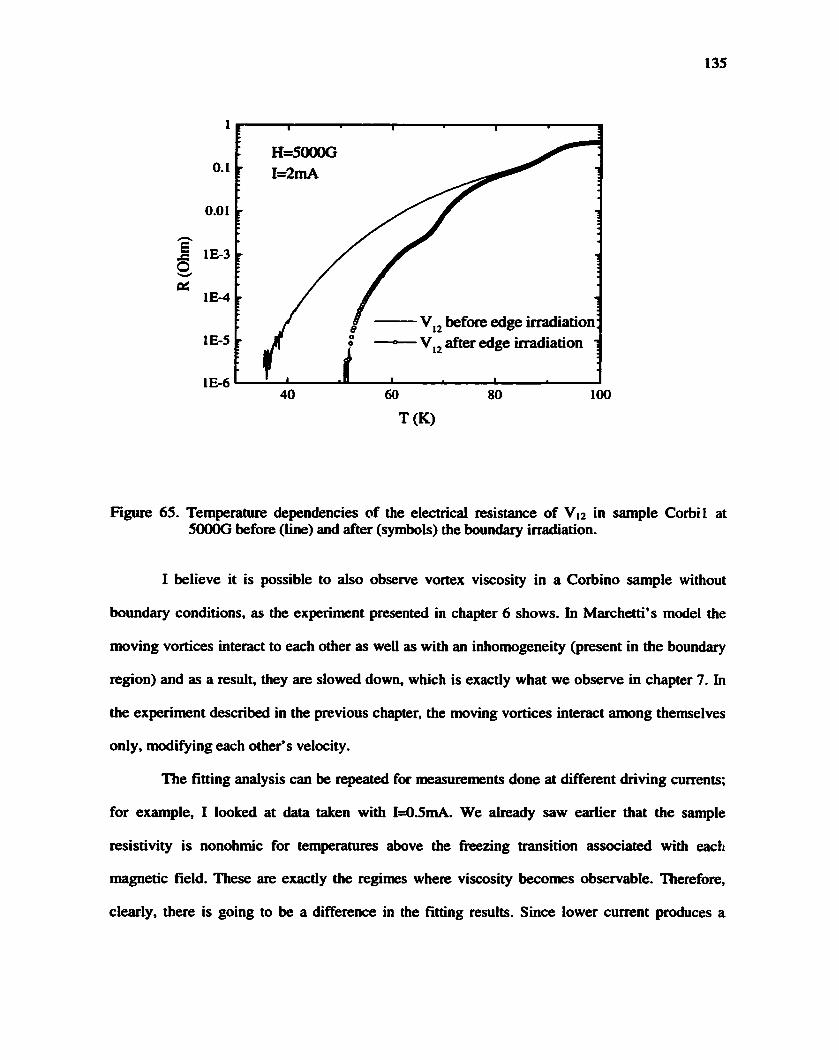
64. Estimated values and fittings of the healing length at 0.5T 134
65. Comparison of normalized resistance data taken at 0.5T on sample Corbil before and after
irradiation 135
66. Correlation length estimated from data taken with different electrical currents at 0.5T 136
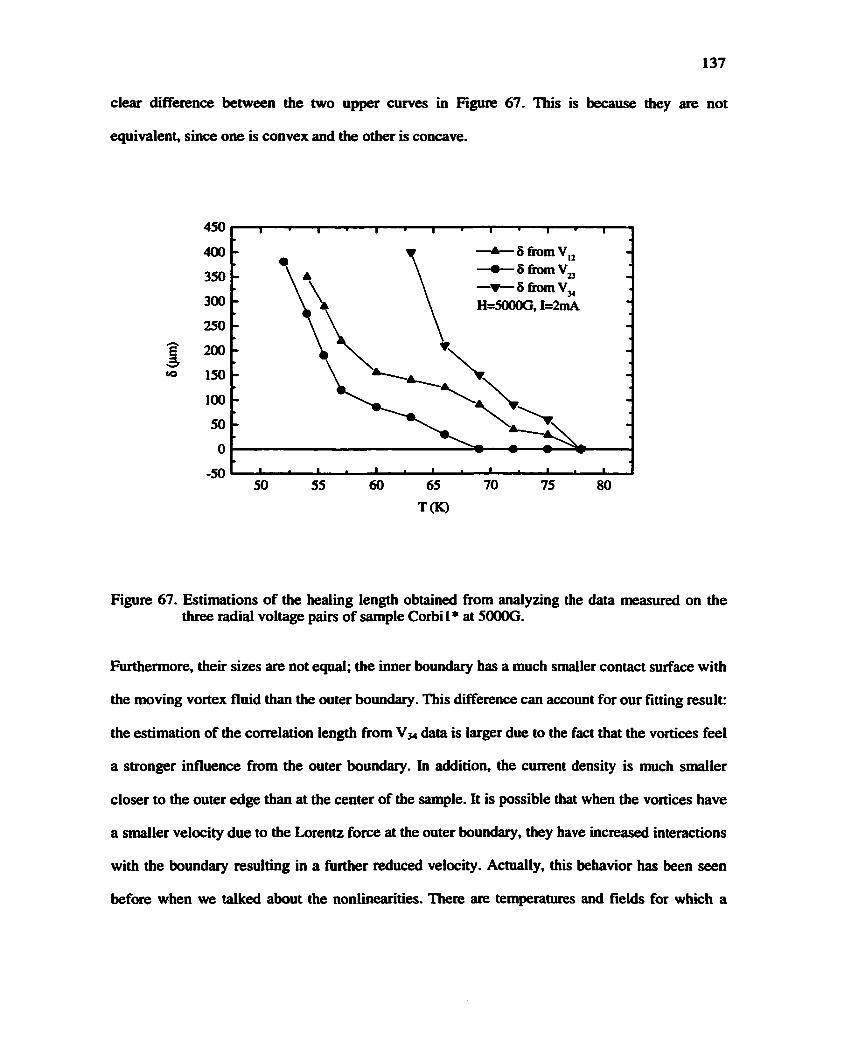
67. Healing length estimations from data measured on all radial pairs at 0.5T 137
68. Correlation length estimated for various magnetic field values 138
X
LIST OF ABBREVIATIONS
LTSC Low Temperature Superconductor
HTS, HTSC High Temperature Superconductor
BSCCO BiaSraCaCuaOg
YBCO YBaiCuaO?^
xi
SUMMARY
A study of the transport properties of Bi2Sr2CaCu208, a high temperature
superconducting compound, was made using a special contact configuration called Corbino disk
geometry. Numerous Bi2Sr2CaCu208 single crystals were cleaved and prepared for the transport
measurements that were carried out in a He** cryostat provided with a superconducting magnet of
12T maximum field capability. The transport experiments consisted of measuring the samples' ac
resistivity at various temperature and magnetic fields. Some of the Corbino samples were
irradiated with high energy heavy ions in order to study the influence of the irradiation on the
vortex dynamics of the superconducting materials.
The transport data of Bi2Sr2CaCu20g Corbino samples have been compared with the
measurements obtained firom a Bi2Sr2CaCu20g standard bar sample patterned in the four-probe
configuration. No significant difference has been found, indicating that the effect of the surface
barriers on the transport properties of the studied material is negligible.
The electrical resistance data from three Bi2Sr2CaCu208 Corbino samples with multiple
voltage contacts showed evidence of transverse vortex correlation due to shear viscosity in the
vortex liquid state. Two of these specimens were irradiated with 2Gev Au ions and then measured
ageiin. The samples still show evidence of vortex viscosity. Due to the presence of the irradiated
boundaries, information about the correlation length associated with the shear viscosity could be
extracted for the first time.
xii
1. INTRODUCTION
Since the discovery of superconductivity in 1911 by H. Kamerlingh Onnes (I),
superconductors have been the subject of considerable study, because of their special
characteristics of perfect diamagnetism and zero electrical resistivity when cooled below a
critical temperature Tc- After more careful investigations, it was established that a
superconducting material can expel the magnetic field only if its magnitude is below a critical
value He (2). Also, these materials are perfect conductors only if the electrical current applied to
them does not exceed a critical value ]« (3).
The perfect diamagnetism, or the Meissner effect (2), was explained by the London
equations (3), in which an important length scale for the superconductor K the penetration
length, is defined. This characteristic length gives a measure of the distance on which the
magnetic field is attenuated inside the material.
From the Ginzburg-Landau theory of superconductivity (4) arises the second important
length scale: the coherence length, which characterizes the distance on which
superconductivity can be recovered. In this theory, Ginzburg and Landau introduced the order
parameter \|f, whose magnitude indicates the type of the state, superconducting or normal, at each
point of the material. If, for some reason at some point in the sample, the superconductivity is
destroyed (>tf=G), the coherence length is the distance around this point on which the magnitude
of the order parameter recovers back to the value characteristic of the superconducting state.
For magnetic fields higher than the critical Held He, superconducting materials cannot
totally expel the magnetic field. The magnetic field then starts to penetrate the sample, forcing
parts of it to become normal. The energy of the normal-superconductor interface has been
calculated and a very interesting consequence follows. Since the interface energy is proportional
1
2
to the difference (^-X), it turns out that the relation between the two lengths is very important to
the physics of superconductors. If the coherence length is larger, then the interface has a positive
energy, which will make its formation unfavorable from the energetic point of view. The
materials that satisfy are called type I superconductors.
If instead, the penetration length is larger (^<A.), then the interface energy is negative and
it will become favorable for the system to form as many interfaces as necessary for bringing the
system to an equilibrium state. Using the flux quantization rule (5), which states that the
magnetic flux which penetrates the sample is quantized (4>=nOo, where <t>o=2.07-10'^Gcm^ is the
flux quantum and n is an integer), the result is that the magnetic fleld will enter the sample as
bundles of field lines called vortices, each of them carrying only one flux quantum. This way, the
maximum number of interfaces will appear to reduce the overall energy. These materials form
the type II superconductors group and they exhibit a new state, intermediary between the
Meissner and the normal state, called the mixed state.
There is a repulsive interaction between the flux lines, which forces the vortices arrange
themselves in a triangular lattice, called the Abrikosov lattice (6). Since it is now possible for the
sample to be penetrated by the magnetic fleld without becoming normal. He has no physical
meaning anymore. Instead, one has to deflne the limits for the mixed state; is called
the lower critical fleld below which the material expels the vortices, and Hc2=^o/27C^^ is called
the upper critical fleld above which the material behaves like a normal metal and is completely
penetrated by the magnetic fleld.
One can also distinguish two categories of type-II superconductors that are related to the
temperature at which each material becomes superconductor - the critical temperature, Tc. There
are the low Tc superconductors (LTSC) with critical temperature values up to -30K and there are
high Tc superconductors (HTSC) with critical temperatures from 30K up to 130K. Also, the
3
coherence length in HTSC is smaller than the one in LTSC, so that the corresponding Hc2 is
larger. A high critical temperature and a large Hc2 ensures that the mixed state in HTSC provides
us with a wide range of temperature and magnetic fields to study its properties.
In the presence of a transport current, the flux tube experiences a Lorentz force Jx<t>o/c
per unit length. In a response to this driving force, the vortices will move inside the sample and
in doing so they dissipate energy (7). The zero resistance, or zero dissipation state, is achieved
only in the situation when vortices do not move at all. For this, pinning centers are needed in the
material to impede the vortex motion. Fortunately, any imperfection in the underlying crystalline
structure acts as a pinning site. No matter what kind of defects there are in the sample, the
pinning produced by them is effective only if vortices form a solid phase; that is, if there are
strong bonds between the flux lines.
The qualitative difference between the electrical properties of LTSC and HTSC is
determined by the thermal fluctuations. A LTSC material becomes superconductor at a
temperature where the vortices form a solid state, more precisely a lattice (8); they immediately
get pinned by the defects present in the material so that the electrical resistance is zero. In a
HTSC, the elevated temperatures keep the vortices in a disordered liquid-like state so that
electrical dissipation is finite at all currents. When eventually the resistance vanishes, a phase
transition has occurred as the vortices freeze into a solid phase (9).
In summary, in the magnetic phase diagram of HTSC, there is a wide field and
temperature range in which there exist novel liquids and solids consisting entirely of magnetic
flux lines that possess many of the characteristics associated with normal matter. The vortex
liquid to solid phase transition can take place discontinuously, through a first-order phase
transition (10-14), when the formed solid is a vortex lattice, or continuously, through a second or
higher order phase transition, in which case the vortex solid state is completely disordered. First
4
order phase transitions occur in clean high-Tc superconducting samples with a low level of
disorder. In such systems, phase transitions will be of first order at low magnetic fields, but they
will become of second order at high fields. The crossover is determined by the upper critical
point, which is fiirther determined by the amount of disorder present in the crystal.
Vortices interact with the environment in a number of controllable ways. One can vary
the density of vortices present in a sample by modifying the applied external magnetic field.
They can be localized or pinned in place by defects in the underlying crystal or can be thermally
set in motion about their equilibrium position by heat. They can also be driven to move in a
preferential direction by an applied current. Several novel vortex glassy phases can be obtained
by freezing the vortex liquid in a variety of defect environments. The environment could be a
random set of point defects, created by irradiating the sample with protons (IS) or electrons (16),
line defects created by heavy ion irradiation (17), or may be even a periodic defect array, which
can be created on the crystal's surface by magnetic decoration (18), vapor deposition (19) and
even by etching (20), in which case an array of holes (antidots) is produced. All of these types of
defects can be introduced in the system in a controlled way. The vortex matter can be studied in a
number of experimentally controllable ways which may not all be possible in atomic solids. One
such example is the transformation of a first order transition into a continuous one in the
presence of disorder. This problem has theoretically been studied in magnetic systems, however
related experiments have been hampered due to the difficulty in introducing quenched disorder
into the system in a controlled way. Thus, the vortex matter can be a powerful tool for the study
of real matter and also to provide a platform to investigate fundamental problems in the physics
of phase transitions.
One of the most often encountered practical applications of the superconductors is the
superconducting magnet, which is capable of producing magnetic fields much larger than a
regular solenoid carrying the same electrical current. Magnetic resonance imaging (MRI) is
5
playing an ever-increasing role in diagnostic medicine. The intense magnetic fields needed for
these instruments require the use of superconducting magnets. Despite the fact that there are
many technological applications of LTSCs, their use is still limited due to the fact that they need
liquid helium, which is expensive, in order to be cooled. The discovery of HTSC in 1986 (21)
created the possibility of even more technological applications; superconducting generators and
motors (22), magnetic shielding devices, energy storage (23), and microwave devices (24). Since
the cuprate materials can remain superconducting up to higher temperatures, liquid nitrogen,
which is cheaper and easier to use, can be used for cooling instead of liquid helium. However,
due to their complex structure, the cuprates have a high manufacturing cost and often develop
inhomogeneities, which produce a change in their local superconducting properties - a feature
that makes them less commercially viable. Recently discovered, the intermetallic compound
MgBz with a critical temperature of 39K (25) - high enough to be reached by closed cycle coolers
- seems to offer a simpler crystalline structure that could be more easily controlled while
manufacturing superconducting devices. However, since this material was just discovered, much
research is needed before possible commercial use.
The technological applications of HTSC are primarily hindered by their low critical
current densities - the maximum current the material can still carry before losing its
superconducting properties. Most technological applications require large current densities in
applied magnetic fields. The magnetic behavior of the high temperamre superconductors has
been the subject of intense study since their discovery. It was found that by increasing the
number of defects in the sample, the critical current is increased. The interaction between
vortices and defects is not yet completely understood. Due to the fact that it allows control over
the number and type of defects introduced, radiation damage (17) is now extensively used to
study the vortex-defect interaction.
6
Most of the electrical transport experiments conducted on HTSC employ samples
prepared in the four-probe configuration. The subject of this thesis is to present and analyze
issues of the vortex dynamics involved in a different kind of geometry called the Corbino disk
geometry. I believe this geometry is special, because it can elucidate aspects of the vortex
dynamics that cannot be observed by using a standard bar geometry. Both contact configurations,
Corbino and four-probe, are described in chapter 3. A comparison between the two sample
geometries is made together with a discussion of the advantages and disadvantages of the
Corbino disk over the four-probe configuration. The material used for all Corbino disk
experiments from this thesis was Bi2Sr2CaCu20g (BSCCO 2212), a layered cuprate with a critical
temperature of approximately 88K in the optimally doped state. Due to its layered structure, this
high-Tc superconductor is highly anisotropic, having an electrical resistivity in the direction
perpendicular to the CuOa layers four orders of magnitude larger than the resistivity along the
layers. This should be a concern when experiments involving samples with nonuniform current
distributions, like the Corbino disk geometry, are carried out. Since the current distribution may
affect the experimental transport results, I have developed a model for the estimation of these
effects, which is presented in chapter 3.
Chapter 2 contains details about the growth recipes and sample preparation procedures
for the two materials used in this thesis, BSCCO and YBaaCuaOr^s (YBCO 123) single crystals. It
also contains descriptions of the measurement system used for acquiring all data presented in this
work and of the irradiation setup and procedure used for exposing the superconducting samples
to the heavy ion beam.
Chapters 4,6 and 7 describe the Corbino disk experiments and they represent the main
results of this work. Chapter 4 contains the study of the surface barrier effects on the transport
properties of BSCCO 2212 using Corbino disk and standard bar samples (26). One of the special
7
characteristics of the Corbino geometry, which will be explained in detail in chapter 3, is that
when electrical current is applied the vortices move on closed trajectories inside the sample and
never cross the crystal edges. On the other hand, in the rectangular bar geometry the vortices
enter the sample at one edge and exit at the opposite one. Measurements performed on samples
pattemed into the two different geometries are compared and conclusions about the surface
effects are presented.
Chapters 6 and 7 have a common purpose: to show evidence of the vortex matter shear
viscosity and extract information about it from the transport data. These experiments involve
solely Corbino disk samples. The experiments exploit another important characteristic of the
Corbino configuration, namely that the current density along the disk is nonuniform due to the
geometry of the current contacts (see chapter 3). A nonuniform current density creates a
nonuniform vortex velocity distribution, which provides the possibility of studying the drag
between adjacent moving vortices. The experiment presented in chapter 6 shows that there is
transverse vortex correlation at high magnetic fields in BSCCO Corbino samples. It cannot
however, derive any numerical value for the vortex viscosity due to the fact that the experimental
data could not be fitted to the theoretical model that assumes vortex viscosity. This model solves
the equation of motion for vortex matter provided that the boundary conditions of the system are
known. The boundary conditions could not be specified for the pristine Corbino samples
measured in chapter 6.
Chapter 7 solves the problem encountered in chapter 6 by setting the boundary
conditions for the vortex motion in the Corbino geometry to zero vortex velocity. This was
achieved by irradiating the boundary regions, which coincide with the current contacts, with
high-energy heavy ions. The electrical current is fed into a Corbino sample through a point-like
contact situated in the center of the disk and is removed at the periphery of the disk. The
columnar defects produced in these regions by the irradiation pin down vortices, and therefore.
8
impose the boundary conditions. A theoretical overview of the model for the hydrodynamic flow
of the vortex matter is presented in detail. A very clear similarity is observed between the
measurements obtained after irradiation and the model predictions. From the fitting of the
transport data with the model, I extracted, for the first time, numerical values for the correlation
length for the vortex liquid in BSCCO at various temperatures and magnetic fields.
Since the crystal irradiation was used in chapter 7,1 will present a study of the effects of
the columnar defects on the properties of high-Tc superconductors in chapter S. The irradiation
technique and setup are described in chapter 2 and the experimental transport results are
presented and analyzed in chapter 5. A different number of columnar tracks were introduced into
two sets of samples constituted by four YBa2Cu3C)7.s optimally doped single crystals and three
YBCO thick films (27). The data analysis shows that the columnar defects are efficient vortex
pinning centers, which ensures the boundary conditions required for the experiment performed in
chapter 7.
9
2. MATERIALS AND DESCRIPTION OF THE EXPERIMENTAL SETUPS
2.1 Introduction
This chapter gives information about the synthesizing processes for the two
superconducting materials measured in our experiments and describes the irradiation stage
together with the electrical measurement setup. The latter was by far the most frequently used
system; most of the experimental transport data were obtained by running it continuously
throughout the year. The irradiation setup, while also very important, was used only sporadically,
every six months or more, whenever a heavy ion irradiation session was scheduled. The
cryogenic measurement system is located in the Materials Science Division at Argonne National
Laboratory and the crystal irradiation was performed eidier at the linear accelerator facility
ATLAS also at Argonne National Laboratory or at the National Superconducting Cyclotron
Laboratory (NSCL) at Michigan State University. The two types of materials used in the
electrical transport experiments presented in this work are YBCO 123 and BSCCO 2212 single
crystals, both high temperature superconductors with critical temperatures of approximately 94K
and 88K respectively. Chapter S contains results obtained firom measuring a series of optimally
doped irradiated YBCO single crystals and the conclusion of that chapter provides the motivation
for the main experiment of the thesis described in chapter 7.
The YBCO single crystal preparation was done in the laboratories of the
Superconductivity and Magnetism group, from the Materials Science Division in Argonne
National Laboratory, and it consists of a long sequence of processes. It usually takes about six fiill
weeks to obtain a good quality detwinned and polished sample ready to use in an experiment. By
quality one refers to the magnitude of the crystal's critical temperature and the width of its
superconducting transition in zero applied magnetic field. The central subject of the thesis being
the Corbino BSCCO samples, studied in chapters 4, 6 and 7, i will also talk about the way this
10
type of superconducting single crystals is produced, although I will give fewer details since the
actual growing was done by our collaborators.
2.2 Materials
2^.1 Crystal Growth
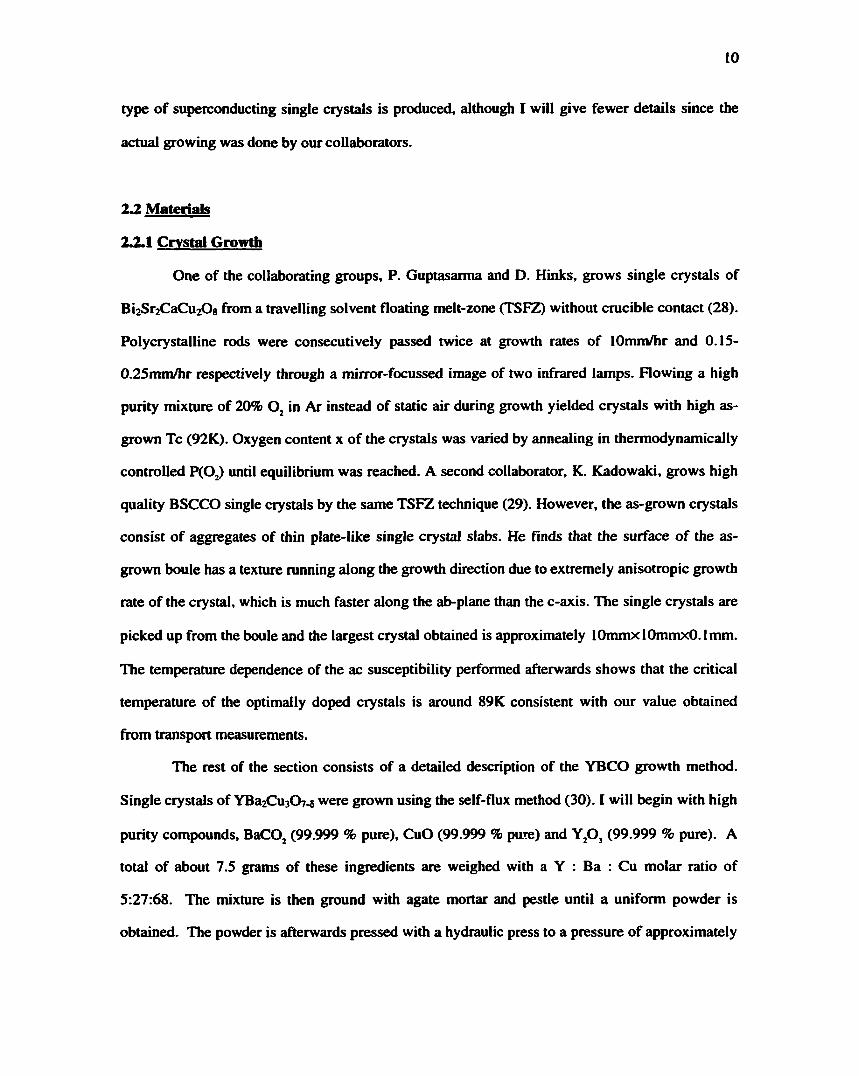
One of the collaborating groups, P. Guptasarma and D. Hinks, grows single crystals of
BiaSraCaCuiOg from a travelling solvent floating melt-zone (TSF20 without crucible contact (28).
Polycrystalline rods were consecutively passed twice at growth rates of lOmm/hr and 0.15-
0.25mni/hr respectively through a mirror-focussed image of two infrared lamps. Flowing a high
purity mixture of 20% in Ar instead of static air during growth yielded crystals with high as-
grown Tc (92IC). Oxygen content x of the crystals was varied by annealing in thermodynamically
controlled PCO^) until equilibrium was reached. A second collaborator, K. Kadowaki, grows high
quality BSCCO single crystals by the same TSFZ technique (29). However, the as-grown crystals
consist of aggregates of thin plate-like single crystal slabs. He finds that the surface of the as-
grown boule has a texture running along the growth direction due to extremely anisotropic growth
rate of the crystal, which is much faster along the ab-plane than the c-axis. The single crystals are
picked up from the boule and the largest crystal obtained is approximately lOmmxlOmmxO.Imm.
The temperature dependence of the ac susceptibility performed afterwards shows that the critical
temperature of the optimally doped crystals is around 89K consistent with our value obtained
from transport measurements.
The rest of the section consists of a detailed description of the YBCO growth method.
Single crystals of YBazCusOr.^ were grown using the self-flux method (30). I will begin with high
purity compounds, BaCO^ (99.999 % pure), CuO (99.999 % pare) and Y^O, (99.999 % pure). A
total of about 7.5 grams of these ingredients are weighed with a Y : Ba : Cu molar ratio of
5:27:68. The mixture is then ground with agate mortar and pestle until a uniform powder is
obtained. The powder is afterwards pressed with a hydraulic press to a pressure of approximately
11
3000 psi (pounds per square inch) into a 3/4" diameter, 1/4" tall pellet. The pellet is then placed in
the center of a 3" x 3" 1.5" gold crucible and the crucible is introduced in a box furnace, centered
at 10" from the fiimace door, in order to avoid temperature gradients. The crucible is heated up
from room temperature to a maximum of 983 "C and then cooled slowly.
Figure 1 shows the temperature program used to grow the crystals in the gold crucibles.
The program takes about 6 days to complete. When the program ends, the gold crucible is pulled
out of the fiimace and the single crystals are visible in the crucible. The cylindrical pellet in the
center of the cmcible has partially melted and then solidified and it remains at the center of the
cracible. The crystals grow everywhere on the bottom of the cmcible, but mostly in the comers of
the cmcible.
1200
ramp
meltmg
i 400
-20 0 20 40 60 80 100 120 140 160
Time (hours)
Figure 1. Temperature program for growth of single crystals of YBajCUjO^ jin gold cmcibles.
12
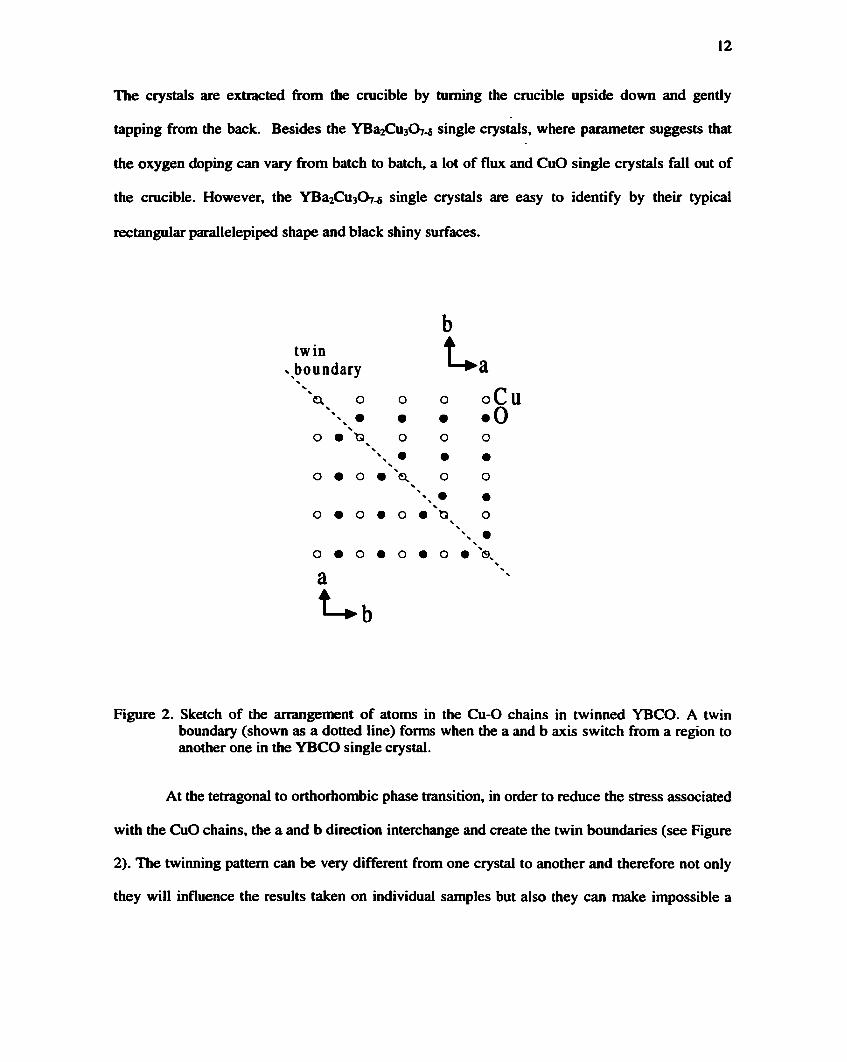
The crystals are extracted from the crucible by turning the crucible upside down and gently
tapping from the back. Besides the YBa2Cu307^ single crystals, where parameter suggests that
the oxygen doping can vary from batch to batch, a lot of flux and CuO single crystals fall out of
the crucible. However, the YBaaCusOr.^ single crystals are easy to identify by their typical
rectangular parallelepiped shape and black shiny surfaces.
b t w i n
. b o u n d a r y X
"a o o o o C U • • • * 0
o • o o o . . . X
O • O • X o o
o « o « o « ^ o \ X
\ • X
X
a
u
Figure 2. Sketch of the arrangement of atoms in the Cu-O chains in twinned YBCO. A twin boundary (shown as a dotted line) forms when the a and b axis switch from a region to another one in the YBCO single crystal.
At the tetragonal to orthorhombic phase transition, in order to reduce the stress associated
with the CuO chains, the a and b direction interchange and create the twin boundaries (see Figure
2). The twinning pattern can be very different from one crystal to another and therefore not only
they will influence the results taken on individual samples but also they can make impossible a
13
comparison between data coming firom different crystals. There are studies about the effect of
different orientation twins to the transport properties of the YBCO crystals (31), however this is
not the subject of the present thesis and therefore we used a thermal mechanical procedure in
order to remove the twin defects completely.
The study described in chapter S is done on optimally doped YBCO samples, the ones
that exhibit the highest superconducting transition temperature. The as-grown single crystals lack
oxygen from their structure and so we anneal them for 10 days at 420°C in oxygen flow, after
which their t3^ical critical temperature is Tc - 93K.
2^ Sample Preparation
After the annealing the crystals still contain planar defects in the form of twin boundaries.
The twin boundaries are planar structures that most times extend through the whole thickness of
the crystal. The twin boundaries in the as-grown crystals can be viewed with a polarized light
microscope, as seen in Figure 3.
Figure 3. Picture of a partially twinned YBCO single crystal. All the lines that form an angle of 45 degrees with the crystal edges are twin boundaries. Picture was taken through a polarized light microscope with the magnification lOx.
14
When viewed with a polarized light microscope, the twin boundaries separate two different
colored regions, which appear as light and dark gray in Figure 3, where the basal plane is rotated
by 90 degrees. In Figure 4 I am showing the picture of a detwinned crystal also taken with a
polarized light microscope.
The twin boundaries act as highly anisotropic defect planes, and the effects firom the
defects introduced by irradiation and those already present due to the twin boundaries would be
difficult to isolate. Therefore, it is necessary to remove the twin boundaries in order to be able to
study the effects of irradiation-induced defects. The twin boundaries are removed by applying
uniaxial pressure in the ab plane (32,33) as shown in figure 5a.
Figure 4. Picture of a fiilly detwinned Y6CO single crystal.
The crystals are placed in a detwinning device where uniaxial pressure is applied with a spring
controlled by an adjusting micrometer. The device is placed in a furnace and heated to 420°C in
flowing oxygen to ensure that the oxygen content in the crystal does not vary during the
detwinning. The applied uniaxial pressure is typically of the order of -lO'N/m^. The pressure
causes the oxygen atoms in the basal plane to align along the b-axis while leaving the basal a-axis
15
empty of oxygen atoms, as shown in Figure 5b which sketches the arrangement of atoms after
detwinning. In this way, the a-axis naturally becomes aligned with the uniaxial stress direction
throughout the entire crystal, hence removing the twin boundaries.
twin ^boundary
press direction
•
Q. O
o •
o
o
O • X
U
o m o
o • o
a
o
o
o
o •
oCu • 0 o
o
o N • \
o • X
u. oCu • 0 o
o
Figure 5. a) Sketch showing the Cu and O atoms arrangement before and after detwinning. The two horizontal arrows indicate the direction on which mechanical pressure is applied during the detwinning process.
For heavy ion irradiation experiments, all crystals, either YBCO or BSCCO, must be
thinned to less than 30^m along the c-axis, (for the ion energies usually employed, GeV order) in
order to ensure that the heavy ions go all the way through the crystal and produce continuous
straight defect tracks throughout the sample. The choice of crystal thickness was based on the
results obtained from running the Transport of Ions in Matter (TRIM) Monte Carlo calculation
program (34,35).
16
5000
4500
4000
3500 E 2 3000 t/i QO C 2500 < _o 2000
u 1500
1000
500
0
2GeV Au ions —A— BSCCO 2212 target
YBCO 123 target
40
thickness (M^m)
Figure 6. Energy lost by the bombarding ion (Au) per unit length for two types of targets; BSCCO (open triangles) and YBCO (full squares).
This program takes as inputs the ion type, their initial energy and the target material, producing a
statistical distribution of the final ion penetration depth and energy transferred to the target
material along the ion path. A typical distribution consists of 1000 or more ions simulated
trajectories. In Figure 6,1 am showing the thickness dependencies of the stopping powers for a
gold ion beam with the energy of 2GeV which strikes a SO^m-thick target of YBCO and BSCCO
respectively.
The program assumes a random distribution of target atoms with a density of 6.S4g/cm^
for both YBCO and BSCCO in the fiilly oxygenated state. The results of the simulation show
clearly that after the flrst 30^m inside the YBCO or BSCCO crystal, the stopping power
decreases indicating that the ion energy has decreased. As a consequence, the ion trajectories start
17
to curve, deviating from the initial direction of the incident beam, that is perpendicular to the
surface of the crystal, and eventually stopping.
The crystal is thinned by mounting it with crystal bond onto a metal holder and then
grinding it using 1 to 30|im grit polishing discs and diamond-in-water suspensions. Final
polishing is conducted using 0.1|im diamond suspension. Using this method, flat millimeter-sized
crystals less than 30|im thick can be obtained.
U Experimental setups
2.3.1 Measurement setup
Transport measurements are conducted using the Corbino disk geometry as well as the
standard four-probe technique, both to be described in the following chapter. Low resistance
contacts are necessary in order to obtain meaningful experimental data. Gold contacts,
approximately 2000A thick, are deposited on the crystal using different types of masks by gold
evaporation in an evaporation chamber. Crystals are afterwards placed on a substrate made of
glass or sapphire and gold wires 12 or 25 ^m in diameter are attached to the gold pads using
silver epoxy. The samples are then cured for S-10 minutes at relatively low temperatures, usually
around 150° C, in order for the epoxy to get dry, resulting in final contact resistances of about 1
to 5 Q.
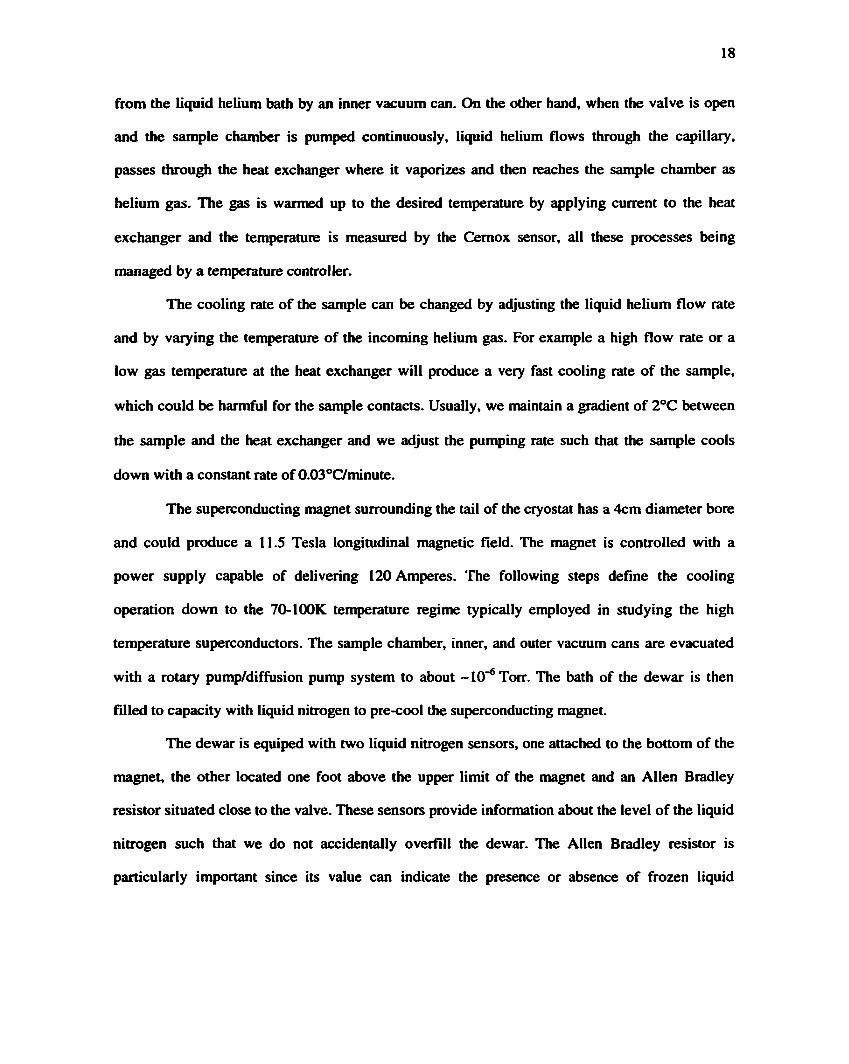
The system used for characterizing the single crystals at low temperatures is shown in
Figure 7. The continuous flow cryostat was manufactured by Oxford from a custom design and is
capable of reaching temperatures as low as 1.6K. Only the main sections of the '^He cryostat are
shown in the Figure 7. It is a top loading system, with a sample chamber diameter of 21mm. The
tail of the sample chamber is built of non-magnetic stainless steel and is equipped with a valve, a
Cemox temperature sensor, a heat exchanger and a capillary tube which connects the sample
chamber to the helium reservoir. When the needle valve is closed, the sample chamber is isolated
18
from the liquid helium bath by an inner vacuum can. On the other hand, when the valve is open
and the sample chamber is pumped continuously, liquid helium flows through the capillary,
passes through the heat exchanger where it vaporizes and then reaches the sample chamber as
helium gas. The gas is warmed up to the desired temperature by applying current to the heat
exchanger and the temperature is measured by the Cemox sensor, all these processes being
managed by a temperature controller.
The cooling rate of the sample can be changed by adjusting the liquid helium flow rate
and by varying the temperature of the incoming helium gas. For example a high flow rate or a
low gas temperature at the heat exchanger will produce a very fast cooling rate of the sample,
which could be harmful for the sample contacts. Usually, we maintain a gradient of 2°C between
the sample and the heat exchanger and we adjust the pumping rate such that the sample cools
down with a constant rate of 0.03°Cyminute.
The superconducting magnet surrounding the tail of the cryostat has a 4cm diameter bore
and could produce a ll.S Tesla longitudinal magnetic field. The magnet is controlled with a
power supply capable of delivering 120 Amperes. The following steps define the cooling
operation down to the 70-100K temperature regime typically employed in studying the high
temperature superconductors. The sample chamber, inner, and outer vacuum cans are evacuated
with a rotary pump/diffiision pump system to about ~10'^Torr. The bath of the dewar is then
filled to capacity with liquid nitrogen to pre-cool the superconducting magnet.
The dewar is equiped with two liquid nitrogen sensors, one attached to the bottom of the
magnet, the other located one foot above the upper limit of the magnet and an Allen Bradley
resistor situated close to the valve. These sensors provide information about the level of the liquid
nitrogen such that we do not accidentally overfill the dewar. The Allen Bradley resistor is
particularly important since its value can indicate the presence or absence of frozen liquid
19
nitrogen at the valve. Subsequently, the liquid nitrogen is removed from the dewar by supplying a
back pressure of nitrogen gas.
r
sample holder
needle valve
cryostat
sample chamber
superinsulated dewar
l iquid He bath
i2T longitudinal superconducting magnet
Figure 7. Drawing of the ^e cryostat, dewar and superconducting magnet (right). The capillaries, through which the liquid He reaches the sample chamber, are also shown in the lower part of the cryostat. llie sample is positioned in the center of the magnet using a sample holder probe (left). From the probe, the electrical signals are taken by the wires to the various electronics.
20
When all the liquid is displaced, and we know when this happens by monitoring the lower LiN
sensor, the bath is flushed several times with warm '*He gas to ensure that no liquid nitrogen drops
remain at the bottom of the dewar. The valve is also opened during the last minutes of this
process in order to flush with He gas the capillaries that will ensure the sample cooling later. It is
very important to remove all the nitrogen or air that remained caught inside the capillary,
otherwise these gasses will freeze when the liquid helium is transferred into the dewar making the
fiuictioning of the system impossible. Next, the bath is filled with liquid ''He to capacity. The
sample chamber cooling occurs via conduction. Temperature control is maintained locally by a
non-inductively wound phosphor bronze heater wire wrapped around a copper cap which
surrounds the sample.
The tail of the sample holder probe consists of a Cemox thermometer calibrated from
300K to 0.33 K, a longitudinal Hall probe, an eight-pin receptacle for the sample, and a cap
heater consisting of a copper cap wrapped non-inductively with 36 gauge Phosphor Bronze heater
wire. The sample holder consists of a G-10 insulating body and Phosphor Bronze posts. In order
to perform resistivity measurements the superconducting single crystals are typically mounted on
a sapphire or glass substrate with silver epoxy. The sapphire substrate with the sample is then
attached to the G-10 disk with varnish. Contacts from the sample to the posts are made with 12
or 2S^m gold wire which are attached with silver epoxy to the sample, and attached to the posts
with indium solder. The G-10 disk with the sample attaches to a commercially available 8-pin
receptacle at the bottom of the probe. Connection from the sample to the top of the probe is made
with 14 twisted pairs of 38 gauge copper wire, terminating at a hermetically sealed 32 pin
connector at the top. An O-ring slip connection, which connects the probe to the cryostat, enables
the probe to be vertically adjustable, so the sample can be placed exactly in the center of the
magnet. We can achieve this by previously building a longitudinal field profile using the Hall
probe.
21
In order to measure the ac resistivity of the samples an ac current, usually of 23Hz, is
generated by a Stanford Research function generator in series with a lk£2 resistor. This enables
the function generator to provide a constant current source to the sample even though the
resistivity of the sample changes drastically as the temperature is reduced. An additional 1(2
resistor in series with the sample is used to monitor the sample current independently. The sample
voltage and current (measured across the IQ resistor) leads are each connected to a SR 830 lock-
in amplifier. For dc resistivity measurements, the function generator and the associated resistors
are replaced with a Keithley dc current source and the dc voltage is measured using a Keithley
2001 nanovoltmeter, making sure to reverse the current direction several times to avoid thermal
drift voltages.
The data acquisition system consists of a desktop computer connected with the laboratory
instruments via an IEEE 488.2 GPIB interface, running LabView data acquisition programs
written especially for this measurement system.
23.2 Irradiation setup
The coherence lengths for YBCO and BSCCO crystals for magnetic fields parallel to the
crystallographic c-axis are 16A (36) and 30A (37) respectively at T=OK and they increase with
the temperature to approximately lOOA. This length is a measure of the radius of the normal
vortex core. The idea of using irradiation in order to produce defects in the crystals came from the
fact that the size of the amorphous tracks produced by the heavy ions is comparable to the vortex
core dimension. In addition to this, the defect region loses the superconducting properties and
therefore it becomes an energetically favorable location for the normal vortex core and this is the
reason for which we use the term pinning site for the irradiation defects. And finally, a very
important characteristic is that the tracks are linear, much like the vortex shape, therefore it is
22
expected that this kind of defects, if aligned with the direction of the magnetic field, constitute
very efficient pinning centers.
Columnar defects are created in YBCO and BSCCO by the impingement of high energy
ions, which cross the thickness of the crystal producing defect tracks. In order for these defects to
be linear, the ions must have enough energy to go completely through the sample with only
negligible stray from the initial direction, as well as transfer enough energy to the material to
create the track. A concern in the production of continuous columnar defects is the stopping
power. The energy transfer firom the ion to the target material, defined as the stopping power
dE/dx, depends not only on the ion type, ion energy and on the target material. From electron
microscopy studies a lower limit of approximately 2000eV/ion has been established for the
stopping power (38). For stopping powers below this threshold, aligned spherical defects have
been produced instead of continuous columnar defects (39). Note from Figure 6 that, for gold
ions with the energy of 2GeV, the stopping power is above the threshold. As a result, the defects
produced in the experiments presented in this work are truly columnar.
For high ion energies it has been found that the ions interact mostly with the electrons,
the nuclear scattering being far less important. As the ion traverses the crystal, it causes local
ionization along the path. The atoms located within the now electron-depleted region feel a net
repulsive force and if this force is greater than the atomic bond strength, the atoms are displaced
along the path. This way, a cylindrical region of defects is established. The track region must be
depleted of electrons for enough time as to allow the atoms to repel one another. This criterion is
not satisfied for most metals, except for those with a density of conduction electrons less than
lO^cm'^ (40). In addition, the mobility of the created defects must be less than an interatomic
distance otherwise the defects would disperse over time.
In order to study the interaction between vortices and defects researchers introduced
various concentrations of columnar defects by irradiating the high-Tc superconducting crystals
23
with heavy ions (17). The heavy ion irradiations were performed at two facilities: The 36"
diameter ATSCAT chamber at the Argonne Tandem Linear Accelerator System (ATLAS),
located at Argonne National Laboratory, and the N3 chamber at the National Superconducting
Cyclotron Laboratory (NSCL) at Michigan State University.
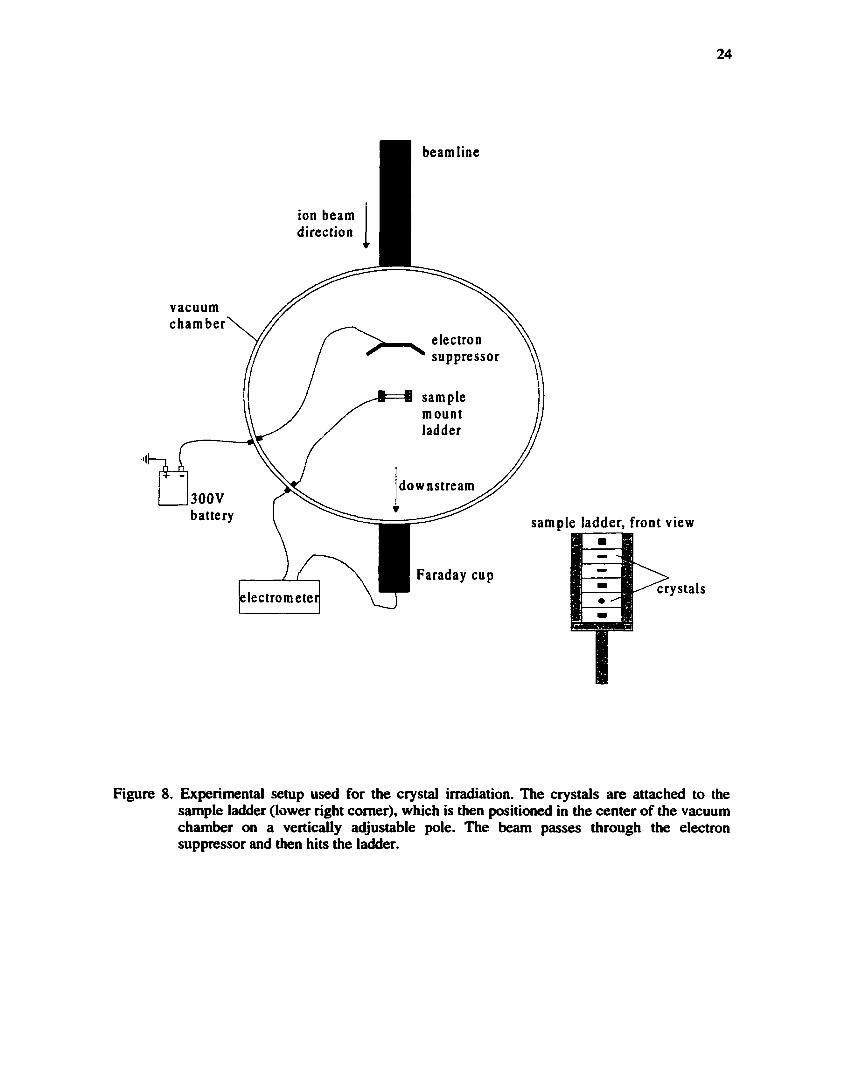
The basic chamber configuration is shown in Figure 8. The samples are placed on a
ladder located at the center of the chamber on a rotating pivot, which can also be vertically
adjusted. The ladder consists of several rectangular aluminum plates stacked vertically on top of
one other, as shown in the lower right comer of Figure 8. A Faraday cup is placed at the back end
of the chamber and connected to an electrometer to measure the beam current. During irradiation,
the beam current impinging on the samples on the ladder is also monitored with an electrometer.
The ions striking the samples produce ejection of surface electrons from the target. For the high-
energy ions used in the irradiation the mean energy of an ejected electron is on the order of
2SC)eV (41). To counteract this effect and to obtain an accurate record of the beam current, a
suppressor plate with a collimator hole is connected to -BOOV and is placed in close proximity in
front of the target samples. Monitoring the beam current on the conducting suppressor plate helps
to steer the beam onto the target. The Faraday cup is geometrically suppressed i.e. any ejected
electrons will be collected by the long cylindrical wall of the cup, thereby yielding an accurate
reading.
After the sample alignment has been completed, the chamber is closed and pumped down
to approximately lO'^torr. The ions enter the chamber with a net positive charge. Given the ion
charge Q in Coulomb units, the beam flux can be calculated in the following manner; the beam is
adjusted such that almost the entire beam passes through the hole with radius r on the topmost
plate of the ladder, and the current Ifc is measured by the downstream Faraday Cup. The ion flux
F, defined as the numbers of ions per cm^ per second, is obtained from this current:
24
beamline
vacuum chamber
ion beam direction
electron suppressor
sample mount ladder
downstream 300V battery
electrometei
Faraday cup
sample ladder, front view
crystals
Figure 8. Experimental setup used for the crystal irradiation. The crystals are attached to the sample ladder (lower right comer), which is then positioned in the center of the vacuum chamber on a vertically adjustable pole. The beam passes through the electron suppressor and then hits the ladder.
25
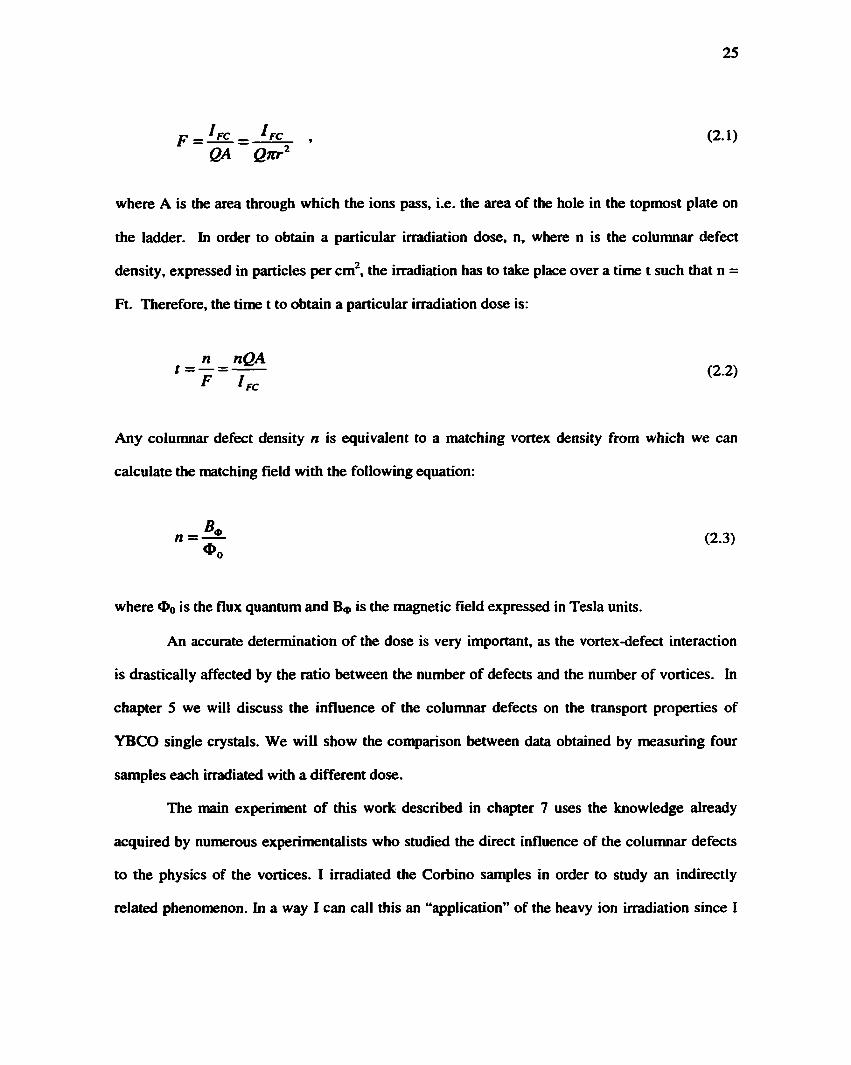
p-^FC _ he , (2.1) QA Qmr
where A is the area through which the ions pass, i.e. the area of the hole in the topmost plate on
the ladder. In order to obtain a particular irradiation dose, n, where n is the columnar defect
density, expressed in particles per cm^, the irradiation has to take place over a time t such that n =
Ft. Therefore, the time t to obtain a particular irradiation dose is:
n nQA = — (2.2)
r I
Any columnar defect density n is equivalent to a matching vortex density from which we can
calculate the matching field with the following equation:
n=-^ (2.3)
where is the flux quantum and B<» is the magnetic field expressed in Tesla units.
An accurate determination of the dose is very important, as the vortex-defect interaction
is drastically affected by the ratio between the number of defects and the number of vortices. In
chapter 5 we will discuss the influence of the columnar defects on the transport properties of
YBCO single crystals. We will show the comparison between data obtained by measuring four
samples each irradiated with a different dose.
The main experiment of this work described in chapter 7 uses the knowledge already
acquired by numerous experimentalists who studied the direct influence of the columnar defects
to the physics of the vortices. I irradiated the Corbino samples in order to study an indirectly
related phenomenon. In a way I can call this an "application" of the heavy ion irradiation since I
26
use it just as a tool for pinning down the vortices in some specific parts of the sample while the
measurements are performed in other regions of the same sample.
27
3. DESCRIPTION OF THE CONTACT CONFIGURATIONS
3.1 Introduction
Much of the research on the cuprate superconductors has consisted of experiments on
samples prepared in the four-probe geometry; firstly because it is a standard technique for
sensitive transport measurements, and secondly because in the beginning the FITS single crystals
could be grown only in small dimensions that could barely fit a few contacts. As soon as the
growing techniques improved, experimentalists started to use larger crystals to study the
influence that size and shape could have on the transport properties of various HTS materials. The
Corbino disk geometry is a novel configuration that requires fairly large specimens. In this
chapter, I will describe in great detail the Corbino and the standard bar geometry and in the same
time I will compare their features. As we will see, the disk geometry possesses a series of
advantages over the rectangular one, fact that makes it possible for us to study aspects of the
vortex physics from a new perspective. Later chapters in this work present experiments that treat
each of the properties of the circular geometry.
3.2 Description of standard 4-Drobe geometry
In the four-probe geometry, as the name already announces it, there are a total of four
leads; two of them used for inputting the current into the sample and the other two for collecting a
voltage signal from the sample (Figure 9).
The reason for which the voltage contacts do not coincide with the current contacts lies in
the sensitivity of the resistivity measurements. Since the studied crystals are superconductors,
there is a range of temperatures specific to each material when they will exhibit very low
electrical resistance, which is possibly orders of magnitude lower than the resistance of the
contacts.
28
I. V, V. I.
Figure 9. Four-probe measurement configuration also known as standard bar geometry containing two sets of contacts one pair for the current (I«^L) and the other for the voltage (V^,V.)
If one measured the voltage from the same contacts as the ones we feed the current through, then
the size of the collected signal would be given by the following expression;
V2probe — I CRs'^Rconlacls) j (3.1)
where I is the inputted current, Rs is the electrical resistance of the superconducting material and
Rcontacts is the total resistance of the contacts. Whenever the material becomes superconducting, its
resistance is zero or almost zero, in any case much smaller than the resistance of the contacts.
Rs « Rconiacis V— IRconlacts and Vbad IRs
Therefore, the measured signal does not reflect the behavior of the studied superconductor since
this is covered by the large contribution coming from the contacts. In a four-probe configuration
the signal measured from the voltage contacts and V. is given by:
V4pro(ie = IRs + iRcontacts > where i is a very small electrical current generated by the measuring
device, in our case a nanovoltmeter or an ac lock-in amplifier. In this expression Rcomacts is the
total resistance of the voltage contacts, however it has a similar value to the one of the current
contacts, U and L. In the case of the four probe configuration since the contact contribution to the
measured signal is very small, we can trust the data as being representative for the electrical
properties of the studied material:
29
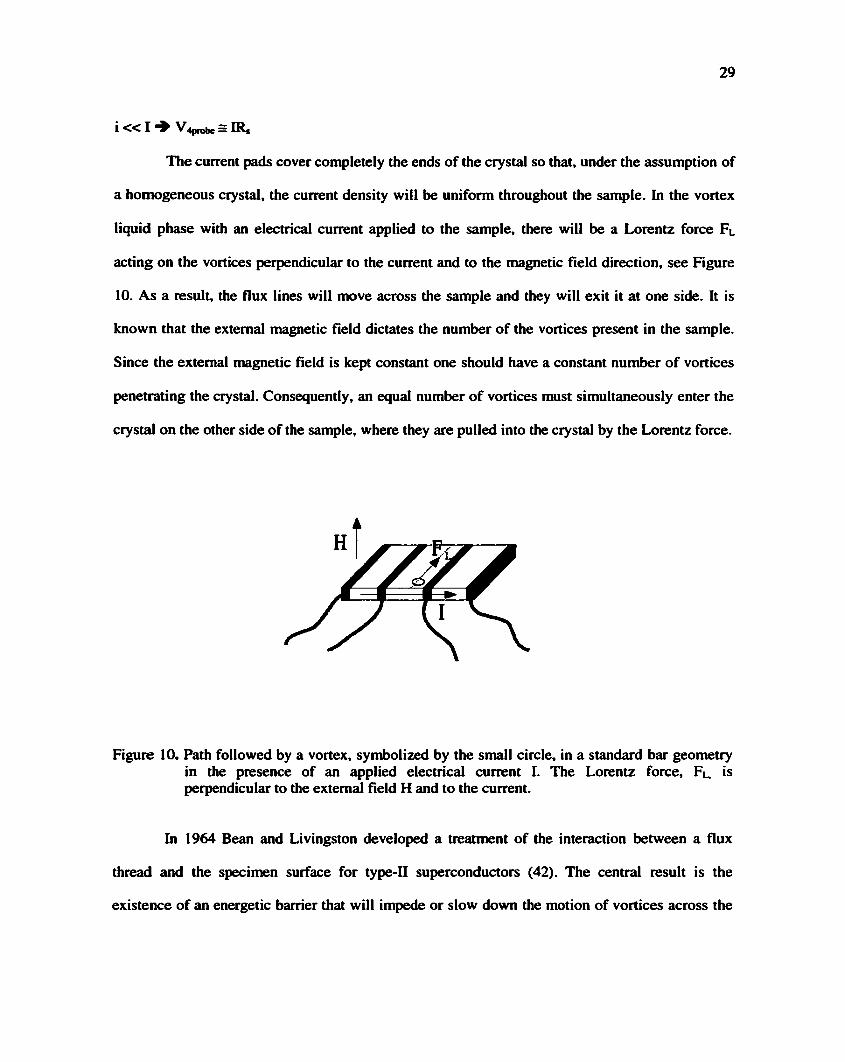
i « I V4ptobe = IR*
The current pads cover completely the ends of the crystal so that, under the assumption of
a homogeneous crystal, the current density will be uniform throughout the sample. In the vortex
liquid phase with an electrical current applied to the sample, there will be a Lorentz force Fl
acting on the vortices perpendicular to the current and to the magnetic field direction, see Figure
10. As a result, the flux lines will move across the sample and they will exit it at one side. It is
known that the external magnetic field dictates the number of the vortices present in the sample.
Since the external magnetic field is kept constant one should have a constant number of vortices
penetrating the crystal. Consequently, an equal number of vortices must simultaneously enter the
crystal on the other side of the sample, where they are pulled into the crystal by the Lorentz force.
Figure 10. Path followed by a vortex, symbolized by the small circle, in a standard bar geometry in the presence of an applied electrical current I. The Lorentz force, Fu is perpendicular to the external field H and to the current.
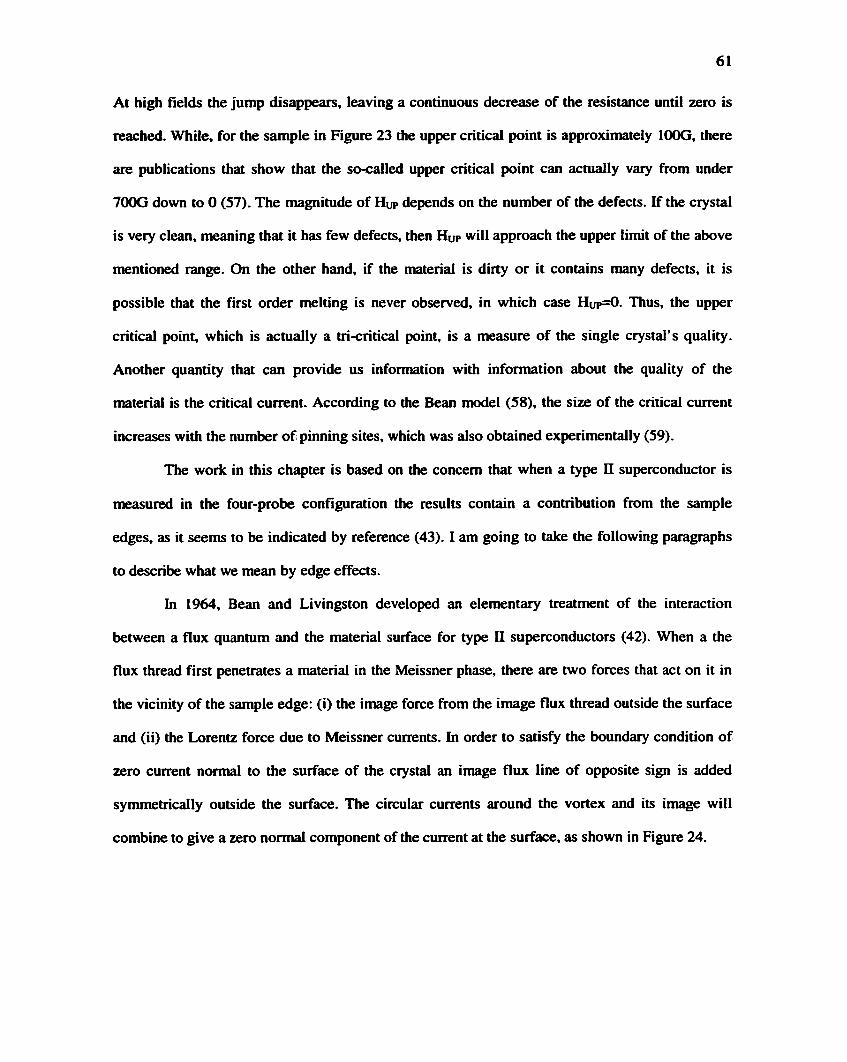
In 1964 Bean and Livingston developed a treatment of the interaction between a flux
thread and the specimen surface for type-II superconductors (42). The central result is the
existence of an energetic barrier that will impede or slow down the motion of vortices across the
30
edges of the sample. Because of this, there exist concerns among the experimentalists that the
transport measurements obtained using the four-probe technique do not reflect entirely the
electrical properties of the bulk of the material since they could contain contributions from the
surface effects (43). How large these contributions are depends on the external parameters such as
temperature and magnetic field and also on the type and quality of material, and shape and
roughness of the sample edges.
The Lorentz force is balanced by a friction force, which is determined by the friction of
the vortices with the underlying crystal structure,
Fl = y^, where yis the friction coefficient, (3.2)
such that the flux lines move with a constant velocity. Since the Lorentz force is uniform, the
vortex velocity will also be uniform throughout the sample according to the above relation.
According to Maxwell's equation, the transversal motion of the magnetic flux lines creates a
longitudinal electric field given by;
This produces voltage difference that is collected from the central contacts:
V = Ed, where d is the distance between V. and V+ (Figure 9). Thus, the signal is
proportional to the number of vortices that move in the space between the voltage contacts and to
the speed of the vortices, hi other words, the motion of the vortices gives the dissipation in a type-
n superconductor, which according to Maxwell's equation creates a voltage along the direction of
the current.
31
The procedure of applying the contacts to a YBCO or BSCCO crystal starts with the
cleaning of the surface prior to evaporating gold pads. For obtaining the desired pattern of pads,
either slit masks for the four-probe geometry or circular masks for the Corbino samples are
placed on top of the crystals. When Hrst deposited, the gold contacts have high resistance. Hence,
the gold contacts are subsequently sintered at 420°C in flowing oxygen for approximately six
hours to ensure good bonding of the gold to the ceramic crystal surface. The sintering temperature
of 420°C period will make sure that the doping of the crystal will still be optimal, so that the
superconducting properties of the material are not affected. After that, the process is continued by
attaching gold wires to the pads using silver epoxy and curing the sample on the hot plate for
about ISmin at approximately 1S0°C. At this point the sample is ready to be mounted on a
sample holder which can be attached to the measurement probe and introduced into the cooling
system.
33 Description of Corbino geometry
A Corbino disk has concentric inner and outer electrical contacts, exhibiting cylindrical
symmetry with respect to an axis that passes through the center of the disk and is perpendicular to
the disk plane (Figure 11).
Most of the measurements in the presence of magnetic field are usually done applying the
field parallel to the synunetry axis of the disk. This type of geometry is named after O.M.
Corbino, who in 1911 reported magnetoresistance measurements on several metals using this
configuration. The current is fed into the nonsuperconducting sample through the inner pad and
removed at the outer frame. In zero applied field, the lines of current are simply radial, but in the
presence of an axial magnetic field they lengthen due to spiraling see (Figure 12a and 12b).
32
Figure 11. Corbino disk configuration showing the current contacts: the central pad U and the outer firame L.
Figure 12. Current distributions in the Corbino disk geometry for the cases of (a) no magnetic field and (b) external field applied perpendicular to the plane of the disk.
This spiraling of the current flow occurs because the geometry of the disk is such that the Lorentz
force acting on the charge carriers is not counterbalanced by a Hall-effect electric field. Largely
as a result of the geometrical magnetoresistance effect associated with the lengthening of the
current path the resistance of the disk increases as indicated by the definition of the electrical
resistance. If B is the magnetic induction, the resistance of the Corbino disk can be expressed by
the following equation:
33
R(B)=R(O)(l+tan'0)p„(B)/p„(O) (3.4)
where 6, the Hall angle is defined by: 6=pyx/pxx=HB (3.5)
Here, p„ is the in-plane resistivity, pyx is the Hall resistivity and |X is the carrier mobility.
Although the Corbino geometry has been around for quite a long time and is used mostly
for measuring electrical properties of semiconductors, it has not generally been used for the study
of superconductors with the exception of reference (44). In the past five years, there were
published only a few experiments involving the normal state properties of high-temperature
superconductors using the disk geometry and only recently, concomitant with the development of
the present work, have there been reports of experiments done on HTS Corbino samples in order
to study different aspects of the vortex physics in the mixed phase (26,45-48).
Given the fact that high-temperature superconductors samples have a platelet-like shape,
having the dimensions along the a and b directions much larger than the size along c direction,
there is only one way in which the Corbino geometry can be prepared. Namely, the disk plane has
to coincide with the crystailographic ab-plane and therefore the symmetry axis of the disk is
parallel to the c-axis of the crystal. In our calculations we will use the common coordinate
notations xyz, therefore we will need to identify the coordinate axis with the crystailographic
directions: ab plane is usually chosen to be the xy plane and consequently the z direction and the
c-axis of the crystal are parallel.
In zero external magnetic field, the electrical current, I, flows radially and the current
density at distance r from the center of the disk is given by the following expression:
2jrWr (3.6)
34
where W is the thickness of the layer where the current spreads. Two assumptions have been
made deriving the above relationship; (i) the current flows in a layer of constant thickness W at
the surface of the sample and, (ii) for a given r the current density does not vary with z. The
current density expression was obtained by writing the definition of the current density for a
cylindrical surface of arbitrary radius r that surrounds the central electrical contact.
In the presence of a magnetic field applied parallel to the c-axis of the crystal, the sample
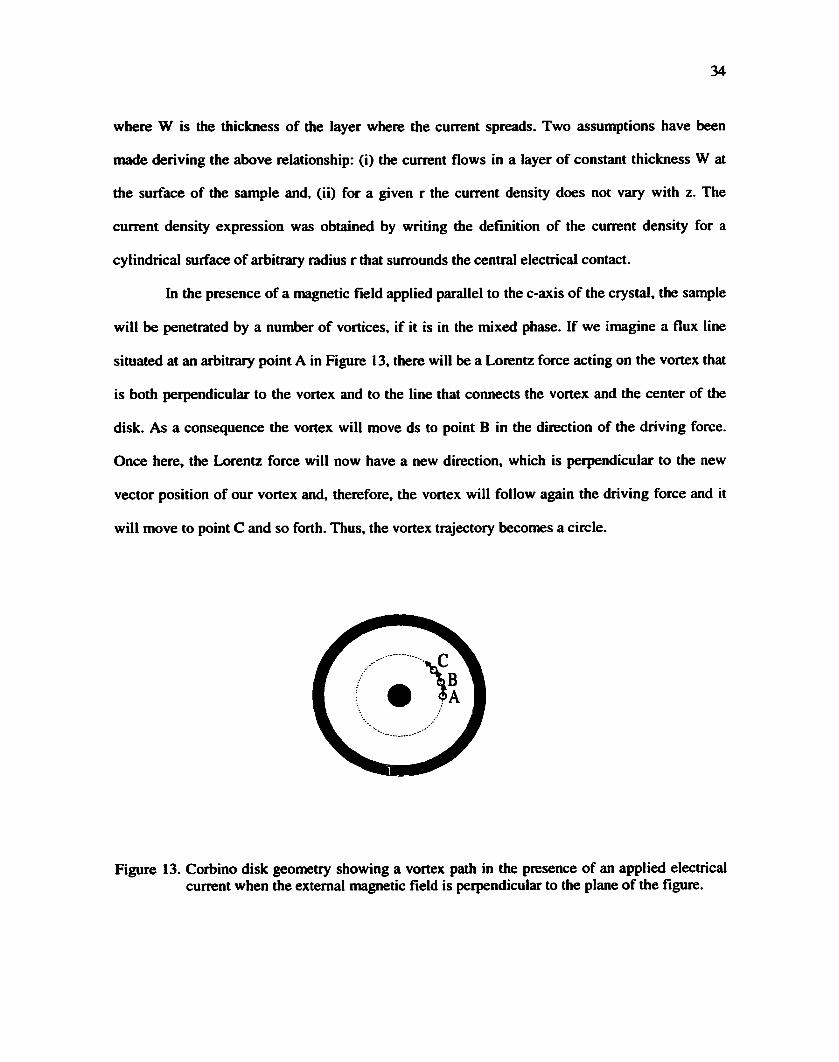
will be penetrated by a number of vortices, if it is in the mixed phase. If we imagine a flux line
situated at an arbitrary point A in Figure 13, there will be a Lorentz force acting on the vortex that
is both perpendicular to the vortex and to the line that connects the vortex and the center of the
disk. As a consequence the vortex will move ds to point B in the direction of the driving force.
Once here, the Lorentz force will now have a new direction, which is perpendicular to the new
vector position of our vortex and, therefore, the vortex will follow again the driving force and it
will move to point C and so forth. Thus, the vortex trajectory becomes a circle.
Figure 13. Corbino disk geometry showing a vortex path in the presence of an applied electrical current when the external magnetic field is perpendicular to the plane of the figure.
35
The Corbino geometry possesses two interesting features. In the present work I will
carefully investigate both of them. First, the fact that the current density is nonuniform is
providing one with a nonuniform Lorentz force throughout the sample. Consequently, the
nonuniform driving force will ensure that the vortices move with different velocities in different
regions of the sample or, in other words, the gradient of the vortex velocity will be different from
zero. Since there is a velocity gradient it is possible, in principle, to observe and study the vortex
shear (see chapter 7).
Second, a distinct advantage of the Corbino geometry is the absence of edges where flux
lines enter and leave the sample. In a Corbino geometry the Lorentz force is perpendicular to the
disk radius in every point of the sample. Therefore, vortices move on close circular trajectories
about the central inner dot, without crossing the edges of the sample. As a result, only the bulk
properties will affect the vortex motion with no contribution of the surface effects. In other
words, the circular geometry is appropriate for the study of bulk vortex pinning. Moreover, one
can compare the results obtained using a standard four-probe sample with the ones coming from a
Corbino sample made from the same type of material to draw conclusions about the surface
barrier effects, as shown in chapter 4.1 should add that the vortices could experience a drag from
the top and bottom surfaces of the crystal. However this is true for Corbino as well as for the
four-probe configuration, and therefore the effect will be included in the data taken on both
conHgurations. This effect will not alter the conclusions presented in chapter 4 about the edge
barriers resulted from a Corbino-four probe comparison.
There are, however, factors that can impede the effectiveness of the Corbino geometry.
One is the sample quality, because crystal inhomogeneities will cause vortex trajectories to be
irregular-shaped closed loops rather than circles. Inhomogeneities can include regions with
structural defects that present different superconducting properties from the rest of the sample,
like the critical temperature, or different electrical properties, like the local resistivity value. The
36
quality of our crystals is investigated, see chapter 4, by probing locally different parts of the disk
and comparing the respective measurements. I should add that for a standard bar geometry such
inhomogeneities cannot be singled out since the crystal is probed as a whole and the measured
voltage will represent a volume average of the sample.
The second factor that could alter the circular trajectory of the vortices is the Hall effect.
As we saw from the very definition of the circular geometry, the current lines might get curved
which will prevent the Lorentz force from being perpendicular to the radius, and consequently,
will prevent the flux lines from moving on circles. In such a case, the trajectories of the vortices
will not be closed loops anymore, but they will be spirals. Therefore, the vortices will have to
cross the edges of the sample at some point. Under these conditions, the Corbino geometry would
become useless.
The Hall effect is caused in the flux flow regime of conventional type Q superconductors
by the hydrodynamical Magnus force acting on the moving flux lines. A relevant physical
quantity is the Hall angle, which corresponds to the angle of the direction of the flux line motion
relative to the direction of the Lorentz force. When a vortex moves in a type-II superconductor,
dissipation is produced by the scattering of quasiparticles within the vortex core. The finite
lifetime, x, of quasiparticles trapped in the core leads to a broadening of the energy levels.
Usually, the spacing hoOb between the core levels is so much smaller than the width 1/x, i.e.
(iabX«l, so that it is a good approximation to treat the core as a column of normal material like in
Bardeen-Stephen model (49). The discrete nature of the levels becomes important and the
dissipative processes have to be considered in the opposite limit, (i]bT»l, which is called the
superclean regime. The parameter cobt is estimated to be ~ 14 in 90K YBCO at temperatures
below ISK, which places YBCO firmly in the latter regime. Microscopic calculations (SO) predict
that tangent of the Hall angle 6h in a pure type-II superconductor increases linearly as ±oabT when
37
0)bT»l. The vortex velocity changes from near alignment with J x B towards parallelism with ±J
as (UbX increases (J is the current density and B the field). However, the values of 6h observed in
YBCO mostly at temperatures T^70K are small I Oh I <0.05 rad and for BSCCO, which is the
material used by us for the Corbino samples, even smaller | Oh I <0.006 rad for 4SK<T<90K (51).
In conclusion, I can ignore the Hall effect in our experiments.
3.4 Analysis basis for the Corbino data
My typical Corbino sample has a thickness between 15 and 30^m and a radius of 250 to
450^^l, so that I can fit four or more voltage probes along one radius as shown in Figure 14a and
14b, the latter being an actual picture of such a sample. In order to investigate different regions of
the crystal, voltage contacts are placed along two radii at an angle of approximately 90 degrees to
each other. This arrangement also becomes useful during the measurements when some of the
voltage contacts deteriorate due to thermal cyclings.
The analysis of the Corbino geometry begins by considering the voltage difference
between contacts n and n+1 located one next to each other. From equation (3.6), the current
density is given by
/(r)=—4—. 2;rWr
so that the electric field
£(r) = p/(r) = 2nWr
38
also exhibits radial variation. From the above expression, it is clear that the electric field strength
is largest close to the inner current contact and smaller as we move along a radius towards the
periphery of the disk.
Figure 14. a) Corbino disk sketch showing a typical voltage probe conHguration. Each small black dot represents a voltage contact, b) Picture of an actual Corbino sample with golden leads attached to the contacts.
The voltage difference is obtained by integrating the electric field on the interval comprised
between the chosen contacts:
radius 2
radius I • • • •
J E{r)dr (3.8)
39
For the case of a Corbino sample with four radial dots acting as voltage contacts, with ri<r2<r3<r4,
where r„ represents the distance between the nth dot and the center of the disk and the innermost
contact is rl. If the voltage probes are placed on the radius equidistantly, I can find a strict
relation between the values of the signals coming from consecutive pairs of contacts:
V,2>V23>Vu. (3.9)
This voltage hierarchy can also be readily understood by considering how the vortex velocity
varies with the radius;
V = FL/Y- (3.10)
/ /(/•) = 2jtWr
From these two equations we can see that the vortex velocity is inversely proportional to the
distance from the center of the disk. This means that the flux lines closer to the center of the
sample move faster in comparison with the vortices near the outer frame. Since dissipation and
vortex motion are equivalent, the faster the motion is the larger the dissipation is and hence, the
larger the voltage is. In a Corbino sample, the fastest motion takes place closer to the center of the
disk so that we expect that V|2 will be larger than V23 and V23 larger than V34, etc.
Expression (3.8) is true if I make some assumptions about the prefactor pI/2iiW: namely,
the resistivity has the same value everywhere in the sample, that is the sample is homogeneous,
and the thickness W where the current flows is also the same at every point. In these conditions,
aside firom the numerical factor ln(r„+//r„), the signals collected from all pairs of voltage contacts
should be identical. If this numerical factor is divided from the measured data correspondingly.
40
all curves should collapse. This reasoning is true for the case of the normal state of the high-Tc
superconductors, where the sample is just a plain circularly shaped resistor and it can also be
extended for the vortex liquid regime in which we are sure there is vortex motion and hence
dissipation. It would be incorrect, however, to apply it to the case of the vortex solid state.
In the vortex liquid state, the flux lines move freely following the magnitude and the
direction of the local Lorentz force; where the Lorentz force is large the vortices move fast and
where the Lorentz force is small the vortices move slowly. This motion is called flux flow, and it
is characteristic to the vortex liquid state when there is no interaction between vortices and the
vortex pinning from various defects in the crystal is very weak. In contrast, in the solid phase,
both the vortex-vortex interaction and the pinning effects are strong. Sometimes these interactions
can be stronger than the Lorentz force and will alter or completely stop the motion of the flux
lines. Whenever the vortex motion is altered, we can no longer expect the hierarchy relation
between voltages to be true since the vortices do not follow anymore the Lorentz force, which
was the reason behind expression (3.9).
The interaction between the flux lines is the cause for nonzero shear force or viscosity of
the vortex matter that, for the case of the Corbino geometry, can lead to the modification of the
distribution of vortex velocities along the radius. Recall that vortices move on circular loops
about the center of the disk and that the radial profile of the vortex velocity is proportional to 1/r,
as depicted schematically in Figure IS.
When vortex matter possesses viscous properties, adjacent moving flux lines can
influence each other's speed, thus creating transversal correlation of the vortex motion. By
transversal, I mean transverse to the direction of motion so that the correlation takes place along
the disk radius.
velocity amotion
direAon of correlation
Figure IS. The series of parallel arrows symbolize the velocity vector of the moving vortices. Also indicated in the figure is the direction of motion correlation, which is perpendicular to the direction of motion.
One important consequence is that the distribution of vortex velocities may now be different from
1/r depending on the strength of the vortex shear. It is important to note that in both for a vortex
solid and viscous vortex liquid the current distribution will still have a 1/r radial dependence,
despite the fact that the vortex velocity will not display this behavior anymore.
3 Hvdrodvnamic treatment of the resistivitv
One question that arises after the discussion from the previous section is: what equation
describes the vortex dynamics? As soon as this equation is identified, I can solve it with the
appropriate set of conditions and actually prove the statements from the above paragraphs. Eleven
years ago Marchetti and Nelson developed a theory of the hydrodynamics of the vortex line flow
(S2). According to the two theorists the motion of flux lines in the vortex liquid state of high-Tc
superconductors is equivalent to a hydrodynamic fluid flow. For the case in which a uniform
current distribution is applied to a cuprate single crystal, the authors of reference 9 obtain a
simplified hydrodynamic motion equation:
42
-)v+T7V^V + F^ =0 (3.11)
The first term represents the friction force arising from the interaction of the normal core
electrons with the underlying crystal structure. Hence, the friction term represents the vortex
pinning produced by different types of defects in the sample. The second term is called the
viscous drag, T| being the viscosity coefficient. Note that it contains the transversal gradient of the
vortex velocity. Therefore, in the case of uniform velocity flux flow the viscous drag term will
vanish from the equation and the viscosity coefficient cannot be calculated. This supports the
statement fi'om section 3.3, that viscosity phenomena can, in principle, only be observed in a
sample geometry that allows a nonuniform distribution of vortex velocities. Of course, the
Corbino geometry provides such a condition. Finally, the third term of the equation represents the
Lorentz force acting on a flux quantum.
In section 3.3,1 argued that for the case of the flux flow the vortex lines respond to the
local Lorentz force and, since the Lorentz force varies as 1/r, it was expected that the vortex
velocity will have the same kind of radial dependence. Let us see whether a 1/r velocity
distribution satisfies the hydrodynamic equation. For this, we write the hydrodynamic equation
(3.11) in cylindrical coordinates, as indicated by the symmetry of the Corbino geometry. In the
same time, we need to identify the components of the in-plane two-dimensional vortex velocity:
V = v^r + vgd (3.12)
43
Since the vortices move on circles their velocity direction is perpendicular to the radius, so that
only the angular component is different from zero and is inverse proportional to the radius,
vgal/r, and the radial component of the velocity is null, Vr=0.
Having done this, we calculate separately the middle term of the hydrodynamic equation
since it is the one that requires most attention, the others being rather straightforward:
V ^ v = V ^ v = V ^ ( v . > z V ^ f - l = — = - v ^ = — — - - = 0 j dr r j dr r dr r r r r
(3.13)
Therefore the hydrodynamic equation becomes:
-)V + F^=0 (3.14)
Thus, we find that a velocity inversely proportional to the radius not only satisfies the
hydrodynamic equation, but also excludes the possibility of obtaining a numeric value for the
vortex viscosity due to the fact that the viscous drag term is equal to zero. Moreover, expression
(3.8), which gave the magnitude of the measured voltage signal in a Corbino sample with a 1/r
velocity distribution, is also valid.
What about the cases when the vortex motion is not a flux flow, where do we expect to
see a deviation from the 1/r behavior? How can we fmd the velocity distribution under these
conditions? All these questions will be answered if we solve the hydrodynamic equation and for
that we need to know the boundary conditions. For the Corbino geometry there are two
boundaries, inner and outer, both of which are circular. The inner boundary surrounds the central
current contact and the outer one is at the interior limit of the frame contact. For a pristine crystal
patterned in the Corbino geometry, we cannot specify the boundary conditions. This is the case
44
described in chapter 6 of this work. In their Physical Review B paper published in 1999,
Marchetti and Nelson suggest that the boundary conditions can be created by irradiating the
boundary regions with heavy ions (S3), to produce columnar defects that pin down the vortices.
As a result, a boundary condition of zero velocity can be assumed in the irradiated boundary
regions. In this case, presented in chapter 7 of this thesis, the hydrodynamic equation can be
solved and expressions for the voltage drops for our contact pairs can be found.
3.6 Anisotropic resistivity model
Before proceeding to the next chapter, I need to make a very important comment. Recall
that in order to write the current density as in equation (3.6), we made the assumption that the
current flows in a layer of constant thickness W. This approximation may or may not be
appropriate depending on the sample thickness and on the material characteristics. One can write
the chzirge continuity equation for an arbitrary point in the sample that is not on any of the current
pads:
V - 7 = 0 (3.15)
Knowing that
y = -—VV P
(3.16)
we can rewrite equation (3.IS) in the following way:
45
or
wherepab and Pc are the resistivities along the ab-plane and along the c-axis respectively. Here, if
we rescale the z coordinate into z'=z(pc/pab)"^, then the potential differential equation (3.17)
becomes isotropic:
Of course, in an isotropic material the current propagates the same way in all directions, therefore
the above transformation of the z-coordinate can help us find the equivalent length scales in-plane
and along the z-axis. In other words, for a material with a large anisotropy, the anisotropy being
defined as (pc/pab)"^. it is expected that most of the current will flow mainly in the topmost layer
of the crystal and that the spreading W on the z-axis is given by;
— **^0" (3.19) Ku.-Rin 2 i P c
where (Rouc-Rin)/^ is the half of the distance between the current contacts. This is the case for
BSCCO, which has an anisotropy of approximately 700 (54). For this type of material, in order to
ensure that the current flows in a constant thickness layer, one needs to make the sample very
thin, so that the current will spread over the whole z-axis dimension of the sample and so provide
a uniform current density. Another way would be to drill a hole through the center of the disk and
46
then fill it with silver paste so it will constitute the current electrode. This way the current will be
forced to distribute uniformly throughout the sample's thickness. All sample drilling attempts
were unsuccessful and therefore, the only alternative was to apply the current contact on the top
surface of the crystals. In this situation, if the BSCCO crystal is not thin enough, the current
distribution would look like in Figure 16, and we believe that this is the case of our Corbino
samples.
Figure 16. Cross section of a Corbino disk sample made out of a BSCCO 2212 single crystal. Note the curent and voltage contacts at the top of the figure. The curved lines constitute the current distribution for this particular material.
You can see that the thickness of the layer where the current flows varies with the position from
the center of the disk and is, therefore, different for various pairs of voltage probes. Clearly in this
case, the current distribution will aifect the value of the Vn.M.| given by expression (3.8). On the
other hand, for a material with a moderate anisotropy, for example YBCO, the current tends to
spread along the entire thickness of the sample much faster, so that underneath the voltage
contacts the current is distributed in an effectively constant thickness layer (see Figure 17). In
other words, the latter situation is much closer to the isotropic case, when the current goes
everywhere inside the sample, than the former case, as indicated by the corresponding mass
anisotropy values.
47
aC I I V V
' I ' 4
rwwi
Figure 17. Cross section of a Corbino geometry showing the current distribution if the material the sample is made of is YBCO 123 single crystal.
All our Corbino samples were made out of BSCCO 2212, an extremely anisotropic
material. As a result, we expect to see deviations of V„.n4.i from expression (3.8). Looking at
Figure 16, we see a larger concentration of current lines close to the center of the disk and close
to the outer edge. This means that in the above mentioned regions the current density is slightly
larger than it would have been if the current had spread uniformly on the z-axis. Since the Lorentz
force is proportional to the current density, it will also have higher values than the ideal case in
the same regions. As a consequence, one would expect that vortices will move faster and that the
voltage drops will be larger than the calculated value for the voltage contacts located in the
affected regions; that is, close to the inner pad or the outer frame, namely Vn and V34. The
middle contact pair voltage, V23, should be the least affected. We would also expect that the order
relation (3.9), V|2>V23>V34, should still be valid. In fact, the anisotropic nature of the sample will
enhance V12 relative to V23. The deviation from the ideal case will also increase the value of V34
above the calculated one. However, the fact that is located further on the radius than V23, still
allows V34 to be smaller than V23, even if anisotropy corrections are applied. Indeed, we believe
that the deviation from due to anisotropy is not strong enough to make V34 larger than V23. To
support this statement, we apply a linear anisotropic resistivity model developed in 1992 by
Busch and collaborators for a four-probe transformer geometry (55).
48
We start with the charge continuity equation as Busch et al indicate in their paper:
ajr' p, dz^
to which we attach the proper boundary conditions for the circular geometry. In the above
equation V is the potential and pab and pc represent the resistivities parallel and perpendicular to
the ab-plane respectively. Note that this model does not take into account the vortices, therefore
its boundary conditions are different from the ones used by Marchetti and Nelson (53). This
model treats the sample as an anisotropic material without any other special properties and
predicts how the current flows inside the bulk. Here the equation is two-dimensional since the
potential does not depend on the third coordinate, y. In our case, the Corbino geometry has
cylindrical symmetry and therefore the potential will not depend on the polar angle. Thus, we
rewrite the differential equation in cylindrical coordinates and we retain only the terms that show
a variation along the radius and along the z direction:
I 1 a Pab rdr J dr ,
4-1 d ^ V
p. dz" = 0 • (3-20)
For our problem, the variable r ranges firom zero at the center of the disk to Rmu at the periphery
of the sample (see Figure 18). We also choose that z = 0 at the bottom of the sample and z = t at
the top of the sample, where t is the thickness of the crystal.
To correctly solve the problem we need to add the appropriate boundary conditions. We
know that the electrical current goes in the sample through the inner pad, that it comes out at the
outer frame, and of course, no charge transfer occurs through any other part of the crystal. As a
result, we have the following boundary conditions:
49
z A
z = t
z = 0
*r= R ^ r = R „ .
^ir = R.
•ir
r4 r = 0
Figure 18. Cross section of the Corbino disk sample indicating the notations used in text for the position of the contacts, etc.
I/7CRi^
I) Jz(r,z = t)= -< 0
I/7t(Rraax^-Rout^) for Roui ^ r < R„
for 0 < r < Rj
for Ri < r < Rou (3.21)
2) Jz(r,z = 0) = 0 <=> Ez(r,z = 0) = 0 (3.22)
3) Jr(r — RouiiZ—t) — 0 Er(Rout>t) — 0 (3.23)
Writing
V(r.z) = R(r) Ziz) (3.24)
and substituting the above expression into the differential equation (3.20) yields
50
r—\B^R^^ = Q , (3.25) r dr
r—
V Pc dz^
so that a set of two one-dimensional equations is obtained:
1 d ( d R ^ _ ^ 2 (3.26)
rR dr r-
dr
Pab 1 _ ,.2 . (3.27)
Pc Z dz'
Here k is an unknown real number. We have put the condition that k is a real number since the
solution of our problem, the electrical potential, is a real number. The two independent solutions
of the second equation are the exponential functions;
Z,=exp[(p/pab)'^kzj and Z2=exp[-(p/pab)'^kzJ . (3.28)
The general solution for equation (3.27) is a linear combination of Z| and Z2:
Z = aiZi + a2Z2 (3.29)
Recalling that E=-VV, the second boundary condition Ez(r,z = 0) = 0 is equivalent to:
dV/dz = 0 at z = 0 <=> R-dZJdz = 0 at z = 0 . (3.30)
Now let's look again at the expression (3.38) of the potential. If C.k = -Ck then the potential is
zero since the integral over all values of k vanishes. In order to have a nonzero potential k must
be limited to either positive or negative values. We choose them to be positive.
Note that so far the potential is still an integral due to the fact that we have no restriction
on the values of k. As soon as we are able to make the selection that will leave us with only a
litnited number of k values, the integral transforms into a over a finite k. We turn to the last
boundary condition;
Er(r=Rout,z=t) = 0 ^ 9V/3r | r=Rout = 0
or
JkdkCt (dJd(kr)/dr) (r=Rout cosh(ykt) = 0 (3.43)
Cleary, it is appropriate to select those k values for which dJo(kr)/dr 1 r=Rout = 0. This selection
eliminates many k values, however we still have an infinity of terms in our sum since there are an
inHnity of k values for which dJo(kr)/dr | ,=roui = 0. Basically, we can write our potential as a series
of products CkJo(kr)cosh(7kz), where each k corresponds to a frequency. At this point we make a
convergence test to reduce the number of terms in the sum. For that we calculated Co.oi. Co.i, C[,
Cio, Cioo. The value of the Ck coefficient decreases between one and two orders of magnitude
when k increases by one order of magnitude. As a consequence one can limit the sum to only
small values of k. On the other hand, we cannot have too few terms in our sum because the series
would be incomplete and the resulting potential shape would be oscillatory, which is incorrect. In
the end, I retained ICX) terms with k starting at O.Olfim'' and ending at l^m'', with an interval of
approximately O.Olfim'*. Thus, the final solution is:
Itc ' V ( r , z ) = ^ £ C , J ^ i k r ) c o s h { y k z )
D t=o.oi (3.44)
54
I wrote a short sequence in Mathematica that can provide the radial profile of the potential at the
top of the sample, z=t, and we present this in figure 19 using open symbols. Note that the value of
the potential is arbitrary, but the shape of the curve is unique.
2.5x10
-2.0x10
1.5x10^ -
,-6 -^ 1.0x10
w-
^ 5.0x10'^
0.0 -
-5.0x10 ,-7
0 '
50 100
5— V corrected — V ideal
~o-o-oo
150 200
r(nm)
250 300 350
Figure 19. Radial dependence of the calculated potential including corrections due to the current distribution, symbolized with open circles, and the potential obtained from the 1/r current distribution, represented with a continuous line.
In Figure 19, we also show for comparison the potential obtained in the ideal case
(continuous line), when the current is distributed in a constant thickness layer at the top of the
crystal. As expected, the potential in the middle region of the radius coincides well with the ideal
case behavior. In contrast, the center of the disk is very much affected by current spreading, as
55
evidenced by the larger voltage drop than in the ideal case. The potential at the edge of the disk is
also affected by the current distribution, although not as much as the center of the disk. This is
due to the fact that at the edge the current density is very small so that even if the current
distribution is squeezed into a thin layer at the top of the sample, the potential is not strongly
affected. Nonetheless, it is clear that the geometrical factors, ln(rn«.|/rn), from the expression (3.8)
of the potential obtained for a 1/r current distribution are no longer correct for the regions of the
sample affected by changes in the current distribution. In fact, the analyzed data measured on a
pristine BSCCO single crystal patterned into a Corbino geometry supports this statement.
0.4 H=1T, I=2mA
0.3
E j= 0.2 O
0.1
0.0 40 50 60 70 80 90
T(K)
Figure 20. Resistance versus temperature curves of all three radial contact pairs taken on pristine Corbil sample with a current of 2mA at a magnetic field of IT.
56
In Figure 20, I show three electrical resistance versus temperature curves corresponding
to the three voltage pairs tziken at a constant magnetic fleld of IT. As one can see, the order
relation Vi2>V23>V34 is respected at all temperatures. The positions r„ of the voltage contacts are
carefully estimated, the maximum error of our measurements being lOfim. Note that due to the
fact that the contacts are actually hemispheres of approximately 30^m in diameter, the position of
the center of the contact is taken to be r„. All attempts to make the data overlap by dividing each
of the curve by the ln(rn<.i/in) factor failed. If, however, we use the scaling factors calculated with
our model the curves collapse on top of each other, as shown in Figure 21.
Figure 21. Temperature dependence of the normalized electrical resistance of sample Corbil unirradiated for the three radial voltage pairs taken with the same current of 2mA at different applied external fields.
pristine Corbil I=2mA
(1.2) — (2,3)
(3,4) .
lOOOG
30 40 50 60 70 80 90
T(K)
57
In fact, the scaling is expected to work in all temperature regimes where the high-temperature
superconductor is in the normal state or in the vortex liquid state.
Although the Corbino geometry requires more attention in preparation, there are
experimental difficulties in applying the dot-like contacts and slight complications in estimating
the voltage drop for each contact pair, it is far more interesting than the standard four-probe
geometry. The main advantage is that it exhibits a nonuniform current density, which allows one
to study the vortex shear. Not many experiments were performed to study this feature. In
addition, beside the cited work by Marchetti and Nelson, there is no theoretical modeling or
description of the circular geometry. In section 3.6,1 have for the first time made calculations for
the normal state and the vortex liquid state, because this thesis is only concerned with the liquid
state. However, predictions could also be made for the solid state and for the transition to the
solid state, where nonlinear phenomena are predominant. For the case of the first order melting
transition, it would be interesting to know if the freezing occurs in rings, what are the conditions
for slipping motion, etc. I strongly encourage researchers to study thoroughly the Corbino
geometry and I hope that the present work will be helpful.
58
4. COMPARISON BETWEEN THE EFFECTS OF THE BULK PINNING AND
SURFACE BARRIERS ON VORTEX MOTION IN THE VORTEX LIQUID STATE
4.1 Introduction
The present chapter will be dedicated to the study of the effect that surface barriers have on the
transport properties of BSCCO 2212 single crystals. The experiments designed for this study
involve both the Corbino disk and the standard bar geometry. In the previous chapter we
described the circular geometry and its advantages. One of the advantages was that the transport
measurements from a Corbino sample reveal only the bulk properties of the material with no
contribution from the crystal surfaces, due to the fact that the vortices move in circles without
crossing the edges of the sample. This characteristic feature of the disk geometry makes it perfect
for isolating the bulk from the surface effects. However, measurements using sole the Corbino
geometry cannot be conclusive. A comparison needs to be made between a standard bar and a
disk sample in order to elucidate if the edge contribution to the electrical transport properties of a
superconducting material needs to be taken into account or is negligible. The experimental results
of this chapter have been published and can be found in reference (26).
4.2 BSCCO 2212 overview
BSCCO 2212 has a layered structure, which categorizes it as a 2D material. A well-
known property of layered high-Tc superconductors is the existence of extended low-temperature
tails in the temperature dependence of the in-plane resistivity for magnetic fields applied along c-
axis, see Figure 22. For example, in a sample with Tc=88K the vortex liquid has a freezing
temperature of 30K for an applied magnetic field of 7T.
59
H=7T
E 0.15
BSCCO 2212 single crystal H=0,0.05,0.3.1,3,5,7T I=2mA
Figure 22. Electrical resistance versus temperature plotted in linear scale at various magnetic fields for a BSCCO 2212 single crystal.
Although the critical temperature is high, as soon as the external magnetic field is turned on, the
tail of the resistance versus temperature broadens very much, pushing the regime of zero
dissipation towards low temperatures. For this reason, BSCCO 2212 is not a good candidate for
applications that require the materials to remain superconducting in the presence of high magnetic
fields.
As we already know from the introductory chapter of this thesis, due to the high
temperature of the superconducting transition of cuprates, the mixed state is divided into vortex
liquid and solid phases. As the high-Tc superconductor is cooled below the critical temperature in
the presence of a constant external magnetic field, flux lines start to nucleate in the crystal and
form a vortex liquid phase. When we cool the material even more, the vortex liquid undergoes a
60
phase transition and transforms into a solid. The nature of the transition depends on the applied
magnetic field and on the number of defects present in the structure of the crystal. If the system
were defect-free, the vortex solid would be a triangular lattice and the transition between the
liquid and solid phases would be first-order. If the crystal has a large concentration of structural
defects, which can affect the positions of vortices by pinning them down, the solid state will be
highly disordered and the transition to it will be of second order or higher. In available BSCCO
single crystals, pinning is strong enough to destroy the melting transition in the field range 1-lOT.
It is widely accepted and proved by J.Fendrich and coauthors (56) that whenever the liquid-solid
transition is of the first order, the electrical resistance data show a discontinuity in the form of an
abrupt drop from an arbitrary value to zero. We can clearly identify this jump at low fields in
Figure 23, which is a semilogarithmic plot to help visualize the discontinuity.
0.1
IE-7 40 50 60 70 80 90 100
T(K)
Figure 23. Electrical resistance versus temperature plotted in semilogarithmic scale at various low magnetic fields for a BSCCO 2212 single crystal.
61
At high fields the jump disappears, leaving a continuous decrease of the resistance until zero is
reached. While, for the sample in Figure 23 the upper critical point is approximately lOOG, there
are publications that show that the so-called upper critical point can actually vary from under
700G down to 0 (57). The magnitude of Hup depends on the number of the defects. If the crystal
is very clean, meaning that it has few defects, then Hup will approach the upper limit of the above
mentioned range. On the other hand, if the material is dirty or it contains many defects, it is
possible that the first order melting is never observed, in which case Hup=0. Thus, the upper
critical point, which is actually a tri-critical point, is a measure of the single crystal's quality.
Another quantity that can provide us information with information about the quality of the
material is the critical current. According to the Bean model (58), the size of the critical current
increases with the number of pinning sites, which was also obtained experimentally (59).
The work in this chapter is based on the concern that when a type II superconductor is
measured in the four-probe configuration the results contain a contribution from the sample
edges, as it seems to be indicated by reference (43). I am going to take the following paragraphs
to describe what we mean by edge effects.
In 1964, Bean and Livingston developed an elementary treatment of the interaction
between a flux quantum and the material surface for type II superconductors (42). When a the
flux thread first penetrates a material in the Meissner phase, there are two forces that act on it in
the vicinity of the sample edge: (i) the image force from the image flux thread outside the surface
and (ii) the Lorentz force due to Meissner currents. In order to satisfy the boundary condition of
zero current normal to the surface of the crystal an image flux line of opposite sign is added
symmetrically outside the surface. The circular currents around the vortex and its image will
combine to give a zero normal component of the current at the surface, as shown in Figure 24.
62
Vacuum Sample
.orentz
Meissner currents
Figure 24. Rux line, right hand side, and its image with respect to the sample edge viewed from above. The external field is applied perpendicular to the plane of the figure, pointing upwards.
Since two vortices of opposite signs attract each other, the flux line is attracted to the surface of
the sample. In other words, there is a surface barrier for a vortex that tries to move towards the
center of the sample. From expression (4.1) for the interaction energy between two flux threads,
we can see that the energy E increases with the distance x from the surface (42):
E(x)= e - (tff(/47t^)^K(/2x/X) for x> >A. (4.1)
63
In this exptession, e is the energy per unit length of a single flux line far from the surface, ({lo is
the flux quantum, Ko is the moditled Bessel function of zero order, and A is the penetration
length.
Since the material is in the Meissner phase, there are screening currents flowing at the
edges of the sample perpendicular to the direction of the external magnetic field. Due to these
Meissner currents, a flux line that just penetrated the sample will feel a Lorentz force, which will
push it away from the surface. Thus, this interaction produces a repulsive force from the surface,
therefore balancing the image force. The energy of the interaction due to the Lorentz force is
given by (42):
E'(x) = <l>oH e'^/4K. (4.2)
After adding the two contributions from expressions (4.1) and (4.2) and studying the
spatial variation of the result with the applied magnetic field, we see that there is an energy
barrier to flux motion into or out of the sample for low fields that are larger than Hei, the lower
critical fleld. Due to this energetic barrier, the surface of the sample acts as a pinning center for
the flux lines. This is the surface effect that might influence the transport properties of vortices in
crystals patterned into standard bar geometries. I should add that the above treatment was
developed for a single flux line, while in most of the cases the extemal magnetic field has such a
value that there is a considerable number of vortices in the superconducting sample. However, the
Bean-Livingston barrier gives us a good idea about the mechanism of the surface pinning.
The Bean-Livingston barrier, discussed above, was developed for a flat interface. Any
irregularity of the sample edge can modify the local surface barrier energy making it harder or
easier for the flux line to penetrate the sample, depending of the shape of the irregularity. There is
64
another contribution to the surface effect, which is called the geometrical barrier, and is due to the
shape of the cross section of the sample (60).
flux thread
Superconductor t
Figure 25. Initial stage of the vortex penetration at the superconductor's edge.
While Bean and Livingston's treatment starts with a vortex next to the surface, which has already
penetrated the sample, the geometrical barrier refers to the actual process of crossing the edge of
the sample. For a sample with flat surfaces and thickness t, the vortices initially cut through the
sharp rims of the crystal without complete penetration, thus effectively rounding off the curvature
of the flux lines on the order of t/2, as shown in Figure 25. As a result, in the edge region the
vortex energy increases from zero to a maximum value of €ot at a distance t/2 from the surface
due to the lengthening of the flux line. This increase in energy constitutes the geometrical barrier
that also acts as a pinning center for the vortices.
In this work, I will not distinguish between the two types of surface barriers, but I will
treat them together as a surface effiect on the transport properties of BSCCO single crystals.
43 Quality check and experiment description
The experiment consists of comparing the electrical transport properties of a BSCCO
single crystal patterned into a Corbino geometry with the ones of a standard bar geometry made
65
out from the same material. As I said before, the measurements from a disk geometry reflect
information only about the material's bulk properties, while the data from a four-probe
configuration contains both bulk and surface contributions. The two resulting sets of data are
compared and conclusions are then drawn about the effect of the surface barriers on the transport
properties of BSCCO 2212.1 prepared the samples out of BSCCO 2212 grown using a modified
floating-zone process in a double-mirror image fiimace with an extemal home-built control for
very slow growth (28). After repeatedly cleaving the original crystals, I selected thin platelet
crystals of about lmmxlmmx20|xm on which the electrical contacts were painted using silver
epoxy for each of employed configuration, Corbino and four-probe. Often, the quality of the
BSCCO crystals varies a lot, even if the crystals belong to the same batch, this material being
very susceptible to variations of the oxygen concentration.
1+
Vb* v.*
I-
Figure 26. a) the Corbino disk configuration and b) standard bar geometry obtained from cutting the disk along the dotted lines. Voltage contacts V>v and Vb and segments from the outer circle are conserved throughout the experiment.
66
Therefore, if we compare the properties of two different crystals, possible intrinsic differences
between the two specimens could be wrongfully attributed to the change of geometry. I prepared
a total of eight samples, both in the disk and standard bar geometry. However, the most
convincing experiment consists of measuring the transport properties of a crystal in the Corbino
geometry and cutting it afterwards into a rectangular shape, as shown in Figure 26a, so that it
could be further measured in the four-probe conflguration. For current injection, I used the
remainder of the disk's fnune contact and, for voltage contacts, a conserved pair of radial contacts
from the Corbino geometry. In this manner, the very same crystal with the same underlying
properties can be studied in both contact configurations. This experiment can be performed for
any superconducting material for the same purpose of studying the surface barrier effects. The
Corbino geometry, in particular, can be used for many other interesting experiments such as
transverse vortex correlation (see in chapter 7).
As we stated in the previous chapter, the Corbino geometry works properly if the crystal
is homogeneous. Before I start the final data analysis and interpreting the results, we should
check the quality of the Corbino sample; that is, the crystal patterned into the Corbino geometry.
For this purpose, it is required to have voltage contacts placed on different radii, as shown in
figure 26. This way, we can probe different regions of the crystal and compare them to each
other. If the sample is homogeneous, then the transport data taken at different contact pairs will
be similar. I have performed such a quality check on our disk samples and the result is presented
in Figure 27. Since all contacts were applied by hand, their radial positions are slightly different
from one pair to the other. Thus, from expression (3.8) it is clear that all voltage drops will be
different, making it difficult to compare raw data taken from different contact pairs. For the
purpose of comparison, in Figure 27 I have plotted normalized resistance data versus temperature
at different applied magnetic fields. In the inset of Figure 27, the comparison between the
67
electrical resistances of the two radial pairs, (Va, Vb) and (Vc, Vd) respectively, at zero field is
presented.
10
0.1
lE-3
lE-5
50 100 150 200 250 T(K)
— V . - V . -V -V *D *C -V -V *B *C -V -V " d * A
H=500G
40 50 60 70 80 90 100
T(K)
Figure 27. Main panel: Normalized electrical resistance versus temperature for different magnetic fields. The measurements were performed using many equivalent pairs of contacts as described in the text. Inset: Zero field temperature dependence up to room temperature of the resistance measured along the two radii of the disk.
In addition to the data from the same contact pairs as the inset, the figure also shows
measurements for the crossed pairs, (VB, VC) and (VA, VD). If the radial voltage pairs give us
information about the properties of a small crystal region around the probed radius, the crossed
pairs provide us with data that reflect the properties of the material situated between the two radii.
This is a thorough test of the sample homogeneity. As one can see firom Figure 27, the electrical
resistance measured at all contact pairs follows a similar temperature dependence, indicating
homogeneous current flow and material properties. A difference between the measured
68
resistances becomes appreciable only at very low dissipation levels. These differences are likely
to be due to local variations of the pinning properties within the large crystals that were used. All
my Corbino samples show similar results when tested for quality, which indicates that the
samples have an isotropic radial current distribution.
4.4 Experimental results and interpretation
Shown in Figure 28 is a comparison between the normalized electrical resistance versus
temperature obtained in the Corbino disk and standard bar geometry experiments performed in
the same, but cut, crystal as described in section 4.3.
sample 1
1 —°— Corbino
Corbino cut H=0,40,100,300,650, 2000 and 5500G I=lmA
0.1
0.01
8 1E-3
1E-4
1E-5
1E-6 80 90 100 30 40 70 50 60
T(K)
Figure 28. Comparison of the normalized electrical resistance versus temperature for a Corbino disk and a rectangular sample at various applied magnetic fields.
69
The resistance data aie normalized to their values at lOOK to account for the different current
densities. It can be seen that, for all measured magnetic flelds, the electrical resistances in the
vortex liquid state are practically indistinguishable. I have obtained similar results for all the
Corbino samples, for which I present examples in Figure 29.
In addition to the electrical resistance, other physical parameters can be compared. Early
transport experiments on BSCCO 2212 single crystal found that the resistivity in the vortex liquid
state is described by a thermally activated temperature dependence of the form (61):
p(T) = poexp[-Ud(H)/kT}- (4.3)
Corbino Standard
Sample 3
H=40G
Sample 2
20 40 60 80 100
T(K)
Figure 29. Main panel and inset: Comparison of the normalized electrical resistance versus temperature from additional similar experiments to those illustrated in figure 28.
70
Uo is called the activation energy and was estimated to be about 700K for an applied magnetic
field of 0.5T. Within a single-particle scenario, the thermally activated behavior of the electrical
resistivity is understood as originating from the vortex hopping between pinning centers in the
bulk of the superconductor. Therefore, this is a model that disregards the surface effects and
assumes that the vortex motion is controlled by bulk properties. I can compare the activation
energies of the disk sample and the rectangular one. If they are similar, than the surfaces do not
influence the vortex motion. However, if the two activation energies are very different, the
comparison makes no longer sense and the contribution from the surface barriers cannot be
neglected.
10000
1000 • Corbino
- standard
10
O 1 X
0.1
T r
J I 40 60 80
T(K)
I I I I I 1 1 1 100 1000
H(G)
Figure 30. Main panel: Magnetic field dependence of the activation energy Uo for a disk and a bar-shaped sample. Inset: Zero-resistance lines for the Corbino disk and rectangular samples.
71
Seen that Uo is determined from raw resistivity data, which show no appreciable
difference between the normalized resistances of the Corbino sample and the standard bar, we
expect also that the activation energies corresponding to the two configurations to have a similar
trend. Indeed, after plotting together the estimates of Uo obtained from the two sets of data
measured before and after the cutting of the Corbino disk sample, we see that the two activation
energy curves are very close one to the other (Figure 30).
In the inset of Figure 30, we present the irreversibility line, defined when the measured
electrical resistance drops below 10"^ of its value at lOOK. These lines are practically identical for
both types of samples, which indicates that the same mechanism is governing the flux pinning in
the different geometries.
In conclusion, the experiments indicate that the electrical transport properties for our
particular BSCCO 2212 samples are not significantly affected by surface effects. Since we know
that the surface effect is real, the only explanation is that the edge pinning is very weak in
comparison with the bulk pinning so that it is not observed in the temperature and field regimes
used in the measurements. On the other hand, soon after the publication of these results (26), a
similar experiment was reported by Rycroft and coauthors, in which differences between the
transport properties of a Corbino disk and a four-probe configuration were seen (46). This would
imply that the surface barrier effects are not negligible. However, I have to make a comment that
the crystals used in reference 46 came from a different source. Therefore, their intrinsic properties
will be different. In particular, a comparison of the upper critical points of one of our samples
with and the crystal from reference 46 reveals that our crystal has a lower Her, thus a greater
concentration of point defects. Although the number of defects is not large enough to completely
destroy the first order melting, they could provide a much larger pinning than the edge. In this
reasoning, a very clean sample would clearly show the surface effect in its transport properties
72
when measured using a four-probe configuration, while a dirty crystal would be dominated by the
bulk behavior.
73
5. TRANSPORT PROPERTIES OF IRRADIATED HIGH-TC SUPERCONDUCTORS
S.l Introduction
The purpose of this chapter is to give an overview of the background information on the
effect of the columnar defects created by heavy-ion irradiation on the transport properties of high-
temperature superconductors. This information will be needed in chapter 7, when two BSCCO
Corbino samples will be irradiated with high energy ions.
The presence of disorder in the crystalline structure of cuprates, in general, drastically
affects the vortex motion both in the liquid and solid states. The nature of the vortex melting
transition and implicitly the phase diagram are also altered by the defects. In clean samples, the
transition from the vortex lattice to the vortex liquid was shown to be of first order (10,12,13,62).
The introduction of disorder into the system seems to suppress the first order phase transition (63)
since the vortices can no longer form a regular lattice. Depending on the type of disorder, various
glassy vortex states have been suggested for the vortex solid phase (64-68), in particular Bose
glass for the systems containing columnar defects.
There are many fundamental and practical advantages and applications of the controlled
introduction of columnar tracks into the structure of the high temperature superconductors. Phase
transitions are an area of fundamental interest in solid-state physics. The irreversibility line is
shifted towards higher temperatures - a feature that can be very useful for superconducting
devices that are designed to work at high temperatures (24). Another consequence of heavy ion
irradiation is that the critical current is enhanced considerably (17). A direct application of this
would be the manufacture of superconducting wires that can support a high current. However, in
this chapter I will simply describe the effect of the crystal irradiation on the fi-eezing temperature
of the vortex liquid in YBCO due to the created pinning centers. The beneficiary is the
experiment presented in chapter 7, in which a BSCCO Corbino sample will be selectively
74
irradiated in order to create a pattern necessary to the study of vortex shear. Although the two
materials (YBCO and BSCCO) are slightly different, the effects of the columnar defects on the
vortex dynamics are similar. Therefore, I can use the conclusions of the present chapter in support
of the data discussed in chapter 7 of this work.
5.2 Experiment description
The experiment consists of irradiating, with different densities of columnar defects, a
series of YBCO crystals with similar initial characteristics and studying the change in their
electrical properties. The density of defects is usually defined by the equivalent dose matching
field B«i> necessary to produce the same vortex line density as the tracks, i.e. n<iefecu=Ndefecu/Asainpie=
Bo/4>o- Single crystals of YBCO were prepared using the flux growth method described in
chapter 2.1 chose a good quality crystal of considerable dimensions, 10S0|xmx79S|imx8S|J.m and
after annealing, detwinning and polishing, it was cut it in five similar slab-like pieces with the
approximate dimensions 2(X)^mx79S^mx20^m. Note that the last dimension, which corresponds
to the thickness, is now 20^m. The sample was thinned down by polishing in order to make sure
that all heavy ions would pass through the crystal during the irradiation, producing straight tracks
in the crystalline structure as explained in chapter 2.
For a systematic study that aims to individualize the effect of columnar defects on the
transport properties of YBCO, it is best to start with a clean, untwinned crystal to which columnar
defects can be added. Twin boundaries can behave as correlated defects and introduce extra
features in the transport properties due to phenomena like guided motion of the vortices parallel
to a twin plane (69). Therefore, the information extracted from an experiment performed on a
twinned irradiated sample would also contain a contribution due to the pinning from the twin
planes present in the system. For an experiment designed only to monitor the general trend in the
change in the electrical properties of HTSC with the dose of columnar defects, it is not critical to
75
have a clean crystal. In the following sections, I am going to show results in both twinned and
untwinned YBCO samples. Note that irradiated BSCCO single crystals, which will be discussed
in chapter 7, do not grow twinned. However, they could contain a large number of point defects,
which also act as pinning centers.
Returning to the sample preparation, all five pieces resulting from the crystal cleaving are
prepared into four-probe configurations by the method described in chapter 2. Four of these
samples were irradiated with various doses of defects, while the fifth one was left untouched and
kept as a reference crystal. Since all five samples belong to the same original crystal, we can
assume that the underlying properties are identical, which is very important for the data analysis.
If there were considerable initial differences between the crystals, then one could not be sure if
the post-irradiation experimental results were due to the newly-introduced disorder or some
inhomogeneities already present in the system. On the other hand, if all crystals have the same
intrinsic properties to start with, then the resulting change in electrical properties will only be
associated with the additional disorder introduced by the different doses of columnar defects.
The irradiation took place at Michigan State University, National Superconducting
Cyclotron Laboratory and used a beam of Au®^* ions with the energy of 2 GeV. The direction of
the columnar defects was chosen to be parallel to the c-axis of the crystal since all transport
measurements are performed applying the magnetic field perpendicular to the ab-plane. As
already stated in chapter 2, it is expected that the columnar tracks are most effective pinning
centers when aligned with the direction of the flux lines. The defects are straight cylindrical
tracks with an amorphous core of approximately 4 to lOnm in diameter (70). The defect size is
comparable to that of the vortex core, which ensures that the columnar tracks are highly suitable
as anisotropic pinning sites. The chosen dose matching fields were 500G, lOOOG, IT, and 6T.
One can clearly divide the doses into two categories: low and high densities of columnar defects.
76
It will become clear in the following section that the effects of the columnar defects on the
transport properties of Y6CO can be different depending on the size of the given dose.
S3 Experimental results
In Figure 31, I present electrical resistance versus temperature measured at different
magnetic fields on the unirradiated reference sample yba304. For magnetic fields between 1 and
9T, the pre-irradiation data show a sharp 'kink' in the tail of the resistive transition associated
with the first order vortex melting transition.
0.010
sample yba304 unirradiated I=lmA X
0.03
0.00 70 75 80 85 90 95 100
T(K)
Figure 31. Electrical resistance versus temperatures of an untwinned YBCO single crystal at various magnetic fields. The arrow indicates the kink associated with the first order liquid-solid transition at 7T. The inset shows the tail of the resistive transition at 7T.
77
The arrow in Figure 31 indicates the sharp drop in the temperature dependence of the resistance
taken at a constant field of 7T, which is shown enlarged in the inset of Figure 31. Below the
transition temperature the measured resistance is zero, indicating that as soon as the vortices have
solidified, they become pinned as a whole by the point defects present in the crystal. As a
consequence, the Lorentz force is unable to move the vortices and the total dissipation is zero.
According to thermodynamics, for a first order phase transition of a magnetic system to
occur, there must be a discontinuity in the first partial derivative of the free energy, the
magnetization. Therefore, thermodynamic evidence of a first order phase transition in YBCO was
obtained in magnetization measurements (12,13). A direct correlation between the kink in the
resistivity and the thermodynamic first order vortex melting transition was established afterwards
by a simultaneous measurement of the resistivity and magnetization on an untwinned YBCO
crystal; this confirmed that the jump in the magnetization coincided with the onset of the kink in
the resistivity (56). There have been also calorimetric measurements (14) and torque-
magnetometry experiments (71), all of these providing evidence for a first order transition from a
vortex liquid state to a solid lattice phase. For magnetic fields smaller than IT and larger than 9T,
a jump is no longer detected. Instead, the resistive drop becomes gradual. I have already defined
the upper critical point in the previous chapter as the magnetic field above which the first order
transition disappears, which for the sample from Figure 31 would appear to be slightly greater
than 9T. Correspondingly, I will define here a lower critical point as the magnetic field below
which the jump in the resistive tail is not observed. In our case, the lower critical point seems to
be somewhere between 0.5 and IT.
Finally, the last distinctive features, which are noticeable in Figure 31, are the long tails
that appear in the temperature dependencies of the electrical resistance immediately below the
kinks. This feature has been called the peak effect (72). Note that it appears only for a reduced
magnetic field range between I and 6T. The peak effect was explained by a softening of the
78
vortex lattice followed by a rearranging of the vortex positions with respect to the pinning centers
locations in order to minimize the total energy of the system. This is the reason why the electrical
resistance does not fall to zero, like in the inset of Figure 31. Instead, the long tail is observed.
The peak effect is the result of the competition between the elastic energy of the vortex lattice and
the pinning potential of the columnar defects.
0.04
0.03
0 0.02 01
0.01 -
0.00 0.06
0.04 -
o ct
sample ybaSOO B<|)=0.05T
H=1 to IIT I=lmA
0.02 -
0.00
sample ybaSOl B<1)=0.1T
H=1 to 1 IT 1=1 mA
80 85 90
T(K)
100
Figure 32. Temperature dependence of the ac resistance for magnetic fields between 1 and 1 IT of sample yba300 irradiated with a dose matching field of 500G.
79
In Figure 32, I show the resistive transitions for magnetic fields ranging from 1 to 1 IT
(with an interval of IT) for the samples irradiated with the smallest doses of columnar defects,
B<i)=0.05T (upper panel) and O.IT (lower panel). As one can see, the samples still exhibit first
order melting. However, the peak effect has disappeared, implying that the quantity of defects
that were introduced through irradiation are capable of better pinning the vortex lattice at all
temperatures below the transition for an applied current of 1mA.
1.0
0.8 -
0.6
0.4 -
0.2 -
0.0 70
- unirradiated B(M).05T
B<M).IT
H=2,4 and 8T I=ImA
75 100
Figure 33. Comparison of the electrical resistance in the vortex liquid phase for the unirradiated and the low dose samples for various magnetic fields.
Thus, the peak effect will also not be present for the samples irradiated with higher doses.
At the first glance, there is no obvious difference between the data for 500G-dose and the
lOOOG-dose samples. A more careful comparison (Figure 33) reveals that the resistivity in the
80
vortex liquid state has diminished due to pinning from the added columnar tracks. The position of
both the upper and lower critical points is also affected by the introduction of the columnar
defects in the system (73). The authors in reference 19 have found that both critical points are
shifted towards higher magnetic fields. In my samples, I do not see a change in the position of the
upper critical point, but the lower critical point has increased for the sample with Bo=0.1T.
One can also show how the pinning increased by performing magnetization
measurements. In such an experiment the crystal is cooled down to the temperature of interest,
the magnetic fleld is gradually swept up and then down and all this time the magnetic moment of
the sample is measured through any of the following methods: SQUID magnetometry. Hall probe
magnetometry, etc. A high-temperature superconductor has a negative magnetization while in the
mixed state due to the fact that the magnetic field is expelled from some regions of the sample.
If the crystal has defects that pin the vortices, the magnetization will acquire an
irreversible characteristic (the magnetization of the sample when the field is increased will be
different from the one when the field is decreased). As a consequence, such a magnetization
measurement will look like a loop after a complete sweep of the magnetic field. According to
Bean's model, the width of the magnetization loop is proportional to the pinning strength of the
defects present in the crystal.
I have setup the measurement system for taking a magnetization loop using the Hall
probe magnetometry technique. I have performed magnetization measurements on a YBCO
single crystal not involved in the transport experiment described in this chapter. In Figure 34, I
am showing a comparison of magnetization loops taken before (upper panel) and after (lower
panel) the irradiation of this crystal with a dose matching field of 1S(X)G, a value close to the low
doses studied in the transport experiment (SOOand lOOOG in samples yba300 and 301). I have
maintained the same scale on the upper and lower plots in order to make the comparison easier.
As one can see, as a consequence of the irradiation, the width of the magnetization loops has
81
increased - therefore, the pinning has increased - although not by much since this crystal has only
a low density of columnar defects. Similar measurements obtained for crystals irradiated with
higher densities of defects show an even larger enhancement of the pinning (74).
0.012
0.006
> 0.000
> I
-0.006
-0.012
0.012
0.006
> 0.000
> I
-0.006
-0.012
0 2 4 6 8 10 12
H(T)
1 r—' r—' 1 r—• 1 ' 30K
. 40K pristine .
1 1 1 1 1 1 1 1 1 1 *-
\ irradiated . V
/
• /
I
r/ • « I • I I I I L
Figure 34. Magnetization loops on a untwinned Y6CO single crystal before (upper panel) and after (lower panel) the irradiation with B<»=1S(X)G.
82
Returning to the transport experiment, after the irradiation with 64,=! and 6T, the kink
has been replaced by a smooth monotonic decrease in the electrical resistance, indicating that the
first order melting has been completely suppressed by the irradiation and transformed into a
transition of second order or higher (Figures 35 and 36). The vortices cannot form a lattice
anymore, since they are pinned by the columnar defects that are randomly distributed throughout
the sample, thus determining a disordered solid phase. This indicates that the pinning from the
columnar defects is very effective and stronger than the vortex-vortex interaction. The resistance
curves also shrink closer together as the dose is increased. At the highest dose, the slopes of the
resistivity curves taken at different fields are nearly parallel, as shovm in Figure 36. Clearly, the
freezing temperatures, or the temperatures when the dissipation vanishes, are much higher than
for the unirradiated sample. This effect will be of importance in chapter 7, where the properties of
irradiated BSCCO Corbino samples are discussed.
sample yba302 B«t»=IT H=1 to IIT I=lmA
0.00 70 75 80 85
T(K)
90 95 100
Figure 35. Temperature dependence of the electrical dependence for magnetic fields between I and 1 IT of sample yba302 irradiated with a dose matching Held of IT.
83
Other consequences of the defect introduction are: the zero field transition temperature,
Tc, determined firom the maximum in the temperature derivative of the resistivity, dp/dT, is
shifted to lower temperatures, and both the width of the transition, ATc, and the normal state
resistivity, p„(100K), are increased. Before irradiation, the zero field transition temperature of the
crystal was Tc=93.16K and as a result of irradiation it decreases down to 91.88K for B4,=6T. An
increase in the normal state resistivity near T=1(X)K of about 3.4% is observed between the
unirradiated and the B<i>=0.1T irradiated crystal. Moreover, the crystals irradiated with 84.=IT and
6T showed larger increases in the normal state resistivity, 20% and 27.5% respectively. This is
attributed to the large damage inflicted upon the sample at these high doses.
0.07
0.06
0.05
^ 0.04 E JZ 2- 0.03
0.02
0.01
0.00 70 75 80 85 90 95 100
T(K)
Figure 36. Electrical resistance versus temperatures of sample yba303 with B<t>=6T at various magnetic fields between 1 and 1 IT.
sample yba303 B«t)=6T H=1 to IIT I=lmA
84
For example, a dose of B<»=6T produces a columnar defect spacing of about 187A. Since the
columnar defect cores are about lOOA in diameter, this suggests that there is no separation
between the perimeter of the columnar defects, implying a completely damaged sample.
However, it is clear from the data presented in Figure 36 that the sample still has superconducting
properties. This issue is not yet very well understood.
12
10
8
6
41-
0
0.75
- unirradiated B<t>=500G
B<|»=1000G
B<|>=IT
B<|>=6T
0.80 0.85 0.90
T/Tc
0.95 1.00
Figure 37. Melting lines (open symbols) for the unirradiated sample and the low dose crystals and irreversibility lines (fiill symbols) for the high dose samples. Each line has been plotted versus the normalized temperature T/Tc, where Tc is each crystal's critical temperature.
By tracing the field dependence of the zero resistance temperature (lO'^Q), the
irreversibility lines can be mapped in the phase diagram for all studied YBCO samples. Figure 37
displays the irreversibility lines for samples yba302 and 303 together with the vortex lattice
85
melting lines for samples yba300, 301 and 304. Notice the distinct change in slope of the
irreversibility line of sample yba302 at the matching field IT, which is shown by the solid
triangles in Figure 37. The irreversibility line displays a linear behavior above H=1T, following a
faster variation with the temperature below IT. This change in slope indicates a change in vortex
pinning behavior.
For magnetic fields below B«»=1T, there are more columnar defects than vortices, so that
each vortex can be pinned by a colunmar defect. For this regime, the irreversibility line is
characterized by a concave upward rise. However, for magnetic fields above the number of
vortices exceeds the number of defects, ensuring that the defects are not as efficient at pinning the
vortices. Moreover, at higher vortex densities there are bundling effects that reduce even more the
effective pinning. Consequently, the sharp rise in the irreversibility line is replaced by a linear
behavior with a reduced slope.
Similar results were obtained by A. Mazilu and coauthors (27) in a series of twinned
YBCO thick films irradiated with various high doses of columnar defects (Figure 38). As one can
see, the irreversibility line is shifted towards higher temperatures as the dose increases. However,
the shift seems to be greater than the one presented in Figure 37. I believe that the difference
comes from the fact that the samples used in the two experiments are different, untwinned
crystals versus twinned films. Also, the heavy ions used for the defect creation were different;
gold for the crystals and uranium for the films, and it has been shown that the columnar tracks
produced by uranium irradiation are the most effective pinners (Olsson R. J., submitted for
publication). Nonetheless, the irreversibility lines of the irradiated twinned samples exhibit the
same sharp upward rise observed for the untwinned crystals at temperatures close to Tc.
86
10
8
6
4 —Unirradiated
•A—B«|)=1.5T
—B<|)=3T
—B<{>=4T
2
0 0.80 0.85 0.90 0.95 1.00
T/Tc
Figure 38. Irreversibility lines for the unirradiated and irradiated YBCO thick films.
The results indicate that the irradiation of crystals with a low dose creates only minor
changes in the transport properties; that is, a slight reduction of the electrical resistivity in the
vortex liquid state, without affecting the liquid to solid transition temperature. For the experiment
in chapter 7, when parts of a BSCCO Corbino sample will be irradiated, a dose of IT will be
chosen to make sure that the vortices in the irradiated regions are strongly pinned and their
irreversibility line has considerably shifted towards higher temperatures, hi other words, a
condition is required in which the vortices in the irradiated areas freeze at a temperature higher
than the corresponding temperature in the pristine parts of the crystal. A dose matching field of
IT will have a much larger influence on the transport properties of BSCCO compared to YBCO
since the former is very sensitive to disorder. Recall that the upper critical point of an as-grown
BSCCO single crystal could reach only a few hundred gauss in a clean specimen, while in YBCO
it can be hundred times larger. This shows that the electrical properties of BSCCO single crystals
87
in the mixed phase are strongly affected by even a small quantity of disorder. As has been
demonstrated, a dose of IT of columnar defects will enhance the freezing temperature of the
vortex liquid in YBCO single crystals. Therefore, this is expected to be an appropriate value for
the experiment in chapter 7.1 should add that we used the same heavy ions with the same energy
to irradiate the BSCCO Corbino samples.
88
6. TRANSVERSAL VORTEX CORRELATION IN UNIRRADIATED BSCCO CORBINO
6.1 IntrodBction
This chapter contains a stu<fy of correlated vortex motion in pristine BSCCO single
crystals patterned as Corbino disks. Three single crystals of BSCCO 2212 coming from different
batches were cleaved several times in order to achieve the thickness between IS and 30pm and
then prepared into circular geometries. Recall that in chapter 4,1 applied only one pair of voltage
contacts along one radius of the disk, which was enough to serve the purpose of measuring the
bulk properties of the superconducting material. In the present chapter, at least two pairs along
the disk radius are required since we are interested in measuring the transport properties from
different regions and comparing them. Here, I am going to exploit the second property of the
Corbino geometry described in chapter 3, the fact that the current density is nonuniform. The
typical sample used in our electrical transport experiments looks like the one depicted in Figure
Figure 39. Corbino disk geometry showing typical voltage contact notation used in the present chapter. The number of voltage probes on each of the used samples differ, depending of the size of the crystal.
39.
89
6.2 EmerimeBtal results
I performed electrical transport measurements on three Corbino samples with multiple
radial voltage contacts: Kado4, Corbil and Corbi2. More precisely, the ac resistivity of all contact
pairs, usually two at a time, at different magnetic fields and with different currents were measured
while the sample was cooling down. Figure 40 shows typical temperature dependence of the
signal collected from one of the voltage pairs of sample Kado4. For low fields, between 30G and
HOG, one observes the abrupt jump associated with the first order transition; when the vortex
liquid freezes and forms a lattice. The height of the jump decreases and vanishes at larger
magnetic fields, where the transition is continuous. In this regime, the vortex liquid freezes
gradually into a disordered solid through a continuous transition of second order or higher.
I
0.1
— 1 1 r : H=30,50,70,90,110,
r 300,500,700,1000, : 3000,5000,100000 r I=2mA
T ' 1 r
E
T(K)
Figure 40. Electrical resistance versus temperature at various magnetic fields measured on sample Kado4. Low field data exhibit a first order transition from the vortex liquid state to a flux line lattice.
90
Comparing this crystal with the ones used in the experiments presented in chapter 4, one can say
that the quality of Kado4 is superior to the ones of the BSCCO samples from the surface barrier
stu(fy. The upper critical point of Kado4 is around 130G, higher than the ones of the crystals from
chapter 4, which had an upper critical point of approximately 60G. This fact implies that the
single crystal from which Kado4 is made is clean, containing only few structural defects. Samples
Corbil and Corbi2 are also very good quality crystals, their transport properties being similar to
the ones of Kado4. However, a slight difference between Kado4 and the other two Corbino
samples is expected, because they were grown by different experimental groups.
Due to the fact that the current density is nonuniform in the ab-plane, the Corbino
geometry is the only kind of geometry that allows the observation of transverse vortex
correlation. Here, transverse implies the direction perpendicular to the vortices, therefore the
correlation direction is along the ab-plane. Initially, when analyzing the data, I was looking to see
if the vortex liquid state in BSCCO samples exhibits the 1/r electrical field behavior described in
chapter 3. This would have been a confirmation of the Lopez et a/.(4S) data, which show that the
l/r behavior is respected in the vortex liquid flow in YBCO Corbino samples. If there were no
transversal correlations in the vortex liquid state, so that the vortices move as fast as dictated by
the local Lorentz force, the signals collected from any radial pair would be given by expression
(3.8). For an anisotropic material like BSCCO, the radial signals will no longer follow expression
(3.8), as discussed in section 3.6. However, they will satisfy the hierarchy relation (3.9),
V|^V23>V34. As a consequence, the data measured from various radial pairs (n,n+l) can be
scaled with the scaling factors being either ln(r„<^|/rn) or some constants given by our simulation in
section 3.6. If, for any reason, the vortex liquid exhibits transversal vortex correlations, then we
expect to see deviations from the 1/r-behavior, with the size of the deviation depending on how
strong the correlation is. The vortex dynamics will then be nonlocal, meaning that the motion of
the vortices in one region of the sample will be affected by the motion of vortices located in a
91
dififerent region. The transverse vortec correlation can be created by shear viscosity, for example.
Until now, it was believed that the shear modulus is always zero in the vortex liquid state and
only different from zero in the vortex solid, where it is associated with strong interactions
between the vortices. However, deviations from the 1/r behavior in the liquid state in BSCCO
Corbino samples are observed, the evidence for which I will present below.
In Figure 41, the ac signals from different radial pairs for each of the studied samples is
compared. Plotted are the electrical resistance versus temperature curves measured on the two
radial voltage pairs, V12 and V23, of sample Kado4 at different applied magnetic fields.
Kado4
£ O
0.1
0.01
1E-3
1E-4
1E-5
1E-6
1E-7
: I=2mA • '
• open symbols i full symbols
——O.IT ——0.3T ——0.5T —<•—IT
Figure 41. Temperature dependence of the electrical resistance of V12, shown in open symbols and V23, shown in fiill symbols. Data were taken simultaneously for the two radial pairs using a current of 2mA. Each symbol shape corresponds to a different applied magnetic field.
92
In Figures 42 and 43, I show the temperature dependencies of the outermost radial pairs of
samples Corbil and Corbi2. This is the central result of the chapter. While at low fields the order
relation (3.9) is respected, one notices that at high fields the voltage from the pair located closest
to the outer fhune of the Corbino disk becomes larger than the signal from the pair adjacent to it
as the temperature is reduced. More explicitly, for sample Kado4 we have V23>V|2, for Corbil
V34>V23, and for Corbi2 Vs6>V4s; the numbering of the voltage probes starting at the center of the
disk.
0.1
0.01
-g- lE-3
6 ai
IE-4
23
34
lE-5
IE-6 iOO 80 20 40 60
T(K)
Figure 42. Electrical resistance versus temperature versus temperature for the two outermost radial contact pairs of sample Corbil at three different magnetic fields. The arrows indicate the crossing between V23 and V34 signals, which is an indication of transverse vortex viscosity.
The &ct that the order relation is not respected anymore is the first indication that the vortex
liquid does not exhibit the 1/r behavior. Obviously, these data cannot be scaled anymore; the
93
crossing between any two pairs of contacts making it impossible. Now, since the Lorentz fi)rce is
very small close to the outer fiame, one would expect the vortex velocity to be vety small in this
region. Instead, the experiment shows that there is a temperature range for which the outer ring of
vortices rotates faster than th^r are supposed to move, as if they were dragged by the adjacent
vortices that move with a larger velocity. Thus, the experiment provides evidence for the dynamic
transverse vortex correlation.
I wish to point out that this effect seems to be dependent of the material properties and of
the size of the geometry. For example, sample Kado4 exhibits vortex correlation at much lower
fields than sample Corbil. Recall that the sources of these two BSCCO crystals are different
0.015
Corbi2
45 0.010
E H=7T, l=2mA .c P
0.005 -
0.000 100 80 40 60
T(K)
Figure 43. Temperature dependence of the outermost voltage pairs of sample Corbi2 taken at an external field of 7T. The displayed effect is much weaker than the one presented in figures 3 and 4.
94
Also, the sample size explains the difference between Corbil and Corbi2. Sample Corbi2 is larger
than sample Corbil and, although it has simflar intrinsic properties with the latter, it displays a
weaker deviation from the l/r behavior than Corbil. Moreover, there are no reports in the
literature about transverse vortrac correlation in YBCO Corbino disks. As we learned in chapter S,
YBCO is a superconducting material with a critical temperature very close to that of BSCCO
when both materials are optimally doped. However, the properties of the vortex liquid state in
YBCO are different than that in BSCCO. For example, the upper critical point is much higher in
YBCO, usually around 8T, as opposed to a few hundred Gauss, which is typical for a very clean
BSCCO single crystal.
Although all three samples show similar characteristics, fixim now on I will concentrate
on sample Corbil, since this sample has the most complete set of data. The data in Figure 42 were
measured using an electrical current of 2mA. One could ask how the behavior of sample Corbil
changes if the probing current is varied. Do we still see the effect of the transverse vortex
correlation? To determine the answer the IV curves of all radial pairs were measured in the
regime of temperatures and magnetic fields for which deviations fi^om the l/r behavior are
expected. When taking an IV characteristics the temperature and external field are kept constant,
while the dc probing current is applied in increasing steps and the voltage signal is measured by a
nanovoltmeter. To avoid thermal drifting effects, the current is applied successively in both
directions and the two potential difference readings are subtracted and averaged to provide the
actual voltage signal. Using the already acquired temperature dependence of the resistance shown
in Figure 42 as a guide, I chose to perform this measurement at H=7T for three different
temperatures 44,47 and SOK. The obtained IV characteristics are presented in Figure 44. As one
can see, at T=SOK the voltage pairs exhibit the hierarchy dictated by the radial dependence of the
Lorentz force, Vi2>V23>V34, for all probing currents.
Figure 44. FV characteristics for all radial pairs of sample Corbil, V12, V23 and V34, taken at three temperatures, 44,47 and 50K, at an applied magnetic field of 7T.
96
At a lower temperature, 47K, the signals measured on the two outermost contact pairs almost
coincide, while at the lowest temperature, 44K, V34 becomes larger than V23 for any current up to
ISmA. Therefore, one can conclude that the transverse vortex correlation can be observed in
transport measurements for ai^ applied electrical current.
In Figure 4S, I show the normalized resistance versus temperature data for the same
contact pairs on sample Corbil as in Figure 42. For each external magnetic field, one can clearly
see the temperature where the deviation from 1/r occurs. Above this temperature, the normalized
signals overlap, meaning the motion of the vortices is uncorrelated. Below the onset of deviation
temperature, the scaling does not work anymore and one can clearty see the regime where the
edge vortices move faster than they would under the Lorentz force.
Corbil
20 40 60 80 100
T(K)
Figure 45. Normalized electrical resistance versus temperature of Vjs and V34 in sample Corbil, same applied magnetic fields as figure 4.
97
Similar results were also obtained by Eltsev and coauthors (48) on a optimalfy doped
BSCCO crystal patterned into a Corbino geometry. However, th^ did not observe the strong
deviation evident in our experiment, in the sense that their outermost voltage never crossed any of
the other radial signals. Eltsev et al. could only illustrate the deviation from uncorrelated flux
motion when the data from the two radial voltage pairs was normalized and plotted together. A
possible explanation of this could be that the authors of reference (48) used only low magnetic
fields. In addition, we know that the effect is material and size dependent. After studying the
graphs from reference (48), one can say that the single crystal used by Eltsev and coauthors has
better quality than ours. Also, the size of their Corbino disk is larger than the dimension of any of
our three samples. Thus, one would expect a smaller influence from vortex correlation since the
data in this thesis suggests that the effect weakens for large samples.
Consistent in all data is that the innermost voltage pair V|2 is always larger than any of
the other two radial pairs, no matter the temperature, magnetic field and electrical current. One
explanation would be that close to the center of the disk the Lorentz force is much stronger than
the transversal drag due to the viscosity and therefore, the vortices in this region are not
influenced by the viscosity. This is similar to what Lopez et al see in the vortex solid state in a
YBCO Corbino sample. Due to the fact that the Lorentz force is very large close to the inner
current contact, the lattice does not rotate as a whole and instead breaks in independent solid
rings. Once the lattice broke, there is no interaction between the adjacent rings. In my experiment
since it involves the vortex liquid phase, I cannot talk about solid rings, but I can still say that the
vortex matter separates in two regions that do not interact with each other. There is a central
region, which moves according to the local Lorentz force, and an outer region, in which the
vortex dynamics is nonlocal and there is transverse vortex drag.
One other important feature that is observed in the data is a very weak nonlinearity of the
electrical resistance. It becomes clear when the resistance versus temperature curves taken for
98
difTerent values of the probing current at the same applied magnetic field are plotted together (see
Figure 46). As one can s^ at high temperatures all the curves overlap, implying that the response
of the vortex liquid to the Lorentz force is local and linear. At low temperatures, there is a
splitting between the various curves, in the sense that the resistance measured with high electrical
current is larger than that taken with smaller currents. I said that this feature is weak since it is
hardly observable in linear scale (Figure 46 is a semilogarithmic plot). The nonohmic behavior
changes with the magnetic field as follows: at low fields the nonlinearity is very small, at SOOG
the splitting becomes more pronounced and at high fields it weakens again as shown in Figure 47.
All Corbino samples display this nonohmic behavior, but one can see the nonlinear effects only in
the contact pairs that are located closest to the center of the disk. All other radial pairs either
exhibit a weaker nonohmic behavior or none at all.
Corbil V,jatH=I10G
I=.5,1,2,6,10mA
0.1
0.01
1E-3
t I=10mA 1E-4
I=0.5mA 1E-5
1E-6
1E-7 90 70 80
T(K)
Figure 46. Temperature dependence of the electrical resistance taken with diflTerent probing currents at the innermost voltage pair, V|2, at a constant magnetic field of 1 lOG. The arrows indicate the curves taken with the lowest and highest electrical current, respectively.
99
In fact, KadowakPs group could not see any nonlinearity^ in a Corbino sample made out of a
BSCCO single crystal (47). However they placed on their sample only one radial pair of voltage
contacts. According to my study, it is possible that the position of their single contact pair was too
far from the cemer of the disk to display the nonlinear effect; recall that in a Corbino geometry
the current density is large in the central region of the disk.
Corbil V,, at H=500, lOOOOG I=.5,1,2,6,10mA
0.1
0.01
£ 1E-3
1E-4
1E-5
90 30 40 60 70 80 50
T(K)
Figure 47. Electrical resistance versus temperature data of Va of sample Corbil. Each group of curves is taken at constant magnetic field using increasing probing currents from O.SmA to 10mA.
At this time, there is no explanation as to why the nonlinear effects can only be observed in the
regions with high current density. However, this fact does confirm that this feature is very weak
and therefore needs a large driving factor to be triggered. Eltsev and coauthors also observed the
nonlinear characteristic of the electrical resistance in their Corbino sample (48), and again in the
100
contact pair that is the closest to the center of the disk. It is believed by some that the behavior of
the vortex liquid in BSCCO single crystals is actually linear and that the nonohmic behavior, seen
in measurements on four-probe samples, is produced by the surface barriers. However, the data in
this thesis show the nonlinear characteristic in a Corbino geometry, where the surfaces have no
contribution to the transport properties, as discussed in chapter 3.
63 PiscMSsioii
I would like to attempt to explain the vortex correlation in the liquid state, presented in
the previous section, using the concept of vortex shear viscosity. In the literature, this property is
usually associated with a solid state or a state where the interactions between the components of
the system are strong. In support of my case, I argue that at high magnetic field the vortices are
very close to one another and therefore, as one can see from the following expression, the vortex-
vortex interaction energy E12 is very large (75):
for ^«r«A„ In the above expression, r is the distance between the centers of the two vortices, ^
is the correlation length and X is the London penetration length.
In their work, Eltsev et al. suggest that the vortex liquid state in BSCCO 2212 should be
subdivided in two separate phases with different degrees of transverse vortex correlation (48). Let
us plot on a H-T diagram the temperature and field ranges where I detect vortex correlation in my
experiment In Figure 48, the full squares represent the irreversibility line of V23, obtained using a
low resistivity criterion. The low resistivity criterion consists of determining the temperature at
which the signal falls below a low value, which I chose to be lO'^Q. The irreversibility line, as it
has been defined, gives information about the moment when vortices inside the disk stop moving
(6.1)
101
and a transition to a solid state occurs. Note that close to Tc in the irreversibility line, a few open
square symbols are plotted. Those correspond to the melting line when the vortex liquid freezes
into a solid through first order transition. The full circles represent the onset of nonohmic
behavior for V12, the only contact pair that displays electrical nonlinearity. For each magnetic
field, I estimated the temperature where the splitting between the data taken with different
currents is observed and call this the onset of nonohmic behavior. The fiill triangles in the center
of the phase diagram mark the positions in the (H,T) space where the crossing between V23 and
V34 occurs. Although the crossing is an excellent indication that there is a deviation from the 1/r
behavior in the Corbil sample, it is not a very good approximation of the temperatures when the
viscosity effect sets in. One can estimate these temperatures from Figure 45, where the
normalized signals coming from V23 and V34 are plotted, so that the onset of the deviation is at the
point where the two curves do not coincide anymore. In Figure 48, I represent the onset of
transverse correlated vortex motion with the open triangles. It is interesting to note that the onset
of deviation symbols form a continuation of the line representing the onset of nonohmic behavior.
I do not know if there is a connection between these two effects. From the experimental data, it is
observed that the nonlinearity is strongest for fields lower than IT, where there is no sign of
vortex correlation. On the other band, the nonohmic behavior becomes very weak for H>1T, but
the vortex correlation sets in. Thus, one can state that for applied magnetic fields larger than IT
the vortex liquid can be subdivided into uncorrelated and correlated phases.
For this discussion, I would also like to remind the reader of the results presented in
section 3.6. Due to the anisotropic nature of BSCCO 2212, the current distribution can alter the
voltage signals collected from the radial contact pairs. More precisely, the voltage pairs located
close to the inner or the outer current contacts of the Corbino sample could be larger than
expected for a current uniformly distributed in the z direction. The main result of this chapter is
also that the outer contact pair has a signal larger than what the 1/r law would dictate. Therefore,
102
it is possible that the efifect in the data could be artificially created by the current distribution and
is not really vortex correlation.
100000
lOOOO
o
X 1000 r
100
10
• I "T 1 ' 1 1 ' T
• A
—1—1—1—1—1—
j-A-j
-
• A
\ \ m
—1—1—1—1—1—
j-A-j •
-
• •
•
•
j
r • •
• nonlinearity onset m
m T •
• zero-resistance line
melting line
•
•
•
a
c
A crossing of V,2 and a • •
A '
oqsetoffleyiatipn. , I . I . ' '
20 30 40 50 60
T(K)
70 80 90 100
Figure 48. Phase diagram of sample Corbil containing the melting line, symbolized with squares, and the onset of nonlinearity line in full circles. Also mapped are the position of the crossing and the onset of deviation from 1/r-behavior.
However, the simulation of the radial dependence of the potential in section 3.6 showed that the
peripheral region of the disk is hardly affected by the current redistribution; there is a little tail
situated close to the edge of the disk (see Figure 19 in chapter 3), but it is very small and so it
cannot be responsible for the observed effect. Besides, if the current distribution were
responsible, another question would arise: why does the current distribution affects the size of the
outermost voltage pair only for some magnetic fields and not for others? Shouldn't the current
distribution be the same for any magnetic field? As a result, I believe that the data presented in
103
figures 41,42 and 43 are actually a consequence of vortex viscosity and not due to the current
distribution.
Some theorists believe that the effect is due to a premature solidification of the outermost
ring of vortices; so that what I actually see in the data is not vortex viscosity in the liquid state,
but the rotation of a solid rigid ring of vortices. Now, the rotation motion of a solid ring of
vortices could produce the crossing of the signals observed in the data. Moreover, at magnetic
fields up to SOOG the outer pair signal vanishes lOK above the temperature where the signal of
the adjacent pair goes to zero. This could be an indication that the outermost vortices fi-eeze early;
but then, why isn't this solid ring of vortices rotating? Even if the ring has solidified, it should
rotate no matter the size of the applied magnetic field since the current distribution is invariant.
Furthermore, why would the outermost vortices freeze before the rest of the vortex matter? As
one can see from the data for sample Corbil in Figure 48, at high magnetic fields there is a
temperature difiTerence of approximately 20K between the freezing temperature of the middle
region of the sample (given by the irreversibility line) and the temperature of so-called freezing of
the outer ring marked by the onset of deviation from l/r behavior. 1 do not believe that the
Lorentz force produced by a current of 2mA would be able to move a solid ring of vortices
especially since the driving force is very small at the periphery of the disk, where this solid ring is
located. Lopez et al., in his experiment conducted on a YBCO Corbino sample (45), was able to
observe the rotation of the vortex lattice only for very large values of the current, 8mA or more.
Numerical values for the viscosity coefRcient and correlation length cannot be extracted
at this moment from the experimental data, because one would need at least three radial measured
signals that show the effect in order to make a rough estimation of x\ from the equation of motion
(3.11). In the present experiments, only two radial pairs seem to show the correlated motion.
Moreover, there is the argument that in order to determine the viscosity correctly, one must solve
the motion equation and then fit the measured data to the solution. However, the equation cannot
104
be solved unless the boundaiy conditions are specified. We do not know the boundaiy conditions
for our pristine BSCCO Corbino samples. The task of adding boundaries to the samples and the
estimation of the healing length will be completed in the following chapter.
105
7. TRANSVERSAL VORTEX VISCOSITY IN IRRADIATED BSCCO CORBINO
SAMPLES
7.1 Introduction
The hydrodynamic vortex motion equation cannot be solved for an arbitrary sample
geometry without having set boundary conditions. We do not know the exact boundary conditions
for a pristine crystal patterned into a Corbino geometry. In principle, the Lorentz force for the
vortices under the current contacts should be zero or very close to zero since the current is
perpendicular to the current pads and the flux lines are also perpendicular to the plane of the
contacts. Therefore, in the regions under the current contacts JxB=0, so that the Lorentz force is
zero. As a consequence of the missing driving force, the vortices in these particular regions
should not move. However, when electrical current is applied, we do know that the vortices
immediately next to the boundaries will move under the influence of a nonzero Lorentz force.
Now, this vortex flow could also set in motion the vortices at the boundaries through the vortex-
vortex interaction. It is not yet known if this is trae or not; therefore, we need to impose useful
boundary conditions in some manner.
At the suggestion of Marchetti and Nelson (53), we can achieve this goal in the Corbino
geometry by irradiating the boundary regions (the inner central dot and the outer circle) with high
energy heavy ions. The columnar tracks produced inside the crystal by the ions constitute one of
the most efficient vortex pin sites in high temperature superconductors (17). As a result, the
vortices located in the boundary regions will not be able to move, thus providing us with a known
boundary condition: zero vortex velocity. Experimentally, this can be achieved by covering the
Corbino samples with special circular masks during irradiation. Using this method, I irradiated
two BSCCO disc samples, Corbil and Corbi2 that were described in chapter 6.
106
The purpose of irradiating the boundaries is not only to create boundary conditions
necessary for solving the equation of motion, but also to introduce a large scale inhomogeneity in
the sample which is necessary to probe the viscous drag. The idea of introducing inhomogeneities
has been already used in the past. In 1988, A Pruymboom et al. designed a thin film sample of
NbaGe with weak-pinning channels of nanometer scale separated by wide strong-pinning regions
made of NbN to study flux-line shear through narrow constraints (76). In this work, the authors
have probed the shear strength of the flux line lattice, while we are aiming to study the viscosity
of the vortex liquid phase. In 1995, H. Pastoriza and P. H. Kes reported seeing shear viscosity of
the vortex liquid phase of BSCCO 2212 in an experiment also involving a sample with weak and
strong pinning channels (77). This time the strong pinning environment was created by irradiating
the sample with high energy ions through an appropriate mask. The width of the weak pinning
channels, where the vortices that exhibited viscosity move, was about 3|xm, orders of magnitude
larger than in the previous reference. In our Corbino disk samples, since the contacts are placed at
least at 30^m apart, we are able to observe vortex viscosity on a scale of 30^m or larger. Neither
of the above cited works determined the numerical value of the viscosity coefficient for the
studied material. This was accomplished for the first time in 1996 by Theunissen et al.(78), who
studied vortex liquid viscosity on NbsGe/NbN samples with channels, similar to the ones used by
A. Pruymboom et al.
I have explained the experimental results in chapter 6 using the concept of vortex
viscosity. However, since a pristine crystal was used, I could not prove that the observed effect
was indeed due to viscosity, simply because the data could not be matched to the theory due to
the absence of appropriate boundary conditions. I believe that this purpose has been achieved in
the present chapter. I should add that the post irradiation data shows a completely opposite trend
than the unirradiated sample (chapter 6), simply because we introduced defects in the crystal
structure. Nonetheless, the physics behind both sets of results is the same.
107
As stated above, the purpose of irradiating the boundary regions is to produce columnar
defects, which will pin down the vortex lines, thus impeding their motion and resulting in a
velocity equal to zero. However, this is not the case under all conditions. Usually, we investigate
the temperature range from lOOK, when the superconducting material is in the normal state, down
to approximately 20K when there is no more dissipation and no detectable signal in the sample.
At temperatures just bellow the regime of superconducting fluctuations, assuming there is an
applied magnetic field, the vortex lines form a disordered state (called vortex liquid state) due to
their high thermal energy. While in the liquid state, the flux lines cannot be pinned by any kind of
defects, even if their shape and dimensions are favorable, because the thermal energy of the
system is too large. As the temperature is reduced, the thermal energy becomes comparable to the
pinning potential and the vortex lines begin to be pinned by the columnar defects. At the same
time, the vortices become stiffer and they undergo a phase transition towards a solid state. The
vortices then stop moving. When the number of vortices present in the system is less or equal to
the number of columnar defects, one expects most of the flux lines to be pinned. This is the
situation when the pinning is most efficient. Once we increase the applied magnetic field above
the value of the dose matching Held, some of the vortices will not be piimed and the overall
pinning strength decreases. Here one could argue that even if only some of the vortices are
pinned, it would still be difficult for the Lorentz force to make the vortices move since they form
a solid state. This statement would be true if the solid were a regular lattice. However, BSCCO,
the material that is used for this experiment, does not form a lattice, but a disordered solid state.
Therefore, we expect that the strength of the boundary conditions to decrease for fields larger
than the dose matching field.
We know from chapter S that the transition temperature for an irradiated superconducting
crystal is higher than the melting temperature before the irradiation. If we denote with Tbc the
transition temperature in the irradiated regions, which in our case are the boundary regions, and
108
with Tzeto the freezing temperature inside the disk, then we will have TBc>Tzao- Therefore, when
taking an R vs T experimental curve, which is usually measured as the sample is cooling down,
the vortices in the boundary regions ^eeze at Tbc before the vortices in the disk. Thus, the
boundary conditions are only rigorously valid at temperatures between Tzen, and TBC (TBC being
different for each applied Held), when the vortices inside the boundary region are frozen and
pinned to the defects while vortices inside the disk are still in the liquid state and able to move.
This regime is rather fortunate since we aim to study the vortex shear viscosity, a property that
becomes observable at temperatures just above the vortex transition Tzoo-
Both samples, Corbil and Corbi2, had the boundary regions irradiated, but only the latter
was also hit inside the disk, in the region where the vortices move under the influence of the
Lorentz force. I irradiated Corbi2 in a different manner for two reasons. One of them has to do
with the study of the vortex viscosity in the Bose glass state and will be described in section 7.3.
The second reason was to be able to measure an irradiated BSCCO crystal, since this will give an
insight into what is going on inside the boundary regions, which obviously one cannot directly
probe. In other words, by measuring the transport properties of Corbi2, one can extract
information about the thermodynamic state of the boundary vortices at different temperatures and
fields, which will be very useful for the data analysis of sample Corbil.
Throughout chapter 7 we will use the notations Corbil* and Corbi2* to denote the
irradiated samples as opposed to Corbil and Corbi2 which remain associated with the
unirradiated samples.
12, Irradiation experimental dgtails
The irradiation took place at Michigan State University Superconducting Accelerator and
used a beam of Au^^*^ ions with the energy of 2 GeV. The direction of the columnar defects was
chosen to be parallel to the c-axis of the crystal since all transport measurements are performed
109
with an applied magnetic field perpendicular to the ab-plane. As stated, the Corbil and Corbi2
samples were irradiated at the inner and outer boundaries and the dose matching field was chosen
to be IT for both crystals. Afterwards, Corbil* was removed from the target chamber while the
Corbil sample received a second irradiation this time without mask. Li the second part of the
irradiation process, sample Corbi2 is irradiated everywhere with another dose of approximately
IT. This means that the boundary regions of sample Corbi2* have now accumulated a total of 2T-
equivalent columnar tracks while the inside of the disk, where vortices move, has received only a
IT dose. Technical difHculties with the ion beam during the bombardment of Corbi2 makes us
believe that the real dose was actually a bit smaller than IT.
Figures 49 and SO illustrate the irradiation procedure. The mask has a central orifice that
is about the size of the inner current contact and an outer diameter corresponding to the inner
diameter of the outer contact.
Figure 49. a) Crystal patterned into a Corbino geometry viewed firom above; b) mask used for protecting the disk while irradiating the center and periphery of the sample
For clarity reasons, the gold wires that are attached to all contacts are omitted from the figure 49a.
The mask was made of gold foil with the thickness of lOO^m (Figure 49b), which ensures the
total blocking of the beam. What is left uncovered by the mask, the current pads, will be of course
110
irradiated to produce the boundaries for our hydrodynamic flow problem, as shown in Figure 50.
Since we had performed electrical measurements on these samples before we irradiated them,
there were golden leads attached to the upper surfaces of the crystals. It is very important that
these leads are not harmed during the process of irradiation, because any attempt to fix them
afterwards will involve heating the sample, which will modify the oxygen content of the crystal.
All superconducting properties of cuprates depend on the oxygen content, therefore by changing
it one would create a different set of background properties in addition to the columnar defects. In
such a case, a comparison between data taken before and after irradiation would not be
trustworthy. It is also important that the mask is mounted as close as possible to the surface of the
region of the crystal that is not supposed to be irradiated in order to avoid any shadowing effects.
Therefore, I carefully flattened the golden leads until they touched the crystal and then applied the
mask.
Figure SO. Corbino sample covered with mask setup for the irradiation. The arrows indicate the motion direction of the high energy ions.
I l l
I should also mention that the same mask was initially used for the gold evaporation of the
current contacts, therefore we have a perfect match of the pads shape with the one of the mask.
After the irradiation the mask is removed and the leads are brought back to the original upward
position, without touching each other or the surface of the crystal.
73 Theoretical overview
In this section, I will mostly follow Marchetti and Nelson's idea (S3) concerning the
Corbino geometry. However, this discussion will be more detailed and will contain the complete
analysis with ail needed explanations.
hi the Corbino disk geometry, a nonuniform current density given by equation (3.6),
J(r)=I/27cWr, is produced in the sample by injecting the current at the center and removing it at
the outer circumference of the disk. When a magnetic field is applied along the disk axis, the
vortices move in circles about the center of the disk. In the flux liquid state, the dynamics on
scales larger than the intervortex spacing is described by the hydrodynamic equation (3.11) for
the vortex velocity v:
+ =0
It would be easier in the end to obtain a solution for a quantity related to the electrical potential
since this is what I measure experimentally. Therefore, one rewrites the hydrodynamic equation
for the electrical field strength E using the substitution expression:
E(r) = «I»oZX-i^ c
(7.2)
112
where <I>o is the flux quantum. Equation (7.1) now becomes scalar rather than vectorial:
(7.3)
where 5=(T|/y)"^ is the viscous correlation length (or healing length) and Pf is the flux flow
resistivity. The correlation length represents the size of the region of vortices affected by the
boundary through shear viscosity effects. After specifying the boundary conditions the above
equation can be solved. Having obtained a solution for E, all that is required to And the potential
drop is to integrate the electrical fleld on the radial interval corresponding to each voltage pair:
The potential drop given by the above expression can be compared to the experimentally
measured signal.
For completeness, the intermediary steps of the analysis from equation (7.1) to equation
(7.3) are outlined below. We start by writing expression (7.1) explicitly for our case of a
tangential vortex velocity, va:
jE(r)rfr (7.4)
yifgO+rie (7.5)
The equation is now multiplied by the z unit vector to yield:
-y—E+rir . c d fdE r (7.6) ^^drydr r c
c
113
noting that . At this point, one may write:
: : d f dE^ El ^ (7.8)
(7.7)
where Pf=<I>oVcV >s the flux flow resistivity. The last expression is identical with equation (7.3),
the term between the brackets representing V^E. We have seen in chapter 3 that the radial
equation in the model was actually a Bessel equation. Since we are still studying the Corbino
geometry, we should expect something similar. Indeed, the above equation can be written as:
which is easily recognized. If the right hand side term were zero and if a change of variable, r"=
r/5, were introduced, we would say that this is a modified Bessel equation with v=l (see equation
(A.4) in the appendix). Equation (7.9) is an inhomogeneous equation having as the general
solution the sum of the inhomogeneous term and the general solution of the modified Bessel
equation:
2jtWr' (7.9)
E{r) IJtWr P f t
2r(W5 P f l
The second expression of the solution is prefered and will be used from now on. I| and K| are the
modified Bessel functions of order 1. The C| and ci coefficients are unknown and they can be
calculated by applying the boundary conditions.
114
The boundary conditions are readily specified for a complete solution to the problem. We
already know that by irradiating the center and the edge of the Corbino disk, we pin down the
vortices so that our boundary condition is v = 0 both at the inner and outer boundaries. From
equation (7.2) above, we see that the electrical field should also be zero at the boundaries and it
actually represents the suitable boundary conditions for equation (7.3):
E(r)lr.iu = 0 and
(7.11)
E(r) 1 = 0.
Inseting these relations into the solution (7.10), we obtain a system of two equations with two
unknowns C| and cz:
= 0
R. R out
S = 0.
(7.12)
(7.13)
After solving the system we obtain:
= •
(Rour] r«.
[ ^ J Ro. ' r«.
(J> I 5 J [ s /' s
(7.14)
and
c, = Rou. i S J -A,
f R
'i ^
\
>
f -K,
\
R ^ r* ' i U J
(7.15)
115
The field's radial profile for three values of 8 in sample Corbil* is shown in Hgure 51 with
continuous lines. Note that 5 is varied over three orders of magnitude from 3 to 300^m. The
positions of the boundaries are; r=Ri=30|im for the inner one and r=Raut=320^m for the outer one.
0.040
0.035
: 0.030
0.025 CA 1 0.020
2 0.015
« 0.010 •c J 0.005 u
0.000
1 1 — 1 ' 1 ' 1 1 •—
•
5=3M-m - •; 5=30lim
\ 5=290jim
-
5=0
-
^ ~ ^
/ ^ i i i t
1 . 1 ^1 . 1. . 0 50 100 150 200
Position (M^m)
250 300 350
Figure 51. Radial profile of the electrical field intensity for various correlation lengths. The dotted line, which corresponds to zero correlation length, represents the 1/r-behavior.
As you can see, all three calculated profiles go to zero at the boundaries in order to meet the
boundary conditions. The dotted line represents the 1/r behavior for the case when there is no
vortex viscosity in the crystal (5=0). As expected, for very small values of the correlation or
healing length, 5, compared to the disk radius, most of the sample is not affected by the
boundaries. As one can see in Figure 51, the uppermost curve corresponding to 5=3(im is almost
identical to the 1/r curve, except for narrow regions next to the boundaries. As the healing length
116
increases, the profile departs from the dotted line and the suppressed regions widen. When 8
reaches the size of the disk, the curve is almost flat.
Our final purpose is to calculate the voltage drop on the contact pair n,n-i-l;
The temperature dependence of the correlation length at different magnetic fields can be extracted
by ntting the measured voltage to the above expression. Equation (7.16) is the same for any
Corbino sample with zero boundary conditions, whether the inside of the disk was irradiated or
not. Therefore, the model by itself cannot distinguish between these two cases. However, this can
be done by analyzing the temperature dependence of the correlation length close to the liquid-
solid transition. If the disk were clean, then we would have a continuous transition to a disordered
solid; but if it had been irradiated, we would have a continuous transition as well, but to a Bose
glass. As Marchetti indicates in her work (79), the temperature dependence of the correlation
length close to the transition is different for the two types of solids; in the former case it is
exponential
(7.17)
and in the latter case it is a power law
(7.18)
where t=(T-T,n.n.irinn)/T„.„irin« and Vx is the transverse correlation length critical exponent,
approximately 1 for the Bose glass.
S oc exi
117
lA Observations from measurements on Corbil irradiated
Recall from chapter 6 that, before the setting of the boundary conditions in sample
Corbil, the order relation (3.9) was always respected for magnetic fields smaller or equal to IT.
On the other hand, for fields larger than IT V34 was increasing beyond than V23 as the magnetic
field increased. The first thing that I noticed after the irradiation of the boundary regions is that
V34 is never larger than V23. histead, for H<1T, there is a temperature regime for which the
voltages collected from the first and second contact pairs do not satisfy the order relation (3.9)
anymore, more precisely V23 becomes larger than V12. For example, we show for comparison in
Figure 52 and S3 data taken at IT field before and after irradiation of the boundaries respectively.
As one can see, no change occurred in the normal state, the magnitude of the resistances
corresponding to the three pairs remained almost the same after irradiation.
0.4
0.3
0.1
0.0
40 50 GO 70 80 90
T(K)
Figure 52. Electrical resistance versus temperature of all radial voltage pairs measured on sample Corbil before boundary irradiation.
118
This, together with the fact that Tc at zero field did not change, is encouraging because it strongly
suggests that the experiment was successful; i.e., that the interior part of the disk was not hit by
the high energy ions so that its properties were not altered. From Figure S3 you can see that for
sample Corbil*, at temperatures close to the liquid-solid transition, V12 decreases below V23 as if
the vortices located in the proximity of the inner current contact (more precisely between the
voltage probes 1 and 2) are slowed down.
0.4 I r
O
Qi
H=1T, I=2mA
100
Figure S3. Temperature dependence of the electrical resistance of V12, V23 and V34 measured on sample Corbil after irradiation at an applied magnetic field of IT. The arrow points to the unusual crossing between the two innermost contact pairs.
Since on the graph it looks like the two curves intersect, from now on we will call this point the
crossing of V12 and V23. This result is exacdy what we were hoping to obtain. Since this feature
was not present in the pristine sample and it appeared after irradiation of the edges, we have no
119
teason not to think that it is connected to the boundary creation and hence to the existence of the
vortex shear viscosity in our system.
If one were to build a radial profile using the voltages measured at IT field, it would look
like Figure 54. Each individual curve consists of three points, which correspond to the three
voltage drops measured at the same temperature in our Corbil* sample. The uppermost curve
corresponds to the highest temperature and seems to follow a 1/r behavior. As the temperature is
reduced, the shape of the proHle changes. In fact, if we compare our experimental radial profile
with the one resulting from solving the hydrodynamic equation (Figure 51), we clearly see a
similarity.
sample Corbil
0.24 H=1T
0.20
0.16 •^72K 66K 62K
E .s O 0.12
oc 0.08
0.04
0.00 180 210 90 120 150 240
Position (fim)
Figure 54. Electrical resistance versus position along the disk radius at constant field of IT. Each curve corresponds to a fixed temperature.
120
The bell-like shape of the experimental radial voltage profile at low temperature corresponds to
the situation in which the region affected by the boundary extends up to the voltage probes 1 and
2. Consequently, V12 is smaller than V23. Moreover, this profile looks similar to the 8=30^m
curve in Figure 51.
1
0.1 H=5000S I=2mA
0.01
lE-3
0.05 lE-4
lE-5
0.00 IE-6
60 80 lE-7
40 70 60 80 90 100
T(K)
Figure 55. Electrical resistance versus temperature (semilogarithmic plot) for V12 and V23 of sample Corbil* at a constant magnetic field of 5000G. The inset contains the same data in a linear scale. The arrows indicate the special feature described in text as a dip.
Figures 52 and 53 display the resistance as a function of temperature for a constant IT
magnetic field, which is coincidentally the value of the dose matching field, B«, for the
unirradiated boundaries. From section 7.3, we also know that the boundary conditions work very
well for magnetic field strengths less than or equal to B«. But what happens at other applied field
121
strengths? What is the effect of the crossing? The data shows that the crossing occurs for a wide
range of magnetic fields around B«, however the effect is the strongest at H= B«, meaning the
relative difference between V23 and V12 is the largest at IT.
The raw data displays another feature, which is visible in a linear R vs T graph, but is
more obvious in a semilogarithmic scale (see Figure 55). It is a dip or a heel in the resistance
curve at low temperatures. The data from the unirradiated sample do not exhibit it. A literature
survey reveals that this is the first time that this feature has been observed and so is associated
with the unique aspects of the experiment. This feature does not have a sharp characteristic like,
for example, a first order melting; however, it can be identified if we make a comparison with
unirradiated BSCCO data from chapter 6 or the literature, which all have a smooth round aspect.
One can only observe the dip at low magnetic fields for H < B«. Furthermore, the feature is
present only in data taken from the V12 and V34 voltage pairs and not V23 - as shown in Figure 56,
where the arrows in the upper and lower plots indicate the heel or dip. Now, V12 and V34 are the
closest contact pairs to the inner and outer boundaries respectively. Therefore, the special feature
must be related to the new boundaries of Corbil* sample.
Finally, it is observed that all voltage pairs exhibit non-ohmic behavior for a very wide
range of magnetic fields (see Figure 57). The resistance measured at the same contact pair at the
same temperature and magnetic field is different for different driving currents. The non-ohmic
behavior usually associated in HTS with some sort of spatial inhomogeneity present in the system
that can trap the flux lines (68). Such inhomogeneities can be localized defects, like deviations
from the stoichiometry at atomic scale, or can be extended defects, such as dislocations, twin
planes or, like in our case, columnar tracks. However, columnar defects should determine the
nonlinearity only indirectly, through the viscosity of the vortex matter, since the tracks are located
outside the region where the vortices are moving.
122
: H^OOG. OOGaiKi ' 0.2,0.3.03,U3.4 .7T
r I=0.5inA
Figure 56. Temperature dependencies of all radial pairs of sample Corbil* at various magnetic fields. Each plot corresponds to a different voltage pair. The R vs T curves shown in all plots are taken at the same values of the magnetic field. The arrows indicate the presence of the dip.
123
Although the effect is present for a wide range of fields, I can point out that the resistance
nonlinearity is weak at low fields, increases gradually as the magnetic field is increased, is
strongest at about IT and suddenly becomes very weak for H>1T. Also, I notice that for fields
around IT the onset of nonohmic behavior occurs at temperatures where the in-plane resistivity is
around 30% of the normal state value for all voltage pairs.
o
0.5mA
20 30 40 50 60 70
T(K)
90 100
Figure 57. Electrical resistance versus temperature for V12 of sample Corbil* taken at four different magnetic fields with the currents 0.5,1 and 2mA.
It is interesting to remember from chapter 6 that sample Corbil displayed only a very
weak nonohmic behavior before the irradiation. The pre-irradiation nonlinearity is not visible in
linear scale, it can only be observed in semilogarithmic scale as opposed to the post-irradiation
nonlinearity which can be clearly seen in linear scale, as shown in Figure 57. Therefore, the
124
strong nonlinearity presented in Figure 57 must be related to the fact that we irradiated the
boundaries. It should be added that the second sample Corbi2 after complete irradiation does not
exhibit nonohmic behavior or, at least, it cannot be detected within the limits of measurement
sensitivity (see Figure 58).
V34 H=1T 0.01
1E-3
Q, 1E-4 1mA 0.5mA 2mA
1E-5
1E-6 70 80 90 100
T(K)
Figure 58. Temperature dependencies of the resistance of V34 of sample Corbi2* taken with three different probing currents at a constant magnetic field of IT.
For the fields smaller or equal with IT, when the heel is visible, the nonlinearity of the
resistance seems to be enhanced by this specific feature. Later in this chapter, the position of the
heel will be mapped on the H-T plane together with the onset of nonohmic behavior in order to
see any correlation. For fields larger than the matching field, I cannot distinguish anymore the
feature in a resistance vs temperature curve and the nonlinearity becomes very weak.
125
7 Irreversibility line nf f!orfai2 irradiated
After the irradiation, the irreversibility line of sample Corbi2'* is clearly and strongly
enhanced for ail measured fields, as one can see from Figure 59.
a
100000
10000 r
1000 r
100
10
1 >-
before irradiation
after irradiation
30 40 50 60
T(K)
sample Corbi2
70 80 90
Figure 59. Irreversibility (zero resistance) lines for sample Corbi2 before and after the sample irradiation.
Due to the presence of columnar defects in the disk, the irreversibility line is shifted toward
higher temperatures, an effect similar to that described in chapter 5. Pinning from the columnar
defects is very effective at high temperatures and vortices freeze, forming a Bose glass.
In Figure 59, the irreversibility lines are obtained from the data measured before and after
irradiation on the middle voltage pair of sample Corbi2. I chose this particular pair (see Figure
60) to ensure that the vortex motion is not affected by the boundaries. This is expected to be true
126
because sample Corbi2 is large so that the middle pair is located far enough from both boundaries
and also because we recall that for sample Corbtl* the middle pair seems to be the least affected
by the boundary introduction, bideed, after a more attentive data analysis, it turns out that only
the innermost voltage pair is slightly affected by the boundary conditions. In this sample, the
effect of the viscosity is only observable very close to the boundaries. I believe this happens due
to the fact that we have added to many columnar defects inside the disk and the pinning provided
by these defects is much stronger than the vortex viscosity. In other words, I cannot perform a
shear study on sample Corbi2'*'. However, the information obtained from this sample is very
valuable for the analysis of the data obtained from sample Corbil*.
Figure 60. Voltage probe configuration for the sample Corbi2. The data analyzed in the text was measured on the contact pair indicated in the figure.
We notice that the irreversibility line of sample Corbi2* (Figure 59) exhibits a more
structured shape than that of the pristine sample. Similar data were previously reported for
irradiated BSCCO 2212 single crystals by D. Zech et al in 199S (80). Two characteristic features
are observed. First, as we decrease the temperature, there is a kink in the irreversibility line at
127
about "FsTSK, where a very rapid temperature dependence occurs. Here the shift of the
irreversibility line toward high temperatures is most pronounced, and it is believed to be
associated with the moment when the flux lines are trapped by the columnar defects. We can then
roughly identify T' as the depinning temperature where the thermal energy becomes comparable
to the pinning energy, so that for T>T' the flux lines start to delocalize from the columnar defects.
Note that we are using the term flux lines for BSCCO-a material that is renowned for its layered
structure, which determines that vortices exist as 2D pancakes in the CUO2 layers. However, it
was showed that the presence of the columnar defects induces a longitudinal correlation along the
c-axis so that pancakes from different layers couple into a flux line (81,82).
As the temperature is decreased, a second feature is encountered in the irreversibility line.
At H=B<|»=1T, there is a clear cross-over from the fast temperature dependant regime to a slow
temperature dependant regime. Zeck et al in ref (83) identify it as the crossover from the single-
vortex strong pinning regime to plastic or collective weak pinning regime (68).
At low fields, the vortex ensemble is characterized by the competition between pinning
and thermal fluctuations. For temperatures less than T' and fields smaller than the matching field,
the defects give rise to correlated disorder along the track directions and constitute strong pinning
sites for the flux lines that remain trapped despite the presence of thermal fluctuations. For
temperatures greater than 7SK, the strength of the anisotropic pinning is decreasing toward Tc, as
thermally induced fluctuations cause increasing delocalization of the vortices.
For fields much larger than B<i>and low temperatures, the correlated disorder competes
with the point disorder and vortex-vortex interaction. The influence of columnar defects becomes
gradually isotropic and the irreversibility line of the irradiated sample approaches the one of the
unirradiated crystal.
The upward portion of the irreversibility line between the two regimes was identified by
Zech et al as the accommodation field line (83).
128
7.6 Phase diagram of Corbil irradiated
Li order to better understand the preliminary observations made in section 7.4, I will
collate the information available from both samples, Corbil* and Corbi2*, on a common phase
diagram. The compiled phase diagram in Figure 61 contains, for Corbil*, the irreversibility line
of V23, the onset of non-ohmic behavior, the position of the special feature of the R vs T at fixed
field curves, and the position of the crossing between V12 and V23 data, together with the
irreversibility line of the central voltage pair from sample Corbi2*.
Figure 61. Composite HT diagram containing the zero resistance (irreversibility) lines for samples Corbil* and Corbi2* together with the crossing line, the onset of nonlinearity line and the heel line for sample Corbil*.
129
I should mendon that all iireversibility lines consist of (H,T) pairs with T being the temperature
at which the measured resistance reaches a low value(10'' Ohm) situated just above the noise.
The onset of nonohmic behavior is defined by the temperature where the splitting between the
resistance curves taken on the same contacts pair occurs at the same applied magnetic Held, but at
different current values. Finally, the special feature is referring to the pronounced heel that we
have described in section 7.4. Since this feature consists of a smooth change in slope of the
resistance versus temperature curve, we need to establish a criterion for determining its position. I
chose the temperature resulting from the intersection of two lines that follow the two slopes,
shown in Figure 62, to be the value mapped in the H-T space.
0.1
0.01
lE-3 e S
lE-5
H=3000G, I=2mA lE-6
100 90 70 80 60
T(K)
Figure 62. Electrical resistance versus temperature for V|2 of sample Corbil"' at 3000G in a semilogarithmic plot. The temperature of the dip is determined as the intersection of the two slopes.
130
The leftmost line represents the irreversibility line of V23 from sample Corbil* estimated
from resistivity measurements conducted after the boundary irradiation. From Figure 63, where I
plot together the irreversibility lines of V23 before and after the irradiation, one can see that the
two curves are very close one to the other.
100000 J
—1 1 • 1 • 1 1 ' 1 1 1—
10000 r
V 1
1000 r sample Corbil
—•—after
—°—before 100 sample Corbi2
after
10 • before
1 1 10 20 30 40 so 60 70
T(K)
80 90
Figure 63. Irreversibility lines for samples Corbil (square symbols) and Corbi2 determined from data taken before (solid lines) and after the samples irradiation (dotted lines).
The dotted line in Figure 61 is the irreversibility line of sample Corbi2 that was described in
section 7.5 and is situated above the irreversibility line of the unirradiated disk, as it should be.
Recall that the dotted line gives an approximate measure of the temperatures and fields at which
the flux lines in the boundary regions are frozen and pinned by the columnar defects. The space in
the H-T plane between the two irreversibility lines gives us the temperature and field ranges
where the vortex liquid motion inside the disk should be affected by the boundaries; this is when
131
one should see the effects of shear viscosity. And indeed, as seen in section 7.4, we do see a
number of interesting features, which will be discussed below.
We start with the crossing line (the diamond symbols in Figure 61), which has a
spectacular similarity in both position and shape with the irreversibility line of sample Corbi2*
for fields both smaller and larger than the dose B«=1T.
As far as the special feature is concerned (triangle symbols in Figure 61), the heel line
agrees very well with the ascending portion of the irreversibility line of sample Corbi2, which
corresponds to the temperatures when the flux lines get pinned in the irradiated regions (see
section 7.5). However, the line of data is quite short since the heel appears only for a narrow
window of applied magnetic fields. Also the line is very noisy due to a large estimation error;
recall that the feature has a smooth characteristic, making it hard to determine its absolute
position. Nonetheless, we could say that the dip in the resistance versus temperature curves, taken
at the contact pairs close to the boundaries in sample Corbil*, is caused by the freezing of the
vortices in the boundary regions. Why is it that we do not see this distinctive feature above the
dose matching field? As expected, the boundary's strength is reduced by the fact that some of the
vortices in the boundary regions are not pinned. When an electrical current is applied, it is
possible that the unpinned vortices from the boundaries are dragged by their immediate
neighbors, which are moving under the influence of the Lorentz force. The behavior at magnetic
fields above when the vortices outnumber the columnar defects, can be interpreted as a
weakening of the overall pining efficiency as the vortex-vortex interaction begins to dominate.
It is obvious from Figure 61 that the line describing the onset of nonohmic behavior also
follows closely the irreversibility line of sample Corbi2*, although it is situated at higher
temperatures. The change in slope of the onset of nonlinearity line occurs at approximately
H=1T, which coincides with the matching field for the irradiated region under the contact pads.
132
I suspect that there is a temperature shift between the irreversibility line of sample Corbi2
and the boundary regions of sanq>le Corbil. This shift could be caused by a slight difference
between the superconducting properties of the two BSCCO crystals. For example, if sample
Corbi2 had a smaller Tc than sample Corbil, then the entire irreversibility line of the former
would be shifted correspondingly towards lower temperatures. We have to remember that the disk
dose is slightly smaller than IT, this could also be the reason for the position of the irreversibility
line. As we learned in chapter S, the smaller the dose the lower the irreversibility line lies in the
H-T plane. The shift could be artiHcially created by the fact that the irreversibility line of sample
Corbi2 is determined from dynamical measurements, meaning vortices were set in motion, while
the vortices in the boundary regions in Corbil do not experience a Lorentz force as we already
discussed in section 7.1. Depending upon the magnitude of the electrical current with which the
vortex matter is probed, the resulting irreversibility line could shift; the higher the current, the
more the line is shifted toward lower temperatures. Any of the above could be true and lead to a
temperature shift of the irreversibility line of the boundary. However, the cumulated shift caimot
be greater than AT=5K. Thus, since the position of the dotted line in Figure 61 will change only
by a little, the discussion of the experimental results remains the same.
Keeping in mind that the irreversibility line of sample Corbi2'^ is representative for
vortex physics in the boundary regions, I believe that the agreements found above provide a proof
that the experimental results from sample Corbil* are a consequence of the boundary irradiation.
7.7 Healing Ignpgth
While trying to fit our experimental data to the theoretical expression (7.16), a difRculty
was encountered. The fitting could not be performed. There were sometimes orders of magnitude
difference between the model and the actual data. After some discussion with colleagues, it
became clear that the problem in the nKxlel was with the flux flow resistivity factor, pr, in
133
expression (7.16). All the values of pf found in the literature were tried in the model and failed. It
turns out that no pristine BSCCO crystal can exhibit flux flow because of the structural defects
that exist in the crystal. Therefore, pf is the correct factor only for the ideal case of flux flow.
Thus in our case, we need to replace pf with the resistivity of the sample before irradiation, and
that we are able to do since we measured the sample before we introduced the boundary
conditions. After making this adjustment in the model, I was able to Ht the experimental radial
profiles to expression (7.16) for the potential drop. The results are presented below. The fitting
process involves two sets of experimental data, one taken on the pristine sample and the other one
taken after the boundary irradiation. I would like to stress the importance of having the Corbino
disk measured before the boundary creation, since the theoretical paper (S3) implies that one can
obtain information about the correlation length just by measuring the sample after the irradiation.
We start by fitting the potential measured from the first pair of contacts V12. First, using
the theoretical result and the pre-irradiation data set, I calculate the values of the potential drop
for several values of the healing length (chosen to cover the entire allowed range) and then these
are matched with the post-irradiation experimental data. The healing length estimation for the
SOOOG data taken with a current of I=2mA is presented in Figure 64. The error is approximately
±lS^m. I chose to do the estimation at SOOOG since the transport data show that for this magnetic
Held the combination between boundary conditions and vortex viscosity is most efficient. As one
can see, for temperatures larger or equal to 78K the correlation length 8 is zero, meaning that
there is no shear viscosity or the zero vortex velocity boundary conditions are invalid.
I also compared the V12 data taken at H=SOOOG before and after the boundary irradiation.
From Figure 6S, we see that for 'I>78K the two curves coincide, corresponding to 5=0. For
T<78K, the post-irradiation data deviates towards smaller values, reflecting a reduced dissipation
and, therefore, a reduced vortex mobility for the same applied Lorentz force.
134
a 3 t e
to
u X
800
700
600
SOO
400
300
200 h
100
0 50
5 from V 12 hyperbolic fit
exponential fit H=5000G, I=2inA
80
Figure 64. Estimated values of the healing length (square symbols) for sample Corbil* obtained from fitting the signal collected from V|2 at SOOOG to the theoretical solution (see the text). The dashed and dotted lines represent hyperbolic and exponential fit to the estimations of 5.
The temperature dependence of the vortex viscosity can be understood intuitively.
Assuming that at low temperatures the vortex-vortex interaction gives rise to the viscous
behavior, as the temperature is increased, we expect that the thermal effects would wash out the
interactions that produce viscosity. However, I cannot be certain of that, because we expect that
the upper limit of the temperature range, for which the boundary conditions are zero, is also close
to 78K at SOOOG. One can see this from the irreversibility line of the irradiated sample in Figure
S9. Now, according to Marchetti's model (S3), having the boundary vortex velocity zero is a
necessary condition for observing the shear viscosity.
135
H=5000G
I=2mA 0.1
0.01
E O
lE-3
Oi lE-4
lE-5 r V,2 after edge irradiation
lE-6 40 60 80 100
T(K)
Figure 65. Temperature dependencies of the electrical resistance of V\2 in sample Corbil at 50000 before (line) and after (symbols) the boundary irradiation.
I believe it is possible to also observe vortex viscosity in a Corbino sample without
boundary conditions, as the experiment presented in chapter 6 shows. In Marchetti's model the
moving vortices interact to each other as well as with an inhomogeneity (present in the boundary
region) and as a result, they are slowed down, which is exactly what we observe in chapter 7. In
the experiment described in the previous chapter, the moving vortices interact among themselves
only, modifying each other's velocity.
The fitting analysis can be repeated for measurements done at different driving currents;
for example, I looked at data taken with I=0.5mA. We already saw earlier that the sample
resistivity is nonohmic for temperatures above the freezing transition associated with each
magnetic field. These are exactly the regimes where viscosity becomes observable. Therefore,
clearly, there is going to be a difference in the fitting results. Since lower current produces a
136
smaller dissipation, we can say that the correlation length will be larger for smaller currents, as
illustrated in Hgure 66.
360
320
280
240
200
160
120
80
40
0
-40 50 55 60 65 70 75 80 85
T(K)
\ H=5000G
S from V,2 J=2mA A-— S from V,2,I=0.5mA
A.. •"••A
XV •A
Figure 66. Correlation length estimated from data measured on Vn of sample Corbil* at SOOOG with two different currents 0.5 and 2mA.
A fitting similar to the one in Figure 64 can be performed for the other two radial voltage
pairs. When we compare the healing lengths estimated for the three voltage pairs we notice
differences. The correlation length resulted from fitting the V34 data to the model is larger than
the one given by V12 (see Figure 67), while the values estimated for 5 from V23 are smaller than
the ones from V12. There is an explanation for this trend. I will start by comparing V12 and V34,
the two pairs of contacts situated closest to the boundaries. One might expect that the estimated
values for S from these two voltage pairs to be very close since the two boundaries are similar to
the extent that they both contain columnar defects that can trap the flux lines. Instead, we see a
137
clear diffeience between the two upper curves in Figure 67. This is because they are not
equivalent, since one is convex and the other is concave.
Figure 67. Estimations of the healing length obtained from analyzing the data measured on the three radial voltage pairs of sample Corbil* at SOOOG.
Furthermore, their sizes are not equal; the inner boundary has a much smaller contact surface with
the moving vortex fluid than the outer boundary. This difference can account for our fitting result;
the estimation of the correlation length from V34 data is larger due to the fact that the vortices feel
a stronger influence from the outer boundary. In addition, the current density is much smaller
closer to the outer edge than at the center of the sample. It is possible that when the vortices have
a smaller velocity due to the Lorentz force at the outer boundary, they have increased interactions
with the boundary resulting in a further reduced velocity. Actually, this behavior has been seen
before when we talked about the nonlinearities. There are temperatures and fields for which a
450
—A— 5 fiom V,j —•— S from Vjj —W—5 from H=5000G, I=2inA
-50 50 55 60 65 70 75 80
T(K)
138
lower current density is associated with a lower dissipation; therefore, slower motion which is
equivalent with a larger healing length.
400
350
300
IT 0.5T 250 O.IT
200
2T ISO
100
50
0
30 60 50 80 90
T(K)
Figure 68. Correlation length estimated from data measured on V12 of sample Corbil* with a current of 2mA at 0.1,0.5,1 and 2T.
The correlation length estimated from data taken on V23 is smaller than any of the
estimations obtained from the other two pairs. We have noticed when analyzing the data that the
middle pair is only slightly affected by the irradiation of the boundaries. Therefore, it is not a
surprise that the correlation is weaker at the mid-point between the boundaries.
Finally, we have estimated the healing length for various magnetic fields around 5000G
and we present the results in Figure 68. A consistent trend is noticed. At the same temperature the
correlation length is decreasing if the magnetic field is increased. This can be connected with the
139
fact that as the magnetic field is increased the boundary conditions set in at a lower temperature,
making the vortex viscosity effect observable at lower temperatures.
In conclusion, the effect of the boundaries on the vortex motion depends of the viscosity
of the vortex matter. From the SOOOG data (Figure 67), one can see how the healing length 8
increases gradually from zero as the temperature decreases below 78K. At low temperatures, just
before the freezing, 5 exhibits an upturn that corresponds to enhancement of the viscous effects
due to the solidification of the vortex liquid. However, the estimation for 5 at low temperature
falls below the hyperbolic fitting shown as dashed line in Figure 64. Clearly, the shear viscosity
of the vortex matter in the present experiment is not as strong as predicted in reference (S3) since
it is induced by vortex-vortex interactions only. In their work (S3), Marchetti and Nelson expect
to see a greater viscosity due to vortex line cutting close to the transition to a Bose glass. Since
the annulus Corbil has not been irradiated, there could be no Bose glass in this sample. However,
the healing length estimation comes very close to the exponential fit shown as a dotted line in
Figure 64. This type of temperature dependence confirms that I detected viscosity effects close to
the transition from a vortex liquid to a disordered vortex solid phase, as described in section 7.3.
140
8. CONCLUSIONS
The subject treated in the present work is part of the vortex physics in high temperature
superconductors. In particular, I have studied aspects of the vortex dynamics in Bi2Sr2CaCu20
single crystals prepared into the Corbino disk geometry. The Corbino geometry, named after the
scientist who first used it, provides a contact configuration with cylindrical symmetry. As a
consequence, the electrical current flows radially from the inner central electrode towards the
outer one. Thus, the current density is not uniform, its radial dependence being dictated by the
charge conservation. When an external magnetic field is applied, the BSCCO crystal, as a type n
superconductor, is penetrated by vortex flux lines each carrying a flux quantum OQ. AS of result
of the interaction between the vortices and the electrical current applied to the Corbino sample,
the flux lines move on closed circular trajectories inside the disk without crossing the edges of the
crystal. Therefore, the Corbino disk geometry is the perfect sample configuration for the study of
the bulk transport properties of the material, BSCCO 2212 in our case.
I have investigated the surface barrier effects on the transport properties of BSCCO in the
mixed phase by comparing the transport measurements obtained from crystals pattemed in the
Corbino disk geometry and the four-probe configuration. In the latter contact configuration, when
the electrical current is applied, the vortices cross both edges of the sample. Therefore, the
transport measurements obtained from such a sample must contain contributions from both bulk
and surface properties. The crystal edges affect the vortex motion through such mechanisms as
the Bean-Livingston barrier and the geometrical barrier. I have prepared multiple Corbino and
standard bar samples from BSCCO 2212 single crystals and measured their electrical properties. I
have then compared the transport data measured on samples with different configurations and
noticed no considerable difference. Furthermore, I have cut three of the Corbino samples into
standard bar geometries and then I have measured them again. In this case, the very same crystal
with the same bulk properties is investigated in two different contact configuration. Any
141
difference between the two sets of data must consist of surface effect contributions. Again, I have
found perfect agreement between the electrical resistance measurements of the Corbino sample
and the corresponding data from the laminar sample. The conclusion from this experiment is that
the surface barriers have no or negligible effect on the transport properties for the studied BSCCO
2212 crystals. However, the ratio between the bulk pinning and the surface pinning depends on
the crystal quality. The quality of BSCCO depends on the growth conditions and, as a
consequence, some crystals could have more defects than others. It is possible that for crystals
with high levels of disorder, the surface pinning is much smaller than that in the bulk so that the
surface effect cannot be detected in the transport measurements. On the other hand, in clean
specimens, the contribution from the surface barriers becomes important and could affect the
transport properties measured on four-probe samples. This problem can be avoided if Corbino
configurations are used instead.
A very interesting and important physical quantity of the vortex physics is the vortex
shear viscosity. As the name indicates, the viscosity is due to shear of the vortex matter. Usually
the shear is associated with a vortex solid state, when the shear noodulus is different from zero.
However, there are cases in which the viscosity appears also in the vorte}c liquid state due to a
large vortex-vortex interaction or due to vortex entanglement. In any case, the viscosity is rarely
observed since specially patterned samples are necessary to highlight this phenomenon. It is even
more difficult to directly probe and measure the viscosity coefficient. In chapter 6 of this work, I
show evidence of transverse vortex correlation due to the viscosity in the transport measurements
done on BSCCO Corbino samples with multiple radial voltage contacts. Mainly, what I have
found is that at high magnetic fields the vortices located close to the outer frame are moving
faster than they should if they were following the local Lorentz force. The fast motion of these
outer vortices can be explained by the fact that they are dragged by the adjacent moving flux
lines, which have a larger velocity since they are driven by a larger Lorentz force. The
observation of the vortex viscosity in the vortex liquid was possible only in a Corbino sample.
142
because it exhibits a velocity gradient difTeient from zero. I believe that the results presented in
chapter 6 are an evidence of the vortex viscosity. However, since the experimental data could not
be fitted to the theoretical prediction, a numerical value for the viscosity coefficient could not be
derived from them.
In chapter 7 I have gone a step fiuther by determining the correlation length from the
transport data taken on a BSCCO Corbino sample with irradiated boundaries. Columnar defects
were introduced in the boundary regions with the purpose of creating known boundary
conditions. These in turn were necessary in order to obtain a solution for the electrical potential
that could be fitted to the experimental data. Specifically, there is a temperature and field regime
when the vortices in the boundary regions will be trapped by the columnar defects and therefore
their velocity will be zero, which constitutes the required boundary condition. The analysis of the
transport measurements obtained from such a sample show the effects of the vortex viscosity in
the vortex liquid state. I have solved the equation of motion for a Corbino disk with zero velocity
boundary conditions and obtained a solution for the electrical potential. Lastly, I have fitted the
experimental results to the solution and obtained numerical values for the healing length
associated with the vortex viscosity, which are presented in chapter 7.
The experiment presented in chapter 7 could be continued by irradiating a Corbino
sample differentially, with a high dose in the boundary regions and a much lower dose inside the
disk. The entire experiment can be repeated in different materials for the purpose of deriving the
values of the vortex viscosity for those materials and also for studying the various kinds of phase
transitions. For example, one could also introduce point defects in the crystal, not only columnar
defects. As shown in chapter 7, the magnitude of the dose matching field has to be chosen
carefully. In other words, a systematic study, similar to the one in chapter S, has to be completed
in order to establish which is the appropriate value for the dose in order to put in evidence the
vortex viscosity phenomenon. While the columnar defect study from chapter S involved the full
irradiation of the crystals, in the experiments that I propose, the dose received by the boundary
143
regions should be much larger than in the rest of the sample. The investigation of the vortex
viscosity can also be extended by performing measurements at various values of the ac frequency.
As seen from this work, a large number of voltage probes is necessary for a better spatial analysis
of the data. Despite the difflculties encountered while preparing the Corbino samples, this
geometry is a powerful tool for the study of vortex correlation associated with various phases of
the vortex matter.
APPENDIX
The inverse Fourier transform of f(r) is:
f i k ) = \d^rfir)e-^' = J de\rdrf =2jt\rdffir)J^{kr)
smce
2jc Jd0e^^' =2nJoia) 0
The conjugated relation is:
The simplified relations used in Chapter 3 are the following:
m = j-\kdmk)Joikr)
f{k) = 2n\rdrf{r)J^(kr)
145
Bessel equation:
d 'Y 1 dY dx X dx f . -JW. (A.3)
Modified Bessel equation:
I dY —H
dx X dx
. 2 1 + - K = 0 (A.4)
146
CITED LITERATURE
1. Oimes H. K.., Leiden Comm., 120b, 122b, I24c, 1911.
2. Meissner W. and Ochsenfeld R., Naturwissenschqften, 21:787, 1933.
3. London F. and H.: The electromagnetic equations of the supraconductor. Proc. Roy. Soc.
(London), A149:71-88, 1935.
4. Ginzburg V. L. and Landau L. D., Zh. Eksperim. i Teor. Fiz., 20: 1064, 1950.
5. London P.: Supeifluids, vol. I, pp. 152, New York, Wiley, 1950.
6. Abrikosov A. A.: On the magnetic properties of superconductors of the second group. Sov.
Phys. JETP, 5:1174-1182, 1957.
7. Anderson P.W.: Theory of flux creep in hard superconductors. Phys. Rev. Lett., 9: 309-311,
1962.
8. Lynn J. W., Rosov N., Grigereit T. E., Zhang H., and Clinton T. W.: Vortex dynamics and
melting in niobium. Phys. Rev. Lett., 72: 3413—3416, 1994.
9. Saiar H., Gammel P. L., Huse D. A., Bishop D. J., Lee W. C., Giapintzakis J., Ginsberg D.
M.: Experimental evidence for a multicritical point in the magnetic phase diagram for the
mixed state of clean untwinned YbaaCusO?, Phys. Rev. Lett., 70: 3800-3803, 1993.
10. Sa&r H., Gammel P. L., Huse D. A., Bishop D. J., Rice J. P. and Ginsberg D. M.:
Experimental evidence for a first-order vortex-lattice-melting transition in untwinned, single
69. Oussena M., de Groot P. A. J., Porter S. J., Gagnon R., and Taillefer L.: Vortex channeling
along twin planes in YBCO. Phys. Rev. B, 51: I389-I392, 1995.
70. Yan Y. and Kirk M. A.: Observation and mechanism of local oxygen reordering induced by
high-energy heavy-ion (U + , Au + , Xe + ) irradiation in the high-Tc superconductor
YBazCuaO,^. Phys. Rev. B, 57: 6152-6164, 1998.
71. Willemin M., Schilling A., Keller H., Rossel C., Hofer J., Welp U., Kwok W. K., Olsson R.
J., and Crabtree G. W.: First-order vortex-lattice melting transition in YBa2Cu307 near the
critical temperature detected by magnetic torque. Phys. Rev. Lett., 81:4236-4239, 1998.
72. Pippard A. B.: A possible mechanism for the peak effect in type II superconductors.
Philosophical Magazine, 19:217-220, 1969.
153
73. Kwok W. K., Olsson R. J., Karapetrov G., Paulius L. M., Moulton W. G., Hofhnan D. J., and
Crabtree G. W.: Critical points in heavy ion irradiated untwinned YBa2Cu30T^5 crystals. Phys.
Rev. Lett., 84: 3706-3709, 2000.
74. Klein L., Yacoby E. R., Wolfiis Y., Yeshunin Y., Burlachkov L., Shapiro B. Y.,
Konczykowski M., and Hohzberg F.: Flux flop in Y-Ba-Cu-O crystals irradiated with 5.3-
GeV Pb ions. Phys. Rev. B, 47:12349-12352, 1993.
75. Abrikosov A. A.: The magnetic properties of superconducting alloys. J. Phys. Chem. Solids,
2: 199-208, 1957.
76. Pruymboom A., Kes P. H., van der Drift E., Radelaar S.: Flux-line shear through narrow
constraints in superconducting films. Phys. Rev. Lett., 60: 1430-1433, 1988.
77. Pastoriza H. and Kes P. H.: Direct shear probe of vortex lattice melting in Bi2Sr2CaCu208
single crystals. Phys. Rev. Lett., 75: 3525-3528, 1995.
78. Theunissen M.H., Van der Drift E., and Kes P. H.: Size effects in flow of flux-line solids and
liquids. Phys. Rev. Lett., 77: 159-162, 1996.
79. Marchetti M. C.: Driven vortices in confined geometry: the Corbino disk. Physica C, 341-
348:991-994, 2000.
80. Zech D., Lee S.L., Keller H., Blatter G., Kes P. H., Li T. W.: Phase diagram of
Bi2.I5Srl.85CaCu208+ delta in the presence of columnar defects. Phys. Rev. B, 54: 6129-
6132, 1996.
81. Klein L., Yacoby E. R., Yeshunin Y., Konczykowski M. and Kishio K.: Evidence for line
vortices in Bi2Sr2CaCu208- Phys. Rev. B, 48:3523-3526, 1993.
82. Seow W. S., E)oyle R. A., Campbell A. M., Balakrishnan G., McK. Paul D., Kadowaki K.,
Wirth G.: Influence of columnar defects on vortex dynamics in Bi2Sr2CaCu208 from out-of-
plane and flux transformer transport measurements. Phys. Rev. B, 53: 14611-14620, 1995.
154
83. Zech D., Lee S. L., Keller H., Blatter G., Janossy B., Kes P. H., Li T. W., Menovsky A. A.:
Correlation of flux lines in single-crystal Bi2Sr2CaCu208 with columnar defects. Phys. Rev. B,
52:6913-6919, 1995.
155
VTTA
NAME:
EDUCATION:
TEACHING EXPERIENCE:
HONORS:
Ana Mazilu
B.S., Physics, University of Bucharest, Bucharest, Romania, 1996
M.S., Physics, University of Illinois at Chicago, Chicago, Illinois, 2000
Department of Physics, University of Illinois at Chicago, Chicago, Illinois: Physics 101 and 144 Laboratories, 1996-1997
Paul Raccah award for best achievement in the Preliminary Doctorate Exam at the Department of Physics, University of Illinois at Chicago, Chicago, Illinois, 1997.
European Physical Society scholarship, Bucharest, Romania, 1995-1996.
PROFESIONAL
MEMBERSHIP:
ABSTRACTS:
American Physical Society since 1997
Mazilu A., Lopez D., Kwok W. K., Kadowaki K., Crabtree G.W.: Non-uniform force induced vortex dynamics in BiSrCaCuOS single crystals. Bull. Am. Phys. Soc., 44: 1929, 1999.
Mazilu A., Kwok W. K., Crabtree G. W., Zhao Y.: Evidence of vortex shear viscosity in BSCCO Corbino disk. Bull. Am. Phys. Soc., 46: 517, 2001.
Kwok W. K., Mazilu A., Oisson RJ., Crabtree G. W.: Behavior of the vortex liquid state near the upper critical point in YBCO. Bull. Am. Phys. Soc., 46: 174, 2001.
Tobos v., Paulius L.M., Petrean A.M., Olsson R J., Mazilu A., Kwok W. K., Crabtree G. W.: Effects of columnar defects on the phase diagram of YBCO single crystals. Bull. Am. Phys. Soc., 46: 175, 2001.
PUBLICATIONS: Mazilu A., Safar H., Maley M. P., Coulter J. Y., Bulaevskii L. N., and Foltyn S.: Vortex dynamics of heavy-ion-irradiated YBa2Cu307_s : Experimental evidence for a reduced vortex mobility at the matching field. Phys. Rev. B. 58: R8909, 1998.
Mazilu A., Safar H., Lopez D., Kwok W. K., Crabtree G. W., Guptasarma PHinks. D. G.: Experimental comparison of the effect that bulk pinning and surface barriers have on vortex motion in the vortex liquid state of Bl,Sr,CaCu,0, single crystals. Phys. Rev. B. 58: R8913,1998.