This reproduction was made from a copy of a document sent to us for microfilming. While the most advanced technology has been used to photograph and reproduce this document, the quality of the reproduction is heavily dependent upon the quality of the material submitted.
The following explanation of techniques is provided to help clarify markings or notations which may appear on this reproduction.
1.The sign or "target" for pages apparently lacking from the document photographed is "Missing Page(s)". If it was possible to obtain the missing page(s) or section, they are spliced into the film along with adjacent pages. This may have necessitated cutting through an image and duplicating adjacent pages to assure complete continuity.
2. When an image on the film is obliterated with a round black mark, it is an indication of either blurred copy because of movement during exposure, duplicate copy, or copyrighted materials that should not have been filmed. For blurred pages, a good image of the page can be found in the adjacent frame. If copyrighted materials were deleted, a target note will appear listing the pages in the adjacent frame.
3. When a map, drawing or chart, etc., is part of the material being photographed, a definite method of "sectioning" the material has been followed. It is customary to begin filming at the upper left hand corner of a large sheet and to continue from left to right in equal sections with small overlaps. If necessary, sectioning is continued again-beginning below the first row and continuing on until complete.
4. For illustrations that cannot be satisfactorily reproduced by xerographic means, photographic prints can be purchased at additional cost and inserted into your xerographic copy. These prints are available upon request from the Dissertations Customer Services Department.
5. Some pages in any document may have indistinct print. In all cases the best available copy has been filmed.
University Microfilms
International 300 N. Zeeb Road Ann Arbor, Ml 48106
1329524
Harrison, James Richard
DESIGN OF A LONG LINE INTRUSION DETECTION SENSOR
The University of Arizona M.S. 1986
University Microfilms
International 300 N. Zeeb Road, Ann Arbor, Ml 48106
PLEASE NOTE:
In all cases this material has been filmed in the best possible way from the available copy. Problems encountered with this document have been identified here with a check mark V .
1. Glossy photographs or pages
2. Colored illustrations, paper or print
3. Photographs with dark background
4. Illustrations are poor copy
5. Pages with black marks, not original copy
6. Print shows through as there is text on both sides of page
7. Indistinct, broken or small print on several pages
8. Print exceeds margin requirements
9. Tightly bound copy with print lost in spine
10. Computer printout pages with indistinct print
11. Page(s) lacking when material received, and not available from school or author.
12. Page(s) seem to be missing in numbering only as text follows.
13. Two pages numbered . Text follows.
14. Curling and wrinkled pages
15. Dissertation contains pages with print at a slant, filmed as received
16. Other
University Microfilms
International
DESIGN OF A LONG LINE INTRUSION DETECTION SENSOR
by
James Richard Harrison
A Thesis Submitted to the Faculty of the
DEPARTMENT OF ELECTRICAL AND COMPUTER ENGINEERING
In Partial Fulfillment of the Requirements For the Degree of
MASTER OF SCIENCE WITH A MAJOR IN ELECTRICAL ENGINEERING
In the Graduate College
THE UNIVERSITY OF ARIZONA
1 9 8 6
STATEMENT BY AUTHOR
This thesis has been submitted in partial fulfillment of requirements for an advanced degree at The University of Arizona and is deposited in the University Library to be made available to borrowers under the rules of the Library.
Brief quotations from this thesis are allowable without special permission, provided that accurate acknowledgment of source is made. Requests for permission for extended quotation from or reproduction of this manuscript in whole or in part may be granted by the head of the major department or the Dean of the Graduate College when in his/her judgment the proposed use of the material is in the interests of scholarship. In all other instances, however, permission must be obtained from the author.
SIGNED:
APPROVAL BY THESIS DIRECTOR
This thesis has been approved on the date shown below:
L. C. SCHOOLf*^ Associate Professor of
Electrical and Computer Engineering
Date
ACKNOWLEDGMENTS
I wish to express my great appreciation to my advisor, Dr. L.
C. Schooley, for his support and guidance throughout the length of this
project. I would like to thank Dr. R. N. Carlile for his suggestions
and assistance. Also, I wish to thank George Van Horn of the
Immigration and Naturalization Service for his input and insights on
certain portions of this project.
iii
TABLE OF CONTENTS
Page
LIST OF ABBREVIATIONS vi
LIST OF ILLUSTRATIONS viii
ABSTRACT x
CHAPTER
1 . INTRODUCTION 1
1.1 Purpose 1 1.2 Development of PCCS Technology 2 1.3 Report Outline 6
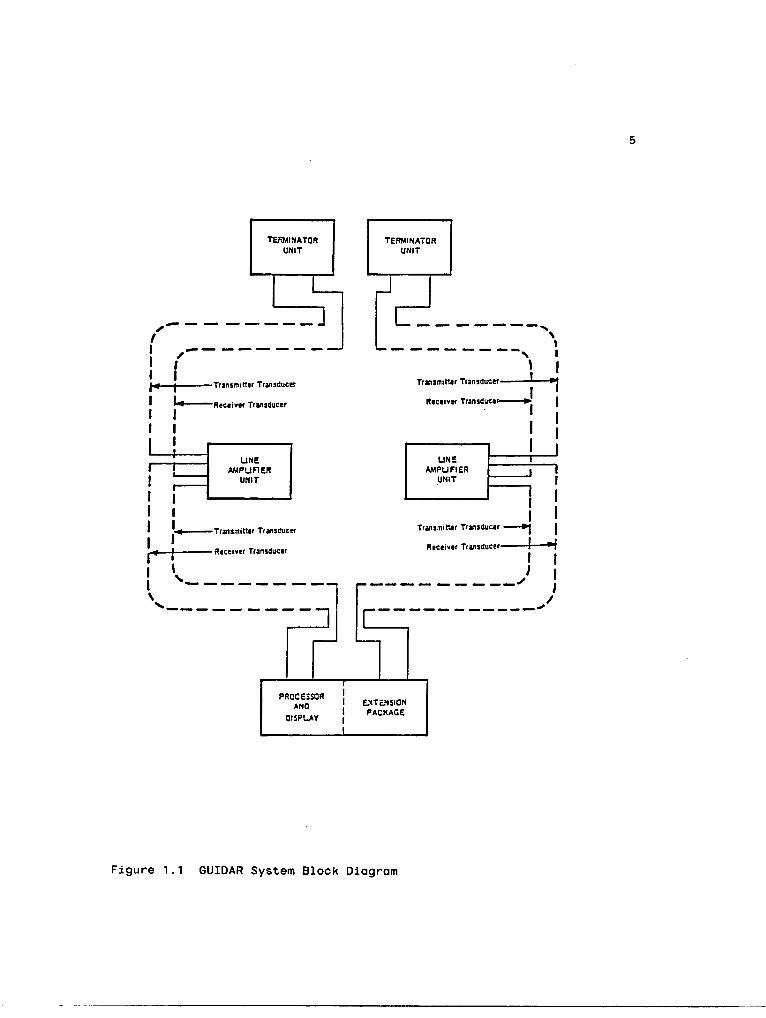
2. DETAILED DESCR^IONS OF THE GUIDAR AND SENTRAX SYSTEMS 9
2.1 Introduction 9 2.2 General Theory of Operation—GUIDAR System .... 10
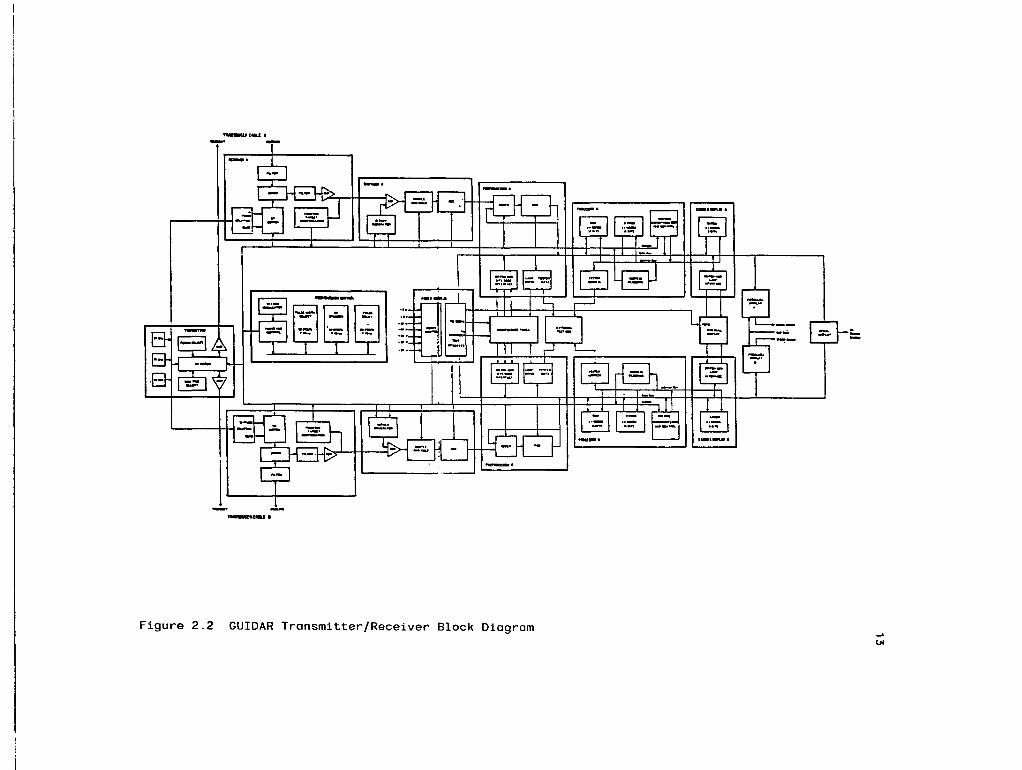
2.2.1 Preprocessor Control 1^ 2.2.2 Transmitter 20 2.2.3 Receiver 21 2 . 2 . k Digitizer 22 2.2.5 Preprocessor 23 2.2.6 Processor 2k 2.2.7 Power Consumption 27 2.2.8 Operating Temperature Range 27 2.2.9 Possible Improvements 28
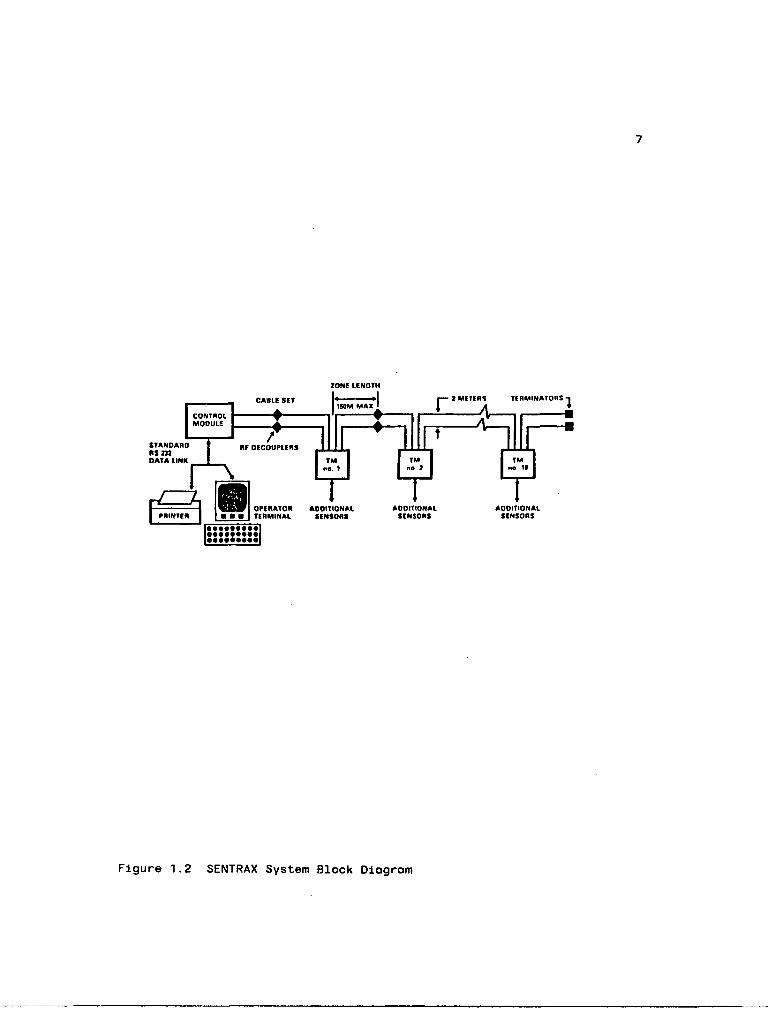
2.3 General Theory of Operation—SENTRAX System ... 29 2.3.1 Transceiver Modules 30 2.3.2 Control Modules 31 2.3.3 Operating Temperature Range 32 2.3.4 Power Consumption 32 2.3.5 Possible Improvements 33
3. THREE VARIABLES OF THE COMMUNICATIONS PROBLEM 35
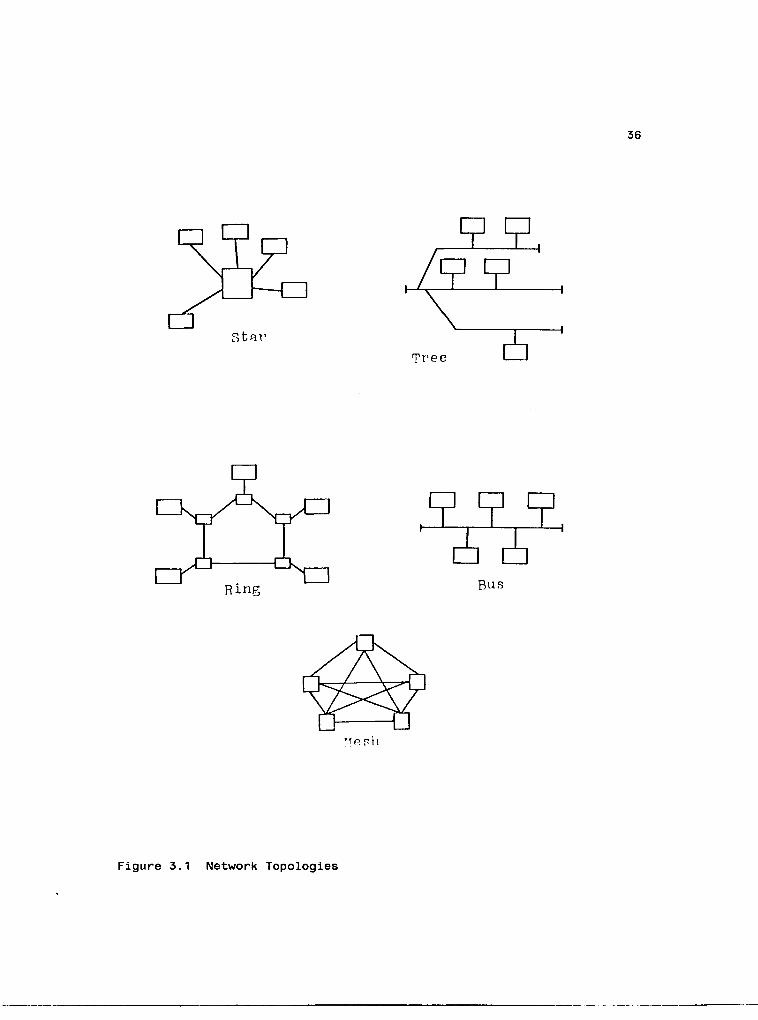
3.1 Introduction 35 3.2 Topology 40 3.3 Distribution of Processing kk
iv
V
TABLE OF CONTENTS—Continued
Page
3.4 Transmission Media 46 3.4.1 Twisted Wire Pair 46 3.4.2 Coaxial Cable 51 3.4.3 Power Line Carrier 58 3.4.4 Fiber Optic 60 3.4.5 Low, Medium and High Frequency Band Radio . 63 3.4.6 Very-High and Ultra-High Frequency
Band Radio 65 3.4.7 Microwave Radio 69 3.4.8 Satellite 71
4. PRELIMINARY EVALUATION OF CANDIDATE SYSTEMS 75
4.1 Introduction 75 4.2 Bandwidth Calculations 77
4.2.1 Received Signal 77 4.2.2 Received Signal Envelope 78 4.2.3 Unsummed Digital Data 80 4.2.4 Preprocessor Output 81 4.2.5 Display Data 81
4.3 Timing and Control 83 4.4 Summary and Conclusions 84
5. FINAL EVALUATION OF CANDIDATE SYSTEMS 86
5.1 Introduction 86 5.2 Current Technology 86 5.3 Vulnerability 87 5.4 Installation Requirements 88 5.5 Summary and Conclusions 88
Figure 3.13 Principal Microwave Bands Authorized for Fixed Telecommunications in the United States
71
every 20 to 30 miles. Anomalies in the atmosphere can cause either an
increase or decrease in the line of sight propagation distance
(Transmission Systems for Communications 1982, Chapter 23). To insure
adequate obstruction clearance, over level terrain, during less than
line of sight propagation times, tower heights are often at least 100
to 150 feet high. The free space loss of microwaves decreases as the
square of the distance which is equivalent to about 6 db for every
doubling of the distance between repeaters. The exact attenuation loss
is difficult to predict because of fading caused by disturbances in the
atmosphere and multipath propagation. Attenuation of microwave
frequencies above 10 GHz is increasingly affected by rainfall. Fading
losses can be overcome by the use of diversity techniques. The main
disadvantage of use microwave radio would be the installation costs of
constructing a tower and antenna system at each two mile sensor segment
and the construction costs of building the necessary remote repeater
stations. FCC approval would have to be obtained for the use of any
part of the microwave frequency spectrum. Microwave radio would only be
cost effective if large amounts of data needed to be communicated to
the base station.
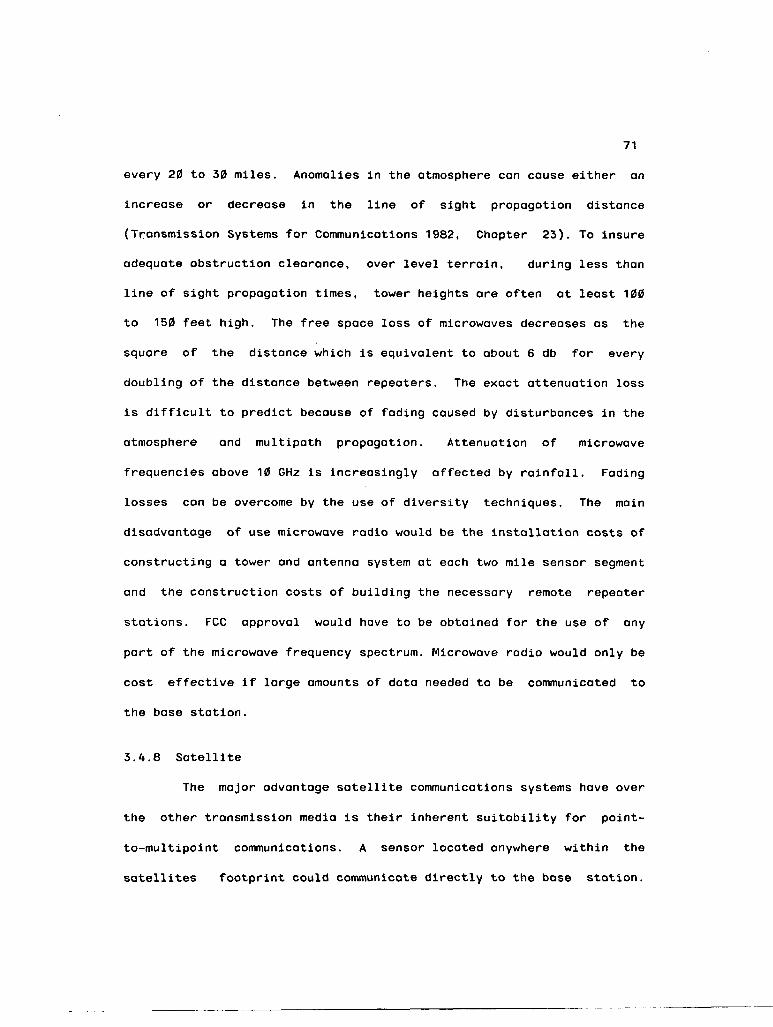
3.4.8 Satellite
The major advantage satellite communications systems have over
the other transmission media is their inherent suitability for point-
to-multipoint communications. A sensor located anywhere within the
satellites footprint could communicate directly to the base station.
72
Individual sensors could be relocated to meet changing monitoring
requirements provided that they remained within the satellites
footprint. Additional sensors could easily be added to the system as
long as transponder bandwidth was available. For widely dispersed and
changing communications requirements, satellite systems offer greater
flexibility then point-to-point radio systems and all of the cable
transmission media.
A typical satellite system would consist of a large antenna,
with appropriate multiplexing and demultiplexing equipment, located at
the base station and smaller antennas with transceiver logic located at
each sensor site.
In order to keep the cost of the additional transceiver logic
and storage logic at each sensor site to a minimum, one of the best
multiple-access modulation techniques to use would be preassigned
single channel per carrier frequency division multiple access (SCPC-
FDMA). This access scheme would allow each sensor to have its own
unique, dedicated channel to communicate to the base station at random.
An alternative to SCPC-FDMA would be to use anyone of the
numerous random access or reservation protocols (Tobagi et al. 1984).
A typical protocol, similar to token passing, each sensor would
transmit on the same uplink frequency and receive on the same downlink
frequency. The base station would interrogate each sensor
successively. Upon interrogation by the base station, sensors would
transmit any intrusion data stored in memory. Such an access protocol
would be feasible only if the display data was being sent to the base
73
station. It will be shown in the next chapter that the other
distributed processing schemes would require each sensor to have a
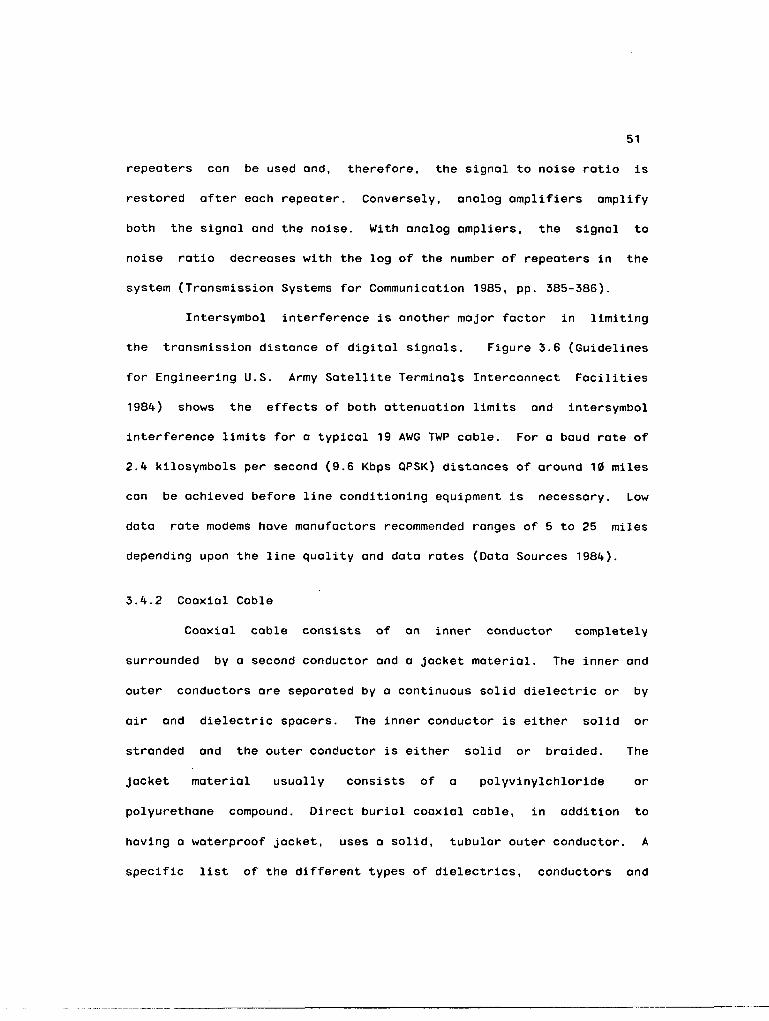
dedicated channel to the base station.
Commercial satellite transponder bandwidths are usually 36, 5k
or 72 MHz although special purpose satellites have been built with a
variety of transponder bandwidths. Depending upon the bandwidth needed
for each sensor, one or more transponders would be required. Commercial
satellites have anywhere from one to 2k transponders. If transponder
bandwidth was limited, access protocols such as carrier sensed
multiple access or slotted Aloha, which would allow every sensor to
communicate to the base station over the same uplink frequency, could
be used at the expense of more complicated electronics at each sensor
site.
It would be desirable to keep the sensor site antenna size as
small as possible. This can be accomplished by either using higher
frequencies, in the Ku band of 10.9 to 18 GHz, or by employing larger
antennas in space. Higher frequencies suffer from greater attenuation
in adverse weather conditions which must be offset by higher
transmitted power, more elaborate coding techniques or diversity.
Also, the cost of transceiver logic increases as the up/down link
transmission frequency increases.
Small ground antennas; 12" nonsteered drooping dipole or 30 by
30 centimeter microstrip, and low power requirements; 5 watts, are
7k
possible in the frequency ranges of the upper L-band; 1.5 to 1.6 GHz,
or in the 800 to 809 MHz range, but require larger antennas in space.
There are basically two options for establishing a satellite
communications system. One option would be to construct and launch a
satellite for exclusive use by INS. Such a system would cost in the
millions of dollars (Vaisnys 1980 and Bergen 1981). Approval for the
use of the appropriate frequency spectrum would have to be obtained
from the International Frequency Regulation Board (IFRB) sense the
Federal Communications Commission (FCC) only has jurisdiction on
frequency allocation inside the United States borders. Part of the
satellites footprint would most likely lie outside the U.S. border. It
is very doubtful that a portion of the international frequency spectrum
could be obtained for use solely by the INS. A more likely case would
be to lease the appropriate transponder space from a commercial
satellite. Such satellites, with large space antennas, allowing for the
use of small earth antennas, have not yet been built. These types of
satellites are not expected to be built or launched until 1987 or later
(Hills 1985). The cost of leasing transponder bandwidth, if available,
is unknown, but is expected to be more expensive then most of the other
transmission media.
CHAPTER 4
PRELIMINARY EVALUATION OF CANDIDATE SYSTEMS
4.1 Introduction
More than one hundred and twenty unique candidate systems can
be derived by taking combinations of the three variables of the
communications problem. Three different topologies, five different
processing distributions and eight different transmission media are
under consideration; forming a total of 120 possible candidate systems.
Additional systems can be formed by using tree topologies and two
different communications medium.
A candidate system is derived by picking one choice from each
communications group. For example, one possible candidate system would
use a bus topology, have each sensor send the unsummed digital data to
the base station and use fiber optic cable as a transmission medium.
Some candidate systems are obviously not feasible. If a star topology
was chosen, the only practical transmission media would be nonline of
sight radio and satellite radio. It would be impractical to bury one of
the cable transmission media from the base station to each sensor and
systems using line of sight radio would require intermediate relay
stations.
It is not efficient to list every possible candidate system and
then try to judge each system separately for its technical feasibility
75
76
and practicality. Instead, for the preliminary evaluation, all systems
will be judged simultaneously from the criteria of bandwidth and timing
and control. The required bandwidth depends upon the degree of
distributed processing. Bandwidth calculations are given in section
4.2. All of the signal processing stages of the GUIDAR receiver operate
from common timing and control circuitry. The effect that this
centralized timing and control has on separating any of the signal
processing stages will be discussed in section 4.3.
It is reasonable to begin the evaluation of the candidate
systems by considering the different distribution of processing
arrangements since one of the major tasks of this study is to determine
if it is technically practical to remotely locate any portion of the
GUIDAR receiver. On one extreme, only the transmitter would be located
at each two mile segment. On the other extreme, a complete GUIDAR
system would be located at each two mile segment. First, the bandwidth
will be calculated for each major processing stage. Once the bandwidth
is known, a compatible transmission media can be chosen. Low bandwidth
requirements would probably use transmission media such as twisted wire
pair, power line carrier and single channel per carrier broadband
coaxial cable and radio systems. High bandwidths would require using
base or broadband coaxial cable, fiber optic cable, microwave radio or
satellite radio systems. In some cases, it might be advantageous to use
a large bandwidth communications medium for a low bandwidth
requirement. For example, a single mode fiber optic cable can have a
77
bandwidth exceeding 1 GHz but it also has such properties as low
attenuation rate, immunity to electromagnetic interference, light
weight and flexibility (see section 3.4.4) that might make it a
desirable communications medium for certain low bandwidth applications.
Once a transmission medium is chosen to accommodate the
required bandwidth, a suitable topology can be selected.
The list of the surviving candidate systems can be further
reduced (Chapter 5) by examining such criteria as the current
technology of the transmission media and components, the vulnerability
to intentional sabotage and the installation requirements.
4.2 Bandwidth Calculations
As mentioned in section 3.3, there are five places in the
GUIDAR receiver where the signal processing components could be
separated to create a distributed processing system. In this section,
the approximate bandwidth needed to transmit each of these signals to
the base station or some intermediate node will be calculated and
discussed. The results of these calculations will help to determine if
it is practical to remotely locate any of the signal processing
components.
4.2.1 Received Signal
The receive signal is the signal located at the input port of
the GUIDAR receiver (Figure 3.2). This signal is obtained directly from
the receive cable, prior to any signal processing and still contains
the original 57, 63 or 69 MHz carrier frequency.
78
In practice, the bandwidth of a rectangular pulse can be
approximated by the inverse of the pulse width in time. The recommended
pulse width setting is 450 nanoseconds. This yields a bandwidth of 2.22
MHz. The total bandwidth required per sensor would be the sum of 2.22
MHz and the original carrier frequency. Using 63 MHz as an example for
the carrier frequency, the total bandwidth required per sensor would be
65.22 MHz. Since over 40,000 pulses are processed every second, each
sensor would be required to have its own dedicated channel. Fifty
sensors would require a total bandwidth of 3.261 GHz.
The 65.22 MHz bandwidth requirement per sensor limits the
transmission media to fiber optic cable, microwave radio or satellite
radio. As mentioned earlier, for a 100 mile system, it would be
impractical to bury a separate fiber optic cable to each sensor from
the base station. Satellite and microwave radio would require the
installation of large antennas at each sensor site. Such antenna
systems would be vulnerable to intentional sabotage and potential
weather damage. Also, it is very doubtful that FCC approval could be
obtained for the use of 3.261 GHz of the microwave or satellite
frequency spectrum.
4.2.2 Received Signal Envelope
The received signal envelope contains the same information as
the received signal except the carrier frequency has been removed. This
signal is obtained directly after the coherent demodulator (Figure
3.2). This signal is represented by signal SI in Figure 2.1.
79
At this point, a carrier frequency could be added to the
envelope or the envelope could be digitized prior to transmission. If a
carrier frequency of 60 MHz, for example, was added to the envelope,
the bandwidth required for each sensor would be k.kk MHz for double
sideband transmission or 2.22 MHz for single sideband transmission. The
implementation of single sideband would require the addition of a
filter in the transmitter to filter out either the upper or lower
sideband. Coaxial cable in addition to fiber optics, microwave radio
and satellite radio have the necessary bandwidth to transmit the
received signal envelope. Digitizing the signal would increase the
bandwidth.
If the signal was sampled at the Nyquist rate of k.kk Mbps and
quantized to 8 levels, the total bit rate would be 35.52 Mbps. If this
bit rate was transmitted digitally, using baseband signaling (NRZ,
Biphase, Delay etc.), each sensor would require between 17.76 (Delay)
and 52.28 (Biphase) MHz of bandwidth (Stallings 1985, p. 72). Using
Nyquist pulses, the required bandwidth would be about 23.68 MHz. If
the signal was transmitted in an analog format, using QPSK, each sensor
would require about 26.6** MHz of bandwidth. An error correcting coding
algorithm could be added to the digitized signal for more reliable
transmission but this process would increase the bandwidth.
The digitized bandwidth is much larger than the original
envelope bandwidth and no extra bits for error correcting coding have
been added and the minimum sampling rate and quantization level were
80
assumed. Ideally, the signal envelope should be sampled higher then the
Nyquist rate and more quantization levels would be necessary to detect
small changes in the signal envelope. The conclusions are the same as
the first case.
4.2.3 Unsummed Digital Data
At this point, the received signal envelope has been divided
electronically into 60 cells and quantized into 8 bits. This sampling
and quantization process takes place sequentially in a time of 17.1 us
for 60 cells (see single cycle breakdown, section 2.2.1).
If this data was relayed to the base station, the data transfer
rate would have to take place within 17.1 us. A longer data transfer
time would slow down the single target detection cycle time of 99.8 ms.
A slower target detection cycle time would increase the probability of
missed detection.
The data rate of the unsummed digital data is: 8 bits X 60
cells in 17.1 us or 480 bits in 17.1 us. This is equivalent to a data
rate of 28.07 Mbps. For digital transmission, without any error
correcting code bits, each sensor would require a bandwidth between
14.035 and 42.105 MHz. For analog transmission, QPSK, each sensor would
need a bandwidth of about 21.052 MHz. Each sensor would require its
own dedicated channel because of the high pulse repetition rate. The
conclusions are the same as the previous two cases.
81
4.2.4 Preprocessor Output
The preprocessor output consists of sixty, sixteen bit data
words, each word representing the sum of 2048 eight bit quantized cells
of either the inphase or quadrature phase component of the received
signal. Each sixteen bit word is transferred in parallel from the
preprocessor RAM to the processor RAM for intrusion detection
computation. The total read cycle time for all 60 cells is one
millisecond (see section 2.2.3). If this data was transferred to the
base station or some intermediate node, the data transfer rate could be
no more than 1 ms because the single target detection cycle time can
not be slowed down.
The data rate of the preprocessor output would be 16 bits X 60
cells in 1 ms, or 960 bits in 1 ms. This is equivalent to a data
transfer rate of 960,000 bits per second. For digital transmission, the
required bandwidth would be at least 480,000 Hz and for analog
transmission the bandwidth would be about 720,000 Hz. The conclusions
are the same as the previous cases.
4.2.5 Display Data
The display data consists of only the essential bits needed to
identify the location and type of intruder. The display data would be
relayed to the base station only after an intrusion has occurred. In
most areas covered by a long line sensor system, it would probably not
be necessary to identify the intruders location to the nearest one
cell or 33 meters. Intrusion detection to the nearest 100 meters would
82
be practical. The maximum number of bits needed for the display data
would be:
Identification for fifty systems = 6 bits
Response Number (400-32,766) = 15 bits
32 Zones + Equipment Status Codes = 6 bits
Total = 27 bits
Rounding off to the nearest power of two, 32 bits would be
sufficient to identify each two mile system, the zone number of the
intruder, the response number of the intruder, equipment status codes
and additional bits for an error correcting code or for future
expansion.
Since the display data rate is very low, and not continuous,
most of the transmission media or topologies could be used to relay
this data to the base station. Baseband coaxial cable and microwave
radio are strictly used for high data rate communications. Transmission
media such as fiber optic cable, satellite radio and broadband coaxial
cable are usually used for high data rate communications but they can
be adapted for low bit rate communications.
A variety of twp way, low bit rate , real time data
communications systems have been built and tested. Radio systems
include: a fixed sending and receiving UHF system built by
Westinghouse Electric Corporation (Field Demonstrations of
Communication Systems for Distributed Automation vol. 4 and Smalling
1983) and a fixed frequency AM forward link with a VHF single channel
83
per carrier return link, built by McGraw-Edison Company (Holbrow 1985
and Martinez 1981).
Power line carrier systems for two way, low bit rate
communications have been built by; Brown Boveri Compuguard Corporation
(Field Demonstrations of Communication Systems for Distributed
Automation vol. 2), Westinghouse Electric Corporation (Field
Demonstrations for Communications Systems for Distributed Automation
vol. 4) and Emmerson Electronics Corporation (Mak and Reed 1982 and
Mak and Moore 1984).
Two way data communications between the sensors and the base
station may not be necessary but would be desirable. Two way
communications would enable the base station to interrogate each sensor
to verify data, check the operating status of the equipment and to
adjust cell thresholds.
4.5 Timing and Control
Each major signal processing component of the GUIDAR receiver
operates from centralized timing and control circuitry (see Figure 2.2
and Figure 3.2). All timing is derived from a single 24.5 MHz
oscillator. The oscillator provides timing for: the inphase/
quadrature phase switch in the receiver demodulator; the dither, sample
and hold and A/D converter in the digitizer; the adder and dynamic RAM
in the preprocessor and the TMS 9900 microprocessor in the processor
module. The TMS microprocessor acts as a controller for the receiver
demodulator, the digitizer and the preprocessor. The TMS 9900
8 ̂
microprocessor also provides system malfunction alarms to the operator
and performs component self testing (Harman and Mackay 1976). If any
part of the GUIDAR receiver circuitry was remotely located, a local
oscillator and additional control circuitry would have to be added to
each section.
It is important for each of the signal processing steps to be
executed within their specific time allotment. Any slow down in the
target detection cycle will decrease the probability of detection. It
is highly unlikely that such precise synchronization could be
maintained between each sensor site and an intermediate node or the
base station. The cost for the design and manufacture of the additional
timing and control circuitry would surely offset any savings gained by
separating the components of the GUIDAR receiver.
4.4 Summary and Conclusions
After considering both the bandwidth requirements and the
timing and synchronization requirements, the most logical place to
divide the GUIDAR receiver would be after all signal processing has
been completed. Only the display data would be sent to the base
station.
There are two major advantages of sending only the display data
to the base station. First, the bandwidth needed for each sensor would
be minimal and, second, each sensor would not require a dedicated
channel to communicate to the base station since the display data is
generated only after an intrusion has occurred. It is assumed that a
85
short deloy between the the actual time of an intrusion and when the
display data arrives at the base station would be acceptable. Storage
logic for the display data would be added to each sensor transceiver.
When a sensor is interrogated by the base station or when the
communications channel is clear, the stored intrusion data would be
relayed to the base station. Even if a delay in receiving the intrusion
data was not acceptable, the bandwidth required per sensor would be
small enough that each sensor could possibly have its own dedicated
channel to communicate to the base station.
Since only the display data will be sent to the remote base
station, some of the transmission media can be eliminated immediately.
Microwave radio and baseband coaxial cable are strictly used for high
data rate communications. Although satellite, fiber optic cable and
broadband coaxial cable are mostly used for high data rate
communications, they are occasionally used for low data rate
communications. All of the transmission media except baseband coaxial
cable and microwave radio will be evaluated in Chapter 5.
CHAPTER 5
FINAL EVALUATION OF CANDIDATE SYSTEMS
5.1 Introduction
In Chapter the candidate systems were evaluated from the
criteria of bandwidth and timing and control. The conclusion was that
it is only feasible to send the display data to the base station. Two
candidate transmission media, microwave radio and baseband coaxial
cable, were determined to be impractical. In this chapter, the
remaining candidate systems will be reevaluated. The evaluation
criteria are current technology, vulnerability, and installation
requirements.
5.2 Current Technology
Low bit rate, single channel per carrier satellite
communications, enabling the use of small earth station antennas, is
technically feasible, but current FCC regulations have restricted its
development. The FCC has not specifically allocated any portion of the
electromagnetic spectrum for remote data collection. The alternative
would be to lease transponder bandwidth, which has been allocated for
commercial use, from private industry. The FCC has allocated bandwidth
in the 800 to 896 MHz range (Newman 1986) and is proposing additional
bandwidth allocation in the L Band frequency range for mobile satellite
86
87
communications. Proposed satellites for mobile communications would
have space antennas large enough to enable multiple spot beams,
frequency reuse and small earth station antennas. Twelve commercial
companies have submitted applications to the FCC to provide this
service (Hills 1985). The FCC is expected to award the contract to only
one applicant. This will not occur until 1987 or later. The cost of
leasing transponder space, if available, can not be determined at this
time. For these reasons, the use of satellite as a transmission media
is impractical at the present time and in the near future.
5.3 Vulnerability
The vulnerability of having an exposed antenna at each two mile
sensor segment is a subjective idea. Clearly, an unguarded antenna
could be subjected to deliberate sabotage. If an antenna was damaged,
the entire two mile sensor section would be inoperative. The cost of
replacement and repair would be inconvenient and expensive. All radio
systems can be subjected to intentional jamming and propagation
characteristics are affected by adverse weather conditions such as
heavy rains and lightning. In addition to vulnerability, all radio
systems must be approved by the Federal Communications Commission. The
approval process, if bandwidth is available in the proposed area of the
frequency spectrum, can take several years. For these reasons, all
radio transmission media are considered to be impractical for this
project.
88
5.4 Installation Requirements
The surviving candidate transmission media are twisted wire
pair, broadband coaxial cable, fiber optic cable and power line
carrier. Installation requirements for each of these transmission media
are relatively the same. Twisted wire pair and fiber optic cable are
lighter in weight than broadband coaxial cable and, in terms of weight
only, would cost less per kilometer to install. Fiber optic cable is
more expensive, in dollars per kilometer, than both twisted wire pair
and broadband coaxial cable. Also, fiber optic cable is more difficult
and expensive to splice than twisted wire pair and coaxial cable. A
power line carrier system would be integrated into the power
distribution system. A power line carrier system would probably be the
least expensive system to install since it could be installed
simultaneously with the power distribution system. Each of the
transmission media could be buried in the same trench as the power
distribution system, provided they are separated by about one foot of
soil. To avoid electromagnetic interference, both the communications
cables and power distribution cables must be separated from the leaky
coaxial cable trenches.
5.5 Summary and Conclusions
In Chapter k, it was shown necessary to send only the display
data to the base station. In this chapter, all of the candidate
transmission media listed in Figure 3.10, except twisted pair wire,
broadband coaxial cable, fiber optic cable and power line carrier, have
89
been eliminated. All of the remaining transmission media would be
employed in a bus topology. A simple access protocol, such as carrier
sensed multiple access or token passing, could be used to relay the
display data to the base station. The main advantage of each of these
systems is that they can all be completely buried underground. While
the SENTRAX system has not been specifically addressed in this chapter,
the issues and conclusions are identical to those for the GUIDAR
system.
CHAPTER 6
DETAILED EVALUATION OF REMAINING SYSTEMS
6.1 Introduction
The remaining long line sensor systems would all use a bus
topology, send only the display data to the base station and use one of
the following transmission media: twisted wire pair, broadband coaxial
cable, power line carrier or fiber optic cable. In this chapter, the
advantages, disadvantages and approximate costs for each system will be
outlined. The cost data has been derived from several different sources
and serves only as a guideline for comparing the relative cost of one
system against another. The estimated cost of the required power
distribution system and the installation cost are will be given in
Chapter 7. An additional study would be necessary to determine the
most efficient power distribution system and the possibilities of using
alternative power sources such as batteries and photovoltaic cells.
Installation costs would depend primarily upon the amount of soil
excavation needed to install the sensors, power distribution system and
communications cable. The leaky coaxial cables must be installed in a
trench separate from the power distribution cables and the
communications cables. The cost estimate for installing the
experimental sensor system, excluding power and communications
equipment, has been estimated at 2,272 dollars for 3,200 meters
90
91
(Frankel et al. 198*0. A costs comparison per mile and per kilometer
for the GUIDAR and SENTRAX systems will be given in Chapter 7.
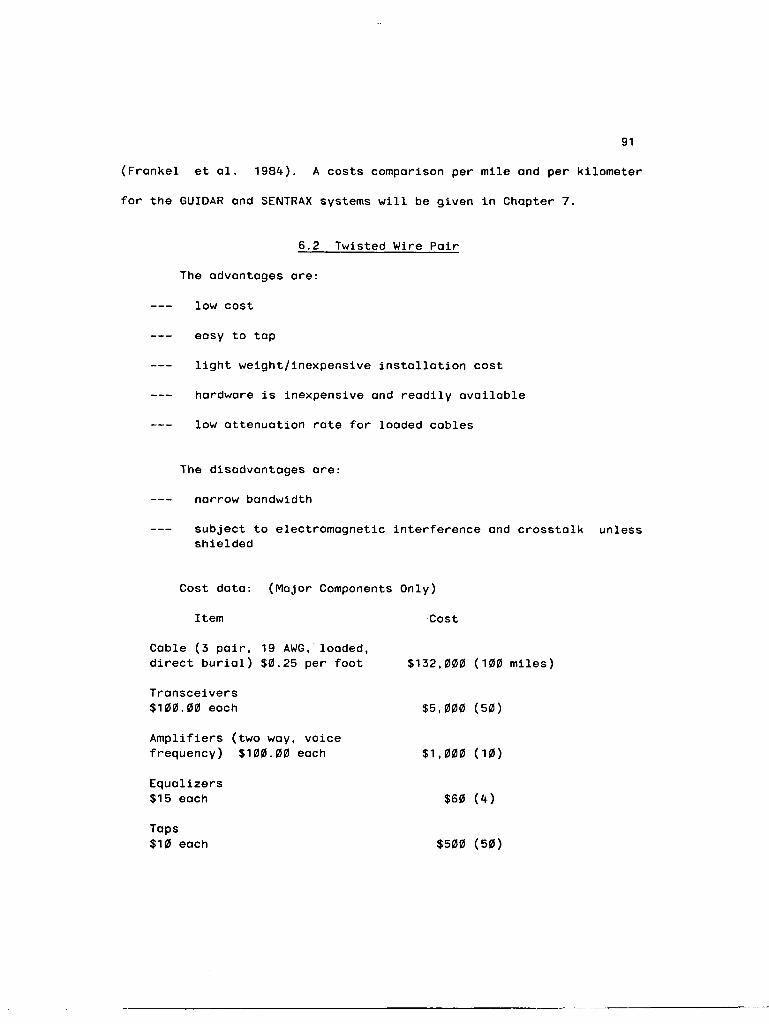
6.2 Twisted Wire Pair
The advantages are:
low cost
easy to tap
light weight/inexpensive installation cost
hardware is inexpensive and readily available
low attenuation rate for loaded cables
The disadvantages are:
narrow bandwidth
subject to electromagnetic interference and crosstalk unless shielded
Cost data: (Major Components Only)
Item Cost
Cable (3 pair, 19 AWG, loaded, direct burial) $0.25 per foot $132,000 (100 miles)
Transceivers $100.00 each $5,000 (50)
Amplifiers (two way, voice frequency) $100.00 each $1,000 (10)
Equalizers $15 each $60 (4)
Taps $10 each $500 (50)
92
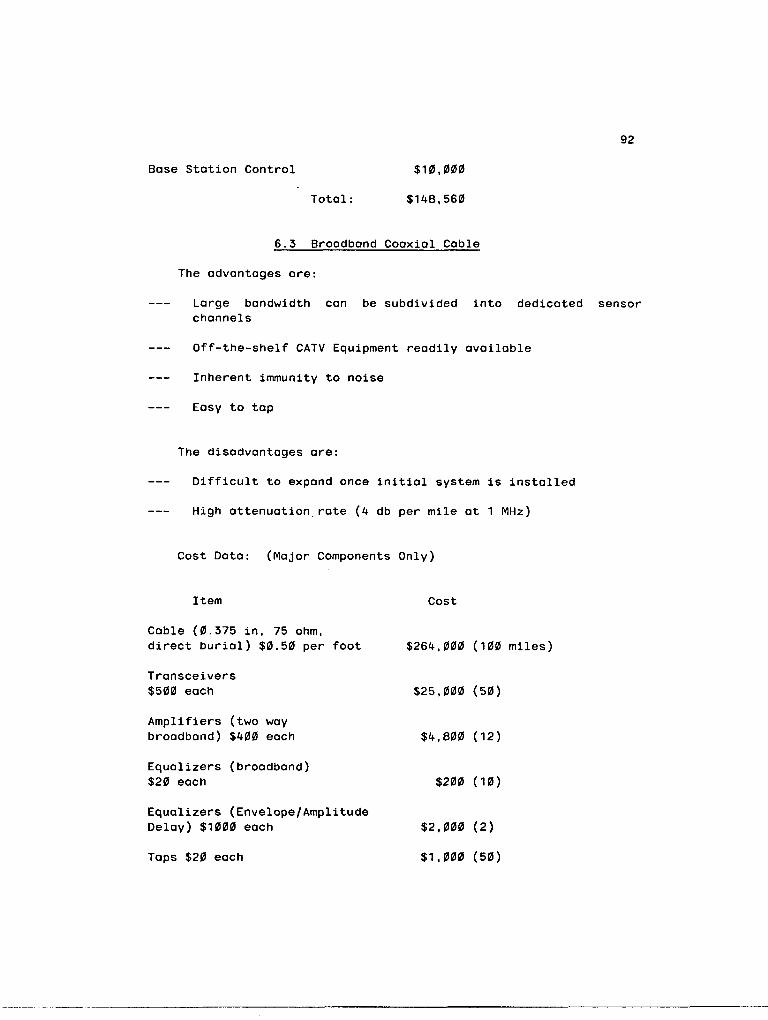
Base Station Control $10,000
Total: $148,560
6.3 Broadband Coaxial Cable
The advantages are:
Large bandwidth can be subdivided into dedicated sensor channels
Off-the-shelf CATV Equipment readily available
Inherent immunity to noise
Easy to tap
The disadvantages are:
Difficult to expand once initial system is installed
High attenuation.rate (4 db per mile at 1 MHz)
Cost Data: (Major Components Only)
Item Cost
Cable (0.375 in, 75 ohm, direct burial) $0.50 per foot $264,000 (100 miles)
T ransceivers $500 each $25,000 (50)
Amplifiers (two way broadband) $400 each $4,800 (12)
Equalizers (broadband) $20 each $200 (10)
Equalizers (Envelope/Amplitude Delay) $1000 each $2,000 (2)
Taps $20 each $1,000 (50)
93
Base Station Control $10,000
Total: $307,000
6.4 Power Line Carrier
The advantages are:
easy to expand
potential installation savings
integrated with power distribution system/easier to maintain
The disadvantages are:
subject to electromagnetic interference
special protective equipment required at each transceiver
narrow bandwidth
high power required to maintain good signal to noise ratio
Cost Data: (Major Components Only)
Item Cost
Signal Coupling Unit $850 each $42,500 (50)
Isolators $650 each $32,500 (50)
Amplifiers (two way) $3,000 each $150,000 (50)
Transceivers $250 each $12,500 (50)
Base Station Control $10 ,000
Total: $247,500
9*4-
6.5 Fiber Optic Cable
The advantages are:
excess bandwidth available for expansion
small size and weight/inexpensive installation costs
immunity to electromagnetic interference
signal security
low attenuation
fewer electrical components/less maintenance
decreasing costs of cable and hardware
The disadvantages are:
difficult to tap/splice
high cost per splice
passive taps have a large attenuation loss
Cost Data: (Major Components Only)
Item Cost
Cable (multimode, direct burial) $1.50 per meter $250,000 (100 miles)
Transceivers (half duplex) $150 each $7,500 (50)
Regenerative Repeaters $500 each $2,500 (5)
Passive Taps $100 each $5,000 (50)
Connectors $25 each $2,500 (100)
95
Base Station Control $15,000
Total: $282,500
6.6 Summary
Transmission Medium Cost
mile kilometer
Twisted Wire Pair $1,486 $921
Broadband Coaxial Cable $3,070w $1,903
Power Line Carrier $2,475 $1,534
Fiber Optic Cable $2,825 $1,751
In terms of cost per mile, twisted wire pair is the least
expensive communications medium and broadband coaxial cable is the most
expensive communications medium. A communications medium should not be
selected on the basis of cost alone. Other factors, such as
expandability, ease of maintenance and reliability of components,
should be weighed equally with the cost data before selecting a
specific transmission medium. An average cost of $2,500 per mile for a
transmission medium will be used as an estimate for computing the total
long line sensor system cost per mile.
CHAPTER 7
SUMMARY AND CONCLUSIONS
Chapter 1 discussed the general operating characteristics of
two commercially available intrusion detection sensors called GUIDAR
and SENTRAX. The GUIDAR and SENTRAX systems differ in that the GUIDAR
system is a pulse type sensor and the SENTRAX system is a continuous
wave sensor. THe GUIDAR sensor has a total length of 2 miles and the
SENTRAX system has a total length of 3 miles.
The possibility of installing a combination of pulse type and
continuous wave type sensors over a 100 mile border segment was briefly
mentioned in Chapter 1. As shown in Figure 7.1, the SENTRAX system, as
currently implemented, is more expensive than the GUIDAR system in
terms of cost per mile. On the basis of cost alone, it would be more
economical to install only the GUIDAR system over the entire 100 miles.
An approximate cost of 50,000 per mile for the GUIDAR system will be
used in computing the total long line sensor system cost.
The main disadvantage of installing the GUIDAR system over the
entire 100 miles would be the cost penalty of paying for a sensor which
provides very fine range resolution in areas where coarse resolution
would be sufficient. It is possible that some areas along a 100 mile
section of border would not require the 33 and one third meter cell
resolution of the GUIDAR system.
96
GUIDAR SYSTEM (Prices as of 9/85)
One processor unit* **3,308 One extension package 15,000 Two line amplifier units 12,632 Transducer Cables 54,080
Total (3.2 Kilometers) 125,020 (2 miles)
Cost per mile 62,510 Cost per kilometer 39,069
SENTRAX SYSTEM (Prices as of 9/84)
One control module 7,707 Sensor cable sets (32) 60,032 Tranceiver Modules (16) 120,624 RF decouplers (32) 10,592
Total (4.8 kilometers) 198,955 (3 miles)
Cost per mile 66,318 Cost per kilometer 41,449
*with display
Figure 7.1 Cost Comparison of GUIDAR and SENTRAX Systems
98
The primary advantage of using the GUIDAR system is that the
smaller detection cell resolution provides a greater chance that the
intrusion response for each cell will be within the suggested 3 to 1
ratio (Frankel et al. 198*0. A 3 to 1 ratio will allow the GUIDAR
system to distinguish small animals and other types of false alarms
from actual human intrusions. The problem with having large detection
cells is that the intrusion response ratio would most likely be greater
than 3 to 1. For large detection cells, it might be possible to smooth
out the intrusion response to within the 3 to 1 ratio by burying the
leaky coaxial cables in a uniform soil (see part I of this study). In
areas where the soil is nonuniform, smaller detection cells of 17
meters or even 8 meters might be necessary to keep the intrusion
response ratio within the recommended range.
The resolution of the SENTRAX system is equal to the distance
between transceivers. The maximum spacing between transceivers is 300
meters. This limit is due to the fact that both data and power
distribution takes place over the leaky coaxial cables. If the data and
power distribution were transmitted separately from the leaky cables,
it might be possible to extend the distance between transceiver
elements up to one half or one mile, however, line amplifiers would
probably be necessary to maintain a sufficient signal to noise ratio.
A continuous wave sensor with large detection cells would be the most
efficient way to cover areas of the border where only coarse resolution
is needed. It is estimated that the cost per mile of additional line
amplifier units would be less than the cost of the required number of
99
transceiver modules and separate data and power distribution links and,
therefore, the total cost per mile of the SENTRAX long line sensor
system could be reduced. As mentioned before, large detection cells
could only be used if the intrusion detection response was maintained
within the suggested 3 to 1 ratio.
Another possibility for a 100 mile long sensor system would be
to use a newer version of the GUIDAR system which has variable cell
lengths (Clarke and Sims 198^). In areas where coarse or fine
resolution was needed, the cell lengths could be adjusted accordingly
provided that the intrusion response ratio remained within the
recommended limits.
Fifty of the two mile GUIDAR systems or about thirty three of
the three mile SENTRAX systems would be necessary to cover one hundred
miles. It is doubtful that either of these systems could be extended
beyond their present length. Longer sensor systems would have longer
detection times, would require a higher pulse transmission power, more
line amplifier units and would lose some signal to noise ratio due to
the additional noise accumulation with increasing length. The
combination of these factors would lead to either a higher false alarm
rates, a decrease in the probability of detection or both.
Chapter 2 discussed the detailed operation of the GUIDAR and
SENTRAX systems. Also discussed in Chapter 2 were the power
requirements, operating temperature range and possible system
improvements for each sensor. Power distribution for a 100 mile long
100
sensor system is not a trivial problem. Another study would be
necessary to determine the most effective power distribution system.
Some of the sensor components, such as the GUIDAR receiver/transmitter
and the SENTRAX control module are normally located indoors and would
have to be weatherized or put in an environmentally controlled
container before installation. The cost of weatherizing these
components is not known.
Chapter 3 discussed the three variables of the long line sensor
communications problem. The three variables are topology, distribution
of processing and type of transmission media. The advantages and
disadvantages of each type of topology and transmission media were
explained.
The preliminary evaluation of the candidate long line sensor
systems was discussed in Chapter k. The candidate long line sensor
systems were derived by taking combinations of the three variables of
the communications problem. Since one of the major tasks of this study
was to determine if it is feasible to remotely locate any part of the
GUIDAR system, the problem of distribution of processing was addressed
first. The criteria used to evaluate the degree of distributed
processing were bandwidth and timing and control. It was determined,
because of the large bandwidths and centralized timing and control,
that the only logical place to separate the GUIDAR system was after
all signal processing had been completed. Only the appropriate display
data would be sent to the base station. The two advantages of sending
only the display data to the base station are the low bandwidth
101
requirement and the fact that the display data would not have to be
sent instantaneously to the base station. A short time delay between an
intrusion and when the base station is notified would probably be
acceptable. Therefore, each sensor would not require a dedicated
communications channel to the base station. Once it was determined to
send only the display data to the base station, baseband coaxial cable
and microwave radio were eliminated from the list of candidate
transmission media because they are not practical for low bit rate
transmissions.
In Chapter 5, each of the remaining candidate systems were
evaluated using the criteria of technology, vulnerability and
installation requirements. It was decided to eliminate all radio
transmission systems because of the vulnerability of exposed antennas
to intentional sabotage, the fact that all radio systems can be
subjected to jamming and the difficulty in obtaining approval from the
FCC for the use of the appropriate frequency spectrum. The surviving
candidate systems were twisted wire pair, broadband coaxial cable,
fiber optic cable and power line carrier. The main advantage of each of
these systems is that they can be completely buried underground. Each
system would be installed in a bus topology configuration and an access
protocol, such as carrier sensed multiple access or token passing,
would be used to relay the display data to the base station.
Chapter 6 lists the advantages, disadvantages and the
approximate costs of the major system components for the four remaining
102
long line systems. Broadband coaxial cable is the most expensive but
has the advantage of well proven, readily available technology. Twisted
wire pair is the least expensive but the limited bandwidth would make
future expansion difficult. Fiber optic cable has the largest bandwidth
and projected decreasing component costs, but the rapidly changing
technology might make some of the system components installed now
obsolete within a few years. A power line carrier system would save on
installation costs but would require special expertise for maintenance
and installation and has limited bandwidth available for future
expansion.
Other, long term factors which need to be considered are
expandability, reliability, maintainability and security. The selected
transmission media should have additional bandwidth available for
expansion. The border patrols projected requirements for other types of
sensors, remote communications, and power should all be integrated
into this long line sensor project. The reliability of each component
of the selected long line sensor system is important in determining
future maintenance and replacement costs. Reliable components cost more
initially but require less maintenance and replacement in the future.
Analyzing the performance of previous sensor projects might give some
insight into the reliability and vulnerability of this type of long
line sensor system could be estimated. The survivability of the system
to natural hazards, such as lightning and flash flooding, should also
be studied. In order to keep the false alarm rate to a minimum, both
the GUIDAR and SENTRAX systems would have to be equipped with the
103
capability of adjusting the different cell thresholds automatically. As
the moisture content and temperature of the soil changed over the 100
miles, the cell thresholds of each sensor would be adjusted continually
so the same probability of detection could be maintained. Another
option would be to design the system so the base station operator could
adjust the cell thresholds remotely. To implement an automatic or
remote cell threshold adjustment system would require additional
hardware and redesign of the GUIDAR and SENTRAX systems.
The total system cost can be estimated as follows:
MAJOR ITEM COST PER MILE
Communications Equipment (average) $2,500
GUIDAR System $50,000
Transformers ($200 each) (18 KV step down to 120 volts at 3 amps)
$100
Equipment Bunkers ($500 each) (GUIDAR and Communications Equipment)
$250
Equipment Bunkers ($200 each) (Transformer)
$100
Additional Power Distribution Equipment (Circuit Breakers, Receptacles, etc.)
$50
Power Distribution Cable (18 KV, 2 phase, direct burial coaxial cable at 2 amps)
$4,000
Installation (flat terrain, easily excavated soil, using a trench digger and backfilling trenches with the same soil)
$2,500
Total $59,500
10^
The major expense of • long line sensor system is the cost of
the GUIDAR equipment. A single GUIOAR system, 2 miles in length, costs
about $125,000. It is estimated that a slightly modified GUIOAR system
which, does not include the LED display, is weatherized and is
purchased in large quantities, would cost no more than $100,000. It is
possible that a lower system cost could be achieved with mass
production.
It is estimated that each sensor and additional communications
equipment would require 3 amps at 120 volts, or 360 watts of power. A
100 mile system, using 50 sensors, would require 18 kilowatts of power.
The cost of the power distribution system is estimated by assuming that
all of the power is distributed from one end of the 100 mile sensor
system. Transformers and additional equipment would be required at
every 2 mile segment. Possibly, the optimal power distribution system
might consist of a specially designed power cable which could also be
used for communications. Instead of using off-the-shelf power line
carrier cable and equipment, this system would be specifically designed
for the power requirements and data rates of a 100 mile long sensor.
The estimated installation cost per mile assumes that the
GUIDAR, communications and power distribution equipment are installed
over level ground and in soil which is easily excavated. The actual
terrain and type of soil across the southern international border
varies considerably. In addition, part I of this study determined that
better performance can be maintained if the leaky coaxial cables are
buried in a homogeneous soil. Also, the power distribution cables
105
should be installed in conduit to provide additional long term cable
protection and safety against accidental electrocution. With these
factors taken into consideration, the installation cost per mile might
increase five or ten fold and become comparable to the cost per mile of
the GUIDAR equipment.
LIST OF REFERENCES
Baker, Donald G., Fiber Optic Design and Application, Reston Publishing Company, Inc., Reston, Virginia, 1985.
Ball, Roy D. and Gerald Levett, "Evaluation of the Guidar Intrusion Detection System for the Correctional Service of Canada (CSC)," Proceedings: 1980 Carnahan Conference on Crime Countermeasures, University of Kentucky, Lexington, Kentucky, May 1^-16, 1980, pp. 73-81.
Basch, E. E. and T. G. Brown, "Introduction to Coherent Optical Fiber Transmission," IEEE Communications Magazine, Vol. 23, No. 5, May 1985, pp. 23-30.
Beal, John C., Joseph Josiak, Samir F. Mahmoud a^tl Veena Rawat, "Continuous-Access Guided Communication (CAGC) for Ground-Transportation Systems," Proceedings of the IEEE, Vol. 61, No. 5, May 1973, pp. 562-568.
Bergen, Layton, "Satellite Control of Electric Power Distribution," IEEE Spectrum, June 1981, pp. 43-^7.
Bloom, P. J., "High-Quality Digital Audio in the Entertainment Industry: An Overview of Achievements and Challenges," IEEE Acoustical Speech and Signal Processing Magazine, October 1985, pp. 2-25.
Chalmers, James, Technical Staff of Computing Devices Company, Ottawa, Ontario, Canada, personal conversation. August 1985.
Chipman, John D., "The Design of a Large Scale Fiber Optic Transmission System for Vandenberg Air Force Base," IEEE First Annual Phoenix Conference on Computers and Communications, Phoenix, Az., May 9-12, 1982, pp. 333-339.
Clarke, D. J. and M. S. Sims, "Developments in Long Line Ported Coaxial Intrusion Detection Sensors," Proceedings: 1984 Carnahan Conference on Security Technology, University of Kentucky, Lexington, Kentucky, May 16-18, 198^, pp. 5-12.
106
107
Clarke, D., R. K. Harman, N. A. M. Mackay and C. R. Reardon, "Guidar Buried Line Sensor Evaluation," Proceedings: 1977 International Conference on Crime Countermeasures through Science and Engineering, Oxford, England, July 25-29, 1977, pp. 207-212.
Cree, D. J. and L. J. Giles, "Practical Performance of Radiating Cables," The Radio and Electronic Engineer, Vol. 45, No. 5, May 1975, pp. 215-223.
Data Sources, Hardware Data Communications, Ziff-Davis Publishing Company, New York, October 1984.
D. E. N., "Signal Processing for Distributed Optical Fiber Sensors," Proceedings: 2nd International Conference of Fiber Optic Sensors, Liederfalle, Stuttgart, Federal Republic of Germany, September 5-7, 1984, pp. 285-295.
Richard N., "Design Considerations for Broadband Coaxial Cable Systems," IEEE Communications Magazine. Vol. 24., No. 6, June 1986. pp. 24-31.
Demonstrations of Communication Systems For Distributed Automation," Final Report, #EPRI-EL-1860, Vol. 2, Brown Boveri Compuguard Corp., June 1981.
Demonstrations of Communication Systems for Distributed Automation," Final Report. #EPRI-EL-1860. Vol. 3, Westinghouse Electric Corp., June 1981.
Demonstrations of Communication Systems for Distributed Automation," Final Report, #EPRI-EL-1860, Vol. 4, Westinghouse Electric Corp., June 1981.
Frankel, Harry D., George A. Van Horn and Robert N. Carlile, "Evaluation of the Ported Coaxial Cable Sensor (PCCS)," Final Report, INS-RD-1001. December, 1984.
Freeman, Roger L., Telecommunications Transmission Handbook. John Wiley and Sons, Inc., New York, 2nd edition, 1981.
Freeman, Roger L., Reference Manual for Telecommunications Engineering, John Wiley and Sons, Inc., New York, 1985.
Gowar, John, Optical Communication Systems, Prentice-Hall International, Inc., London, 1984.
Guided Intrusion Detection and Ranging System, GIDR1, Maintenance Manual, Vols. 1 and 2, 24 October 1981, Computing Devices Company, Ottawa, Ontario, Canada.
Davies,
Dunbar,
"Field
"Field
"Field
108
Guidelines for Engineering U.S. Army Satellite Terminals Interconnect Facilities. U.S. Army Communications Electronics Engineering Installation Agency, Ft. Huachuca, Az., Pub. No. CCC-CE-TS-84-01, March 1984.
Hamsher, Donald H., Communications Systems Engineering Handbook. McGraw-Hill Book Company, New York, 1967.
Harman, Dr. R. Keith, "Burial Medium Effects on Leaky Coaxial Cable Cable Sensors," Proceedings: 1985 International Carnahan Conference on Security Technology, Zurich, Switzerland, October 4-8, 1983a, pp. 185-189.
Harman, Dr. R. Keith, "Electronic Perimeter Security—Progress Report," Forum. January 1983b, pp. 11-15.
Harman, Dr. R. Keith, "Mapping Out New Directions for Perimeter Security—The Sentrax Motion Detection Sensor," CSIS Forum, June 1983c, pp. 7-9.
Harman, Dr. R. Keith, "Sentrax—A Perimeter Security System," Proceedings: 1983 Conference on Crime Countermeasures and Security, University of Kentucky, Lexington, Kentucky, May 11-13, 1983d, pp. 29- 34.
Harman, Dr. R. Keith, President of Senstar Corporation, Kanata, Ontario, Canada, personal conversation. October 1985.
Harman, Dr. R. Keith and N. A. M. Mackay, "Guidar: An Intrusion Detection System for Perimeter Protection," Proceedings: 1976 Carnahan Conference on Crime Countermeasures. University of Kentucky, Lexington, Kentucky, May 5-7, 1976, pp. 155-159.
Harman, Dr. R. Keith and John E. Siedlarz, "Advancements in Leaky Cable Technology for Intrusion Detection," Proceedings: 1982 Carnahan Conference on Security Technology, University of Kentucky, Lexington, Kentucky, May 12-14, 1982, pp. 115-121.
Henry, Paul S., "Introduction to Lightwave Transmission," IEEE Communi-, cations Magazine, Vol. 23, No. 5, May 1985, pp. 12-16.
Hills, Alex, "Satellites and Mobile Phones: Planning A Marriage," IEEE Spectrum. August 1985, pp. 62-67.
Holbrow, W. F. and R. E. Owen, "Two-Way Utility System Communications Using AM Broadcast Radio," IEEE Transactions on Power Apparatus and Systems. Vol. PAS-104, No. 1, January 1985, pp. 52-56.
109
Hunt, Allan R., "Development of a Distributed, Adaptive, Intrusion Detection System: Field Test Results," Proceedings: 1984 Carnahan Conference on Security Technology, University of Kentucky, Lexington, Kentucky, May 16-18, 1984, pp. 209-213.
Hunt, Allan R., Francis J. Cook, Gary B. Lapman, Ann H. Sanders and Frank E. Lanham, "Development of a Distributed, Adaptive, Intrusion Detection System: Hardware and Software Operation," Proceedings: 1985 Conference on Crime Countermeasures and Security, University of Lexington, Kentucky, May 11-13, 1983, pp. 41-45.
Kapron, Felix P., "Fiber Optic System Tradeoffs," IEEE Spectrum, March 1985, pp. 68-75.
Keiser, Gerd, Optical Fiber Communications, McGraw-Hill Book Company, New York, 1983.
Liz, Jou and Bruce Metcalf, "Wavelength Division Multiplexing," Proceedings of SPIE, Future Trends in Fiber Optic Communications, Vol. 340, Arlington, Virginia, May 4-5, 1982, pp. 69-74.
Local Area Networks, Datapro Reports on Telecommunications, Datapro Research Corporation, Delran, N.J., Vol. 2, August 1985, pp. TC41-0074-101 —TC41-0074-114.
Lynch, John F., "Trends in Fiber Optics," Signal, June 1985, pp. 33-37.
Mackay, N. A. and D. G. Beattie, "High-Resolution Guided Radar System," Electronic Letters, Vol. 12, No. 22, 1976, pp. 583-584.
Mackay, Neilson A. M. and James L. Manson, "A Guided-Radar Technique for Vehicle Detection," Proceedings: IEEE International Radar Conference, Washington, April 1975, pp. 123-127.
Mackay, Neilson A. M. and Sidney R. Penstone, "A High-Sensitivity Narrow-Band Time-Domain Reflectometer," IEEE Transactions on Instrumentation and Measurement, Vol. IM-23, No. 2, June 1974, pp. 155-158.
Mak, Sioe Tho and Thomas G. Moore, Jr., "TWACS, A New Viable Two-Way Automatic Communications System For Distribution Networks. Part II: Inbound Communication," IEEE Transactions on Power Apparatus and Systems, Vol. PAS-103, No. 8, August 1984, pp. 2141-
2147.
Mak, Sioe Tho and Don L. Reed, "TWACS, A New Viable Two-Way Automatic Communications System For Distribution Networks. Part I:
110
Outbound Communication," IEEE Transactions on Power Apparatus and Systems, Vol. PAS-101, No. 8, August 1982, pp. 2941-2949.
Maki, Dr. M. C., "Coupling Mechanisms in Leaky Cable Sensors," Proceedings: 1984 Carnahan Conference on Security Technology, University of Kentucky, Lexington, Kentucky, May 14-16, 1984, pp. 195-201.
Marcum, J. I., "A Statistical Theory of Target Detection by Pulsed Radar," IRE Transactions on Information Theory, Vol. IT-6, No. 2, April 1960, page 73.
Martain, D. J. R., "A General Study of the Leaky-Feeder Principle," The Radio and Electronic Engineer, Vol. 45, No. 5, May 1975, pp. 205-214.
Martinez, L., "Broadcast Radio System For Distribution Communications," Final Report, #EPRI-EL-1868, Altran Electronics, Inc., June 1981.
McRae, Dan, "Reliable HF and Survivable Communications," Signal, August 1985, pp. 75-79.
Midwinter, J. E., "Current Status of Optical Communications Technology," Signal, June 1985, pp. 94-97.
Nelson, A., R. Gravel, H. Roberts, and F. Gillham, "Manufacturing Technology for Low Cost Couplers," Fiber Optics in Local Area Networks. Proceedings of SPIE, Vol. 434, San Diego, California, August 25, 1983, pp. 9-14.
Newman, David B. Jr., "Land Mobile Satellite Service—Part II: L Band," IEEE Communications Magazine, Vol. 24, No. 6, June 1986, pp. 50-53.
Palais, Joseph C., Fiber Optic Cofrrmnications, Prentice-Hall, Inc., Englewood Cliffs, New Jersey, 984.
Patterson, R. E. and Neilson A. M. Mackay, "A Guided Radar System for Obstacle Detection," IEEE Transactions on Instrumentation and Measurement, Vol. IM-26, No. 2, June 1977, pp. 137- 143.
Poirier, J. Leon, "Leaky Coaxial Cable Resource Protection Sensor Performance Analysis," IEEE Transactions on Aerospace and Electronic Systems, Vol. AES-18, No. 3, May 1982, pp. 275-285.
Reference Data for Radio Engineers, Howard W. Sams and Co., Inc., Indianapolis, Sixth Edition, 1975.
111
Senior, John M., Optical Fiber Communications Principles and Practice, Prentice-Hall International Series on Optoelectronics, Prentice-Hall International Inc., London, 1985.
Smalling, K. D. and B. Poteat, "Load Management Operation at 900 MHZ," IEEE Transactions on Power Apparatus and Systems, Vol. PAS-102, No. 3, March 1983, pp 567-571.
Stallings, William, Data and Computer Communications. Macmilliam Publishing Company, New York, 1985.
Standard Materials List. United States Army, March 1986.
TMS 9900 Microprocessor Data Manual. Texas Instruments Incorporated, 1978.
Tobagi, Fouad A., Richard Binder and Barry Leiner, "Packet Radio and Satellite Networks," IEEE Communications Magazine, Vol. 22, No. 11, November 1984, pp. 24-40.
Transmission Systems for Communication, Members of the Technical Staff of Bell Telephone Laboratories, Bell Telephone Laboratories, Inc., 5th edition, 1982.
Vaisnys, A., "A Study of Space Communication Systems for the Control and Monitoring of the Electric Distribution System, Volume II: Supporting Data and Analysis," JPL Publication 80-48, Vol. II, May 1980.
Vinnins, M., R. E. Patterson, D. G. Beattie and N. A. M. Mackay, "A Minicomputer—Controlled Guided Radar Preprocessor," Proceedings of the International Symposium on Mini and Microcomputers, (IEEE Computer Society) Toronto, November 1976, pp. 164-168.
Whalen, Athony D., Detection of Signals in Noise, Academic Press, Inc., New York, 1971.
Williams, J. C., "Fiber-Optic Communications Technology Branching Devices," Fiber Optic Communication Technology, Proceedings of SPIE, Vol. 512, San Diego, Califorina, August 23-25, 1984, pp. 70-81.