40
Survey of the European Management Consultancy 2009/2010
| Date post: | 23-Mar-2016 |
| Category: |
Documents |
| Upload: | centro-de-gestion-del-conocimiento |
| View: | 215 times |
| Download: | 2 times |

Survey of the European Management Consultancy
2009/2010


November 2010
This report was prepared for FEACO by:
Dr. József PoórÁgnes Milovecz
Ágnes Király
© Research Center on Management and HRM, University of Pécs, Hungary

Table of Contents
Introduction by the FEACO CHAIRMAN . . . . . . . . . . . . . . . . . . . . . . . . . . . . . . . . . . . . . . . . . . . . . . . . . . . . . 5 ExecutiveSummary . . . . . . . . . . . . . . . . . . . . . . . . . . . . . . . . . . . . . . . . . . . . . . . . . . . . . . . . . . . . . . . . . . . . . . . . 6 KeyFigures,2007–2010 . . . . . . . . . . . . . . . . . . . . . . . . . . . . . . . . . . . . . . . . . . . . . . . . . . . . . . . . . . . . . . . . . . . . . 6
1 Scope of the Market and Methodology . . . . . . . . . . . . . . . . . . . . . . . . . . . . . . . . . . . . . . . . . . . . . . . . . . 7
2 Europe – Market Size, Forecast & Analysis . . . . . . . . . . . . . . . . . . . . . . . . . . . . . . . . . . . . . . . . . . . . . . . 8 2 .1HistoryandProjections . . . . . . . . . . . . . . . . . . . . . . . . . . . . . . . . . . . . . . . . . . . . . . . . . . . . . . . . . . . . . . . . . 8 2 .1 .1 SizeoftheEuropeanMC-Market,1998-2010 . . . . . . . . . . . . . . . . . . . . . . . . . . . . . . . . . . . . . . . 8 2 .1 .2 Evolutionin%oftheMCMarketTurnover1998-2010 . . . . . . . . . . . . . . . . . . . . . . . . . . . . . . 8 2 .1 .3 MCMarketas%ofGDP,1998-2010 . . . . . . . . . . . . . . . . . . . . . . . . . . . . . . . . . . . . . . . . . . . . . . . . 9 2 .1 .4 AverageGrowthRatebySizeofConsultancyCompany,2004-2009 . . . . . . . . . . . . . . . . . 9 2 .1 .5 SizeoftheEuropeanMCMarket(TotalTurnover)byCountry-Region,2009 . . . . . . . . . 10 2 .1 .6 BreakdownoftheEuropeanConsultingMarket(Business&ITConsulting)
byMainCountries,2008-2009 . . . . . . . . . . . . . . . . . . . . . . . . . . . . . . . . . . . . . . . . . . . . . . . . . . . . 10 2 .2AnalysisbyServiceLine . . . . . . . . . . . . . . . . . . . . . . . . . . . . . . . . . . . . . . . . . . . . . . . . . . . . . . . . . . . . . . . . 11 2 .2 .1 CompositionofMCMarketbyServiceline,2009 . . . . . . . . . . . . . . . . . . . . . . . . . . . . . . . . . . 12 2 .2 .2 BreakdownofBusinessConsultingTurnover,2009 . . . . . . . . . . . . . . . . . . . . . . . . . . . . . . . . 12 2 .2 .3 BreakdownofConsultingTurnover,2009 . . . . . . . . . . . . . . . . . . . . . . . . . . . . . . . . . . . . . . . . . 13 2 .2 .4 BreakdownofTurnoverfromotherServices,2009 . . . . . . . . . . . . . . . . . . . . . . . . . . . . . . . . . 13 2 .3AnalysisbyClientSector . . . . . . . . . . . . . . . . . . . . . . . . . . . . . . . . . . . . . . . . . . . . . . . . . . . . . . . . . . . . . . . 14 2 .3 .1 CompositionofMCMarketbyClientSector,2009 . . . . . . . . . . . . . . . . . . . . . . . . . . . . . . . . . 14
3 Selected European MC Markets . . . . . . . . . . . . . . . . . . . . . . . . . . . . . . . . . . . . . . . . . . . . . . . . . . . . . . . . 15 3 .1AnalysisbyCountry . . . . . . . . . . . . . . . . . . . . . . . . . . . . . . . . . . . . . . . . . . . . . . . . . . . . . . . . . . . . . . . . . . . 15 3 .1 .1 GrowthRates–BreakdownbyCountryRegion,2009 . . . . . . . . . . . . . . . . . . . . . . . . . . . . . . 15 3 .1 .2 ManagementConsultingasaPercentageofGDP,2009 . . . . . . . . . . . . . . . . . . . . . . . . . . . . 16 3 .1 .3 MCTurnoverandGDPinselectedEuropeanMarkets,2009 . . . . . . . . . . . . . . . . . . . . . . . . 16 3 .1 .4 BreakdownbetweenManagementConsultantsandSupportStaff,2009 . . . . . . . . . . . 17 3 .1 .5 KeyFiguresofselectedEuropeanMCMarkets . . . . . . . . . . . . . . . . . . . . . . . . . . . . . . . . . . . . 17 3 .2AnalysisbyDailyRates . . . . . . . . . . . . . . . . . . . . . . . . . . . . . . . . . . . . . . . . . . . . . . . . . . . . . . . . . . . . . . . . . 18 3 .2 .1 AverageDailyFeeRatesofselectedEuropeanMCMarkets,2009 . . . . . . . . . . . . . . . . . . . 18 3 .2 .2 ExportofMCServicesbyselectedCountries,2009 . . . . . . . . . . . . . . . . . . . . . . . . . . . . . . . . 18 3 .3AnalysisbyServiceLines . . . . . . . . . . . . . . . . . . . . . . . . . . . . . . . . . . . . . . . . . . . . . . . . . . . . . . . . . . . . . . . 19 3 .3 .1 MCMarketCompositionbyServiceLine(%ofTurnover),2009 . . . . . . . . . . . . . . . . . . . . . 19 3 .3 .2 MCMarketCompositionbyServiceLine(million€),2009 . . . . . . . . . . . . . . . . . . . . . . . . . . 20 3 .3 .3 BreakdownofMCinSelectedKeyCountries(million€),2009 . . . . . . . . . . . . . . . . . . . . . . 20 3 .3 .4 BreakdownofBusinessConsultinginSelectedKeyCountries(million€),2009 . . . . . . 20 3 .4AnalysisbyClientSector . . . . . . . . . . . . . . . . . . . . . . . . . . . . . . . . . . . . . . . . . . . . . . . . . . . . . . . . . . . . . . . 21 3 .4 .1 MCMarketCompositionbyClientSector(%ofTurnover),2009 . . . . . . . . . . . . . . . . . . . . 21 3 .4 .2 MCMarketCompositionbyClientSector(million€),2009 . . . . . . . . . . . . . . . . . . . . . . . . . 22 3 .4 .3 KeyMarketCompositionbyClientSector . . . . . . . . . . . . . . . . . . . . . . . . . . . . . . . . . . . . . . . . . 22
4 Main trends in Management Consulting in 2009/2010 . . . . . . . . . . . . . . . . . . . . . . . . . . . . . . . . . . . 23 4 .1BosniaandHerzegovina . . . . . . . . . . . . . . . . . . . . . . . . . . . . . . . . . . . . . . . . . . . . . . . . . . . . . . . . . . . . . . . 23 4 .2Croatia . . . . . . . . . . . . . . . . . . . . . . . . . . . . . . . . . . . . . . . . . . . . . . . . . . . . . . . . . . . . . . . . . . . . . . . . . . . . . . . . 24 4 .3Denmark . . . . . . . . . . . . . . . . . . . . . . . . . . . . . . . . . . . . . . . . . . . . . . . . . . . . . . . . . . . . . . . . . . . . . . . . . . . . . . 25 4 .4Finland . . . . . . . . . . . . . . . . . . . . . . . . . . . . . . . . . . . . . . . . . . . . . . . . . . . . . . . . . . . . . . . . . . . . . . . . . . . . . . . 26 4 .5France . . . . . . . . . . . . . . . . . . . . . . . . . . . . . . . . . . . . . . . . . . . . . . . . . . . . . . . . . . . . . . . . . . . . . . . . . . . . . . . . 27 4 .6Germany . . . . . . . . . . . . . . . . . . . . . . . . . . . . . . . . . . . . . . . . . . . . . . . . . . . . . . . . . . . . . . . . . . . . . . . . . . . . . . 27 4 .7Greece . . . . . . . . . . . . . . . . . . . . . . . . . . . . . . . . . . . . . . . . . . . . . . . . . . . . . . . . . . . . . . . . . . . . . . . . . . . . . . . . 28 4 .8Hungary . . . . . . . . . . . . . . . . . . . . . . . . . . . . . . . . . . . . . . . . . . . . . . . . . . . . . . . . . . . . . . . . . . . . . . . . . . . . . . 28 4 .9Ireland . . . . . . . . . . . . . . . . . . . . . . . . . . . . . . . . . . . . . . . . . . . . . . . . . . . . . . . . . . . . . . . . . . . . . . . . . . . . . . . . 29 4 .10Portugal . . . . . . . . . . . . . . . . . . . . . . . . . . . . . . . . . . . . . . . . . . . . . . . . . . . . . . . . . . . . . . . . . . . . . . . . . . . . . 30 4 .11Romania . . . . . . . . . . . . . . . . . . . . . . . . . . . . . . . . . . . . . . . . . . . . . . . . . . . . . . . . . . . . . . . . . . . . . . . . . . . . . 31 4 .12Slovenia . . . . . . . . . . . . . . . . . . . . . . . . . . . . . . . . . . . . . . . . . . . . . . . . . . . . . . . . . . . . . . . . . . . . . . . . . . . . . 32 4 .13Spain . . . . . . . . . . . . . . . . . . . . . . . . . . . . . . . . . . . . . . . . . . . . . . . . . . . . . . . . . . . . . . . . . . . . . . . . . . . . . . . . 33 4 .14Switzerland . . . . . . . . . . . . . . . . . . . . . . . . . . . . . . . . . . . . . . . . . . . . . . . . . . . . . . . . . . . . . . . . . . . . . . . . . . 34 4 .15UnitedKingdom . . . . . . . . . . . . . . . . . . . . . . . . . . . . . . . . . . . . . . . . . . . . . . . . . . . . . . . . . . . . . . . . . . . . . 34
5 About FEACO, The European Federation of Management Consultancies Associations . . . . . . . 35
6 Member Associations . . . . . . . . . . . . . . . . . . . . . . . . . . . . . . . . . . . . . . . . . . . . . . . . . . . . . . . . . . . . . . . . . 36
7 Appendix – Definitions . . . . . . . . . . . . . . . . . . . . . . . . . . . . . . . . . . . . . . . . . . . . . . . . . . . . . . . . . . . . . . . . 37

5
Introduction by the feaCo ChaIrman
I am pleased to introduce the 2009/2010 edition of the Feaco Survey of the European Management Consultancy Market.
The financial crisis and economic recession continued in the developed world throughout 2009. This severe recession has had a major impact on large and small companies and organizations all over Europe. Demand in most industries has decreased as well as the value of assets. It has changed the economic and business model for both product and service industries. It has also had a detrimental influence on the revenue, expenditures and investments of public administrations at the European, national, regional and local levels.
The general perception is that economic recovery will be a long and difficult process. Within this economic perspective, Management Consultancy in Europe has also been influenced and had a negative growth of 5% in 2009. This decrease comes after several years of growth in most European countries. In addition to volume decrease it has had an influence on prices. Management Consultancy companies have been prompt to adjust to client needs, have redefined their services and have restructured their organizations to align them to the new market realities.
Transforming the business models of consultancy has been necessary in most service areas. In addition to the economic recession, client demands, the need of multidisciplinary knowhow, the pressure on costs and the advances in technology, amongst others, have altered the client service approach. Projects and demand for integrated services have become global. Consultancy companies have adapted their delivery. The mix of on site, near-
shore and offshore teams have changed in order to offer competitive, truly global and borderless services to clients.
Feaco as an organization has also had challenges and adapted to the new economic reality. Feaco offers members a unique platform for networking and exchange. It has a major role in representing management consultancy interest in Europe. During the last year, Feaco has restructured, tailored its services and worked closely with National Associations achieving practical results.
The world and certainly Europe faces major challenges. Many industries are going through profound changes and are being redefined. We are clearly in a new cycle where companies and organizations need to be innovative to survive and be successful in the new multi-polar interconnected global economy. A new vision and different business models are necessary. More than ever before, these challenges are bringing many new opportunities for consultancy. Consultancy companies have to be at the forefront of these innovations, continuously adapting and offering client organizations distinctive services to become more competitive. As a famous Nobel Prize winner said, “we can’t solve problems by using the same kind of thinking we used when we created them”.
Gil GidronFeaco Chairman

6
executive Summary Key figures, 2007–2010
The results of the 2009-2010 FEACO survey, con-ducted in cooperation with the national European management consulting associations, show that last year’s forecast about the size of the consulting market proved to be right, i.e. a slight decline in revenues was experienced. The 2009 data show that the size of the consulting market decreased by 5%. This setback is expected to be limited to the year 2009 with an estimated growth rate for 2010
standing at 1.6%. The distribution of revenues betwe en the key service lines of management con-sulting is presented in Table 1. The already signifi-cant representation of Business Consulting among the consulting services has further strengthened. Outsourcing increased as well, while IT Consulting and Other Services stayed unchanged. These changes took place at the expense of Development & Integration, which decreased by 3%.
The aggregated data from the European consul-ting industry in 2007-2009 by country and by re-gion is presented in Table 2. According to this, significant changes cannot be seen compared to the previous years. Germany remains the largest
consulting market in Europe, followed by the United Kingdom, Spain and France. Regarding the share of regions, Western Europe is in first place followed by the Nordic Region, and Central & Eastern Europe.
2007 2008 2009 2010 est.
Market size €81 bn €86.7 bn €83.7 bn1 €85 bn
Growth rate 9.5% 8.2% -5.0% 1.6%
Total staff (thousand) 583 557 576 n.a.Breakdown of Key Services
Business Consulting 42% 42% 43% n.a.
IT Consulting 15% 14% 14% n.a.
Dvt& Integration 20% 21% 18% n.a.
Outsourcing 20% 17% 19% n.a.
Other services 3% 6% 6% n.a.
2007 2008 2009
Total turnover in billion €
Business & IT Consulting in
billion €
Total turnover in billion €
Business & IT Consulting in
billion €
Total turnover in billion €
Business & IT Consulting in
billion €
Germany 24.1 16.4 26.5 18.2 25.8 17.7
United Kingdom 19 11.1 20.2 10.3 18.8 9.5
Spain 8.5 1.7 9.5 1.8 9.6 1.8
France 7.8 4.9 8.3 5.3 7.7 6
Western Europe 11.6 6.9 12.2 8.8 12.5 7
Nordic Region 7.6 4.5 7.9 5.7 7.2 4.3
Central & Eastern Europe
2.15 1.3 2.4 1.7 2.1 1.6
WesternEurope: Austria,Belgium,Ireland,Italy,Netherlands,Portugal,SwitzerlandCentral&EasternEurope: BosniaandHerzegovina,Bulgaria,Croatia,Cyprus,CzechRepublic,Greece,Hungary,Poland,Romania,SloveniaNordicRegion: Denmark,Finland,Norway,Sweden
Table 1. Key Figures 2007-2010
Table 2. Key Figures in Selected Countries and Regions
Executive Summary Key Figures, 2007–2010

7
1 Scope of the market and methodology
The objective of FEACO is to present objectively and as accurately as possible a picture of the activity in Europe in the Management Consulting sector, aiming for the maximum level of reliability in the aggregation of the figures which represent the different services which companies in the Management Consulting market offer.
The results are reflected by the aggregated data presented in this report which are a result of the effort of all the companies, large and small, which participated in it and continue to contribute to build a prosperous, competitive and exciting European Management Consultancy Market. FEACO member companies provide a broad spectrum of management consulting services. Depending on the market, these may be at different levels of maturity. The array of services management consultancies offer is very dynamic; it is continuously evolving and changing. Defining the framework of activity of our sector is therefore not an easy task, mainly because it concerns a basket of services which in certain cases are very different.
From that perspective and with the objective of improving our report, FEACO proposed in 2005 a new definition of the scope of services offered by management consultancies in Europe and a new way of segmenting these services.
This exercise resulted in the following division of the main services:
Consulting, which we divide into Business Consulting and IT Consulting,
Development and Systems Integration (excluding software development),
Outsourcing of value added services, Other services.
These segments are described in detail in the subsection “Analysis by Service Line”.
This new framework implied a change in methodology for the collection and aggregation of the quantitative and qualitative data, which are provided by the companies.
The methodology consists basically of the collection by our member associations of the data on the sector via the aggregation of the figures from the individual consulting companies. In 2007, FEACO decided to distinguish between associations with an in depth knowledge of their
domestic market – for instance, because they publish their own, often very detailed annual market report and associations from countries whose markets are less known.
As a result, quantitative data were collected on two levels:
Key countries were asked to provide: Volume of turnover for the year 2009 Data on staffing Business volume per service area Business volume per major client sector Daily fee rates for 2009 General forecasts for 2010
Other countries were asked to provide: Volume of turnover for the year 2009 Data on staffing General forecasts for 2010
In parallel, qualitative data were solicited in a separate questionnaire on companies’ views on the development and the future of the sector in selected areas of activity, the results of which are summarised in the chapter on trends in the sector. It should be noted that the management consulting sector is a dynamic sector. Every year new consulting companies appear, others merge (which give rise to spin-offs) or reorganize themselves. Because the data are provided on a voluntary basis, the sample of companies surveyed in each European country varies from year to year. The latest edition of the survey allows us to redefine retroactively some of the data obtained in previous years.
This year 15 countries contributed with their effort to the final FEACO market survey 2009/2010. Nine full members (Finland, France, Greece, Hungary, Portugal, Romania, Slovenia, Spain and Switzerland) responded to the questionnaire as well as the Associate Members (Bosnia and Herzegovina, Croatia). Denmark, Ireland, Germany and the United Kingdom participated in the survey also. The FEACO Report 2009/2010 is considered to be representative, because the countries delivering data cover over 80% of the total European Management Consulting Market. Data were evaluated on a statistical basis, using data and variance analysis to prove the reliability of the results. The estimated data were calculated on the basis of the median results of the various indicators.
1 Scope of the Market and Methodology

8
2 europe – market Size, forecast & analysis
After several years of incremental growth, the industry experienced a slight decline in 2009. The rate of the decrease is not as extreme as in the case of several other industries. It is also
significant that the forecast for the growth rate of the European MC Market in 2010 is once again positive standing at 1.6%.
In Figure 2. a similar trend can be discerned about the evolution of the MC Market Turnover in percentage. Until 2004, the MC Market Turnover could be described as showing a slow but stable growth. In 2005 revenue significantly increased starting a robust growth trend. This lasted until 2008, when the increase reached
519% compared to the data of the 1996 base year. In spite of the moderate setback in 2009, the member countries are forecasting an increasing turnover rate for 2010. The more significant growth in MC turnovers might be the result of the redefinition of the different sectors of MC introduced by Feaco in 2005.
2 Europe – Market Size, Forecast & Analysis
Figure 2. Evolution of the MC Market
Turnover in %, 1998-2010
Figure 1.Size of the European MC Market,
1998-2010
24.5
36.0
42.5
47.5 46.5 47.5 48.5
64.5
74.0
81.086.7
83.7
-10
0
10
20
30
40
50
60
70
80
90
1998 1999 2000 2001 2002 2003 2004 2005 2006 2007 2008 2009 2010(est.)
Volu
me
of th
e M
C M
arke
t (bi
llion
€)
85
Growth rate (%)
15.0 15.918.0
11.5
– 2.0
3.5 3.7
14.010.7 9.5
8.2
–5.0–1.6
0
100
200
300
400
500
600
1998 1999 2000 2001 2002 2003 2004 2005 2006 2007 2008 2009 2010(est.)
MC
Mar
ket (
1996
= b
ase
100)
Year
217256
286 280 286 292
389446
489519 502 509
149
2.1 HistoryandProjections
2.1.1 SizeoftheEuropeanmcmarket,1998-2010
2.1.2 EvolutionofthemcmarketTurnoverin%,1998-2010

9
Figure 3. shows the changes in the MC Market as a percentage of European GDP (Source: Eurostat, 2010). The 0.03 percent increase from
2008 to 2009 is slightly higher than it was in the previous years. According to estimates for 2010, this increase will continue.
The slight decline which was pointed out concerning the growth rate of the industry affected primarily the large and medium sized MC-firms, both of which declined by 6
percent. The small MC firms that registered a more moderate increase in turnover during the previous years (except 2007) experienced a decrease of only -2%.
2 Europe – Market Size, Forecast & Analysis
Figure 3. MC Market as % of GDP, 1998-2010
Figure 4. Average Growth Rate by Size of Consultancy Company, 2004-2009
0.24
0.36
0.53
0.58 0.55 0.56 0.550.61
0.63 0.64 0.650.68
0.70
0.0
0.1
0.2
0.3
0.4
0.5
0.6
0.8
0.7
1998 1999 2000 2001 2002 2003 2004 2005 2006 2007 2008 2009 2010(est.)
% G
DP
Year
0%
-5%
-10%
5%
10%
15%
20%
25%
2004 2005 2006 2007 2008
Year
Large sized MC-�rms (TOP 20 MC-�rms)
Medium sized MC-�rms (≥ €500.000 turnover)
Small sized MC-�rms (< €500.000 turnover)
4%
17%
9%
5% 6%4%
10%
15%
20%
11%
2%
8%
4%
10%
4%
-6% -6% -2%
2009
2.1.3 mcmarketas%ofGDP,1998-2010
2.1.4 AverageGrowthRatebySizeofconsultancycompany,2004-2009
10
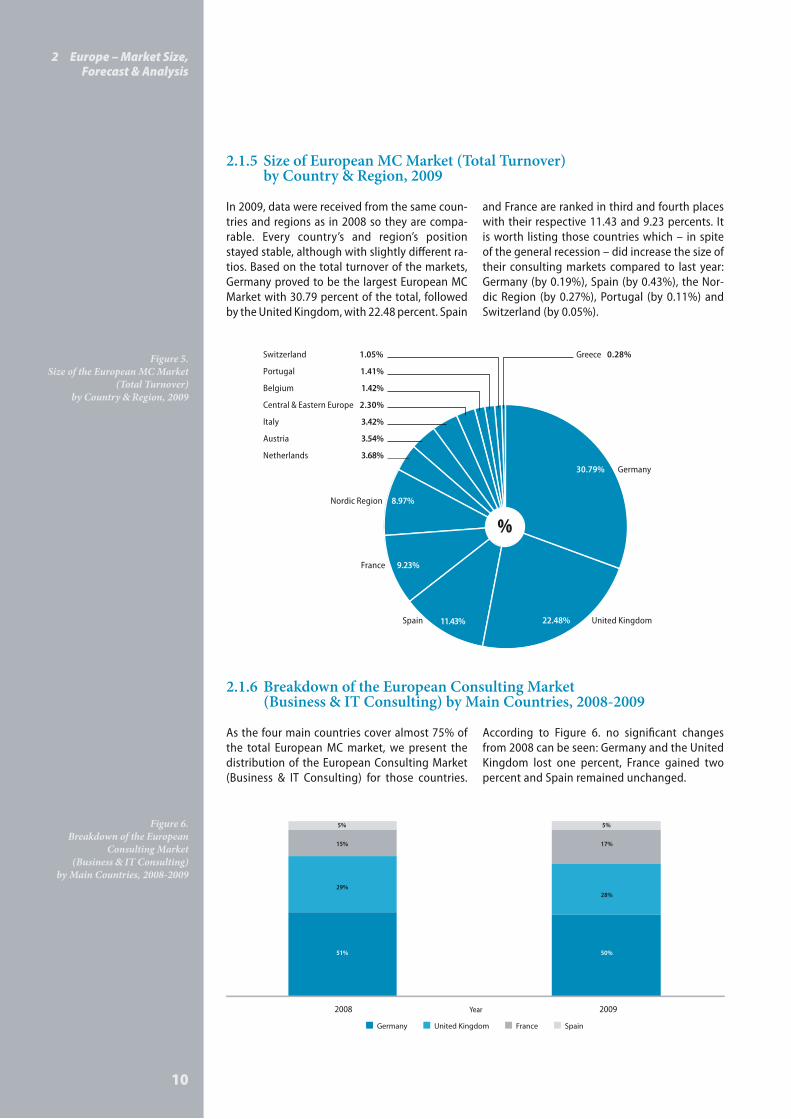
In 2009, data were received from the same coun-tries and regions as in 2008 so they are compa-rable. Every country’s and region’s position stayed stable, although with slightly different ra-tios. Based on the total turnover of the markets, Germany proved to be the largest European MC Market with 30.79 percent of the total, followed by the United Kingdom, with 22.48 percent. Spain
and France are ranked in third and fourth places with their respective 11.43 and 9.23 percents. It is worth listing those countries which – in spite of the general recession – did increase the size of their consulting markets compared to last year: Germany (by 0.19%), Spain (by 0.43%), the Nor-dic Region (by 0.27%), Portugal (by 0.11%) and Switzerland (by 0.05%).
As the four main countries cover almost 75% of the total European MC market, we present the distribution of the European Consulting Market (Business & IT Consulting) for those countries.
According to Figure 6. no significant changes from 2008 can be seen: Germany and the United Kingdom lost one percent, France gained two percent and Spain remained unchanged.
2 Europe – Market Size, Forecast & Analysis
Figure 5. Size of the European MC Market
(Total Turnover) by Country & Region, 2009
Figure 6.Breakdown of the European
Consulting Market (Business & IT Consulting)
by Main Countries, 2008-2009
%
30.79% Germany
22.48% United KingdomSpain 11.43%
France 9.23%
Nordic Region 8.97%
Netherlands
Austria
Switzerland 1.05%
Portugal 1.41%
Belgium
Italy
1.42%
3.42%
3.54%
3.68%
Greece 0.28%
Central & Eastern Europe 2.30%
29%
15%
5%
51%
28%
17%
5%
50%
Germany United Kingdom France Spain
Year2008 2009
2.1.6 BreakdownoftheEuropeanconsultingmarket(Business&ITconsulting)bymaincountries,2008-2009
2.1.5 SizeofEuropeanmcmarket(TotalTurnover)bycountry&Region,2009

11
2.2 AnalysisbyServiceLine
According to the new segmentation introduced by Feaco in 2005, the MC market is divided into four segments: Consulting, Development and In-tegration, Outsourcing and Other Services. The Consulting segment is subsequently divided into two sub-segments: Business Consulting (BC) and Information Technology Consulting (ITC).
1. Consulting: these services help private and public organisations to analyse and redefine their strategies, to improve the efficiency of their busi-ness operations and to optimize their technical and human resources.
1a. Business Consulting (BC), which includes: Strategy Consulting (SC), which targets the im-provement of the long-term strategic health of a company: strategic planning development; merg-ers & acquisitions; sales; marketing; corporate communication; financial advisory; HR strategy;
Organisation/Operations Management (OM), which aims at the integration of business solu-tions through Business Process Re-engineering (BPR); customer/supplier relations manage-ment (CRM); turnaround/cost reduction and purchasing & supply management as well as advise on outsourcing;
Project Management (PM): the application of knowledge, skills, tools and techniques to a broad range of activities in order to meet the requirements of a particular project;
Change Management (CM): this consists of services which, on top of any other type of con-sulting service, help an organisation deal with the effects that change has on the human ele-ment of the organisation;
Human Resources Consulting (HR): consulting services which target the improvement of the ‘people’ element of an organisation through performance measurement and management, reorganisation of benefits, compensations and retirement schemes, HR strategy and market-ing, the development of talent strategies and executive coaching.
1b. Information Technology Consulting (ITC) helps organisations to evaluate their IT strategies with the objective of aligning technology with the business process. These services include strategic planning and conceptions, operations and imple-mentations.
2. Development and Integration concerns:
the development of applications (excluding software);
the creation of new functionalities through, of-ten tailored, process developments.
Usually these developments integrate or unite internal or external business processes and can involve a conversion of applications so that they can be used for different platforms or con-ceptions,
the design of services which integrate applica-tions which were created in different existing IT applications or infrastructures (systems inte-gration -development);
the deployment and integration of applica-tions;
the implementation of new applications or infrastructures, which may concern the in-stallation of hardware and/or software, their configuration or adaptation and the testing of their interoperability; and of services which integrate applications which were created in different existing IT applications or infrastruc-tures and the management thereof (Systems integration).
3. Outsourcing, which consists of three types of activities:
IT management services; among these are ser-vices for the operation of infrastructures (ope-ration of systems, administration and security, follow up of cost-effectiveness, configuration management, management of technology, etc.) applications management, and help desk management.
Applied Management Services (AMS); this con-cerns the outsourcing of the development and implementation of support services for hard-ware, applications, CRM and infrastructures (tools for the development of applications and middleware, as well as software for infor-mation management, storage or systems and networks).
Business Process Outsourcing (BPO); this serv-ice supposes the externalisation of a complete business process.
4. Other Services, which consist of a variety of services provided by many MC companies often complementary to Consulting, Development and Integration and Outsourcing services, such as: Training, Engineering consulting, Studies, Out-placement, Executive selection and recruitment and Audit and Accounting.
2 Europe – Market Size, Forecast & Analysis

12
Business Consulting is the most robust service line, compared to 2008, gaining 1% in 2009, to make up 43% of the MC Market. Outsourcing with
19% of the MC market overtook Development & Integration which stands at 18%. IT Consulting and Other Services maintained their shares of 14% and 6%.
While there was an unexpected decline in Organization/Operations Management turnover from 2007 to 2008, this line of Business Consulting has begun to rise again. In 2009 the share of Strategy and Project Management both fell by 3%
and it was Organization/Operations Management, HR Consulting and Change Management which increased their shares within Business Consulting by 4%, 2% and 1% respectively.
2 Europe – Market Size, Forecast & Analysis
43% Business Consulting
14%
IT Consulting
Development & Integration
18%
Outsourcing
19%
Other Services
6%
%
Figure 7.Breakdown of Turnover
by Service Line, 2009
Figure 8.Breakdown of Business Consulting
Turnover, 2006-2009
2009
37%
18%
11%
11%
24%
Strategy Organisation/Operations Management Project Management Change Management HR Consulting
Year
2006 2007 2008
36%
13%
5%
15%
31%
43%
12%
4%
11%
30%
33%
21%
10%
9%
27%
2.2.1 compositionofmcmarketbyServiceLine,2009
2.2.2 BreakdownofBusinessconsultingTurnover,2006-2009

13
A quite interesting trend can be observed in the breakdown of turnover of the services within the category of Other Services. In 2007, Executive Se-lection/Recruitment/Outplacement stood at 68% of the total turnover of Other Services, in 2008 it was reduced to 59% and in 2009 it did not ex-ceed 50% of the total (49%). The trend for Audit
is quite different. In 2008 the percentage of Audit activities was 14%, while in 2009 Audit increased to 19%, but Training shows a similar tendency to Executive Selection/Recruitment/Outplacement as it decreased to 7%. Market Surveys increased by 2% and Engineering decreased by 7% compared to 2008.
Figure 9. shows that the breakdown of consulting turnover remained unchanged in 2009 compared
to 2008. Business Consulting covers 75% of con-sulting turnover and IT Consulting retained its 25%.
2 Europe – Market Size, Forecast & Analysis
49%
Audit19%
Engineering 2% % Executive Selection/Recruitment/Outplacement
Other17%
Market Surveys 6%
Training 7%
IT Consulting
% 75% Business Consulting
25%
Figure 9. Breakdown of Consulting Turnover, 2009
Figure 10. Breakdown of Turnover from Other Services, 2009
2.2.3BreakdownofconsultingTurnover,2009
2.2.4 BreakdownofTurnoverfromOtherServices,2009

14
Banking & Insurance
Industry
Wholesale & Retail 4.3%
3.8%
9%
Public Sector
Telecoms & Media 9.6%
Energy & Utilities %
18.7%
21.8%
20.2%
Aerospace & DefenseHealthcare (pharmaceuticals & biotech included)
Other 5.5%
Transport & Travel
2.3%
4.8%
2 Europe – Market Size, Forecast & Analysis
Figure 11.Composition of the MC Market
by Client Sector, 2009
While in 2008 the first three Client Sectors based on their demand for Management Consulting were clearly differentiated, in 2009 the demand from the top three sectors was almost equally
distributed: Banking & Insurance had 21.8%, the Public S ector 20.2% and the demand coming from Industry accounted for 18.7%. All of the other sectors remained below 10%.
2.3 AnalysisbyclientSector2.3.1 compositionofmcmarketbyclientSector,2009

15
3 Selected European MC Markets 3 Selected european mC markets
Regarding the size of European MC Market, the aver-age growth rate was -5% in 2009. Figure 12. presents the change in the size of MC Markets in 14 European countries. The two extremes are Bosnia and Herze-govina with a -32.6% decline and Croatia with its 4.5% growth. From the 14 European countries, 10 experienced negative growth while only 4 countries reported a slight increase. These 4 countries are:
Croatia (4.5%), Slovenia (1.5 %), Portugal (1.4%) and Finland (0.5%). Countries which experienced slight decline are Ireland (-2%), Germany (-2.7%), Den-mark (-3.6%) and Switzerland (-4%); countries with a moderate decline are the United Kingdom (-6%), France (-7%) and Greece (-9.2%) and countries with a significant decline are Romania (-16%), Hungary (-22.2%) and Bosnia & Herzegovina (-32.6%).
Regarding the forecasts made in 2008, several countries estimated their 2009 results quite accurately. Some were overly optimistic and two were overly pessimistic. The countries that provided quite accurate estimations for 2009, were France, Slovenia, Switzerland and the United Kingdom; countries that underestimated the recession were Germany, Greece, Portugal and Hungary while Finland and
Romania had better results than anticipated. For 2010, each country made their forecasts, which can be seen in Figure 13. According to this table, it appears that only five countries expect the downward trend to continue but three out of them more moderately than in 2009. Hungary expects the most severe decline, -20%. Six countries forecast growth for 2010 with Romania predicting a 20% positive growth.
-35% -32.6%
-22.2%
-16%
-9.2%-7% -6% -4% -3.6%
-2.7% -2%
0.5% 1.4% 1.5%
4.5%
-30%
-25%
-20%
-15%
-10%
-5%
0%
5%
10%
BH HU RO GR FR UK CH DK DE IE FL PT SI HR
-25%
-20%
-15%
-10%
-5%
0%
5%
10%
15%
20%
25%
-20%
-12%
-5% -4% -4%
3% 4% 6% 6% 7%
20%
HU BH GR UK IE FR CH DE FL HR RO
Figure 12. Growth Rates – Breakdown by Country, 2009
Figure 13. Growth Rates Estimations – Breakdown by Country, 2010
3.1 Analysisbycountry
3.1.1 GrowthRates–BreakdownbycountryRegion,2009

16
In Figure 14., the contribution of the MC sector relative to the listed countries’ GDP can be seen. In 2009 five countries presented a percentage of MC to GDP equal to or exceeding 1% - the
United Kingdom, Sweden, Germany, Austria and Denmark; 17 countries had a ratio of MC to GDP between 0.2% and 1% and three countries below 0.2%.
Table 3. assesses the main economic charac-teristics of the selected European MC markets, listing the GDP data and growth and some ratios
of MC market firms relative to the GDP. There is no significant relation found between GDP growth and MC growth; it varies widely from country to country.
Figure 14.Management Consulting as a
Percentage of GDP, 2009
Table 3. MC Turnover and GDP in
Selected European Markets, 2009
0.0%
0.2%
0.4%
0.6%
0.8%
1.0%
1.2%
PL GR IT IE CH NO HR HU BG CY RO CZ BE FR BH NL FL PT SI ES DK AT DE SE UK
Perc
enta
ge
Country
0.1% 0.1%
0.19% 0.2%0.25% 0.25% 0.25% 0.26% 0.27% 0.3%0.3%
0.34% 0.35%0.41% 0.41%
0.54%
0.65%0.7%
0.77%
0.91%1.0%
1.07%1.07%1.11%
1.2%
Country GDP (million €) Share of total economy of countries considered
GDP growth 2009
MC growth 2009
Total turnover of MC firms 2009
Total turnover of MC firms as %
of GDP
Germany 2 409 100 19.5% -4.9% -2.7% 25780 1.07%
France 1 907 145 15.5% -2.6% -7.0% 7728 0.41%
United Kingdom 1 566 741 12.7% -4.9% -6.0% 18821 1.20%
Italy 1 520 870 12.3% -5.0% n.a. 2866 0.19%
Spain 1 051 151 8.5% -3.6% n.a. 9572 0.91%
Netherlands 570 208 4.6% -4.0% n.a. 3080 0.54%
Poland 310 075 2.5% 1.7% n.a. 310 0.10%
Belgium 337 284 2.7% -3.0% n.a. 1190 0.35%
Switzerland 354 681 2.9% -1.6% -4.0% 875 0.25%
Sweden 292 680 2.4% -5.1% n.a. 3250 1.11%
Norway 275 060 2.2% -1.6% n.a. 690 0.25%
Austria 277 074 2.2% -3.5% n.a. 2960 1.07%
Greece 237 494 1.9% -2.0% -9.2% 234.2 0.10%
Denmark 222 893 1.8% -4.9% -3.6% 2107 0.95%
Finland 170 971 1.4% -7.8% 0.5% 1103.2 0.65%
Portugal 167 633 1.4% -2.6% 1.4% 1179 0.70%
Ireland 163 543 1.3% -7.1% -2.0% 363.1 0.22%
Czech Republic 137 245 1.1% -4.1% n.a. 460 0.34%
Romania 115 869 0.9% -7.1% -16.0% 350 0.30%
Hungary 93 086 0.8% -6.3% -22.2% 245 0.26%
Croatia 45 377 0.4% -5.8% 4.5% 114.5 0.25%
Slovenia 34 894 0.3% -7.8% 1.5% 268.5 0.77%
Bulgaria 33 877 0.3% -5.0% n.a. 90 0.27%
Cyprus 16 947 0.1% -1.7% n.a. 50 0.30%
Bosnia & Herzegovina 11 000 0.1% -3.4% -32.6% 45 0.41%
Total of selected countries 12 322 896 100% 83 732
* Figures edited in italic represent estimated data. Source of estimations: applying the trend gained from previous years’ Feaco Reports’ data.
3 Selected European MC Markets
3.1.2 managementconsultingasaPercentageofGDP,2009
3.1.3 mcTurnoverandGDPinSelectedEuropeanmarkets,2009

17
The average distribution of Consultants to Support Staff within Total Staff is 82% to 18%. The extremes are Hungary at one end of the spectrum with a con-
sultant / support staff ratio of 91% to 9% and Fin-land at the other end of the spectrum with a 54% / 46% consultant / support staff ratio.
The country rankings have remained almost the same since 2005, when Germany achieved the first position overtaking the United Kingdom.
In 2009, the median turnover per employee for the listed countries equals €128 850 in comparison to 2008, when it stood at €119 291. The mean was €123 255 compared to a mean of €124 549 in 2008.
The lowest turnover level per employee was real-ized in Romania at €29 167, down from €46 000 in 2008 and the highest level was generated in the United Kingdom at €290 820 due to the significant decrease in the number of consultants in 2009.
The countries are grouped in turnover per employee categories as follows:
Five countries (Czech Republic, Romania, Poland, Hungary, Bosnia and Herzegovina) which togeth-er account for 1.68% of the European MC market in 2009 had a turnover per employee less than €60 000. Previously in 2008 there were only 4 countries in this category, but Hungary’s fees per employee were reduced from 2008.
In 2009 a turnover per employee between €60 000 and €150 000 was realized in 12 countries, repre-senting 49.95% of the European MC market: Ger-many, Spain, Austria, Belgium, Portugal, Finland, Ireland, Slovenia, Greece, Croatia, Bulgaria, and Cyprus (data for Austria, Belgium and Bulgaria are estimated). In 2008 eleven countries belonged to this group including Denmark and Hungary but excluding Austria and Belgium, and in 2009 a new country, Ireland provided data for this part of sur-vey as well, so this year the data from 25 countries were processed instead of the 24 in 2008.
In 2009, the turnover per employee rate exceeded €150 000 in 8 countries (covering 48.18% of the European MC market in 2009) – United Kingdom, France, Sweden, Netherlands, Italy, Denmark, Swit-zerland, Norway. (The United Kingdom, Denmark, and Switzerland participated in the Feaco Survey 2009/2010, the others in the respective list are es-timated data). In 2008, nine countries belonged to this category, including Austria and Belgium but excluding Denmark.
Germany UK France Portugal Romania Denmark Finland
Consultants 72% 87% 90% 60% 83% 87% 54%Support Staff 28% 13% 10% 40% 17% 13% 46%Total staff 178 000 64 717 48 901 17 142 12 000 10 733 10 710
Hungary Switzerland Slovenia Ireland Greece BIH Croatia
Consultants 91% 83% 87% 89% 88% 83% 89%Support Staff 9% 17% 13% 11% 12% 17% 11%Total staff 4 700 3 960 3 090 2 505 1 880 1 200 885
Table 4.Breakdown between Management Consultants and Support Staff, 2009
3 Selected European MC Markets
3.1.4 BreakdownbetweenmanagementconsultantsandSupportStaff,2009
3.1.5 KeyFiguresofSelectedEuropeanmcmarkets

18
Daily fee rates are the data which are the most diffi-cult to obtain every year. In 2008 only four coun-
Daily rates of Management Consulting
Croatia €400
Hungary €400
Greece €450
Switzerland €1 200
France €1 426
Germany €1 600
tries (Greece, Finland, France and Germany) could provide this data. In 2009 this number increased to six; Croatia, Hungary, Greece, Switzerland, France and Germany. The first three are Central and Eastern European (CEE) countries while the last three are part of Western Europe (WE). The mean of the three CEE countries is €416, while the mean of the three WE countries is €1 408. From this small sample it is clear that the daily fees in Western Europe are sig-nificantly higher than in Central and Eastern Europe.
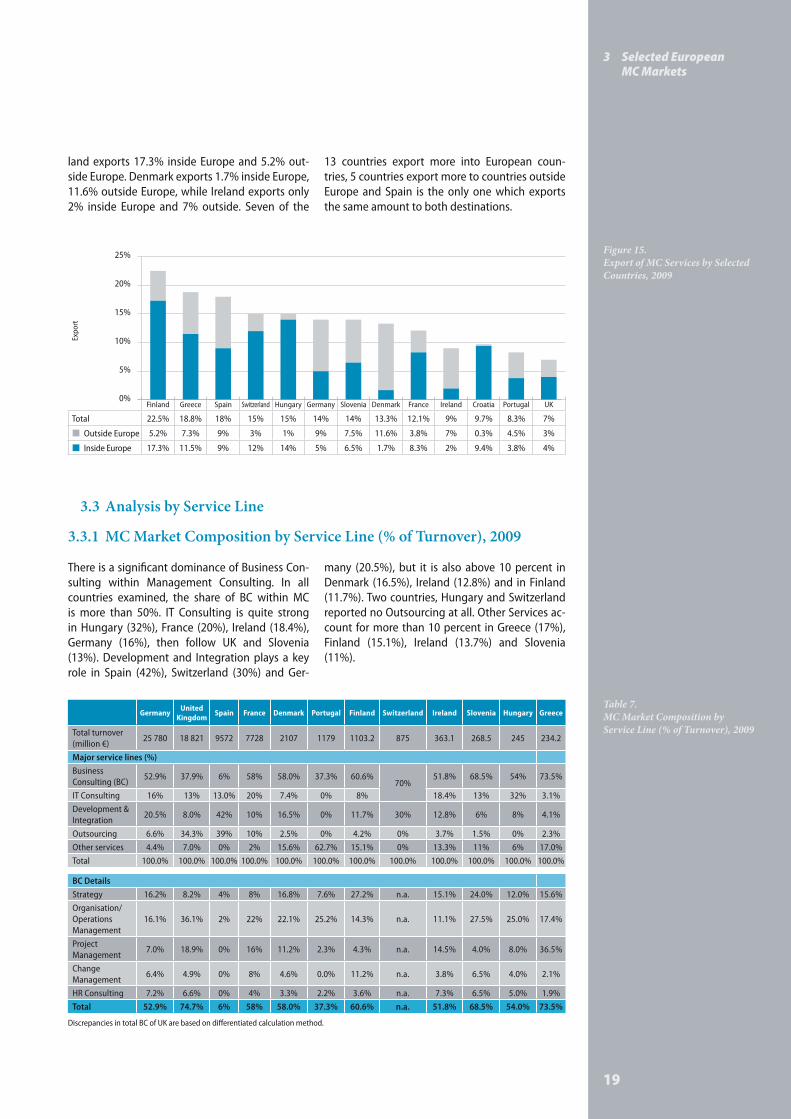
In the 13 countries for which we have data, the av-erage percentage of exports is 13.6% of total turn-over. Finland is the largest exporter of MC services with 22.5% of its turnover sold abroad and the UK is the smallest exporter with MC services sold outside the UK standing at only 7%. If we look at
export activity by destination as shown in Figure 15. we see that Croatia, Hungary, the United King-dom, France, Switzerland and Portugal export less than 5% to countries outside Europe while Den-mark exports 11.6% of its MC services to countries outside Europe and only 1.7% inside Europe. Fin-
3 Selected European MC Markets
Table 6.Average Daily Fee Rates of Selected
European MC Markets, 2009
3.2 AnalysisbyDailyRates3.2.1 AverageDailyFeeRatesofSelectedEuropeanmcmarkets,2009
3.2.2 ExportofmcServicesbySelectedcountries,2009
CountryTotal turnover
of MC firms 2009 (million €)
Share of MC market in Europe 2009
Total turnover of MC firms 2008
(million €)
Share of MC market in
Europe 2008Total staff Turnover per
employee (€)
Germany 25 780 30.79% 26 500 30.55% 178 000 144 831
United Kingdom 18 821 22.48% 20 023 23.09% 64 717 290 820
Spain 9 572 11.43% 9 504 10.96% 113 000 84 708
France 7 728 9.23% 8 309 9.58% 48 901 158 034
Sweden 3250 3.88% 3 382 3.90% 16 600 195 783
Netherlands 3080 3.68% 3 205 3.70% 20 300 151 724
Austria 2960 3.54% 3 084 3.56% 19 800 149 495
Italy 2866 3.42% 2 967 3.42% 18 400 155 761
Denmark 2107 2.52% 2 322 2.68% 10 733 196 310
Belgium 1190 1.42% 1 245 1.44% 8 000 148 750
Portugal 1 179 1.41% 1 163 1.34% 17 142 68 778
Finland 1 103.2 1.32% 1 098 1.27% 10 710 103 007
Switzerland 875 1.05% 854 0.98% 3 960 220 960
Norway 690 0.82% 722 0.83% 3 800 181 579
Czech Republic 460 0.55% 475 0.55% 8 500 54 118
Ireland 363.1 0.43% 310 n.a. 2 818 128 850
Romania 350 0.42% 460 0.53% 12 000 29 167
Poland 310 0.37% 324 0.37% 5 500 56 364
Slovenia 268.5 0.32% 265 0.30% 3 090 86 893
Greece 234 0.28% 255 0.29% 1 880 124 574
Hungary 245 0.29% 315 0.36% 4 700 52 128
Croatia 114.5 0.14% 60 0.07% 885 129 379
Bulgaria 90 0.11% 97 0.11% 1 400 64 286
Cyprus 50 0.06% 52 0.06% 740 67 568
Bosnia & Herzegovina 45 0.05% 50 0.06% 1 200 37 500
Total of selected countries 83 732 100% 86 730 100% 576 776 123 255
* Figures edited in italic represent estimated data. Source of estimations: applying the trend gained from previous years’ Feaco Reports’ data.
Table 5.Key Figures of Selected European
MC Markets
19
There is a significant dominance of Business Con-sulting within Management Consulting. In all countries examined, the share of BC within MC is more than 50%. IT Consulting is quite strong in Hungary (32%), France (20%), Ireland (18.4%), Germany (16%), then follow UK and Slovenia (13%). Development and Integration plays a key role in Spain (42%), Switzerland (30%) and Ger-
many (20.5%), but it is also above 10 percent in Denmark (16.5%), Ireland (12.8%) and in Finland (11.7%). Two countries, Hungary and Switzerland reported no Outsourcing at all. Other Services ac-count for more than 10 percent in Greece (17%), Finland (15.1%), Ireland (13.7%) and Slovenia (11%).
land exports 17.3% inside Europe and 5.2% out-side Europe. Denmark exports 1.7% inside Europe, 11.6% outside Europe, while Ireland exports only 2% inside Europe and 7% outside. Seven of the
13 countries export more into European coun-tries, 5 countries export more to countries outside Europe and Spain is the only one which exports the same amount to both destinations.
3 Selected European MC Markets
0%
5%
10%
15%
20%
25%
Expo
rt
Finland Greece Spain Switzerland Hungary Germany Slovenia Denmark France Ireland Croatia Portugal UK
Total 22.5% 18.8% 18% 15% 15% 14% 14% 13.3% 12.1% 9% 9.7% 8.3% 7%
Outside Europe 5.2% 7.3% 9% 3% 1% 9% 7.5% 11.6% 3.8% 7% 0.3% 4.5% 3%
Inside Europe 17.3% 11.5% 9% 12% 14% 5% 6.5% 1.7% 8.3% 2% 9.4% 3.8% 4%
Germany United Kingdom Spain France Denmark Portugal Finland Switzerland Ireland Slovenia Hungary Greece
Total turnover (million €)
25 780 18 821 9572 7728 2107 1179 1103.2 875 363.1 268.5 245 234.2
Major service lines (%)Business Consulting (BC)
52.9% 37.9% 6% 58% 58.0% 37.3% 60.6%70%
51.8% 68.5% 54% 73.5%
IT Consulting 16% 13% 13.0% 20% 7.4% 0% 8% 18.4% 13% 32% 3.1%Development & Integration
20.5% 8.0% 42% 10% 16.5% 0% 11.7% 30% 12.8% 6% 8% 4.1%
Outsourcing 6.6% 34.3% 39% 10% 2.5% 0% 4.2% 0% 3.7% 1.5% 0% 2.3%Other services 4.4% 7.0% 0% 2% 15.6% 62.7% 15.1% 0% 13.3% 11% 6% 17.0%Total 100.0% 100.0% 100.0% 100.0% 100.0% 100.0% 100.0% 100.0% 100.0% 100.0% 100.0% 100.0%
BC DetailsStrategy 16.2% 8.2% 4% 8% 16.8% 7.6% 27.2% n.a. 15.1% 24.0% 12.0% 15.6%Organisation/Operations Management
16.1% 36.1% 2% 22% 22.1% 25.2% 14.3% n.a. 11.1% 27.5% 25.0% 17.4%
Project Management
7.0% 18.9% 0% 16% 11.2% 2.3% 4.3% n.a. 14.5% 4.0% 8.0% 36.5%
Change Management
6.4% 4.9% 0% 8% 4.6% 0.0% 11.2% n.a. 3.8% 6.5% 4.0% 2.1%
HR Consulting 7.2% 6.6% 0% 4% 3.3% 2.2% 3.6% n.a. 7.3% 6.5% 5.0% 1.9%Total 52.9% 74.7% 6% 58% 58.0% 37.3% 60.6% n.a. 51.8% 68.5% 54.0% 73.5%
Discrepancies in total BC of UK are based on differentiated calculation method.
Figure 15.Export of MC Services by Selected Countries, 2009
Table 7.MC Market Composition by Service Line (% of Turnover), 2009
3.3 AnalysisbyServiceLine3.3.1 mcmarketcompositionbyServiceLine(%ofTurnover),2009

20
The breakdown of MC turnover in the four key countries is presented in Figure 16. In the field of Business Consulting Germany dominates the market followed by the UK and France. Regarding Development and Integration Germany also prevailed but is followed by Spain. The turnover
of IT Consulting is the highest in Germany with the UK second highest. Outsourcing proved to be an important service line in the UK and in Spain. The turnover of Other Services decreased in 2009 compared to 2008 in all key countries except the UK.
3 Selected European MC Markets
Figure 16.Breakdown of MC in Selected Key
Countries (million €), 2009
0
5 000
10 000
15 000
20 000
25 000
30 000
Turn
over
mill
ion
euro
s
Germany United Kingdom Spain France
Business Consulting (BC) 13 638 7 132 574 4 482
Development & Integration 5 285 1 505 4 020 773
IT Consulting 4 022 2 415 1 244 1 546
Outsourcing 1 701 6 454 3 733 773
Other Services 1 134 1 315 0 155
3.3.3 BreakdownofmcinSelectedKeycountries(million€),2009
3.3.4 BreakdownofBusinessconsultinginSelectedKeycountries(million€),2009
A further breakdown of Business Consulting shows that the role of Strategy has strength-ened since last year as its turnover is the high-
est in two countries out of the four (in Germany and in Spain) while in 2008 Organization/Opera-tion Management dominated the BC Market in
3.3.2 mcmarketcompositionbyServiceLine(million€),2009
Germany United Kingdom Spain France Denmark Portugal Finland Switzerland Ireland Slovenia Hungary Greece
Total turnover (million €)
25 780 18 821 9572 7728 2107 1179 1103.2 875 363.1 268.5 245 234.2
Major service lines (%)Business Consulting (BC)
13 638 7 132 574 4 482 1 222 440 669613
188 184 132 172
IT Consulting 4 022 2 415 1 244 1 546 156 0 93 67 35 78 7Development & Integration
5 285 1 505 4 020 773 348 0 129 263 46 16 20 10
Outsourcing 1 701 6 454 3 733 773 53 0 46 0 13 4 0 5Other services 1 134 1 315 0 155 329 739 167 0 48 30 15 40Total 25 780 18 821 9 572 7 728 2 107 1 179 1 103.2 875 363.1 268.5 245 234.2
BC DetailsStrategy 4 176 783 383 618 354 90 300 n.a. 55 64 29 37Organisation/Operations Management
4 151 3 446 191 1 700 466 297 158 n.a. 40 74 61 41
Project Management
1 805 1 804 0 1 236 236 27 47 n.a. 53 11 20 85
Change Management
1 650 468 0 618 97 0 124 n.a. 14 17 10 5
HR Consulting 1 856 630 0 309 70 26 40 n.a. 26 17 12 4Total 13 638 7 132 574 4 482 1 222 440 669 613 188 184 132 172
Discrepancies in total BC of UK are based on differentiated calculation method.
Table 8.MC Market Composition by
Service Line (million €), 2009

21
Regarding the whole European MC Market, the three most significant client sectors were the Public Sector, Industry and Banking & Insurance.
These are the same as in 2008, however, their order has changed.
In 2009 the Public Sector was the dominant client sector in five countries, the United Kingdom, Denmark, Ireland, Hungary and Greece. Industry was the most important based on turnover in four countries, Germany, Finland, Slovenia and
Switzerland, although in Switzerland, Banking & Insurance had the same share as Industry. Banking & Insurance contributed to turnover to a significant degree also in Spain and in France.
3.4.1 mcmarketcompositionbyclientSector(%ofTurnover),2009
every key country. In the United Kingdom and in France Organization/Operations Management still has the highest turnover. HR Consulting in-creased its share in Germany exceeding Project Management. The turnover from Project Man-
agement is approximately the same in Ger-many as in the UK. In Spain only the main two service lines, Strategy and Organization/Opera-tions Management are reported.
3 Selected European MC Markets
Figure 17.Breakdown of Business Consulting in Selected Key Countries (million €), 2009
Table 9.MC Market Composition by Client Sector (% of Turnover), 2009
Germany United Kingdom Spain France Denmark Finland Switzerland Ireland Slovenia Hungary Greece
Total turnover (million €) 25 780 18 821 9572 7728 2107 1103.2 875 363.1 268.5 245 234.2
Industry 31.6% 5.3% 9% 17% 14.5% 42.1% 27.0% 10.8% 32.5% 10% 19.80%Banking & Insurance
23.8% 20.1% 23% 26% 2.4% 4.2% 27.0% 18.1% 12.5% 20% 7.30%
Public sector 10.2% 36.4% 14% 17% 43.7% 8.7% 8.0% 32.4% 14.5% 40% 41.50%Aerospace & Defense
0% 1.6% 10% 4% 0.0% 0% 0.0% 0.3% 0% 0% 0.00%
Telecoms & Media 8.3% 9.2% 16% 9% 0.0% 16.7% 7.0% 11.0% 10% 6% 6.20%Wholesale & Retail 4.2% 4.3% 3% 5% 3.8% 12.9% 4.0% 2.7% 7% 8% 5.80%Energy & Utilities 7.5% 9.4% 11% 12% 5.8% 5.5% 6.0% 6.5% 12% 8% 7.40%Transport & Travel 5.5% 2.8% 8% 4% 4.6% 1.2% 6.0% 4.7% 2% 2% 2.90%Healthcare (pharmaceuticals & biotech included)
3.7% 3.6% 3% 2% 10.4% 8.7% 13.0% 8.1% 7.5% 4% 2.70%
Other 5.2% 7.3% 3% 4% 14.8% 0% 2.0% 5.4% 2% 2% 6.40%Total 100% 100% 100% 100% 100% 100% 100% 100% 100% 100% 100%
3.4 AnalysisbyclientSector
Germany United Kingdom Spain France
Change Management 1 650 468 0 618
Project Management 1 805 1 804 0 1 236
HR Consulting 1 856 630 0 309
�Organisation/ Operations Management
4 151 3 446 191 1 700
�Strategy 4 176 783 383 618
0
3 000
6 000
9 000
12 000
15 000
Turn
over
mill
ion
euro
s

22
3 Selected European MC Markets
Table 10.MC Market Composition by Client
Sector (million €), 2009
3.4.2 mcmarketcompositionbyclientSector(million€),2009
Germany United Kingdom Spain France Denmark Finland Switzerland Ireland Slovenia Hungary Greece
Total turnover (million €) 25 780 18 821 9572 7728 2107 1103.2 875 329.7 268.5 245 234.2
Industry 8 146 998 861 1 314 306 464 236 38 87 25 46Banking & Insurance
6 136 3 783 2 202 2 009 51 46 236 61 34 49 17
Public sector 2 630 6 851 1 340 1 314 921 96 70 104 39 98 97Aerospace & Defense
0 301 957 309 0 0 0 1 0 0 0
Telecoms & Media 2 140 1 732 1 532 696 0 184 61 39 27 15 15Wholesale & Retail 1 083 809 287 386 80 142 35 8 19 20 14Energy & Utilities 1 934 1 769 1 053 927 122 61 53 19 32 20 17Transport & Travel 1 418 527 766 309 97 13 53 16 5 5 7Healthcare (pharmaceuticals & biotech included)
954 678 287 155 219 96 114 26 20 10 6
Other 1 341 1 374 287 309 312 0 18 18 5 5 15Total 25 780 18 821 9 572 7 728 2 107 1 103.2 875 329.7 268.5 245 234.2
In the four key countries the order of the client sectors based on their turnovers in volume is the following:
In Germany the main purchaser of consulting services is Industry, in the United Kingdom the Public sector and in Spain as in France, Banking & Insurance are the top client sectors.
Industry in Germany generates turnover eight times higher than this sector in the UK and Spain.
The turnover in the UK generated by the Public sector is more than double the turnover of the public sector in each of the other three key countries.
Figure 18.Turnover of Key Markets
by Client Sector
Germany United Kingdom Spain France
Total 25 780 18 821 9 572 7 728
Aerospace & Defense 0 301 957 309
�Healthcare (pharmaceuticals & biotech included)
954 678 287 155
Wholesale & Retail 1 083 809 287 386
Other 1 341 1 374 287 309
Transport & Travel 1 418 527 766 309
Energy & Utilities 1 934 1 769 1 053 927
Telecoms & Media 2 140 1 732 1 532 696
Public sector 2 630 6 851 1 340 1 314
Banking & Insurance 6 136 3 783 2 202 2 009
Industry 8 146 998 861 1 314
0
5 000
10 000
15 000
20 000
25 000
30 000
Turn
over
mill
ion
euro
s
3.4.3 KeymarketcompositionbyclientSector

23
4 Main Trends in Management Consulting in 2009/20104 main Trends in management
Consulting in 2009/2010
4.1 BosniaandHerzegovina
The total turnover of the Management Consulting market in Bosnia Herzegovina was 45 million € in 2009. The negative effects of the economic crisis, which were already seen in 2008, have further intensified, resulting in a -32.6% growth rate in 2009. Concerning the number of consultants relative to the total staff, 83% of the total staff employed in the field of Management Consulting work as consultants. Therefore, the number of the support staff is only 17% of the total staff.
Bosnia and Herzegovina
Total turnover (million €) 45
Growth rates
Growth rate 2008 -10.0%
Growth rate 2009 -32.6%
Growth rate 2010 (prevision) -12.0%
Key service lines (%)
Business Consulting 10.0%
IT Consulting 20.0%
Development & Integration 10.0%
Outsourcing 45.0%
Other Services 15.0%
Key sectors (%)
Industry 15.0%
Banking & Insurance 25.0%
Public Sector 60.0%
Export (%) n.a.
EU n.a.
Countries outside the EU n.a.
Number of consultants 1 000
Total staff 1 200
Income/Consultant (€) 45 000

24
4 Main Trends in Management Consulting in 2009/2010
4.2 croatia
Although an in depth analysis has not been done for the consulting industry in the context of the crisis and recession, AMC (Association of Management Consulting in Croatia) monitors the development of demand for business consulting services as a part of its regular activities. A change in clients’ behaviour has been noticeable since the beginning of the year, with the delay or cancelling of already agreed consulting assignments of strategic nature. The total turnover of the MC market in Croatia in 2009 was 114.5 million €. In spite of the economic crisis, Croatia was among the few countries which generated a 4.5% growth rate. In order to reduce the impact of the crisis on their operations and provide opportunities for development, consulting companies used various measures, from cutting their own costs, seeking new market niches and marketing approaches, developing innovative consulting products and defining and implementing a flexible payment policy. Therefore, defining and setting up new business models in the context of the turbulent and dynamic business environment, stands as a precondition for the survival of consulting firms. Given the need for quick and effective actions, the greatest demand was for consulting services in financial management, business process reengineering, repositioning of companies in a dynamic market environment, crisis and interim management services, strategic partner search and advisory services in the area of cost management. In that sense by supporting clients’ needs to overcome specific business difficulties, consultancies are adapting their services to meet the specific needs (tailor made approach) of clients very quickly. The selling of consulting service packages (integrated approach) is declining, so flexible consulting firms which can easily adapt to market trends and fluctuating clients’ needs are more in demand. It mirrors the expectations of the market that according to the forecast for 2010, the growth rate will increase to 7.3% in the MC market. The assumption is that in 2010 the need for consulting services will grow but also there will be changes in the market in terms of the repositioning
of supply and demand and an increased need for new innovative consulting services. Forecasts except growing demand for change management and organizational development, and strong growth in services related to strategy development and human resource management with a stable market for consulting services in finance and project management. Regarding the key service lines in Croatia, Business Consulting proved to be the service line which generated the highest contribution to total turnover of the MC market, standing at 36%. The share of the second and third most important service lines are approximately equal, as IT Consulting produced 21% of the total turnover while Outsourcing generated 20%. Other Services and Development & Integration contributed with 16% and 7% respectively. The most important client sectors were Industry (24%), Banking & Insurance (15%) and Public sector (12%). In 2009, the export activity in Croatia totaled 9.7% of total turnover, only 0.3% of which went into countries outside the EU. The number of people employed by the MC market is 885, 89% of which work as consultants.
Croatia
Total turnover (million €) 114.5
Growth rates
Growth rate 2008 n.a.
Growth rate 2009 4.5%
Growth rate 2010 (prevision) 7.3%
Key service lines (%)
Business Consulting 36.0%
IT Consulting 21.0%
Development & Integration 7.0%
Outsourcing 20.0%
Other Services 16.0%
Key sectors (%)
Industry 24.0%
Banking & Insurance 15.0%
Public Sector 12.0%
Export (%) 9.7%
EU 9.4%
Countries outside the EU 0.3%
Number of consultants 787
Total staff 885
Income/Consultant (€) 145 489

25
4 Main Trends in Management Consulting in 2009/2010
4.3 Denmark
The total turnover of Denmark accounted for 2 107 million € in 2009. The effects of the worldwide economic downturn impacted on the MCs in Denmark in 2009. Many clients in the private sector, especially in manufacturing, delayed ongoing projects and did not start new ones. Due to the economic crisis the compelling growth rate of 2008, which was 8.8%, decreased to -3.6% in 2009. Due to new client preferences in the private sector the consulting business has been restructured to match clients’ demands concerning: on the one hand their service portfolio where cost reduction, productivity and adaptability has been high on the agenda; and on the other hand more tough expectations from clients regarding measurable outcomes of projects and shorter time horizon for the return on investment. However, the effects have been much less than expected due to impressive adaptability in the industry. Business Consulting (58%) created more than half of the total turnover. Both Development & Integration and Other Services, which follow it, are far behind with their 16.5 and 15.6 percents. IT Consulting and Outsourcing experienced decreased demand in 2009, both service lines remained under 10%. Considering sectors for which the MC market provides its services, in Denmark the Public sector was the most significant client sector (43.7%) followed by Industry (14.5%). Through 2009, the Public sector has been considered as a stable market. Hence, more consultants have focused on
this sector, though the tides have begun to turn in public procurement in early 2010. The export activity of MCs focused on countries outside Europe, an infinitesimal 1.7% was directed into countries within Europe. The aforementioned trends have affected employment in consultancies as well. The composition of human resources in the Danish MC market consisted of mainly consultants (87.4%), only 12.6% represented support staff in 2009.
Denmark
Total turnover (million €) 2 107
Growth rates
Growth rate 2008 8.8%
Growth rate 2009 -3.6%
Growth rate 2010 (prevision) n.a.
Key service lines (%)
Business Consulting 58.0%
IT Consulting 7.4%
Development & Integration 16.5%
Outsourcing 2.5%
Other Services 15.6%
Key sectors (%)
Industry 14.5%
Banking & Insurance 2.4%
Public Sector 43.7%
Export (%) 13.3%
EU 1.7%
Countries outside the EU 11.6%
Number of consultants 9 381
Total staff 10 733
Income/Consultant (€) 224 603

26
4 Main Trends in Management Consulting in 2009/2010
4.4 Finland
The MC market in Finland generated 1 103.2 million € in 2009. The turnover this year exceeded the turnover of 2008 (1 098 million €) producing a 0.5% growth rate after last year’s 2%. The forecast for 2010 is more optimistic, they expect a 6% growth rate in the MC market of Finland in 2010. The demand for MC services was low during the first half of 2009. During this period, some staff reduction took place in the business. Especially large companies and companies in IT and HR sectors were suffering. Smaller companies working in the Strategy, Operations Management and Change Management did not experience any significant reduction in demand. The competition however became harder. During the second half of 2009, the demand for MC services was rising rapidly and at the end of the year the demand was at an all time high. Business Consulting dominated the market with a 60.6% contribution to turnover, much ahead of Other Services (15.1%) and Development & Integration (11.7%) which hold the second and third places. In the private sector especially the demand coming from Industry was quickly recovering, it created the highest demand for MC services at 42.1%, the demand from the Banking & Insurance sector and also the Public Sector was still low, they together could reach only 12.9%. A rise in the Healthcare sector was however significant. Exports accounted for 22.5% of the total turnover of the MC market in Finland in 2009 76.9% of exports went to countries within Europe, with the remaining going to countries outside Europe. The number of consultants within total staff is only 53.8 percent,
which is under average, and despite the fact that the number of support staff decreased from last year, their share in total staff was still extremely high. According to the consulting companies, purchasing decisions of consulting projects is moving from top management towards the procurement department, at least in regards to the final contract negotiations. The consulting contracts were also becoming more specified and the value of a single contract was going down. At the same time, longer partnerships seem to be a new trend.
Finland
Total turnover (million €) 1 103.2
Growth rates
Growth rate 2008 2.0%
Growth rate 2009 0.5%
Growth rate 2010 (prevision) 6.0%
Key service lines (%)
Business Consulting 60.6%
IT Consulting 8.4%
Development & Integration 11.7%
Outsourcing 4.2%
Other Services 15.1%
Key sectors (%)
Industry 42.1%
Banking & Insurance 4.2%
Public Sector 8.7%
Export (%) 22.5%
EU 17.3%
Countries outside the EU 5.2%
Number of consultants 5 764
Total staff 10 710
Income/Consultant (€) 191 395

27
4.5 France
2009 began badly for the consulting industry in France, with demand falling by 7%. For some firms, market conditions remained tough throughout the year; others saw an upturn after the summer. However, individual firms’ experience varied wildly. Some smaller, more specialised companies were driven out of business, especially those that focused on a limited number of sectors, all of which were hit badly by the economic crisis. However, most survived and some thrived, able to tailor their services to the difficult economic circumstances and charge lower fee rates at a time when clients were making efforts to save money. Among the bigger firms – and in contrast to the last downturn in 2002-03 when strategy firms suffered disproportionately – it was the human resources firms that performed worst. It was a roller-coaster of a year: “stop-go” was how one firm described it. Strategy firms saw the first improvements in spring, with smaller firms seeing a marked upturn in the early autumn. For HR and technology firms, the crisis lasted through to the end of the year, although there are signs that demand has picked up even here since then. Such an environment didn’t instill confidence: “We were confident about our business on a month by month business,” said one small firm, “but it was a strange atmosphere in which no one was prepared to make long-term commitments“. It clearly appears that French firms describe the recession with past terms; this is in line with their forecast for 2010, a growth rate of 3%. Business Consulting produced the largest part of the turnover (58%), followed by IT Consulting (20%), Development & Integration and
Outsourcing contributed to it equally with 10% and 10%. Regarding client sectors Banking & Insurance is in first place (26%), Industry is in second (17.3%), but closely followed by the Public sector (17%). The recession has had a significant impact on the psyche of French consulting firms, with many more starting to look outside France for future growth than was the case even a couple of years ago. Their export mainly focused on European countries, only 3.8% of the export activity was directed to countries outside Europe. The number of consultants relative to total staff was extremely high, standing at 90%.
4.6 Germany
The total turnover of the German MC market decreased to 25 780 million euros in 2009 which meant only a slight decrease compared to 2008 (€26 500). This slight decline is equivalent to a -2.7% growth rate for 2009. In 2010 5.5% positive growth is forecasted. Out of the total turnover Business Consulting generated 52.9%, followed by Development & Integration which accounted for 20.5%. The key client sector in 2009 was Industry, having generated a 31.6% demand for MC services. Banking & Insurance’s performance was also significant, standing at 23.8%. The export activity of Germany mainly focused on countries outside Europe. Out of the 14% total export, only 5% was directed to European countries. The number of total staff working in the field of MC decreased by 2 000 compared to last year and this change related only to consultants as their number was reduced by 2000 as well. (Further information: Facts&Figures zum Beratermarkt 2009/2010 www.bdu.de)
4 Main Trends in Management Consulting in 2009/2010
France
Total turnover (million €) 7 728
Growth rates
Growth rate 2008 6.0%
Growth rate 2009 -7.0%
Growth rate 2010 (prevision) 3.0%
Key service lines (%)
Business Consulting 58.0%
IT Consulting 20.0%
Development & Integration 10.0%
Outsourcing 10.0%
Other Services 2.0%
Key sectors (%)
Industry 17.3%
Banking & Insurance 26.0%
Public Sector 17.0%
Export (%) 12.1%
EU 8.3%
Countries outside the EU 3.8%
Number of consultants 44 011
Total staff 48 901
Income/Consultant (€) 175 592
Germany
Total turnover (million €) 25 780
Growth rates
Growth rate 2008 11.0%
Growth rate 2009 -2.7%
Growth rate 2010 (prevision) 5.5%
Key service lines (%)
Business Consulting 52.9%
IT Consulting 15.6%
Development & Integration 20.5%
Outsourcing 6.6%
Other Services 4.5%
Key sectors (%)
Industry 31.6%
Banking & Insurance 23.8%
Public Sector 10.2%
Export (%) 14.0%
EU 5.0%
Countries outside the EU 9.0%
Number of consultants 128 000
Total staff 178 000
Income/Consultant (€) 201 406

28
4 Main Trends in Management Consulting in 2009/2010
4.7 Greece
For the majority of Greek MC companies, 2009 was either a bad or an indifferent year. Few MC firms managed to increase their turnover. The main constraints for market development in 2009 were the effects of the global economic crisis on the Greek economy as well as the elections in October 2009 which caused a delay in the implementation of the National Strategic Framework Reference 2007 – 2013 and the launching of new projects in the Public sector. Due to the economic recession, the private sector was also reluctant to invest in new projects. The majority of projects was in the service areas of project management, operations management, restructuring, reorganization and cost reduction. The main client for consulting services was the Public sector, although there was a decrease in demand. Major clients from the private sector were in consumer goods, energy, and banking and insurance. Fee rates remained the same in 2009 and are expected to remain unchanged in 2010. For 2010 the main challenges and opportunities for MC consulting firms are the impact of the economic crisis, the need for technical assistance to public sector bodies that must restructure in order to comply with the financial and economic measures agreed with the EU and IMF the lack of investments and fierce competition among companies. The main priorities of clients are cost reduction, globalization and innovation. For Greece, the high growth rate (9%) of the MC sector in 2008 turned into a minus -9.2% in 2009. Business
Consulting dominated the market, comprising 73.5% of total turnover. Regarding the key client sectors, Public sector (41.5%) and Industry (19.8%) are the largest client sectors. Greece’s export activity was significant (18.8%), with European countries accounting for 11.5% and non-European countries only 7.3%. The number of total staff working in the field of MC was 1 880, consisting mainly of consultants (1 650) with the remainder being support staff.
4.8 Hungary
In the private sector, demand for most consulting services has fallen - due to the deep recession. The growth rate in 2009 was -22.2%. Clients were committed to carry out only projects of vital importance, in almost each case related to cost cutting and increasing efficiency. Lack of commitment to long-term development characterized the market. In the public sector, spending on consulting was getting more cautious due to scandals (corruption cases cast a shadow on the profession). The only driver has been the availability of EU funding - though it can have only a limited impact on the profession. The priority is rather to spread the guidelines and ethical standards of the profession crystallized throughout decades as widely as possible. There was a major need for Business Consulting (54%) and IT Consulting (32%) in 2009. It was the Public sector, which had the highest demand for MC services standing at 40% of total turnover, followed by Banking & Insurance at 20.0%. Almost all export activity was directed to countries within Europe. The number of total staff was 4 700, 4 300 consultants and only 400 support staff were reported.
Greece
Total turnover (million €) 234.2
Growth rates
Growth rate 2008 9.0%
Growth rate 2009 -9.2%
Growth rate 2010 (prevision) -5.0%
Key service lines (%)
Business Consulting 73.5%
IT Consulting 3.1%
Development & Integration 4.1%
Outsourcing 2.3%
Other Services 17.0%
Key sectors (%)
Industry 19.8%
Banking & Insurance 7.3%
Public Sector 41.5%
Export (%) 18.8%
EU 11.5%
Countries outside the EU 7.3%
Number of consultants 1 650
Total staff 1 880
Income/Consultant (€) 124 574
Hungary
Total turnover (million €) 245
Growth rates
Growth rate 2008 n.a.
Growth rate 2009 -22.2%
Growth rate 2010 (prevision) -10.0%
Key service lines (%)
Business Consulting 54.0%
IT Consulting 32.0%
Development & Integration 8.0%
Outsourcing 0.0%
Other Services 6.0%
Key sectors (%)
Industry 10.0%
Banking & Insurance 20.0%
Public Sector 40.0%
Export (%) 15.0%
EU 14.0%
Countries outside the EU 1.0%
Number of consultants 4 300
Total staff 4 700
Income/Consultant (€) 56 977
29
4 Main Trends in Management Consulting in 2009/2010
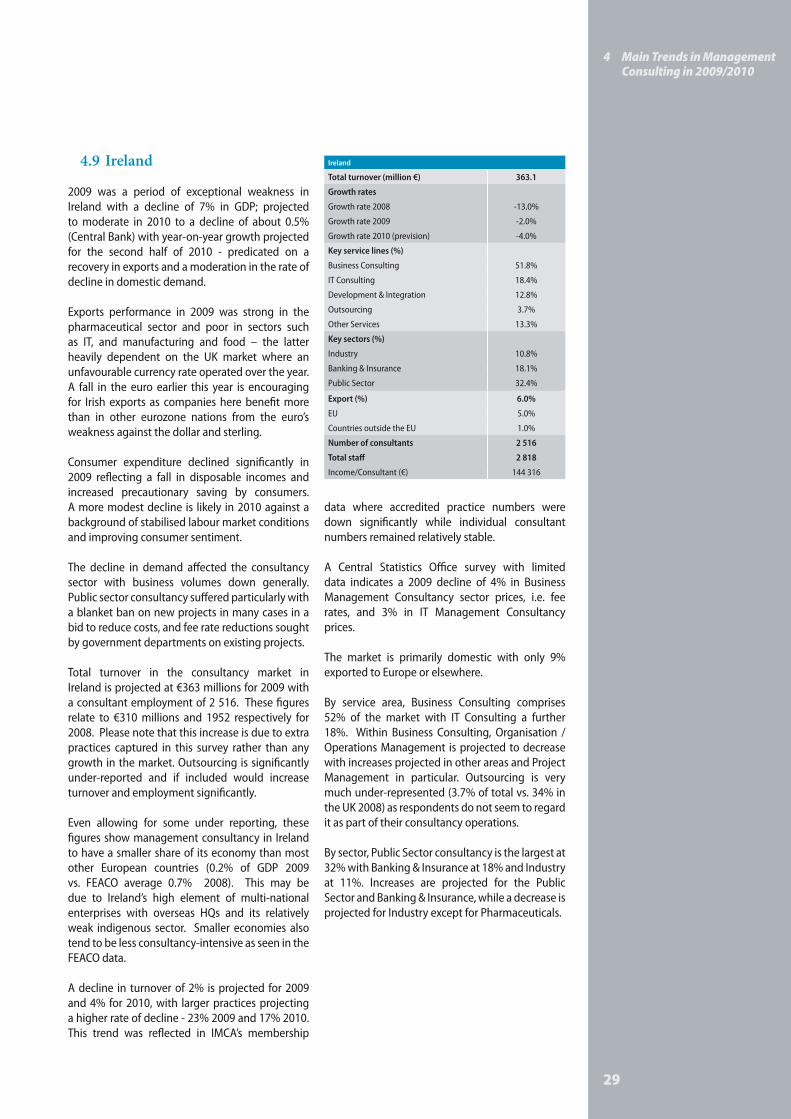
4.9 Ireland
2009 was a period of exceptional weakness in Ireland with a decline of 7% in GDP; projected to moderate in 2010 to a decline of about 0.5% (Central Bank) with year-on-year growth projected for the second half of 2010 - predicated on a recovery in exports and a moderation in the rate of decline in domestic demand.
Exports performance in 2009 was strong in the pharmaceutical sector and poor in sectors such as IT, and manufacturing and food – the latter heavily dependent on the UK market where an unfavourable currency rate operated over the year. A fall in the euro earlier this year is encouraging for Irish exports as companies here benefit more than in other eurozone nations from the euro’s weakness against the dollar and sterling.
Consumer expenditure declined significantly in 2009 reflecting a fall in disposable incomes and increased precautionary saving by consumers. A more modest decline is likely in 2010 against a background of stabilised labour market conditions and improving consumer sentiment.
The decline in demand affected the consultancy sector with business volumes down generally. Public sector consultancy suffered particularly with a blanket ban on new projects in many cases in a bid to reduce costs, and fee rate reductions sought by government departments on existing projects.
Total turnover in the consultancy market in Ireland is projected at €363 millions for 2009 with a consultant employment of 2 516. These figures relate to €310 millions and 1952 respectively for 2008. Please note that this increase is due to extra practices captured in this survey rather than any growth in the market. Outsourcing is significantly under-reported and if included would increase turnover and employment significantly.
Even allowing for some under reporting, these figures show management consultancy in Ireland to have a smaller share of its economy than most other European countries (0.2% of GDP 2009 vs. FEACO average 0.7% 2008). This may be due to Ireland’s high element of multi-national enterprises with overseas HQs and its relatively weak indigenous sector. Smaller economies also tend to be less consultancy-intensive as seen in the FEACO data.
A decline in turnover of 2% is projected for 2009 and 4% for 2010, with larger practices projecting a higher rate of decline - 23% 2009 and 17% 2010. This trend was reflected in IMCA’s membership
data where accredited practice numbers were down significantly while individual consultant numbers remained relatively stable.
A Central Statistics Office survey with limited data indicates a 2009 decline of 4% in Business Management Consultancy sector prices, i.e. fee rates, and 3% in IT Management Consultancy prices.
The market is primarily domestic with only 9% exported to Europe or elsewhere.
By service area, Business Consulting comprises 52% of the market with IT Consulting a further 18%. Within Business Consulting, Organisation / Operations Management is projected to decrease with increases projected in other areas and Project Management in particular. Outsourcing is very much under-represented (3.7% of total vs. 34% in the UK 2008) as respondents do not seem to regard it as part of their consultancy operations.
By sector, Public Sector consultancy is the largest at 32% with Banking & Insurance at 18% and Industry at 11%. Increases are projected for the Public Sector and Banking & Insurance, while a decrease is projected for Industry except for Pharmaceuticals.
Ireland
Total turnover (million €) 363.1
Growth rates
Growth rate 2008 -13.0%
Growth rate 2009 -2.0%
Growth rate 2010 (prevision) -4.0%
Key service lines (%)
Business Consulting 51.8%
IT Consulting 18.4%
Development & Integration 12.8%
Outsourcing 3.7%
Other Services 13.3%
Key sectors (%)
Industry 10.8%
Banking & Insurance 18.1%
Public Sector 32.4%
Export (%) 6.0%
EU 5.0%
Countries outside the EU 1.0%
Number of consultants 2 516
Total staff 2 818
Income/Consultant (€) 144 316

30
4 Main Trends in Management Consulting in 2009/2010
4.10 Portugal
The Portuguese economy was adversely affected by the global economic and financial crisis. Unemployment increased significantly and the public deficit was enlarged by a decrease in income from taxes and an increase in the costs of the public sector. The government implemented a large programme to support SMEs, to protect employment and support the unemployed, and a programme based on public investment for infrastructure renewal, accelerating some investments in schools and health centres and in renewable energies. Large public works previously foreseen (namely the new Lisbon International Airport, high speed railway network -reduced to the Lisbon/Madrid line-, new Tagus bridge) suffered some delays due to the situation in the financial markets and financing limitations, but they are expected to have a positive impact on consulting activities in the period 2010-2012. The number of people employed by the MC market was 17 142 of whom 10 285 were working as consultants.
In general, there was a trend to reduce invest-ments in strategic consulting services - both in the public and private sectors -, while the operational consulting did quite well. The Portuguese man-agement consulting companies, whose market is
mainly dominated by multinational companies, experienced some restructuring, in the face of this change. Key service lines in 2009 were Other Serv-ices (62.7%) and Business Consulting (37.3%). One of the challenges for the Portuguese economy and the MC sector is to develop export activities. In 2009 exports accounted for 8.3% of turnover.
Portugal
Total turnover (million €) 1 179
Growth rates
Growth rate 2008 6.0%
Growth rate 2009 n.a.
Growth rate 2010 (prevision) n.a.
Key service lines (%)
Business Consulting 37.3%
IT Consulting 0.0%
Development & Integration 0.0%
Outsourcing 0.0%
Other Services 62.7%
Key sectors (%)
Industry 0.0%
Banking & Insurance 0.0%
Public Sector 0.0%
Export (%) 8.3%
EU 3.8%
Countries outside the EU 4.5%
Number of consultants 10 285
Total staff 17 142
Income/Consultant (€) 114 633

31
4 Main Trends in Management Consulting in 2009/2010
4.11 Romania
2009 was the first year, after 8 years of continuous growth that the Romanian Management Con-sulting market experienced a downturn. The really high growth rate in 2008 (30%) turned into a decrease of 16% in 2009. The forecast for 2010 is again optimistic with a 20% growth rate expected.
The structure of the Romanian Management Consulting market remained the same during 2009. There are approximately 70% small-sized firms (with a turnover less than 0.2 million €), 25% medium-sized consulting companies (with a turnover more than 0.2 million € and less than 1 million €), and about 5% large firms (with a turnover of more than 1 million €).
Small-sized MC firms were the most affected by the crisis, while large firms increased their turnover. For the medium-sized firms, the revenues did not significantly change. The total turnover of the MC market was 350 million € in 2009.
The main drivers in 2009 were: EU funding programs, the diversification of services offered, the improvement of client-consultant relationships, the re-branding and restructuring of MC firms and the increase of networking activities.
The MC firms, which faced reductions in revenues, consider that the main causes were: the economic recession, the political and economic instability, fewer investments, shrinking MC budgets and client’s debts.
The major client sectors in 2009 were: industry, construction, business services, public admini stra-tion and agriculture.
The following consulting services were required in 2009: Project management, Other Consulting Services (studies, training, surveys, recruitment, etc), Strategic consulting services and Operations Management. The number of total staff working in the MC market was 10 000 in 2009, 80% of whom worked as consultants.
Romania
Total turnover (million €) 350
Growth rates
Growth rate 2008 30.0%
Growth rate 2009 -16.0%
Growth rate 2010 (prevision) 20.0%
Key service lines (%)
Business Consulting n.a.
IT Consulting n.a.
Development & Integration n.a.
Outsourcing n.a.
Other Services n.a.
Key sectors (%)
Industry n.a.
Banking & Insurance n.a.
Public Sector n.a.
Export (%) n.a.
EU n.a.
Countries outside the EU n.a.
Number of consultants 8 000
Total staff 10 000
Income/Consultant (€) 43 750

32
4 Main Trends in Management Consulting in 2009/2010
4.12 Slovenia
In 2009, the management consulting market stopped growing and its reach reduced. Nevertheless, the total income of MC firms was higher than in 2008 by 1.5%, which was due to the on-going projects and the conclusion (and payment) of previous agreements. The demand for consulting services was mostly driven by the clients need to improve their competitive advantage in the global market, open new markets, and optimize their supply, marketing and branding. Business Consulting accounted for 68.5% of the demand for MC service. Available funding (EU projects, national and international procurement) enabled a certain amount of consulting activity including project management. The economic recession had a negative impact on the market and many clients restricted their spending. Rather than hiring external expertise, internal resources were regarded as sufficient for finding business solutions. Also clients had a tendency to undertake less ambitious and innovative projects. On the other hand, the public sector did not contribute enough in order to accelerate business processes and the public procurement system has not positively impacted demand. The public sector produced 14.5% of turnover and was overtaken by Industry which accounted for 32.5%. In 2009, most MC firms were confronted with strong pressures on fees. In general, average fees were somewhat reduced, with the extent of the reduction depending mostly on the client sector, the nature and requirements of projects, the project terms and the individual position of MC firms. Keeping in mind that the general economic situation has not significantly improved and that short-term trends in the industry do not show any substantial upsurge, the prospects for MC market in 2010 remain modest and prudent. Pressure
on fees will continue. According to the Slovenian MC companies the main challenges for them in 2010 will be: new (post-crisis) business models, networking for large projects, unfair, un-qualified, low-priced competition, and keeping qualified, competent and experienced human resources. The role of specialist consultant is expected to become increasingly important. According to expectations priorities on the clients’ side will be: business optimisation, market share, new markets; globalization, growth, innovation, corporate governance, cost reduction and financing. In Slovenia, almost half of the export activity went to European countries and a little bit of more than half of it was directed to countries outside Europe. 87% of total staff in consulting companies worked as consultants.
Slovenia
Total turnover (million €) 268.5
Growth rates
Growth rate 2008 17.0%
Growth rate 2009 1.5%
Growth rate 2010 (prevision) n.a.
Key service lines (%)
Business Consulting 68.5%
IT Consulting 13.0%
Development & Integration 6.0%
Outsourcing 1.5%
Other Services 11.0%
Key sectors (%)
Industry 32.5%
Banking & Insurance 12.5%
Public Sector 14.5%
Export (%) 14.0%
EU 6.5%
Countries outside the EU 7.5%
Number of consultants 2 700
Total staff 3 090
Income/Consultant (€) 99 444

33
4 Main Trends in Management Consulting in 2009/2010
4.13 Spain
Turnover for the industry remained unchanged in 2009, in contrast to the growth experienced in previous years. The industry enjoyed only a very slight increase in sales during 2009: 0.7% up on the previous year generating a 9 572 million turnover.
For 2010 it is estimated that the industry will once again see a slight increase (1.6%) in sales, better than the forecasted growth for the Spanish economy as a whole.
The present economic crisis has put today’s clients in a consolidation and maintenance mode, which makes it necessary to delay new investment projects. One of the drivers of this market during 2009 came from cost optimizing policies that create the need for services related to Development & Integration (42%), Outsourcing (39%), IT Consulting (13%), and to a smaller extent, Business Consulting (6%), all of them pointing to the fundamental goal of being more efficient.
Many Spanish firms have implemented a strategy of internationalisation, either by creating overseas subsidiaries or by competing for projects on the international market. This strategy has brought both additional revenue and profits.
Some of the main clients of the Consulting market are the Financial Services Companies (Banking & Insurance), which represented a 23% market share in 2009, followed by the Telecom industry, with a 15% market share, and the Public Sector, which accounts for a 14% of total turnover. The major component of the services offered to these three markets is related to cost reduction, infrastructure consolidation, application management, business process re-engineering, efficiency and customer relation management.
At this juncture, where clients’ capacity for investment has diminished for reasons of uncertainty and crisis, the consulting market faces very important challenges, such as the following:
the need to increase their capacity of internationalisation.
to support their clients’ principal needs, which mainly consist of cost reduction and business consolidation.
to help the public sector to improve its processes, be more efficient and develop its capabilities.
to address part of their services towards Business Consulting, so that they will not lose future perspective.
The clients’ main objectives for the next years were: internationalisation, cost reduction, business consolidation and optimizing their processes and customer relation management. Taking export activity of the Spanish MC market into consideration, both groups of target countries were equally present – they provided services accounting for 9 – 9% into European and non-European countries as well. 87% of total staff in consulting companies worked as consultants.
Spain
Total turnover (million €) 9 572
Growth rates
Growth rate 2008 11.0%
Growth rate 2009 n.a.
Growth rate 2010 (prevision) n.a.
Key service lines (%)
Business Consulting 6.0%
IT Consulting 13.0%
Development & Integration 42.0%
Outsourcing 39.0%
Other Services 0.0%
Key sectors (%)
Industry 9.0%
Banking & Insurance 23.0%
Public Sector 14.0%
Export (%) 18.0%
EU 9.0%
Countries outside the EU 9.0%
Number of consultants n.a.
Total staff 113 000
Income/Consultant (€) n.a.

34
4 Main Trends in Management Consulting in 2009/2010
4.14 Switzerland
The total turnover of the MC market in Switzerland was 875 million € in 2009. The MC market experienced a slight decrease (4%) but forecasted the same rate of increase for 2010. Rising demand for strategy consulting could be seen in Switzerland, Business Consulting captured the market with 70% of total turnover. Small MC firms gained more market share. The financial industry was still the largest sector in Switzerland; pharmaceutical, healthcare and public sector were growing, but an increasing demand for financial issues like management tools, compliance, governance and advisory characterized the market. “Recruiting stop 2009” is over; employment of MC started to grow again. In 2009 the number of total staff was 3 960, from whom 3 300 people worked as consultants. MC in Switzerland is an extremely competitive market; still growing productivity especially toward industrialised services.
4.15 UnitedKingdom
2009 was one of the most difficult years - possibly the most difficult year – the UK consulting industry has ever faced. Demand fell in most areas of the private sector and in some parts of the public sector. It fell, too, for many service lines with only operational improvement, process re-engineering and some aspects of HR consulting performing comparatively well. The recession was felt most acutely among smaller firms in the early months of 2009. However, many of these firms were able to adapt to the changing market conditions so that their performance picked up in the second half of the year. Niche firms also benefited from growing price pressure from the summer onwards. Most large-scale systems integrators fared comparatively well during the early stages of the recession, only to see investment in new IT systems shrink back. By comparison, firms offering accounting and audit services alongside consulting performed well, building on several years, which saw them, outperform the market. These firms enjoyed a “flight to brand” in the first half of the recession, although they experienced an intensifying pressure on prices in the second half of 2009. As a result for 2009, the total turnover of the MC market in the UK was 9 547 million €. Business Consulting remained the most important service line (74.7%), with IT Consulting altogether
they cover the whole MC market. The most remarkable client sector was Public sector (36.4%) followed by Banking & Insurance (20%). The export activity of the MC market in the UK is not so determinant, it accounted for only 7% in 2009. Nevertheless, the MC market could employ 64 717 people, 56 360 of whom worked as consultants.
Switzerland
Total turnover (million €) 875
Growth rates
Growth rate 2008 0.0%
Growth rate 2009 -4.0%
Growth rate 2010 (prevision) 4.0%
Key service lines (%)
Business Consulting 70.0%
IT Consulting n.a.
Development & Integration 30.0%
Outsourcing 0.0%
Other Services 0.0%
Key sectors (%)
Industry 27.0%
Banking & Insurance 27.0%
Public Sector 8.0%
Export (%) 15.0%
EU 12.0%
Countries outside the EU 3.0%
Number of consultants 3 300
Total staff 3 960
Income/Consultant (€) 265 152
United Kingdom
Total turnover (million €) 18 821
Growth rates
Growth rate 2008 5.0%
Growth rate 2009 -6.0%
Growth rate 2010 (prevision) -4.0%
Key service lines (%)
Business Consulting 74.7%
IT Consulting 25.3%
Development & Integration 0.0%
Outsourcing 0.0%
Other Services 0.0%
Key sectors (%)
Industry 5.3%
Banking & Insurance 20.0%
Public Sector 36.4%
Export (%) 7.0%
EU 4.0%
Countries outside the EU 3.0%
Number of consultants 56 360
Total staff 64 717
Income/Consultant (€) 169 393

35
5 About Feaco, The European Federation of Management Consultancies Associations
5 about feaCo, the european federation of management Consultancies associations
FEACO, the European Federation of Manage-ment Consultancies Associations, a non-profit organisation, was established in 1960 and has 17 national associations as members: fourteen full members: Austria, Cyprus, Czech
Republic, Finland, France, Greece, Hungary, Italy, Poland, Portugal, Romania, Slovenia, Spain and Switzerland;
two associate members: Bosnia & Herzegovina and Croatia;
one affiliate member: Hong Kong.
FEACO is a European organisation. Its general purpose is to assist in the promotion and devel-opment of the profession of Management Con-sultancy in Europe by providing support to its constituent National Association membership in those areas where a collective voice is stronger than the sum of its individual members.
Main objectives of FEACO are
The development of the Management Consul-tancy market, raising its image and profile at European and international level, by the pro-motion of common professional ethics, quality and best practice.
The promotion of the interests of Management Consultancy with the different European and International organisations, by maintaining a close relationship with the European Institu-tions and other pan-European and internation-al organisations in order to ensure an aware-ness of and defend professional interests (not including lobbying for sales opportunities).
The development of a dynamic forum for net-working and service provision, by encouraging networking by members and between mem-bers through the sponsorship and organisation of conferences and meetings, the establish-ment of mutual interest working groups and through close cooperation with other consul-tancy organisations.
2010-2011 Events
FEACO will be one of the co-organizers of the Management Consulting WorldConference hosted by the Finnish Association of Management Consultants LJK,on the 21/22 June 2011 in Helsinki. We look for-ward to meeting you at this event!
Contact:Kim Karme (ExCo Member)[email protected]
1 Note according to the market analysis reported by Syntec the total turnover of the European MC market equals €82.4 billion, instead of €83.7 billion.

36
6 member associationsFédérationEuropéennedesAssociationsdeconseilsenOrganisation
EuropeanFederationofmanagementconsultanciesAssociationsFEAcO
FULLmEmBERS
AUSTRIA Austrian Professional Association of Management Consultancy and Information Technology / AUSTRIAN CHAMBER OF COMMERCE Wiedner Hauptstraße 63 A-1040 Vienna T: 05 - 90900 - 3540 M: 0699 - 1726 22 22 E: [email protected]
CYPRUS CYBCA Cyprus Association of Business Consultants 30, Grivas Dhigenis Avenue P.O. Box 21657 CY-1511 Nicosia Phone: ++357 22 665 102 Fax: ++357 22 669 459 Email: [email protected]
CZECH APP REPUBLIC Association for Consulting to Business Veletřzni 21 CZ -170 00 Prague 7 Phone: ++42 220 879 043 Fax: ++42 222 005 510 Email: [email protected] Website: www.asocpor.cz
FINLAND LJK Liikkeenjohdon Konsultit LJK ry Postal address: PO Box 122 FI-33201 Tampere Phone: + 358 09 622 4442 Email: [email protected] Website: www.ljk.fi
FRANCE SYNTEC Conseil en management Chambre Syndicale des Sociétés de Conseil 3 Rue Léon Bonnat F - 75016 Paris Phone: ++33 1 44 30 49 20 Fax: ++33 1 40 50 73 57 Website: www.syntec-management.com
GREECE SESMA Hellenic Association of Management Consulting Firms 101 Vasilisis Sofias Ave Mavili Square GR – 115 21 Athens Phone: ++30 210 647 0660 Fax: ++30 210 647 0661 Email: [email protected] Website: www.sesma.gr
HUNGARY VTMSZ Association of Management Consultants of Hungary Szt. István körút 11. H - 1055 Budapest Phone: ++36 1 374 3344 / 36 20 922 4241 Fax: ++36 1 269 1920 / 36 1 465 2078 Email: [email protected] Website: www.vtmsz.hu
ITALY
POLAND SDG Stowarzyszenie Doradcow Gospodarczych w Polsce Ul. Emilii Plater 53 p XIII loc 1360 PL- 00-113 Warsaw Phone: ++48 509 382 481 Fax: ++48 22 520 6201 Email: [email protected] Website: www.sdg.com.pl
PORTUGAL APPC Associaçăo Portuguesa de Projectistas e Consultores Avenida Antonio Augusto Aguiar 126 – 7th floor P – 1050-020 Lisbon Phone: ++351 21 358 0785 / 6 Fax: ++351 21 315 0413 Email: [email protected] Website: www.appconsultores.org.pt
ROMANIA AMCOR Asociatia Consultantilor in Management din Romania Str. Ion Brezoianu, nr 47-49, Appt. 166, 1st district RO -010134 Bucharest Phone: ++40 21 311 5175 Fax: ++40 21 311 5175 Email: [email protected] Website: www.amcor.ro
SLOVENIA AMCOS Association of Management Consultants of Slovenia Dimiceva 13 SI -1504 Ljubljana Phone: ++386 1 589 8252 Fax: ++386 1 589 8200 Email: [email protected] Website: www.gzs.si
SPAIN AEC Asociación Espańola de Empresas de Consultoría C/ Monte Esquinza 34 2° B E - 28013 Madrid Phone: ++34 91 308 0161 / 91 391 3673 Fax: ++ 34 91 391 3593 Email: [email protected] Website: www.consultoras.com
SWITZERLAND ASCO Association of Management Consultants Switzerland Weinbergstrasse 31 CH - 8006 Zürich Phone: ++41 43 343 9480 Fax: ++41 43 343 9481 Email: [email protected] Website: www.asco.ch
ASSOcIATEmEmBERS BOSNIA- LESPNET HERZEGOVINA Association of Business Consultants in Bosnia and Herzegovina Branilaca Grada 47/3 BIH -71000 Sarajevo Phone: +387 33 222854 Fax: +387 33 442567 Email: [email protected]; [email protected] Website: www.lespnet.ba
CROATIA UPS-AMC Udruga Poslovnih Savjetnika – Association of Management Consultancies Jurja Haukila 4 HR -10000 Zagreb Phone: ++385 1 4555 024 Fax: ++385 1 4555 025 Email: [email protected] Website: www.ups-amc.org
AFFILIATEmEmBER HONG KONG MCAHK Management Consultancies Association of Hong Kong 14th Floor, Room 1403B 9 Queen´s Road Central Hong Kong Phone: ++852 2856 3487 Fax: ++852 2565 6628 Email: [email protected] Website: www.mca.org.hk
6 Member Associations

37
7 Appendix – Definitions7 appendix – Definitions
1. European MC Market:Austria, Belgium, Bosnia and Herzegovina, Bul-garia, Croatia, Cyprus, Czech Republic, Denmark, Finland, France, Germany, Greece, Hungary, Ire-land, Italy, Netherlands, Norway, Poland, Portu-gal, Romania, Slovenia, Spain, Sweden, Switzer-land, United Kingdom
2. Participants in the Feaco survey 2009/2010: Bosnia and Herzegovina, Croatia, Denmark, Fin-land, France, Germany, Greece, Hungary, Ireland, Portugal, Romania, Slovenia, Spain, Switzerland, United Kingdom
3. Nordic region:Denmark, Finland, Norway, Sweden
4. Central & Eastern Europe:Bosnia and Herzegovina, Bulgaria, Croatia, Cyprus, Czech Republic, Greece, Hungary, Poland, Roma-nia, Slovenia
5. Western Europe:Austria, Belgium, Ireland, Italy, Netherlands, Portugal, Switzerland
Industry Sector:Aerospace and Defense: includes commercial and defense aerospace, airlines and airports and space (civilian) and related manufacturing and associated research
Automotive Products: automotive (motorized road transport vehicles) manufacturers, suppli-ers, systems integrators and distributors
Consumer Products: food and tobacco prod-ucts, textile & apparel, beauty & toiletries, metal (except machinery & automotive products and equipment) wood & furniture, paper and printed products
High Tech Products: all cutting edge technol-ogy: including cutting edge technology used in civilian and defense related aerospace
MachineryChemicalsIT hardware, software & computer servicesOther industries
Banking and Insurance Sector:All Banking and Financial services: including commercial banks, investment managers, mutual funds companies, brokerage firms, investment banks, private banking and trust companies, sav-ing banks, credit unions, mortgage banking com-panies, international banks and finance companies
Insurance: insurance carriers, agents, brokersand services
Healthcare, pharmaceutical and biotech:Healthcare: providers (hospitals and physicians), payers (insurance companies and HMOs) and dis-tributors (of medical equipment and supplies)
Pharmaceuticals and biotech: ppharmaceuti-cals manufacturers and biotech companies, in-cluding biofuels
Wholesale& Retail Sector:Wholesale & Retail: all distribution incl. luxury retailers, specialty retailers, mass merchandisers, discount retailers, grocery chains, convenience stores, drug chains, car dealers, restaurants, home improvement chains, catalogue retailers and etailers of durable and non-durable goods such as building materials, hardware, general merchandise, food, automotive dealers, apparel and accessories, furniture, food & drink etc…
Transport & Travel Sector:Transport/travel includes all transport by air, road or water of goods or passengers: private transportation organisations (travel and urban transport), carriers and shippers as well as logis-tics services companies
Telecoms and Media Sector:Communication/Media/Entertainment: pub-lishers, entertainment companies, record labels; all communications not being telecommunica-tions
Telecommunications
Energy & Utilities Sector:Energy: petrol and gas extraction, coal, mining, clean energies (solar, wind) excluding biofuels (=biotech); chemicals & petrochemicals
Utilities: production and distribution of elec-tricity, gas and water (incl. irrigation systems and sewage treatment)
Public Sector: services provided to all levels of the public sector: local, regional, national and EU.
Other Sectors:Not for Profit Private SectorBusiness servicesAll other sectors (not industry sectors)

38
notesNotes

39
Notes

3/4/5 Avenue des ArtsB-1210 Brussels (Belgium)
Telephone: 32-2-250-0650Facsimile: 32-2-250-0651
E-mail: [email protected] Internet: www.feaco.org
Project management: Kim Karme, Member of Executive Committee of FeacoLayout: MOLiPress, Hungary
FEACO has used its best effort in collecting the information published in The Survey of the European Management Consultancy Market 2009/2010. FEACO does not assume, and hereby disclaims any liability for any loss or damage caused by errors or omissions in their surveys, whether such errors result from negligence, accident or other causes.
Notice: No part of this publication may be reproduced, stored in a retrieval system or transmitted by any means, electronically or mechanically, without the prior written permission of FEACO.
Price EUR200 (VAT Excl.)


