24
Infrastructure Investment Management Mike Morrisroe Business Area Manager Water Networks
| Date post: | 22-Dec-2015 |
| Category: |
Documents |
| View: | 214 times |
| Download: | 0 times |

Infrastructure Investment Management
Mike MorrisroeBusiness Area ManagerWater Networks

Knowledge - Planning - Implementation
Planning
Implement
Knowledge
Optimise using risk - cost &
service constraints
Continuous base data
improvement
Track costs and effects of
implementation, improve data
Infrastructure Risk Management (IRM)
•Water & Waste Water Networks•Risk based assessment•Bottom up approach•Investment planned at asset level•Transparent process•Use of constraints•Supports Continuous improvement

UITS Duration Model
UITSProbability
ProbabilityUITS > 6hrs
ProbabilityUITS > 12hrs
ProbabilityUITS > 24hrs
DependentCustomers
ImpactMethods
xx x+
+
PROBABILITY CONSEQUENCE RISK× =
Burst Model
BurstRate
Implement Plan >
Serviceability=
IRM is a modular approach to optimising investment and serviceability

Burst probability model
Sample of predictor variables
Length (offset)
Material
Diameter
Region
Customer density (large variability)
Pressure (AZNP)
Customers/metre (large variability)
Temporal and environmental
Others not selected… we started with ~ 20!
PROBABILITY CONSEQUENCE RISK× =

Burst probability model
Material and age strongly correlated
Two models were developed– Current state of pipes – Future deterioration
0 10 20 30 40 50 60 70 80 90
Average age (years)
Bur
sts/
km
ACCI
DI
HPPE
MDPEOTHER
PVC
SI
UPVC
PROBABILITY CONSEQUENCE RISK× =
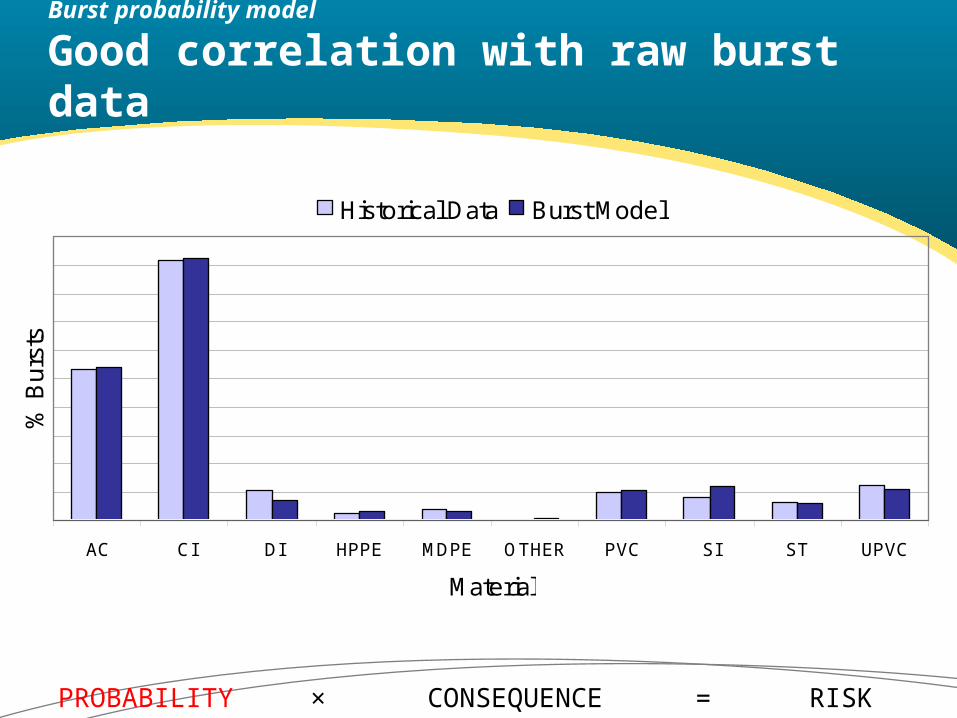
AC CI DI HPPE MDPE OTHER PVC SI ST UPVC
Material
% B
urs
ts
Historical Data Burst Model
Burst probability model
Good correlation with raw burst data
PROBABILITY CONSEQUENCE RISK× =
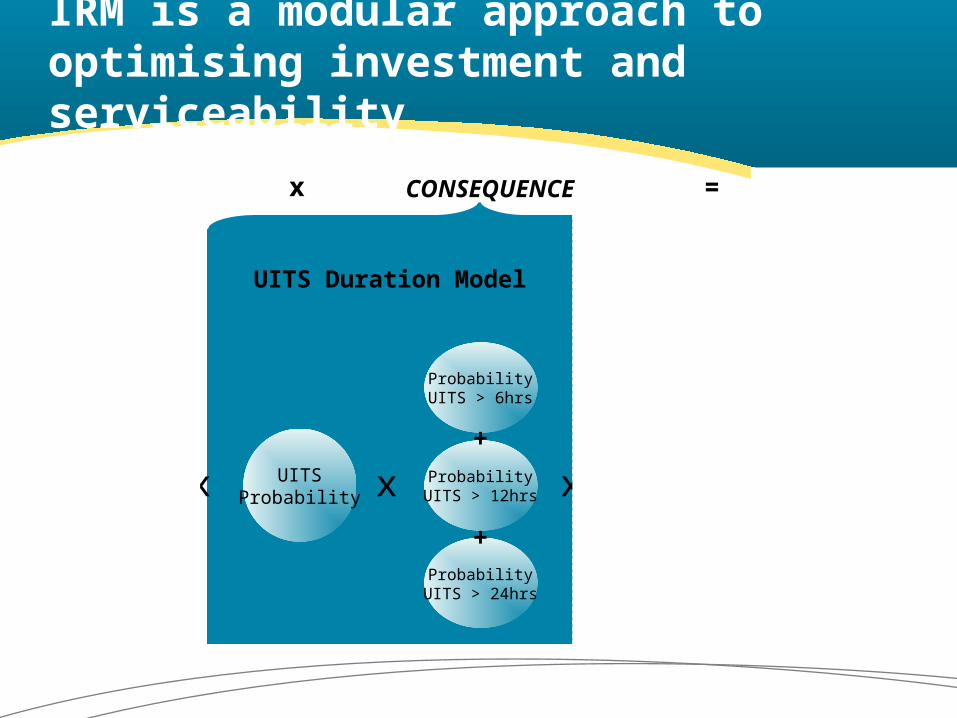
Serviceability
UITS Duration Model
UITSProbability
ProbabilityUITS > 6hrs
ProbabilityUITS > 12hrs
ProbabilityUITS > 24hrs
+
+
DependentCustomers
ImpactMethods
x
IRM is a modular approach to optimising investment and serviceability
PROBABILITY CONSEQUENCE RISKx =
Burst Model
BurstRate =x x

UITS models
Servicability score depends on UITS duration
function of:– UITS events > 6 hours– UITS events > 12 hours– UITS events > 24 hours
Requires pipe-level probability of UITS duration to calculate overall Servicability
ProbabilityUITS > 6hrs
ProbabilityUITS > 12hrs
ProbabilityUITS > 24hrs
PROBABILITY CONSEQUENCE RISK× =

UITS models
Repair durations follow lognormal distribution
0 240 24
PROBABILITY CONSEQUENCE RISK× =

UITS models
Duration function of material and size
0.6
1.0
0.2
PROBABILITY CONSEQUENCE RISK× =

Serviceability
UITS Duration Model
UITSProbability
ProbabilityUITS > 6hrs
ProbabilityUITS > 12hrs
ProbabilityUITS > 24hrs
+
+
DependentCustomers
ImpactMethods
x
IRM is a modular approach to optimising investment and serviceability
PROBABILITY CONSEQUENCE RISKx =
Burst Model
BurstRate =x x

The VCM module automatically assesses the criticality of each
asset on the network model during a single batch run
MWHSoft Developed The InfoWater Pipe/Valve Criticality Module (VCM)
PROBABILITY CONSEQUENCE RISK× =

All Mains / All Valves Model
NB hydraulicallyisolated but not part
of pound
UPSTREAMPOUND
DOWNSTREAMPOUND
COMBINEDPOUND
ASSESSEDVALVE
Each valve can be operated to shut in an area of the network upstream or downstream of the valve (known as pounds)
The upstream or downstream pounds may have a different customer impact
If the valve fails to operate then both areas (combined pound) will need to be closed in to isolate the network
Pipe/Valve Criticality Theory
PROBABILITY CONSEQUENCE RISK× =

Properties Affected ByValve Closures – Isolated,No Water Or Low Pressure
Identifies Affected Properties
PROBABILITY CONSEQUENCE RISK× =

Assigning impact - five customer types
D1
Domestic
D2
Commercial
D3
Hospital
D4
Large
D5
Sensitive
Five customer types Geo-referenced Assigned to mains Grouped by pound (see later)
OPA Properties = D1 + D2 + D3 + D4 + D5
PROBABILITY CONSEQUENCE RISK× =

10000
8000
6000
4000
2000
00.0% 1.0% 2.0% 3.0% 4.0% 5.0% 6.0% 7.0% 8.0% 9.0% 10.0%
NU
MB
ER
OF
PR
OP
ER
TI E
S A
FF
EC
TE
D
PROPORTION OF ALL ASSETS
HIGH IMPACT ASSETS AS A % OF ALL ASSETSSum of Isolated, No Water & Low Pressures Properties
Valves With Initial Flow And No Flow
All AssetsDiameter > 200mmDiameter > 450mm
Identify Critical Assets
PROBABILITY CONSEQUENCE RISK× =

Serviceability
UITS Duration Model
UITSProbability
ProbabilityUITS > 6hrs
ProbabilityUITS > 12hrs
ProbabilityUITS > 24hrs
+
+
DependentCustomers
ImpactMethods
x
IRM is a modular approach to optimising investment and serviceability
PROBABILITY CONSEQUENCE RISKx =
Burst Model
BurstRate =x x
Implement Plan >
Serviceability
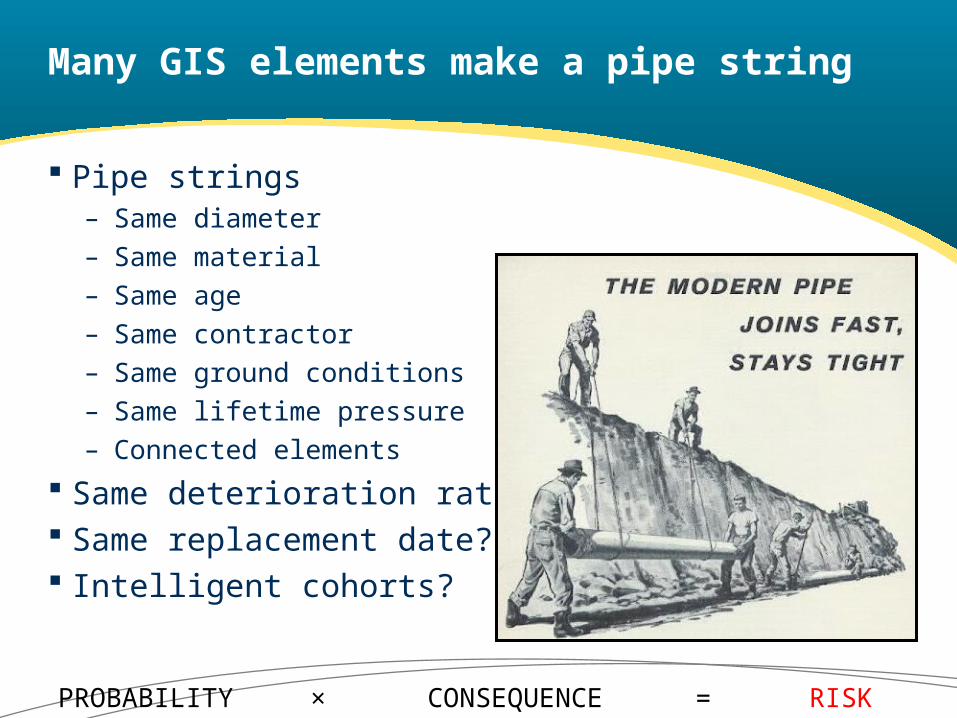
Many GIS elements make a pipe string
Pipe strings– Same diameter– Same material– Same age– Same contractor– Same ground conditions– Same lifetime pressure– Connected elements
Same deterioration rate? Same replacement date? Intelligent cohorts?
PROBABILITY CONSEQUENCE RISK× =

Risk at GN pipe level
PROBABILITY CONSEQUENCE RISK× =
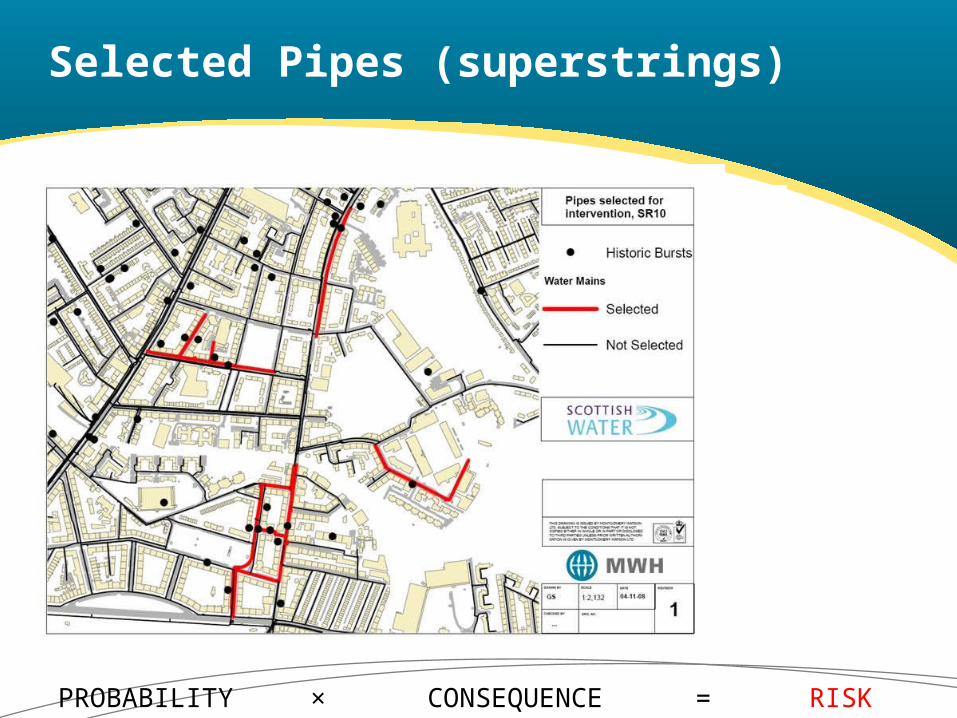
Selected Pipes (superstrings)
PROBABILITY CONSEQUENCE RISK× =

Superstrings are suboptimal… but in reality…
PROBABILITY CONSEQUENCE RISK× =

Optimised Capital ExpenditureB
udge
t
Ser
vice
abili
ty

Knowledge - Planning – ImplementationBusiness as Usual
Planning
Implement
Knowledge
Infrastructure Risk Management (IRM)

Infrastructure Investment Management
Mike MorrisroeBusiness Area ManagerWater Networks


