55 Infrastructure, Transport and Productivity This Information Sheet explores what productivity is and how it is measured, why multi-factor productivity is important to the welfare of Australians, and major productivity trends in Australia—notably the industry- wide slowdown in multi-factor productivity since 2002–03. It then examines sources of the decrease in multi-factor productivity for the Transport, Postal and Warehousing industry, the link between productivity growth and transport infrastructure, and evidence of how well-targeted reforms and investments in transport have improved productivity in Australia. Key measures to improve future productivity benefits of transport and related infrastructure are discussed, including: transparent cost benefit analysis, heavy vehicle charges reform, variable tolling of major urban roads and further application of technological improvements. At a glance Multi-factor productivity growth is an important source of future national wealth. Since 2000 the rate of multi-factor productivity growth has slowed in Australia and other developed countries. For Australia, recent changes in measurement have smoothed this lower trend in multi-factor productivity growth (Australian Bureau of Statistics 2012). Despite this, the overall picture is for lower multi-factor productivity growth than in previous cycles. Multi-factor productivity growth for Transport, Postal and Warehousing has slowed since 2002–03. The main reason for this slowing appears to be capital deepening that is associated with large, sustained increases in private gross capital formation. The decline has accelerated since 2007–08 associated with large increases in public road and rail investment. Increases in multi-factor productivity growth for Transport, Postal and Warehousing since 2008–09 are due to significant increases in labour productivity. Despite short term impacts on multi-factor productivity, there is Australian evidence that well targeted investments in transport infrastructure result in productivity increases that benefit many other industries. Key areas where action to improve transport productivity has been suggested include: o Better prioritising of public infrastructure investments by transparent cost benefit analysis that captures whole of life costs including future maintenance needs. o Implementing cost-reflective road and rail pricing where user charges are linked to damage and future needs, and there is a locational link between heavy vehicle charges and funding of improvements. o Implementing city-wide variable tolling systems for major urban roads that allow consistent time of day and volume related tolling. o Development of economic evaluation guidelines and modelling techniques to enable effective comparison of Intelligent Transport System technologies and traditional infrastructure investment opportunities, and encouragement of pilot deployments of new technologies. 1
Transcript
55
Infrastructure Transport and Productivity
This Information Sheet explores what productivity is and how it is measured why multi-factor productivity is important to the welfare of Australians and major productivity trends in Australiamdashnotably the industry-wide slowdown in multi-factor productivity since 2002ndash03
It then examines sources of the decrease in multi-factor productivity for the Transport Postal and Warehousing industry the link between productivity growth and transport infrastructure and evidence of how well-targeted reforms and investments in transport have improved productivity in Australia
Key measures to improve future productivity benefits of transport and related infrastructure are discussed including transparent cost benefit analysis heavy vehicle charges reform variable tolling of major urban roads and further application of technological improvements
At a glance Multi-factor productivity growth is an important source of future national wealth Since 2000 the rate of multi-factor productivity growth has slowed in Australia and other developed
countries For Australia recent changes in measurement have smoothed this lower trend in multi-factor productivity growth (Australian Bureau of Statistics 2012) Despite this the overall picture is for lower multi-factor productivity growth than in previous cycles
Multi-factor productivity growth for Transport Postal and Warehousing has slowed since 2002ndash03 The main reason for this slowing appears to be capital deepening that is associated with large sustained increases in private gross capital formation The decline has accelerated since 2007ndash08 associated with large increases in public road and rail investment
Increases in multi-factor productivity growth for Transport Postal and Warehousing since 2008ndash09 are due to significant increases in labour productivity
Despite short term impacts on multi-factor productivity there is Australian evidence that well targeted investments in transport infrastructure result in productivity increases that benefit many other industries
Key areas where action to improve transport productivity has been suggested include o Better prioritising of public infrastructure investments by transparent cost benefit analysis that
captures whole of life costs including future maintenance needs o Implementing cost-reflective road and rail pricing where user charges are linked to damage and
future needs and there is a locational link between heavy vehicle charges and funding of improvements
o Implementing city-wide variable tolling systems for major urban roads that allow consistent time of day and volume related tolling
o Development of economic evaluation guidelines and modelling techniques to enable effective comparison of Intelligent Transport System technologies and traditional infrastructure investment opportunities and encouragement of pilot deployments of new technologies
1
55
2
2
What is productivity Productivity is the efficiency of transforming inputs (capital labour) into outputs (goods and services) The two main measures are labour productivity and multi-factor productivity
Labour productivity is a partial measure calculated as real gross domestic product (GDP) or gross value added per unit of labour (commonly proxied by hours worked) Multi-factor productivity is a more complete measure calculated as real GDP or gross value added per unit of combined labour and capital inputs
In order to interpret productivity trends it is important to distinguish these productivity concepts from the measured productivity indices While productivity statistics aim to measure technical progress or the efficiency of production in practice they measure the difference between the growth in the volume of output and the growth in the volume of inputs which reflects more than just technical progress1
As measured in the growth accounting framework growth in labour productivity can be decomposed into capital deepening (or capital intensity) labour quality and multifactor productivity2 Growth in capital deepening is an important driver alongside multifactor productivity of labour productivity (Australian Bureau of Statistics 2013)
While it does not make sense to discuss trends in measured labour productivity in isolation from changes in the productivity of capital capital productivity indices do not produce useful interpretable measures of the efficient use of capital For this reason the focus is usually labour productivity for which there are clear theoretical interpretations
The focus on measured inputs and outputs also has implications for interpreting productivity trends in the non-market sector The market sector accounts for around three quarters to four fifths of the economy The non-market sectormdashnow around a quarter of employment and a fifth of outputmdashis less well measured (Gruen 2012) In particular outputs in the services sector and non-traded services provided by government are not well measured
Interpreting and measuring productivity trends over time is therefore not straightforward because
External factors such as resource depletion and weather can affect measured productivity Changes in capacity utilisation can significantly affect short term measures Large increases in the capital stock can significantly reduce short term measures of multi-factor
productivity Changes in the quality of labour are difficult to measure3
A range of other technical issues such as the treatment of financial assets can affect productivity measures
Changes in productivity methodology can result in significant revisions to historical series
1 Factors other than technical progress include economies of scale reallocation of inputs changes in human capital variations in capacity utilisation climatic events and measurement error (Australian Bureau of Statistics 2013 p422)
2 Increased capital deepening refers to increases in the capital to labour ratio This means that on average each unit of labour has more capital to work with to produce output so is an indicator of ability to augment labour Labour saving practices result in increased capital deepening which is often associated with a decline in capital productivity (Australian Bureau of Statistics 2013)
3 While desirable to reflect changes in measures of labour input such as the proportion of skilled to unskilled employees data limitations mean the most common National Accounts labour measure is hours worked by total employed people (Australian Bureau of Statistics 2007)
55
Why is it important to increase future productivity Productivity like production matters not for its own sake but because the growth it can generate results in the higher incomes and government revenues needed to raise living standards and rectify disadvantage (Banks 2012)
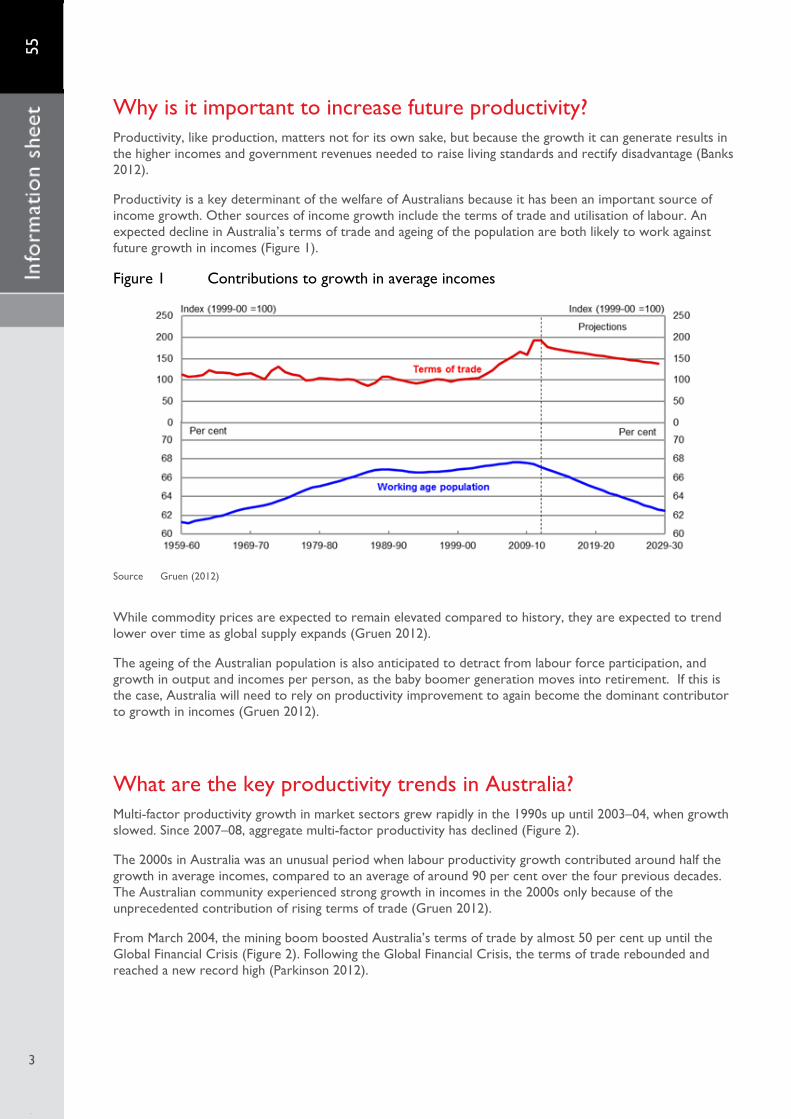
Productivity is a key determinant of the welfare of Australians because it has been an important source of income growth Other sources of income growth include the terms of trade and utilisation of labour An expected decline in Australiarsquos terms of trade and ageing of the population are both likely to work against future growth in incomes (Figure 1)
Figure 1 Contributions to growth in average incomes
Source Gruen (2012)
While commodity prices are expected to remain elevated compared to history they are expected to trend lower over time as global supply expands (Gruen 2012)
The ageing of the Australian population is also anticipated to detract from labour force participation and growth in output and incomes per person as the baby boomer generation moves into retirement If this is the case Australia will need to rely on productivity improvement to again become the dominant contributor to growth in incomes (Gruen 2012)
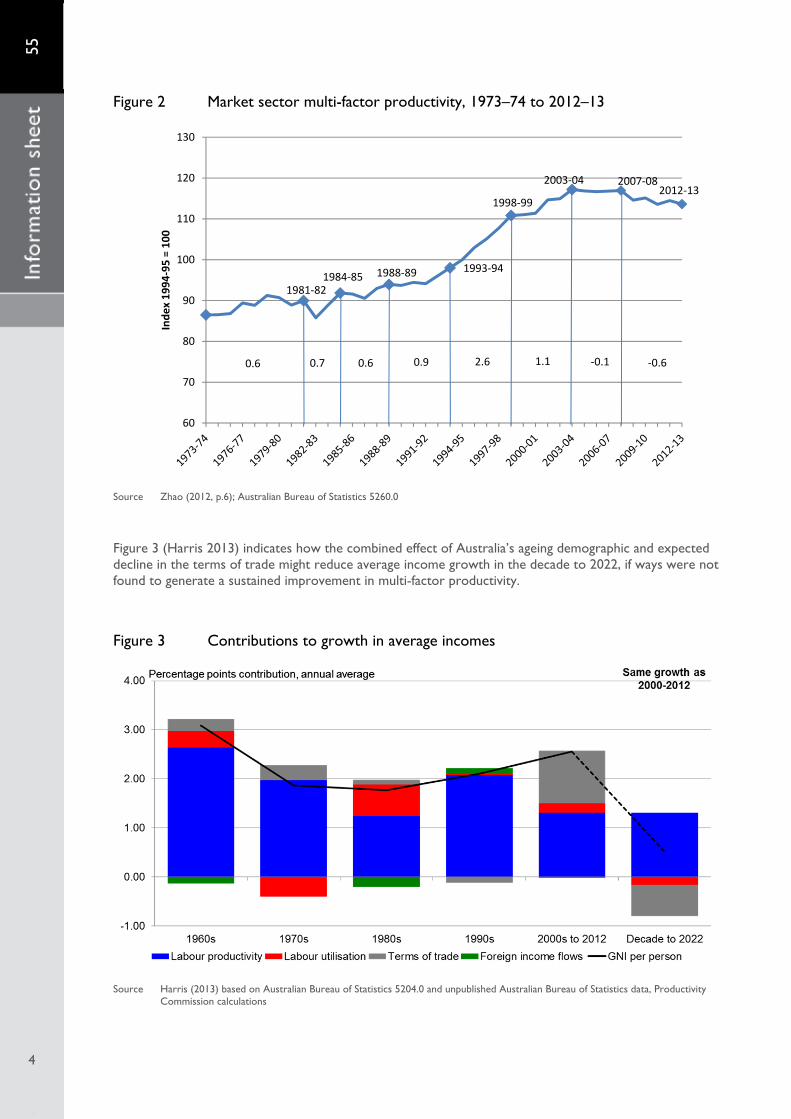
What are the key productivity trends in Australia Multi-factor productivity growth in market sectors grew rapidly in the 1990s up until 2003ndash04 when growth slowed Since 2007ndash08 aggregate multi-factor productivity has declined (Figure 2)
The 2000s in Australia was an unusual period when labour productivity growth contributed around half the growth in average incomes compared to an average of around 90 per cent over the four previous decades The Australian community experienced strong growth in incomes in the 2000s only because of the unprecedented contribution of rising terms of trade (Gruen 2012)
From March 2004 the mining boom boosted Australiarsquos terms of trade by almost 50 per cent up until the Global Financial Crisis (Figure 2) Following the Global Financial Crisis the terms of trade rebounded and reached a new record high (Parkinson 2012)
3
3
130
120 2003‐04 2007‐08
‐06
1981‐82 1984‐85 1988‐89 1993‐94
1998‐99 2012‐1
06 07 ‐0106 09 1126
Index 1994‐95
= 100
110
100
90
80
70
60
3
55
Figure 2 Market sector multi-factor productivity 1973ndash74 to 2012ndash13
Source Zhao (2012 p6) Australian Bureau of Statistics 52600
Figure 3 (Harris 2013) indicates how the combined effect of Australiarsquos ageing demographic and expected decline in the terms of trade might reduce average income growth in the decade to 2022 if ways were not found to generate a sustained improvement in multi-factor productivity
Figure 3 Contributions to growth in average incomes
Source Harris (2013) based on Australian Bureau of Statistics 52040 and unpublished Australian Bureau of Statistics data Productivity Commission calculations
4
4
A Agriculture Forestry and Fishing
‐228 ‐156 ‐43
01
71
131
239
251
264
336
638
1043
1107
‐25 0 25 50 75 100 125
I Transport Postal and Warehousing
Above averageK Financial and Insurance Services
J Information Media and Telecommunications
G Retail Trade Around market
Market sector average (12) sector averageF Wholesale Trade
E Construction
C Manufacturing Below averageD Electricity Gas Water and Waste Services
H Accommodation and Food Services
B Mining
R Arts and Recreation Services
55
Globally labour productivity growth has fallen significantly since 2008 in most OECD countries where data are available with the decline broadly spread across sectors Labour input has fallen in many countries through reduced hours per person and job cuts Multi-factor productivity also fell significantly although the OECD considered it too early to say this was a long term trend (OECD 2012 p11)
For Australia there have been increases in measured multi-factor productivity series over the most recent cycle The sources of this improvement are increases in labour productivity and changes to methodology (Australian Bureau of Statistics 2012)
Market sector labour productivity was up 29 per cent in the three quarters to December 2012 underpinning a 03 per cent improvement in multi-factor productivity in 2011ndash12
Revisions to the statistical series reduced the volatility of productivity measures and moderated the recent decline in multi-factor productivity
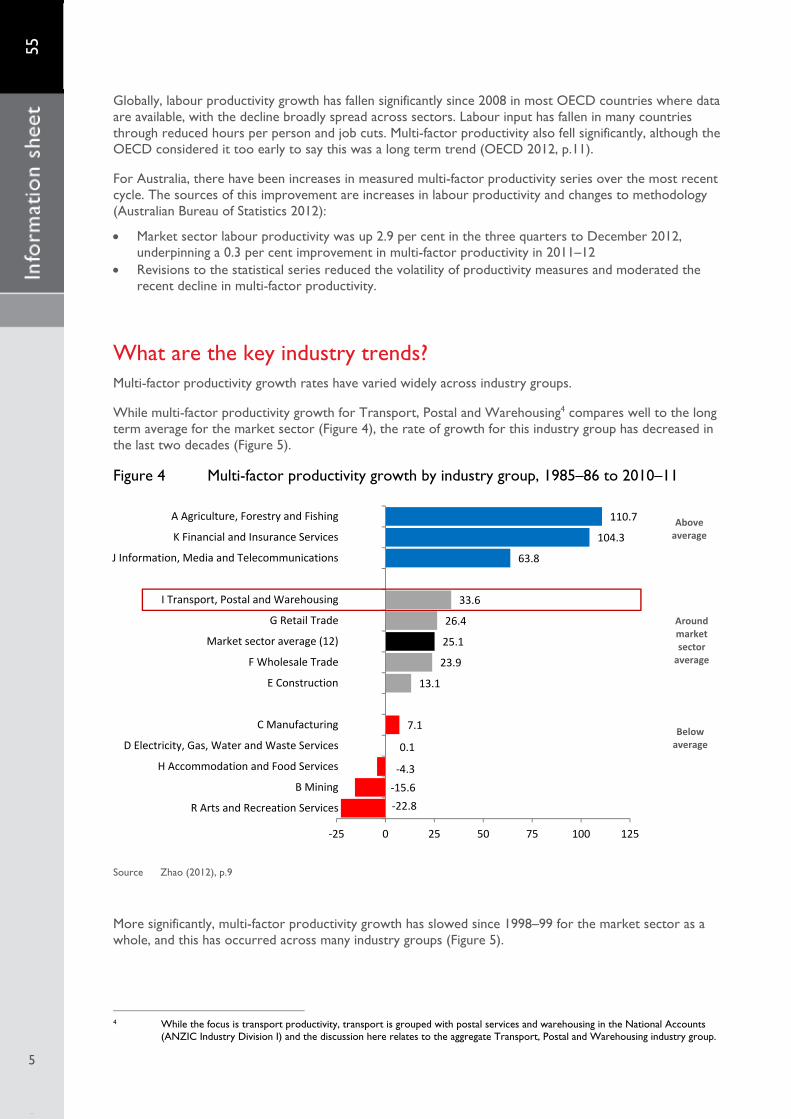
What are the key industry trends Multi-factor productivity growth rates have varied widely across industry groups
While multi-factor productivity growth for Transport Postal and Warehousing4 compares well to the long term average for the market sector (Figure 4) the rate of growth for this industry group has decreased in the last two decades (Figure 5)
Figure 4 Multi-factor productivity growth by industry group 1985ndash86 to 2010ndash11
Source Zhao (2012) p9
More significantly multi-factor productivity growth has slowed since 1998ndash99 for the market sector as a whole and this has occurred across many industry groups (Figure 5)
4 While the focus is transport productivity transport is grouped with postal services and warehousing in the National Accounts (ANZIC Industry Division I) and the discussion here relates to the aggregate Transport Postal and Warehousing industry group
5
5
55
6
6
Figure 5 Industry multi-factor productivity growth rates
Source Zhao (2012 p6)
In terms of the broader multi-factor productivity slowdown analysis by Wei and Zhao (2012) showed that
The sharp decline in industry contribution during 2003ndash04 to 2009ndash10 could be traced to the mining utility and manufacturing industries
IT capital deepening accounted for 9 per cent of the direct productivity decline in the 12 industries The authors considered this ldquoquite significantrdquo as IT capital accounted for less than 5 per cent in aggregate value added
Specific multi-factor productivity trends included
a large rise for agriculture forestry and fishing since 2007ndash08 attributed to the end of the drought large reductions in mining attributed to production lags and resource depletion however measured
productivity rises after adjustments for deposit quality and production lag and a large reduction in utility industries attributed to improvements in supply reliability for electricity and
water (Zhao 2012)
Transport industry trends For Transport Postal and Warehousing the reduction in multi-factor productivity growth rates since 2002ndash03 can be largely attributed to capital deepening (Figure 6) and the post-Global Financial Crisis increase in multi-factor productivity since 2008ndash09 can be attributed to significant increases in labour productivity
60
80
100
120
140
160 Index
1994‐95
= 100
Multifactor Labour Capital
55
Figure 6 Productivity indices for Transport Postal and Warehousing 1989ndash90 to 2012ndash13
Source Australian Bureau of Statistics 5260055002
The decline in the capital productivity index in Figure 6 is correlated with large sustained increases in private gross capital formation as shown in Figure 7 While the reasons for this increase in capital formation for Transport Postal and Warehousing are not clear it coincides with a sustained surge in capital formation in the mining industry
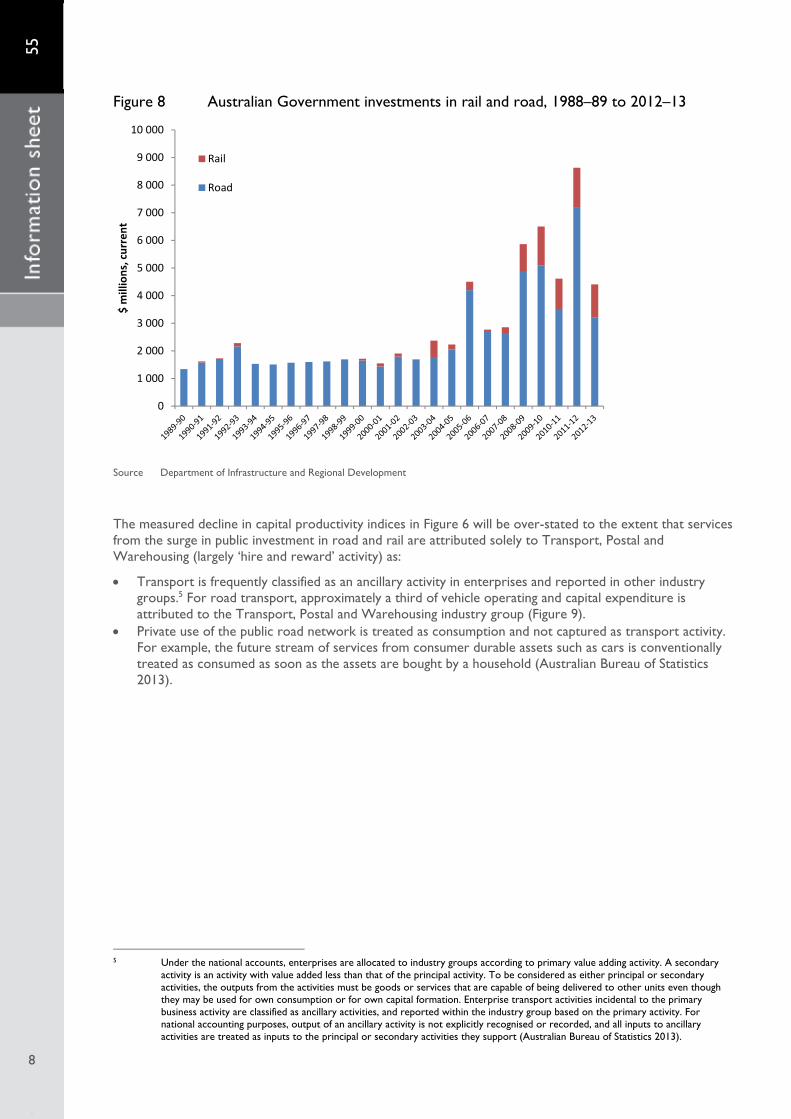
The decline in the capital productivity index for Transport Postal and Warehousing has accelerated since the start of the global financial crisis coinciding with large increases in public road and rail investments (Figure 8)
Figure 7 Gross fixed capital formation transport related 1989-90 to 2012-13
0
2000
4000
6000
8000
10000
12000
14000
16000
18000
20000
$ m
illions
current d
ollars
Private Transport postal and warehousing
Government Transport and communications
Source Australian Bureau of Statistics 52040 (Table 52 and Table 53)
7
7
0
1 000
2 000
3 000
4 000
5 000
6 000
7 000
8 000
9 000
10 000 $
millions
current
Rail
Road
55
Figure 8 Australian Government investments in rail and road 1988ndash89 to 2012ndash13
Source Department of Infrastructure and Regional Development
The measured decline in capital productivity indices in Figure 6 will be over-stated to the extent that services from the surge in public investment in road and rail are attributed solely to Transport Postal and Warehousing (largely lsquohire and rewardrsquo activity) as
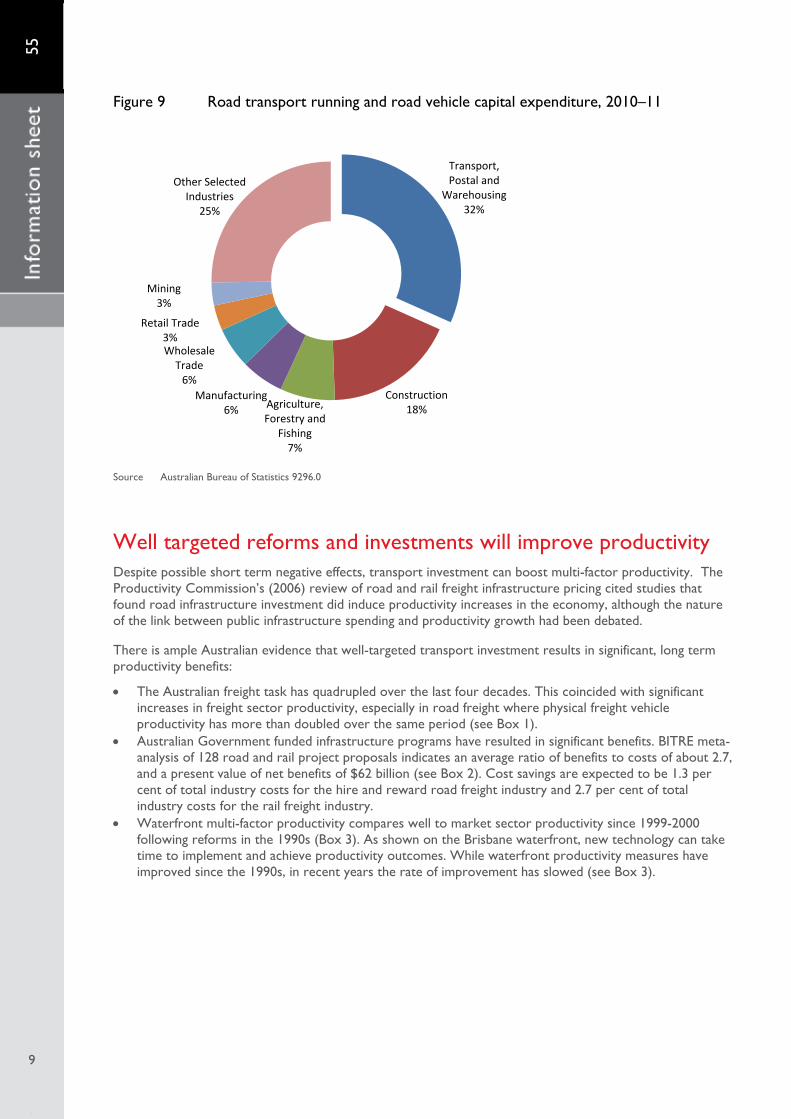
Transport is frequently classified as an ancillary activity in enterprises and reported in other industry groups5 For road transport approximately a third of vehicle operating and capital expenditure is attributed to the Transport Postal and Warehousing industry group (Figure 9)
Private use of the public road network is treated as consumption and not captured as transport activity For example the future stream of services from consumer durable assets such as cars is conventionally treated as consumed as soon as the assets are bought by a household (Australian Bureau of Statistics 2013)
5 Under the national accounts enterprises are allocated to industry groups according to primary value adding activity A secondary activity is an activity with value added less than that of the principal activity To be considered as either principal or secondary activities the outputs from the activities must be goods or services that are capable of being delivered to other units even though they may be used for own consumption or for own capital formation Enterprise transport activities incidental to the primary business activity are classified as ancillary activities and reported within the industry group based on the primary activity For national accounting purposes output of an ancillary activity is not explicitly recognised or recorded and all inputs to ancillary activities are treated as inputs to the principal or secondary activities they support (Australian Bureau of Statistics 2013)
8
8
Transport Other Selected Postal and
Industries Warehousing 25 32
ining 3
tail Trade 3 Wholesale Trade 6
Manufacturing Construction Agriculture6 18 Forestry and
Fishing 7
M
Re
55
9
9
Figure 9 Road transport running and road vehicle capital expenditure 2010ndash11
Source Australian Bureau of Statistics 92960
Well targeted reforms and investments will improve productivity Despite possible short term negative effects transport investment can boost multi-factor productivity The Productivity Commissionrsquos (2006) review of road and rail freight infrastructure pricing cited studies that found road infrastructure investment did induce productivity increases in the economy although the nature of the link between public infrastructure spending and productivity growth had been debated
There is ample Australian evidence that well-targeted transport investment results in significant long term productivity benefits
The Australian freight task has quadrupled over the last four decades This coincided with significant increases in freight sector productivity especially in road freight where physical freight vehicle productivity has more than doubled over the same period (see Box 1)
Australian Government funded infrastructure programs have resulted in significant benefits BITRE meta-analysis of 128 road and rail project proposals indicates an average ratio of benefits to costs of about 27 and a present value of net benefits of $62 billion (see Box 2) Cost savings are expected to be 13 per cent of total industry costs for the hire and reward road freight industry and 27 per cent of total industry costs for the rail freight industry
Waterfront multi-factor productivity compares well to market sector productivity since 1999-2000 following reforms in the 1990s (Box 3) As shown on the Brisbane waterfront new technology can take time to implement and achieve productivity outcomes While waterfront productivity measures have improved since the 1990s in recent years the rate of improvement has slowed (see Box 3)
55
10
10
Box 1 Truck productivity sources trends and future prospects
Total domestic road freight has grown six-fold over the last four decades from around 27 billion tonne kilometres in 1971 to over 180 billion tonne kilometres in 2007 (A tonne kilometre is one tonne of freight moved one kilometre) Over that period the average productivity of road freight vehiclesmdashthat is the freight carried per registered freight vehicle including light commercial vehiclesmdashhas more than doubled As a result the 2007 road freight task required half as many vehicles as would have been required in the absence of productivity growth
Productivity growth of heavy freight vehicles that is rigid and articulated trucks has been even more pronounced increasing almost six-fold since 1971 Articulated trucks alone have contributed over 90 per cent of the increase in total road freight vehicle productivity
The principal factors contributing to increased heavy vehicle productivity include
the introduction of and expanded network access for larger heavy vehicle combinations particularly B-double articulated trucks
progressive increases in regulated heavy vehicle mass and dimension limits strong growth in long-distance freight cumulative long-term investment in major road infrastructure particularly the realignment and
duplication of parts of the intercapital national highway network
Source BITRE Report 123 (BITRE 2011)
Box 2 Benefits of Australian Government infrastructure investment
The Australian Government spent $36 billion and the states and territories $6 billion on road and rail infrastructure between 2008ndash09 and 2013ndash14
BITRE meta-analysis of 128 road and rail project proposals indicates an average ratio of benefits to costs of about 27 and a present value of net benefits of $62 billion By 2016
For the program as whole 61 per cent of the total road cost savings and 41 per cent of total rail cost savings accrue to industry
This investment is expected to save the road freight industry $11 billion per year or 13 per cent of total road freight industry costs
Cost savings to the rail freight industry are expected to be $300 million per year by 2016 or 27 per cent of total industry costs
BITRErsquos estimates of the productivity benefits resulting from these road and rail construction projects include the expected direct savings in freight and business car travel costs
Cost savings are expected to increase steeply over time as more projects come on-line until 2016 when implementation of projects is expected to be complete After 2016 cost savings are assumed to only grow with traffic
Benefits to private car users and rail passengers while important are excluded on the grounds that they do not directly improve productivity
Source unpublished BITRE analysis
60
70
80
90
100
110
Index 2003ndash04
= 100
ABS 16 Market Sector industries hours worked basis
BITRE Waterline ship rate (TEUhr) five ports
120
55
11
11
Box 3 Waterfront productivity new technology challenge
Waterfront multi-factor productivity compares well to market sector multi-factor productivity since 1999-2000 with the latter declining since 2003ndash04 The five port ship rate (a proxy for productivity of labour and capital) improved significantly in the late 1990s through the early 2000s when it reached a plateau The ship rate increased again from 2007ndash08 then stabilised after 2010ndash11
Crane rates (TEU per hour of crane operation) have improved throughout the past 15 years The drop in productivity in Brisbane between 2006 and 2009 coincided with significant problems during and after the deployment of new automated container handling equipment which subsequently delivered productivity improvements
Five port ship rates and market sector MFP
Sources BITRE Waterline series Australian Bureau of Statistics 5260055
Crane rates at Australian ports
0
10
20
30
40
50
60
Crane
rate
(TEU
hour)
Adelaide Brisbane Fremantle Melbourne Sydney
average 377 TEUhour avg 26 TEUhr average 411 TEUhour
Source unpublished BITRE analysis of data in Waterline series
55
12
12
Major infrastructure investments can increase capacity well beyond immediate demand reducing measured productivity in the short to medium term For example major road and rail infrastructure is typically assumed to have a 30 year life The productivity benefits of well-targeted investment may not be realised until all parts of the project have been completed and forecast increases in demand have eventuated
Risks of over-capacity can be exacerbated by optimism bias6 in project assessment as it results in inaccurate forecasts and inflated benefit-cost ratios Bidding competition can further increase this risk for public-private partnerships (Lu Louis and Harvey 2011)
While there has been significant investment in rail infrastructure it may take service operators time to respond in terms of improved services The challenge in improving rail productivity is illustrated by the Melbourne rail system (see Box 4) While the reports highlight issues for passenger services these would also impact productivity on the 53 per cent of the network that is freight only or shared lines (BITRE 2013)
Box 4 Melbourne rail the challenge of improving productivity
Recent reports highlight long term issues with signal reliability on the Melbourne train network
Signal failures occur five times a day on average on Melbournes railways creating chronic delays for commuters as trains are forced to slow down or stop completely to avoid a collision There were more than 1900 signal failures in the 12 months to August 2013
A 1982 computer system Metrol controls signalling for all Metro and VLine trains in inner city areas approximately 55 per cent of the Melbourne rail network
An $88 million replacement control system Train Control and Monitoring System (TCMS) will help deliver an increase in timetabled services and dispatch train drivers more efficiently improving reliability
While TCMS will improve control of the signalling system (including inter-connections with the rest of the rail network) Metro has said that improving signal infrastructure in the field was a long-term ongoing project and that Some areas are worse than others and we are repairing equipment in order of priorityrdquo While new signalling has been installed at Dandenong and Camberwell since Metro began running the network both stations continue to experience regular signal failures
The Victorian Government is spending $45 million on a high-capacity signalling trial on the Sandringham line It has also applied for federal funding through Infrastructure Australia If successful high-capacity signalling could be installed on other lines as well
Source Signalling faults hit rail 5 times a day (The Age 24 October 2013) 20-year-old railway computers take a byte out of the past (The Age 15 October 2013)
6 Optimism bias is a systematic tendency to under-estimate costs and over-estimate benefits (or traffic) The analystrsquos belief that a project will be successful affects study results whether consciously or unconsciously This differs from strategic mis-representation which is deliberate Both have the same result inaccurate forecasts and inflated benefit-cost ratios (Lu Louis and Harvey 2011)
100
0
20
40
60
80
1995 1997 1999 2001 2003 2005 2007
Freight share
Single trailer articulated trucks B‐doubles
Other trucks
40 35
0 5 10 15 20 25 30
1995 1997 1999 2001 2003 2005 2007
Average
load
(tonnes)
Single trailer articulated trucks B‐doubles
55
13
13
Regulatory changes can realise productivity benefits Regulatory change can significantly improve the productivity of existing infrastructure For example changes to heavy vehicle regulation allowing longer and heavier vehicles on major freight roads have had major impacts on road freight productivity (see Box 5)
Box 5 Productivity impact of heavy vehicle regulatory reform
South Australia allowed higher mass limit (HML) vehicles access to South Australian highways from 1 January 2000 giving more general B-double access across the highway network
The impacts of this heavy vehicle regulatory reform are highlighted using vehicle count information collected by weigh-in-motion equipment Figure A below shows the proportion of heavy vehicles by broad vehicle configuration between 1995 and 2008 at Truro on the Sturt Highway (approximately 90 kilometres northeast of Adelaide)
Following the regulatory change new B-double category trucks achieved a freight share of over 40 per cent and this share has continued to grow
Much of the freight share captured by B-doubles was transferred from single trailer articulated trucks Figure B shows that the average payload of B-double category vehicles measured at this site was around 30 tonnes per vehicle compared with around 20 tonnes for single trailer articulated trucks
Heavy vehicle freight share and average loads Truro (SA) Sturt Highway
A Freight share B Average loads
Source BITRE unpublished data (data is missing between 1998 and 2000)
However BITRE (2011) modelling suggests future road freight productivity growth is likely to be more muted in the absence of further heavy vehicle productivity enhancing regulatory reform
Fleet-wide heavy vehicle average loads are likely to increase by less than 5 per cent between 2010 and 2030 which contrasts sharply with the 40 per cent growth in average loads over the past two decades
Increased uptake of higher productivity vehicles available under Performance Based Standards such as B-triples and AB-triples is likely to have a relatively small impact on national heavy vehicle productivity since freight that can take advantage of these larger vehicles represents less than 20 per cent of total road freight
Nevertheless these larger vehicle combinations offer important increases in heavy vehicle productivity and freight transport efficiency for transport operators producers and consumers in rural and remote areas
If measures are not found to increase productivity in the transport sector then significantly higher numbers of vehicles and drivers will be needed to meet projected future freight tasks
55
14
14
Prices need to be right to maximise productivity Key findings by the Productivity Commission (2006) were that
Current pricing and regulatory arrangements are hampering the efficient provision and productive use of road and rail infrastructure
The main efficiency losses with current road charging arrangements derive from the averaging of costs and charges and disconnect between road revenue and spending decisions These provide poor price signals and distort the incentives needed for efficient road use and provision
Developments in road pricing technology create the opportunity for more cost reflective pricing which combined with institutional changes to link road supply and demand offer the potential for substantial efficiency gains
The issues involved in heavy vehicle charging and investment reforms are complex including the need to consider changes to federal financial relations in order to implement charging reforms Governments have agreed to commence work to implement initial heavy vehicle investment and access reform initiatives while further consideration is given to next steps in the reform process 7
As transport demand grows there is a need to make timely investments to add or upgrade capacity While there are risks of over-investing or investing too soon these risks can be mitigated by better more transparent benefit-cost analysis An important step towards this end is the current revision of the National Guidelines for Transport System Management (2006)8
In addition to improving means of funding investment and maintenance of road infrastructure governments also need to consider reforms targeted at addressing issues associated with congestion There are potentially large costs of doing nothing as congestion costs can increase disproportionately once a transport network or node approaches capacity
BITRE (2007) estimates9 for road are that by 2020
The avoidable cost of road congestion in capital cities is expected to increase from $142 billion in 2012 to $204 billion
The cost of congestion in Sydney is expected to be $78 billion The cost of congestion in Melbourne is expected to be $61 billion
For road congestion is an issue in capital cities during the morning and evening peaks Commuting patterns are mostly about suburban travel 15 per cent of employment is in the CBD growing steadily in line with city population but most jobs are further out and most people are working relatively close to where they live While total road traffic is not increasing in Sydney and Melbourne traffic volumes are increasing on freeways and traffic speed is slowing in the inner city However traffic volumes are much lower than expected for Brisbane toll roads (Daley 2012)
Time of use pricing of congested roads can mitigate productivity impacts by spreading demand peaks and maximising the productivity benefits of existing infrastructure by prioritising access to high value users (that is freight over passengers and business over leisure travel)
Daley (2012) estimates gains from congestion pricing in cities of $2 billion per annum assuming a reduction in congestion of 30 per cent due to congestion pricing10 The impact of congestion pricing depends on local reaction this remains untested in Australia
While congestion has significant social impacts costs are incurred by all road users including private users and only part of total congestion cost can be attributed to reduced productivity Without significant reform BITRE estimates that business vehicle use will account for over 50 per cent of total delay costs in capital cities by 2020 (BITRE 2007)
7 See Transport and Infrastructure Council 23 May communique available at httpwwwtransportinfrastructurecouncilgovaucommuniquefilesCouncil_1st_Communique_23_May_2014_V1pdf
8 See httpwwwaustroadscomauplanning-and-evaluationngtsm-revision 9 In 2005 dollars Updated BITRE estimates of future road congestion in capital cities are expected to be completed in early 2014 10 Estimate cost of avoidable congestion in 2007 with a GDP deflator to 2022 and assuming no growth in road traffic Future benefits
of congestion pricing depend on traffic growth which depends on lsquounknownsrsquo such as energy and petrol prices public transport investment public transport patronage and reforms to other taxes such as fringe benefits tax
55
Improving productivity in the transport sector Parham (2012) identified four economy-wide sources of productivity growth
Creative destruction of firms Non-market sector Regulatory reforms More effective targeting of investments
Of these identified sources regulatory reforms and more effective targeting of investments were expected to be the key to future transport productivity growth
Measures to improve productivity operate in three main ways
Better use of existing inputs using existing technology A shift in technological knowledge and capabilities can shift production abilities Changes in operating circumstances affect input or output use (Productivity Commission 2006)
Banks (2012) identified areas that remained crucial to future productivity growth for transport infrastructure
Undertake transparent cost-benefit analysis of all options prior to any major public infrastructure investment and when determining quality or environmental standards o Public investments are otherwise prone to lsquooptimism biasrsquo and a confusion between political and
economic ends o Poor infrastructure decisions have a high opportunity cost and can be a long-term drag on the
economyrsquos productivity Extend use of cost-reflective pricing including to manage peak demand or supply disruptions
o Aversion to price rises even where needed to balance supply and demand can suppress or distort investment and may result in higher prices in the long term
Introduce institutional reforms for roads to connect revenue with spending decisions while progressively moving to location-based road pricing particularly for freight
The Productivity Commissionrsquos (2014) draft report on Public Infrastructure states that the overriding message is the need for a comprehensive overhaul of processes in the assessment and development of public infrastructure projects
It is essential to reform governance and institutional arrangements for public infrastructure to promote better decision making in project selection funding financing and the delivery of infrastructure services
Well-designed user charges should be used to the fullest extent that can be justified However governments will have to at least partly fund some infrastructure projects and address equity issues
Significant road pricing and institutional arrangements are proposed to create more direct links to road users and to take advantage of advances in vehicle technology
15
15
55
16
16
Priority measures to improve productivity
Better more transparent cost benefit analysis The key to ensuring infrastructure delivers productivity benefits is getting the right investment decisions with the highest cost benefit ratios (Sims 2013)
Harris (2013) states that Australia can have a bias to large land transport projects over the more targeted smaller ones with higher cost benefit ratios
Maintenance tends to be underfunded relative to investment because of the smaller less obvious nature of maintenance works relative to new infrastructure (Semmens 2006 Zeitlow 2006 cited in Harvey 2012) But deferring maintenance in the short term can be expensive in the long term (Harvey 2012)
The productivity of infrastructure investments can be improved by
Better more transparent cost benefit analysis The current revision of the National Guidelines for Transport System Management (2006) is an important step towards this end11
Ensure whole of life costs are considered including future maintenance need
Cost-reflective heavy vehicle charges and investment that reflects future needs For investment to be efficient it needs to be made according to appropriate regulatory rules and standards (Sims 2013)
The Productivity Commission (2006) found there was no mechanism to approach users to suggest they pay for road usage in return for particular roads being built or upgraded and that the National Transport Commission had no ability consider future investment needs either generally or in the case of specific roads
Charges are still set by Transport Ministers following advice from the National Transport Commission using principles that result in a focus on past expenditures rather than future expenditure needs
A key issue for operators is that freight transport link roads can have limits on use by heavy vehicles This can reflect the fact that the trucks that use the road are not charged sufficiently to cover the damage they do to the road and if they were the funds raised would not go to those responsible for maintaining or upgrading the road (Sims 2013)
Important changes that would improve freight productivity include
Linking user charging directly with road planning investment and maintenance A locational link between heavy vehicle charges and the funding of road improvements to key freight
transport link roads to increase heavy vehicle access Heavy vehicle charging that has a means of allocating funds for future infrastructure needs
11 See httpwwwaustroadscomauplanning-and-evaluationngtsm-revision
55
17
17
Variable tolling of major urban roads The right price signals and incentives are required to make the best use of existing and new infrastructure (Sims 2013)
Congestion costs that are not reflected in time of use or traffic volume related pricing will be indirectly reflected in increased end user demand
Daley (2012) recommended time of day road pricing to reduce congestion with a variable road pricing scheme that charges more at rush hour and other congested times Good scheme design would be essential and must consider administrative costs complementary investments (for example public transport) equity concerns and the right prices to achieve a significant reduction in congestion
Systems that allow real time access (for example HOT lanes) have already been implemented overseas
Time of use pricing of congested roads can mitigate productivity impacts by spreading demand peaks and maximising the productivity benefits of existing infrastructure by prioritising access to high value users (that is freight over passengers and business over leisure travel)
The productivity of road networks could be improved by
Implementing city-wide variable tolling systems for major urban roads that allow consistent time of day and volume related tolling
Further application of technological improvements Intelligent transport systems (ITS) have the potential to deliver significant safety environmental and efficiency benefits to the Australian transport system (SCOTI 2012)
Effective ITS projects can generate large benefits for small costs when compared to lsquotraditionalrsquo infrastructure investment For example the Monash Freeway coordinated ramp metering system increased the roadrsquos peak throughput by 30 per cent a $1 million pilot program had an economic payback period of just twelve days (Gaffney 2010)
Australia is an innovator in the global ITS market The SCATS adaptive signal control system is extensively deployed in Australia and internationally (Stevanovic 2010) STREAMS integrated traffic management is widely used in Australia and we are a world leader in interoperable electronic tolling (ITSA 2012)
However more could be done to encourage the development and deployment of productivity-enhancing ITS solutions on Australian roads
Measures that could improve productivity by facilitating technological improvements include
Development of economic evaluation guidelines and modelling techniques to enable effective comparison of ITS and traditional infrastructure investment opportunities
Encouragement of pilot deployments of new ITS technologies in Australia including full economic appraisals and comparative analyses
55
18
18
References Australian Bureau of Statistics 2007 Labour Statistics Concepts Sources and Methods 6102055001 19 April
Australian Bureau of Statistics 2012 Estimates of Industry Multi-factor Productivity Australia Detailed Productivity Estimates 5260055002 7 December
Australian Bureau of Statistics 2013 Australian System of National Accounts Concepts Sources and Methods Australia 2013 Cat No 52160 20 December
Banks G 2012 Productivity policies the lsquoto dorsquo list address to the Economic and Social Outlook Conference Securing the Future in Melbourne 1 November
BITRE 2007 Estimating urban traffic and congestion cost trends for Australian cities Working Paper 71
BITRE 2013 Australian Infrastructure Statistics Yearbook 2013
Daley J 2012 Game-changers Economic reform priorities for Australia supporting analysis Grattan Institute June
Gaffney J 2010 Monash ndash CityLink ndash West Gate Upgrade Project presentation to the 24th ARRB Conference 12ndash15 October
Gruen D 2012 The Importance of Productivity Productivity Commission-Australian Bureau of Statistics Productivity Perspectives Conference Canberra 20 November
Harris P 2013 Productivity and the National Income Outlook Speech to the Trans-Tasman Business Circle Productivity Series dinner Perth 18 September
Harvey MO 2012 Optimising Road Maintenance Discussion Paper No 2012ndash12 Prepared for the Roundtable on Sustainable Road Funding 25-26 October
Lu W Louis P and Harvey M 2011 Traffic forecasting performance of PPP and toll roads literature review Patronage Forecasting Forum BITRE
Productivity Commission 2006 Road and Rail Freight Infrastructure Pricing Inquiry Overview No 41 22 December 2006
Productivity Commission 2014 Public Infrastructure Draft Inquiry Report Canberra
Parham D 2012 Australiarsquos productivity growth slump signs of a crisis adjustment or both Productivity Commission Visiting Researcher paper April
Parkinson M 2012 Macroeconomic policy for changing circumstances Annual post-Budget address to the Australian Business Economists Sydney 15 May
SCOTI 2012 Policy Framework for Intelligent Transport Systems in Australia Canberra March 2012
Sims R 2013 A future regulatory outlook speech to the SMART Inaugural International Symposium for Next Generation Infrastructure 30 September (httpwwwacccgovauspeecha-future-regulatory-outlook)
Stevanovic A 2010 Adaptive Traffic Control Systems Domestic and Foreign State of Practice National Cooperative Highway Research Program (NCHRP) Synthesis 403 Transportation Research Board 2010
Transport and Infrastructure Council 2014 Communiqueacute First meeting held in Alice Springs 23 May
Wei H and Zhao P 2012 The industry sources of Australiarsquos productivity slowdown Paper presented at the Productivity Commission-ABSrsquo Productivity Perspectives Conference 2012 20 November
Zhao S 2012 An overview of Australiarsquos productivity performance Paper presented at the Productivity Commission-ABSrsquo Productivity Perspectives Conference 2012 20 November
copy Commonwealth of Australia 2014
ISSN 1440-9593
ISBN 978-1-922205-77-3
July 2014
Creative Commons Attribution 30 Australia Licence is a standard form licence agreement that allows you to copy communicate and adapt this publication provided that you attribute the work to the Commonwealth and abide by the other licence terms A summary of the licence terms is available from httpcreativecommonsorglicensesby30audeeden
The full licence terms are available from httpcreativecommonsorglicensesby30aulegalcode
This publication should be attributed in the following way Bureau of Infrastructure Transport and Regional Economics (BITRE) 2014 Infrastructure Transport and Productivity Information Sheet 55 July Canberra
Acknowledgement
Cover image Iron ore train Newman Western Australia Reproduced with the permission of BHP Billiton
Use of the Coat of Arms
The Department of the Prime Minister and Cabinet sets the terms under which the Coat of Arms is used Please refer to the Departmentrsquos Commonwealth Coat of Arms and Government Branding web page httpwwwdpmcgovauguidelinesindexcfmbrand and in particular the Guidelines on the use of the Commonwealth Coat of Arms publication
Contact us
This publication is available in PDF format All other rights are reserved including in relation to any Departmental logos or trade marks which may exist For enquiries regarding the licence and any use of this publication please contact
Department of Infrastructure and Regional Development Bureau of Infrastructure Transport and Regional Economics (BITRE) GPO Box 501 Canberra ACT 2601 Australia
What is productivity Productivity is the efficiency of transforming inputs (capital labour) into outputs (goods and services) The two main measures are labour productivity and multi-factor productivity
Labour productivity is a partial measure calculated as real gross domestic product (GDP) or gross value added per unit of labour (commonly proxied by hours worked) Multi-factor productivity is a more complete measure calculated as real GDP or gross value added per unit of combined labour and capital inputs
In order to interpret productivity trends it is important to distinguish these productivity concepts from the measured productivity indices While productivity statistics aim to measure technical progress or the efficiency of production in practice they measure the difference between the growth in the volume of output and the growth in the volume of inputs which reflects more than just technical progress1
As measured in the growth accounting framework growth in labour productivity can be decomposed into capital deepening (or capital intensity) labour quality and multifactor productivity2 Growth in capital deepening is an important driver alongside multifactor productivity of labour productivity (Australian Bureau of Statistics 2013)
While it does not make sense to discuss trends in measured labour productivity in isolation from changes in the productivity of capital capital productivity indices do not produce useful interpretable measures of the efficient use of capital For this reason the focus is usually labour productivity for which there are clear theoretical interpretations
The focus on measured inputs and outputs also has implications for interpreting productivity trends in the non-market sector The market sector accounts for around three quarters to four fifths of the economy The non-market sectormdashnow around a quarter of employment and a fifth of outputmdashis less well measured (Gruen 2012) In particular outputs in the services sector and non-traded services provided by government are not well measured
Interpreting and measuring productivity trends over time is therefore not straightforward because
External factors such as resource depletion and weather can affect measured productivity Changes in capacity utilisation can significantly affect short term measures Large increases in the capital stock can significantly reduce short term measures of multi-factor
productivity Changes in the quality of labour are difficult to measure3
A range of other technical issues such as the treatment of financial assets can affect productivity measures
Changes in productivity methodology can result in significant revisions to historical series
1 Factors other than technical progress include economies of scale reallocation of inputs changes in human capital variations in capacity utilisation climatic events and measurement error (Australian Bureau of Statistics 2013 p422)
2 Increased capital deepening refers to increases in the capital to labour ratio This means that on average each unit of labour has more capital to work with to produce output so is an indicator of ability to augment labour Labour saving practices result in increased capital deepening which is often associated with a decline in capital productivity (Australian Bureau of Statistics 2013)
3 While desirable to reflect changes in measures of labour input such as the proportion of skilled to unskilled employees data limitations mean the most common National Accounts labour measure is hours worked by total employed people (Australian Bureau of Statistics 2007)
55
Why is it important to increase future productivity Productivity like production matters not for its own sake but because the growth it can generate results in the higher incomes and government revenues needed to raise living standards and rectify disadvantage (Banks 2012)
Productivity is a key determinant of the welfare of Australians because it has been an important source of income growth Other sources of income growth include the terms of trade and utilisation of labour An expected decline in Australiarsquos terms of trade and ageing of the population are both likely to work against future growth in incomes (Figure 1)
Figure 1 Contributions to growth in average incomes
Source Gruen (2012)
While commodity prices are expected to remain elevated compared to history they are expected to trend lower over time as global supply expands (Gruen 2012)
The ageing of the Australian population is also anticipated to detract from labour force participation and growth in output and incomes per person as the baby boomer generation moves into retirement If this is the case Australia will need to rely on productivity improvement to again become the dominant contributor to growth in incomes (Gruen 2012)
What are the key productivity trends in Australia Multi-factor productivity growth in market sectors grew rapidly in the 1990s up until 2003ndash04 when growth slowed Since 2007ndash08 aggregate multi-factor productivity has declined (Figure 2)
The 2000s in Australia was an unusual period when labour productivity growth contributed around half the growth in average incomes compared to an average of around 90 per cent over the four previous decades The Australian community experienced strong growth in incomes in the 2000s only because of the unprecedented contribution of rising terms of trade (Gruen 2012)
From March 2004 the mining boom boosted Australiarsquos terms of trade by almost 50 per cent up until the Global Financial Crisis (Figure 2) Following the Global Financial Crisis the terms of trade rebounded and reached a new record high (Parkinson 2012)
3
3
130
120 2003‐04 2007‐08
‐06
1981‐82 1984‐85 1988‐89 1993‐94
1998‐99 2012‐1
06 07 ‐0106 09 1126
Index 1994‐95
= 100
110
100
90
80
70
60
3
55
Figure 2 Market sector multi-factor productivity 1973ndash74 to 2012ndash13
Source Zhao (2012 p6) Australian Bureau of Statistics 52600
Figure 3 (Harris 2013) indicates how the combined effect of Australiarsquos ageing demographic and expected decline in the terms of trade might reduce average income growth in the decade to 2022 if ways were not found to generate a sustained improvement in multi-factor productivity
Figure 3 Contributions to growth in average incomes
Source Harris (2013) based on Australian Bureau of Statistics 52040 and unpublished Australian Bureau of Statistics data Productivity Commission calculations
4
4
A Agriculture Forestry and Fishing
‐228 ‐156 ‐43
01
71
131
239
251
264
336
638
1043
1107
‐25 0 25 50 75 100 125
I Transport Postal and Warehousing
Above averageK Financial and Insurance Services
J Information Media and Telecommunications
G Retail Trade Around market
Market sector average (12) sector averageF Wholesale Trade
E Construction
C Manufacturing Below averageD Electricity Gas Water and Waste Services
H Accommodation and Food Services
B Mining
R Arts and Recreation Services
55
Globally labour productivity growth has fallen significantly since 2008 in most OECD countries where data are available with the decline broadly spread across sectors Labour input has fallen in many countries through reduced hours per person and job cuts Multi-factor productivity also fell significantly although the OECD considered it too early to say this was a long term trend (OECD 2012 p11)
For Australia there have been increases in measured multi-factor productivity series over the most recent cycle The sources of this improvement are increases in labour productivity and changes to methodology (Australian Bureau of Statistics 2012)
Market sector labour productivity was up 29 per cent in the three quarters to December 2012 underpinning a 03 per cent improvement in multi-factor productivity in 2011ndash12
Revisions to the statistical series reduced the volatility of productivity measures and moderated the recent decline in multi-factor productivity
What are the key industry trends Multi-factor productivity growth rates have varied widely across industry groups
While multi-factor productivity growth for Transport Postal and Warehousing4 compares well to the long term average for the market sector (Figure 4) the rate of growth for this industry group has decreased in the last two decades (Figure 5)
Figure 4 Multi-factor productivity growth by industry group 1985ndash86 to 2010ndash11
Source Zhao (2012) p9
More significantly multi-factor productivity growth has slowed since 1998ndash99 for the market sector as a whole and this has occurred across many industry groups (Figure 5)
4 While the focus is transport productivity transport is grouped with postal services and warehousing in the National Accounts (ANZIC Industry Division I) and the discussion here relates to the aggregate Transport Postal and Warehousing industry group
5
5
55
6
6
Figure 5 Industry multi-factor productivity growth rates
Source Zhao (2012 p6)
In terms of the broader multi-factor productivity slowdown analysis by Wei and Zhao (2012) showed that
The sharp decline in industry contribution during 2003ndash04 to 2009ndash10 could be traced to the mining utility and manufacturing industries
IT capital deepening accounted for 9 per cent of the direct productivity decline in the 12 industries The authors considered this ldquoquite significantrdquo as IT capital accounted for less than 5 per cent in aggregate value added
Specific multi-factor productivity trends included
a large rise for agriculture forestry and fishing since 2007ndash08 attributed to the end of the drought large reductions in mining attributed to production lags and resource depletion however measured
productivity rises after adjustments for deposit quality and production lag and a large reduction in utility industries attributed to improvements in supply reliability for electricity and
water (Zhao 2012)
Transport industry trends For Transport Postal and Warehousing the reduction in multi-factor productivity growth rates since 2002ndash03 can be largely attributed to capital deepening (Figure 6) and the post-Global Financial Crisis increase in multi-factor productivity since 2008ndash09 can be attributed to significant increases in labour productivity
60
80
100
120
140
160 Index
1994‐95
= 100
Multifactor Labour Capital
55
Figure 6 Productivity indices for Transport Postal and Warehousing 1989ndash90 to 2012ndash13
Source Australian Bureau of Statistics 5260055002
The decline in the capital productivity index in Figure 6 is correlated with large sustained increases in private gross capital formation as shown in Figure 7 While the reasons for this increase in capital formation for Transport Postal and Warehousing are not clear it coincides with a sustained surge in capital formation in the mining industry
The decline in the capital productivity index for Transport Postal and Warehousing has accelerated since the start of the global financial crisis coinciding with large increases in public road and rail investments (Figure 8)
Figure 7 Gross fixed capital formation transport related 1989-90 to 2012-13
0
2000
4000
6000
8000
10000
12000
14000
16000
18000
20000
$ m
illions
current d
ollars
Private Transport postal and warehousing
Government Transport and communications
Source Australian Bureau of Statistics 52040 (Table 52 and Table 53)
7
7
0
1 000
2 000
3 000
4 000
5 000
6 000
7 000
8 000
9 000
10 000 $
millions
current
Rail
Road
55
Figure 8 Australian Government investments in rail and road 1988ndash89 to 2012ndash13
Source Department of Infrastructure and Regional Development
The measured decline in capital productivity indices in Figure 6 will be over-stated to the extent that services from the surge in public investment in road and rail are attributed solely to Transport Postal and Warehousing (largely lsquohire and rewardrsquo activity) as
Transport is frequently classified as an ancillary activity in enterprises and reported in other industry groups5 For road transport approximately a third of vehicle operating and capital expenditure is attributed to the Transport Postal and Warehousing industry group (Figure 9)
Private use of the public road network is treated as consumption and not captured as transport activity For example the future stream of services from consumer durable assets such as cars is conventionally treated as consumed as soon as the assets are bought by a household (Australian Bureau of Statistics 2013)
5 Under the national accounts enterprises are allocated to industry groups according to primary value adding activity A secondary activity is an activity with value added less than that of the principal activity To be considered as either principal or secondary activities the outputs from the activities must be goods or services that are capable of being delivered to other units even though they may be used for own consumption or for own capital formation Enterprise transport activities incidental to the primary business activity are classified as ancillary activities and reported within the industry group based on the primary activity For national accounting purposes output of an ancillary activity is not explicitly recognised or recorded and all inputs to ancillary activities are treated as inputs to the principal or secondary activities they support (Australian Bureau of Statistics 2013)
8
8
Transport Other Selected Postal and
Industries Warehousing 25 32
ining 3
tail Trade 3 Wholesale Trade 6
Manufacturing Construction Agriculture6 18 Forestry and
Fishing 7
M
Re
55
9
9
Figure 9 Road transport running and road vehicle capital expenditure 2010ndash11
Source Australian Bureau of Statistics 92960
Well targeted reforms and investments will improve productivity Despite possible short term negative effects transport investment can boost multi-factor productivity The Productivity Commissionrsquos (2006) review of road and rail freight infrastructure pricing cited studies that found road infrastructure investment did induce productivity increases in the economy although the nature of the link between public infrastructure spending and productivity growth had been debated
There is ample Australian evidence that well-targeted transport investment results in significant long term productivity benefits
The Australian freight task has quadrupled over the last four decades This coincided with significant increases in freight sector productivity especially in road freight where physical freight vehicle productivity has more than doubled over the same period (see Box 1)
Australian Government funded infrastructure programs have resulted in significant benefits BITRE meta-analysis of 128 road and rail project proposals indicates an average ratio of benefits to costs of about 27 and a present value of net benefits of $62 billion (see Box 2) Cost savings are expected to be 13 per cent of total industry costs for the hire and reward road freight industry and 27 per cent of total industry costs for the rail freight industry
Waterfront multi-factor productivity compares well to market sector productivity since 1999-2000 following reforms in the 1990s (Box 3) As shown on the Brisbane waterfront new technology can take time to implement and achieve productivity outcomes While waterfront productivity measures have improved since the 1990s in recent years the rate of improvement has slowed (see Box 3)
55
10
10
Box 1 Truck productivity sources trends and future prospects
Total domestic road freight has grown six-fold over the last four decades from around 27 billion tonne kilometres in 1971 to over 180 billion tonne kilometres in 2007 (A tonne kilometre is one tonne of freight moved one kilometre) Over that period the average productivity of road freight vehiclesmdashthat is the freight carried per registered freight vehicle including light commercial vehiclesmdashhas more than doubled As a result the 2007 road freight task required half as many vehicles as would have been required in the absence of productivity growth
Productivity growth of heavy freight vehicles that is rigid and articulated trucks has been even more pronounced increasing almost six-fold since 1971 Articulated trucks alone have contributed over 90 per cent of the increase in total road freight vehicle productivity
The principal factors contributing to increased heavy vehicle productivity include
the introduction of and expanded network access for larger heavy vehicle combinations particularly B-double articulated trucks
progressive increases in regulated heavy vehicle mass and dimension limits strong growth in long-distance freight cumulative long-term investment in major road infrastructure particularly the realignment and
duplication of parts of the intercapital national highway network
Source BITRE Report 123 (BITRE 2011)
Box 2 Benefits of Australian Government infrastructure investment
The Australian Government spent $36 billion and the states and territories $6 billion on road and rail infrastructure between 2008ndash09 and 2013ndash14
BITRE meta-analysis of 128 road and rail project proposals indicates an average ratio of benefits to costs of about 27 and a present value of net benefits of $62 billion By 2016
For the program as whole 61 per cent of the total road cost savings and 41 per cent of total rail cost savings accrue to industry
This investment is expected to save the road freight industry $11 billion per year or 13 per cent of total road freight industry costs
Cost savings to the rail freight industry are expected to be $300 million per year by 2016 or 27 per cent of total industry costs
BITRErsquos estimates of the productivity benefits resulting from these road and rail construction projects include the expected direct savings in freight and business car travel costs
Cost savings are expected to increase steeply over time as more projects come on-line until 2016 when implementation of projects is expected to be complete After 2016 cost savings are assumed to only grow with traffic
Benefits to private car users and rail passengers while important are excluded on the grounds that they do not directly improve productivity
Source unpublished BITRE analysis
60
70
80
90
100
110
Index 2003ndash04
= 100
ABS 16 Market Sector industries hours worked basis
BITRE Waterline ship rate (TEUhr) five ports
120
55
11
11
Box 3 Waterfront productivity new technology challenge
Waterfront multi-factor productivity compares well to market sector multi-factor productivity since 1999-2000 with the latter declining since 2003ndash04 The five port ship rate (a proxy for productivity of labour and capital) improved significantly in the late 1990s through the early 2000s when it reached a plateau The ship rate increased again from 2007ndash08 then stabilised after 2010ndash11
Crane rates (TEU per hour of crane operation) have improved throughout the past 15 years The drop in productivity in Brisbane between 2006 and 2009 coincided with significant problems during and after the deployment of new automated container handling equipment which subsequently delivered productivity improvements
Five port ship rates and market sector MFP
Sources BITRE Waterline series Australian Bureau of Statistics 5260055
Crane rates at Australian ports
0
10
20
30
40
50
60
Crane
rate
(TEU
hour)
Adelaide Brisbane Fremantle Melbourne Sydney
average 377 TEUhour avg 26 TEUhr average 411 TEUhour
Source unpublished BITRE analysis of data in Waterline series
55
12
12
Major infrastructure investments can increase capacity well beyond immediate demand reducing measured productivity in the short to medium term For example major road and rail infrastructure is typically assumed to have a 30 year life The productivity benefits of well-targeted investment may not be realised until all parts of the project have been completed and forecast increases in demand have eventuated
Risks of over-capacity can be exacerbated by optimism bias6 in project assessment as it results in inaccurate forecasts and inflated benefit-cost ratios Bidding competition can further increase this risk for public-private partnerships (Lu Louis and Harvey 2011)
While there has been significant investment in rail infrastructure it may take service operators time to respond in terms of improved services The challenge in improving rail productivity is illustrated by the Melbourne rail system (see Box 4) While the reports highlight issues for passenger services these would also impact productivity on the 53 per cent of the network that is freight only or shared lines (BITRE 2013)
Box 4 Melbourne rail the challenge of improving productivity
Recent reports highlight long term issues with signal reliability on the Melbourne train network
Signal failures occur five times a day on average on Melbournes railways creating chronic delays for commuters as trains are forced to slow down or stop completely to avoid a collision There were more than 1900 signal failures in the 12 months to August 2013
A 1982 computer system Metrol controls signalling for all Metro and VLine trains in inner city areas approximately 55 per cent of the Melbourne rail network
An $88 million replacement control system Train Control and Monitoring System (TCMS) will help deliver an increase in timetabled services and dispatch train drivers more efficiently improving reliability
While TCMS will improve control of the signalling system (including inter-connections with the rest of the rail network) Metro has said that improving signal infrastructure in the field was a long-term ongoing project and that Some areas are worse than others and we are repairing equipment in order of priorityrdquo While new signalling has been installed at Dandenong and Camberwell since Metro began running the network both stations continue to experience regular signal failures
The Victorian Government is spending $45 million on a high-capacity signalling trial on the Sandringham line It has also applied for federal funding through Infrastructure Australia If successful high-capacity signalling could be installed on other lines as well
Source Signalling faults hit rail 5 times a day (The Age 24 October 2013) 20-year-old railway computers take a byte out of the past (The Age 15 October 2013)
6 Optimism bias is a systematic tendency to under-estimate costs and over-estimate benefits (or traffic) The analystrsquos belief that a project will be successful affects study results whether consciously or unconsciously This differs from strategic mis-representation which is deliberate Both have the same result inaccurate forecasts and inflated benefit-cost ratios (Lu Louis and Harvey 2011)
100
0
20
40
60
80
1995 1997 1999 2001 2003 2005 2007
Freight share
Single trailer articulated trucks B‐doubles
Other trucks
40 35
0 5 10 15 20 25 30
1995 1997 1999 2001 2003 2005 2007
Average
load
(tonnes)
Single trailer articulated trucks B‐doubles
55
13
13
Regulatory changes can realise productivity benefits Regulatory change can significantly improve the productivity of existing infrastructure For example changes to heavy vehicle regulation allowing longer and heavier vehicles on major freight roads have had major impacts on road freight productivity (see Box 5)
Box 5 Productivity impact of heavy vehicle regulatory reform
South Australia allowed higher mass limit (HML) vehicles access to South Australian highways from 1 January 2000 giving more general B-double access across the highway network
The impacts of this heavy vehicle regulatory reform are highlighted using vehicle count information collected by weigh-in-motion equipment Figure A below shows the proportion of heavy vehicles by broad vehicle configuration between 1995 and 2008 at Truro on the Sturt Highway (approximately 90 kilometres northeast of Adelaide)
Following the regulatory change new B-double category trucks achieved a freight share of over 40 per cent and this share has continued to grow
Much of the freight share captured by B-doubles was transferred from single trailer articulated trucks Figure B shows that the average payload of B-double category vehicles measured at this site was around 30 tonnes per vehicle compared with around 20 tonnes for single trailer articulated trucks
Heavy vehicle freight share and average loads Truro (SA) Sturt Highway
A Freight share B Average loads
Source BITRE unpublished data (data is missing between 1998 and 2000)
However BITRE (2011) modelling suggests future road freight productivity growth is likely to be more muted in the absence of further heavy vehicle productivity enhancing regulatory reform
Fleet-wide heavy vehicle average loads are likely to increase by less than 5 per cent between 2010 and 2030 which contrasts sharply with the 40 per cent growth in average loads over the past two decades
Increased uptake of higher productivity vehicles available under Performance Based Standards such as B-triples and AB-triples is likely to have a relatively small impact on national heavy vehicle productivity since freight that can take advantage of these larger vehicles represents less than 20 per cent of total road freight
Nevertheless these larger vehicle combinations offer important increases in heavy vehicle productivity and freight transport efficiency for transport operators producers and consumers in rural and remote areas
If measures are not found to increase productivity in the transport sector then significantly higher numbers of vehicles and drivers will be needed to meet projected future freight tasks
55
14
14
Prices need to be right to maximise productivity Key findings by the Productivity Commission (2006) were that
Current pricing and regulatory arrangements are hampering the efficient provision and productive use of road and rail infrastructure
The main efficiency losses with current road charging arrangements derive from the averaging of costs and charges and disconnect between road revenue and spending decisions These provide poor price signals and distort the incentives needed for efficient road use and provision
Developments in road pricing technology create the opportunity for more cost reflective pricing which combined with institutional changes to link road supply and demand offer the potential for substantial efficiency gains
The issues involved in heavy vehicle charging and investment reforms are complex including the need to consider changes to federal financial relations in order to implement charging reforms Governments have agreed to commence work to implement initial heavy vehicle investment and access reform initiatives while further consideration is given to next steps in the reform process 7
As transport demand grows there is a need to make timely investments to add or upgrade capacity While there are risks of over-investing or investing too soon these risks can be mitigated by better more transparent benefit-cost analysis An important step towards this end is the current revision of the National Guidelines for Transport System Management (2006)8
In addition to improving means of funding investment and maintenance of road infrastructure governments also need to consider reforms targeted at addressing issues associated with congestion There are potentially large costs of doing nothing as congestion costs can increase disproportionately once a transport network or node approaches capacity
BITRE (2007) estimates9 for road are that by 2020
The avoidable cost of road congestion in capital cities is expected to increase from $142 billion in 2012 to $204 billion
The cost of congestion in Sydney is expected to be $78 billion The cost of congestion in Melbourne is expected to be $61 billion
For road congestion is an issue in capital cities during the morning and evening peaks Commuting patterns are mostly about suburban travel 15 per cent of employment is in the CBD growing steadily in line with city population but most jobs are further out and most people are working relatively close to where they live While total road traffic is not increasing in Sydney and Melbourne traffic volumes are increasing on freeways and traffic speed is slowing in the inner city However traffic volumes are much lower than expected for Brisbane toll roads (Daley 2012)
Time of use pricing of congested roads can mitigate productivity impacts by spreading demand peaks and maximising the productivity benefits of existing infrastructure by prioritising access to high value users (that is freight over passengers and business over leisure travel)
Daley (2012) estimates gains from congestion pricing in cities of $2 billion per annum assuming a reduction in congestion of 30 per cent due to congestion pricing10 The impact of congestion pricing depends on local reaction this remains untested in Australia
While congestion has significant social impacts costs are incurred by all road users including private users and only part of total congestion cost can be attributed to reduced productivity Without significant reform BITRE estimates that business vehicle use will account for over 50 per cent of total delay costs in capital cities by 2020 (BITRE 2007)
7 See Transport and Infrastructure Council 23 May communique available at httpwwwtransportinfrastructurecouncilgovaucommuniquefilesCouncil_1st_Communique_23_May_2014_V1pdf
8 See httpwwwaustroadscomauplanning-and-evaluationngtsm-revision 9 In 2005 dollars Updated BITRE estimates of future road congestion in capital cities are expected to be completed in early 2014 10 Estimate cost of avoidable congestion in 2007 with a GDP deflator to 2022 and assuming no growth in road traffic Future benefits
of congestion pricing depend on traffic growth which depends on lsquounknownsrsquo such as energy and petrol prices public transport investment public transport patronage and reforms to other taxes such as fringe benefits tax
55
Improving productivity in the transport sector Parham (2012) identified four economy-wide sources of productivity growth
Creative destruction of firms Non-market sector Regulatory reforms More effective targeting of investments
Of these identified sources regulatory reforms and more effective targeting of investments were expected to be the key to future transport productivity growth
Measures to improve productivity operate in three main ways
Better use of existing inputs using existing technology A shift in technological knowledge and capabilities can shift production abilities Changes in operating circumstances affect input or output use (Productivity Commission 2006)
Banks (2012) identified areas that remained crucial to future productivity growth for transport infrastructure
Undertake transparent cost-benefit analysis of all options prior to any major public infrastructure investment and when determining quality or environmental standards o Public investments are otherwise prone to lsquooptimism biasrsquo and a confusion between political and
economic ends o Poor infrastructure decisions have a high opportunity cost and can be a long-term drag on the
economyrsquos productivity Extend use of cost-reflective pricing including to manage peak demand or supply disruptions
o Aversion to price rises even where needed to balance supply and demand can suppress or distort investment and may result in higher prices in the long term
Introduce institutional reforms for roads to connect revenue with spending decisions while progressively moving to location-based road pricing particularly for freight
The Productivity Commissionrsquos (2014) draft report on Public Infrastructure states that the overriding message is the need for a comprehensive overhaul of processes in the assessment and development of public infrastructure projects
It is essential to reform governance and institutional arrangements for public infrastructure to promote better decision making in project selection funding financing and the delivery of infrastructure services
Well-designed user charges should be used to the fullest extent that can be justified However governments will have to at least partly fund some infrastructure projects and address equity issues
Significant road pricing and institutional arrangements are proposed to create more direct links to road users and to take advantage of advances in vehicle technology
15
15
55
16
16
Priority measures to improve productivity
Better more transparent cost benefit analysis The key to ensuring infrastructure delivers productivity benefits is getting the right investment decisions with the highest cost benefit ratios (Sims 2013)
Harris (2013) states that Australia can have a bias to large land transport projects over the more targeted smaller ones with higher cost benefit ratios
Maintenance tends to be underfunded relative to investment because of the smaller less obvious nature of maintenance works relative to new infrastructure (Semmens 2006 Zeitlow 2006 cited in Harvey 2012) But deferring maintenance in the short term can be expensive in the long term (Harvey 2012)
The productivity of infrastructure investments can be improved by
Better more transparent cost benefit analysis The current revision of the National Guidelines for Transport System Management (2006) is an important step towards this end11
Ensure whole of life costs are considered including future maintenance need
Cost-reflective heavy vehicle charges and investment that reflects future needs For investment to be efficient it needs to be made according to appropriate regulatory rules and standards (Sims 2013)
The Productivity Commission (2006) found there was no mechanism to approach users to suggest they pay for road usage in return for particular roads being built or upgraded and that the National Transport Commission had no ability consider future investment needs either generally or in the case of specific roads
Charges are still set by Transport Ministers following advice from the National Transport Commission using principles that result in a focus on past expenditures rather than future expenditure needs
A key issue for operators is that freight transport link roads can have limits on use by heavy vehicles This can reflect the fact that the trucks that use the road are not charged sufficiently to cover the damage they do to the road and if they were the funds raised would not go to those responsible for maintaining or upgrading the road (Sims 2013)
Important changes that would improve freight productivity include
Linking user charging directly with road planning investment and maintenance A locational link between heavy vehicle charges and the funding of road improvements to key freight
transport link roads to increase heavy vehicle access Heavy vehicle charging that has a means of allocating funds for future infrastructure needs
11 See httpwwwaustroadscomauplanning-and-evaluationngtsm-revision
55
17
17
Variable tolling of major urban roads The right price signals and incentives are required to make the best use of existing and new infrastructure (Sims 2013)
Congestion costs that are not reflected in time of use or traffic volume related pricing will be indirectly reflected in increased end user demand
Daley (2012) recommended time of day road pricing to reduce congestion with a variable road pricing scheme that charges more at rush hour and other congested times Good scheme design would be essential and must consider administrative costs complementary investments (for example public transport) equity concerns and the right prices to achieve a significant reduction in congestion
Systems that allow real time access (for example HOT lanes) have already been implemented overseas
Time of use pricing of congested roads can mitigate productivity impacts by spreading demand peaks and maximising the productivity benefits of existing infrastructure by prioritising access to high value users (that is freight over passengers and business over leisure travel)
The productivity of road networks could be improved by
Implementing city-wide variable tolling systems for major urban roads that allow consistent time of day and volume related tolling
Further application of technological improvements Intelligent transport systems (ITS) have the potential to deliver significant safety environmental and efficiency benefits to the Australian transport system (SCOTI 2012)
Effective ITS projects can generate large benefits for small costs when compared to lsquotraditionalrsquo infrastructure investment For example the Monash Freeway coordinated ramp metering system increased the roadrsquos peak throughput by 30 per cent a $1 million pilot program had an economic payback period of just twelve days (Gaffney 2010)
Australia is an innovator in the global ITS market The SCATS adaptive signal control system is extensively deployed in Australia and internationally (Stevanovic 2010) STREAMS integrated traffic management is widely used in Australia and we are a world leader in interoperable electronic tolling (ITSA 2012)
However more could be done to encourage the development and deployment of productivity-enhancing ITS solutions on Australian roads
Measures that could improve productivity by facilitating technological improvements include
Development of economic evaluation guidelines and modelling techniques to enable effective comparison of ITS and traditional infrastructure investment opportunities
Encouragement of pilot deployments of new ITS technologies in Australia including full economic appraisals and comparative analyses
55
18
18
References Australian Bureau of Statistics 2007 Labour Statistics Concepts Sources and Methods 6102055001 19 April
Australian Bureau of Statistics 2012 Estimates of Industry Multi-factor Productivity Australia Detailed Productivity Estimates 5260055002 7 December
Australian Bureau of Statistics 2013 Australian System of National Accounts Concepts Sources and Methods Australia 2013 Cat No 52160 20 December
Banks G 2012 Productivity policies the lsquoto dorsquo list address to the Economic and Social Outlook Conference Securing the Future in Melbourne 1 November
BITRE 2007 Estimating urban traffic and congestion cost trends for Australian cities Working Paper 71
BITRE 2013 Australian Infrastructure Statistics Yearbook 2013
Daley J 2012 Game-changers Economic reform priorities for Australia supporting analysis Grattan Institute June
Gaffney J 2010 Monash ndash CityLink ndash West Gate Upgrade Project presentation to the 24th ARRB Conference 12ndash15 October
Gruen D 2012 The Importance of Productivity Productivity Commission-Australian Bureau of Statistics Productivity Perspectives Conference Canberra 20 November
Harris P 2013 Productivity and the National Income Outlook Speech to the Trans-Tasman Business Circle Productivity Series dinner Perth 18 September
Harvey MO 2012 Optimising Road Maintenance Discussion Paper No 2012ndash12 Prepared for the Roundtable on Sustainable Road Funding 25-26 October
Lu W Louis P and Harvey M 2011 Traffic forecasting performance of PPP and toll roads literature review Patronage Forecasting Forum BITRE
Productivity Commission 2006 Road and Rail Freight Infrastructure Pricing Inquiry Overview No 41 22 December 2006
Productivity Commission 2014 Public Infrastructure Draft Inquiry Report Canberra
Parham D 2012 Australiarsquos productivity growth slump signs of a crisis adjustment or both Productivity Commission Visiting Researcher paper April
Parkinson M 2012 Macroeconomic policy for changing circumstances Annual post-Budget address to the Australian Business Economists Sydney 15 May
SCOTI 2012 Policy Framework for Intelligent Transport Systems in Australia Canberra March 2012
Sims R 2013 A future regulatory outlook speech to the SMART Inaugural International Symposium for Next Generation Infrastructure 30 September (httpwwwacccgovauspeecha-future-regulatory-outlook)
Stevanovic A 2010 Adaptive Traffic Control Systems Domestic and Foreign State of Practice National Cooperative Highway Research Program (NCHRP) Synthesis 403 Transportation Research Board 2010
Transport and Infrastructure Council 2014 Communiqueacute First meeting held in Alice Springs 23 May
Wei H and Zhao P 2012 The industry sources of Australiarsquos productivity slowdown Paper presented at the Productivity Commission-ABSrsquo Productivity Perspectives Conference 2012 20 November
Zhao S 2012 An overview of Australiarsquos productivity performance Paper presented at the Productivity Commission-ABSrsquo Productivity Perspectives Conference 2012 20 November
copy Commonwealth of Australia 2014
ISSN 1440-9593
ISBN 978-1-922205-77-3
July 2014
Creative Commons Attribution 30 Australia Licence is a standard form licence agreement that allows you to copy communicate and adapt this publication provided that you attribute the work to the Commonwealth and abide by the other licence terms A summary of the licence terms is available from httpcreativecommonsorglicensesby30audeeden
The full licence terms are available from httpcreativecommonsorglicensesby30aulegalcode
This publication should be attributed in the following way Bureau of Infrastructure Transport and Regional Economics (BITRE) 2014 Infrastructure Transport and Productivity Information Sheet 55 July Canberra
Acknowledgement
Cover image Iron ore train Newman Western Australia Reproduced with the permission of BHP Billiton
Use of the Coat of Arms
The Department of the Prime Minister and Cabinet sets the terms under which the Coat of Arms is used Please refer to the Departmentrsquos Commonwealth Coat of Arms and Government Branding web page httpwwwdpmcgovauguidelinesindexcfmbrand and in particular the Guidelines on the use of the Commonwealth Coat of Arms publication
Contact us
This publication is available in PDF format All other rights are reserved including in relation to any Departmental logos or trade marks which may exist For enquiries regarding the licence and any use of this publication please contact
Department of Infrastructure and Regional Development Bureau of Infrastructure Transport and Regional Economics (BITRE) GPO Box 501 Canberra ACT 2601 Australia