23
Marko Bogoievski March 2010 Infratil Investor Day CEO Presentation 2010

Marko Bogoievski
March 2010
Infratil Investor DayCEO Presentation 2010

2
Infratil Investor Day 2010 – Agenda
Time Presenter
8.00 - 8.30 Registration
8.30 - 9.30 IFT Overview Marko Bogoievski
9.30 – 10.30 Australian Energy Simon Draper
10.30 - 10.45 Break
10.45 - 11.30 TrustPower Chris O’Hara
11.30 – 12.15 Shell NZ Mike Bennetts
12.15 – 12.45 Wrap-upMarko Bogoievski
Lloyd Morrison
12.45 Lunch

3
Objectives for the day
• Principal objectives:
- Introduce the team
- Update the facts
- Highlight the challenges and the opportunities
- Lay out the plan
- Get your perspective
• Focus is on material businesses with significant sector developments and key
choices
- Shell NZ deal pending completion, but good example of current focus
• WIAL, NZ Bus, European airports, Infratil property, Snapper – all have
significant plans and opportunities, but unlikely to materially impact the
overall view on IFT valuation in the short-term

4
Infratil – well placed for the future
The importance of infrastructure investment in the local and global
economy only continues to grow …
• Our approach to investment has performed well during market cycles and
changing investment trends
• Deleveraging and capital constraints have created significant opportunities
for experienced and well capitalised infrastructure investors
• Our operational capability and comfort with demand and price risk further
differentiates IFT from other infrastructure investors
• The core Infratil assets are very good businesses in the right sectors, with
significant re-investment potential
5
Key investor questions
• What is the investment proposition?
• Does IFT represent value?
• Does recent activity make sense?
• What’s the plan from here?
• Is the model right?

6
Infratil investment proposition
Equity exposure to growth infrastructure with significant optionality
• Specialist infrastructure investor targeting high total returns to shareholders
over the long-term
• Actively managed portfolio of high quality core assets and early stage
investments offering significant capital growth
• Dynamic capital allocation to high return projects through controlling stakes
in key investments
• Ongoing origination activity and new business development
• Financial flexibility and risk management complemented by unique vantage
point in Australasian investment markets
• Management team and track record
7
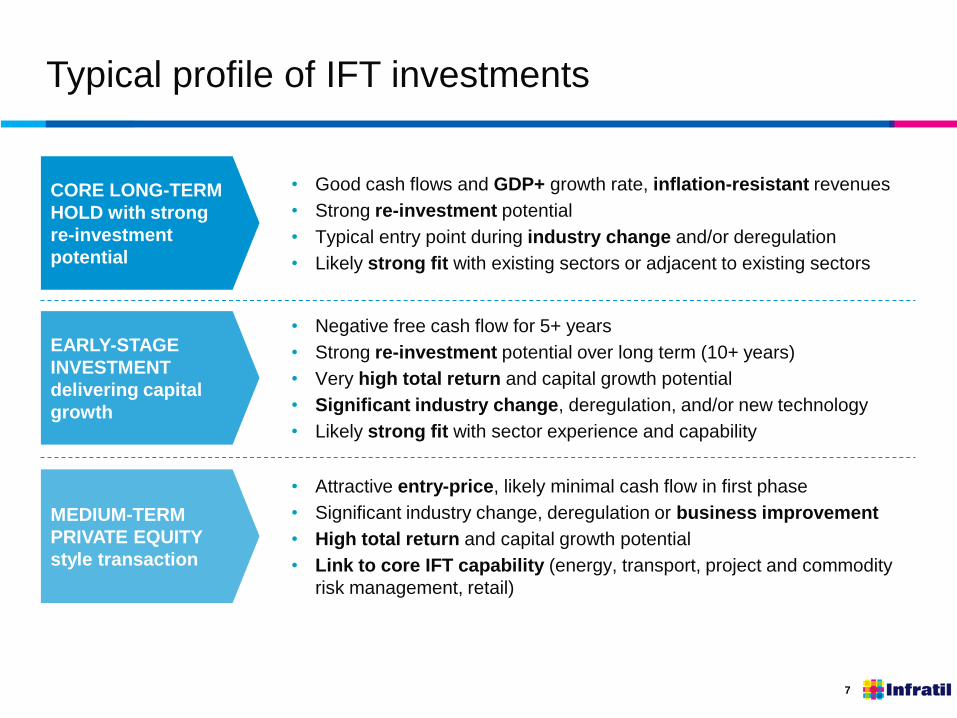
Typical profile of IFT investments
CORE LONG-TERM
HOLD with strong
re-investment
potential
• Good cash flows and GDP+ growth rate, inflation-resistant revenues
• Strong re-investment potential
• Typical entry point during industry change and/or deregulation
• Likely strong fit with existing sectors or adjacent to existing sectors
EARLY-STAGE
INVESTMENT
delivering capital
growth
MEDIUM-TERM
PRIVATE EQUITY
style transaction
• Negative free cash flow for 5+ years
• Strong re-investment potential over long term (10+ years)
• Very high total return and capital growth potential
• Significant industry change, deregulation, and/or new technology
• Likely strong fit with sector experience and capability
• Attractive entry-price, likely minimal cash flow in first phase
• Significant industry change, deregulation or business improvement
• High total return and capital growth potential
• Link to core IFT capability (energy, transport, project and commodity
risk management, retail)

8
Getting the balance right is critical …
IFT Portfolio Mix (illustration only)
CORE Cash Flow +
CORE Capital Growth
SUPP Private Equity
Other

9
Key investor questions
• What is the investment proposition?
• Does IFT represent value?
• Does recent activity make sense?
• What’s the plan from here?
• Is the model right?

10
IFT total returns peaked at 26% p.a. in 2007 …
$100 invested in IFT on 1 April 1994 would have accumulated to $1,312 by 7 March
2010 (17.5% p.a. compound)
-1000
-500
0
500
1000
1500
2000
-40%
-20%
0%
20%
40%
60%
80%
1994 1996 1998 2000 2002 2004 2006 2008 2010
Accumulation Index
Annual Return
Annual Return Annual Dividend Return Infratil Accumulation Index

11
A view from the analysts …
$M
Infratil
March 2010
Average Broker
Valuation 17/11/09
TrustPower $1,153 $1,309
Infratil Energy Australia $207 $284
Wellington Airport $285 $306
Infratil Airports Europe $146 $151
NZ Bus $212 $209
Other $54 $40
Total Assets $2,057 $2,299
Debt ($810) ($810)
Management contract - ($107)
NTA $1,247 $1,382
IFTWB Proceeds $43 $43
NTA/Share $2.13 $2.36
Gap at $1.66 29% 42%

12
Allocating the NTA discount isn’t easy
• TPW, WIAL trade on a multiple to sustainable
earnings
• NZ Bus, VEL/IEA at book value
• IAE at negative free cash flow valuation
• IFT Property probably ignored
Considerations:
1. VEL – potential for re-rating when retail profitability
is sustained (currently just valuing customer base)
2. NZ Bus – uncertainty over appropriate multiple and
future free cash flow
3. Shell NZ – question mark over whether it is a PE
deal or long-term asset with decent reinvestment
potential?
POTENTIAL DISCOUNT
FACTORS:
- Performance
- Outlook
- Management model
- Absolute gearing and
leverage
- Holdco structure and
parent company debt
- Reinvestment risk / or
lack of growth?
- Lack of marginal buyers
Focus always comes back to performance

13
Key investor questions
• What is the investment proposition?
• Does IFT represent value?
• Does recent activity make sense?
• What’s the plan from here?
• Is the model right?

14
2009/10 – a productive 12 months
The investment approach has remained constant and focused
• Operational results
- Strong TPW and WIAL earnings (about 70% of assets), respectable NZ Bus result
- Started next phase of investment and growth in IEA/VEL
- Disciplined approach to containing Glasgow and Kent airport negatives
• Portfolio activity
- $393m realised since March 31, 2009 across 5 properties
- $16m EBITDA leakage in divested assets ($133m in excess of BV)
- Over $230m of new capex deployed in high-return internal projects
- Close to major Shell NZ transaction (although not complete)
• $425m debt reduction – debt reduced to $810m from $1,210m
• $100m raised in new equity, and $43m more scheduled for May 2010

15
Forecast performance to March 31, 2010
• Second half NPAT will
benefit from $100m gains
on sale of ENE and AIA
• Negative mark to market
movements on forward
energy hedges in Australia
likely to drive Group
derivative losses to around
$40m – but dependent on
prices in March
2010 operating earnings (EBITDAF) and capital expenditure consistent
with half year guidance (after adjusting for divestments)
0
500
1,000
1,500
2,000
2,500
0
50
100
150
200
250
300
350
400
1998 2000 2003 2006 2009
IndexEBITDAF ($M)
EBITDAF Year End
IFT Accumulation Index

16
Shell NZ – how does downstream oil fit with IFT?
• Potential CORE+ asset with significant business
improvement opportunity in a rapidly changing
industry
• Market leader in most segments with very
competitive cost base and access to critical
energy-related infrastructure
• Quality portfolio of commercial customers and
retail sites
• Should respond well to selective investment
after many years of limited available capital
• IFT familiarity with energy and transport
supplemented by industry hires and third-party
advisors where necessary
• Opportunity to create a substantial NZ business

17
Key investor questions
• What is the investment proposition?
• Does IFT represent value?
• Does recent activity make sense?
• What’s the plan from here?
• Is the model right?
18
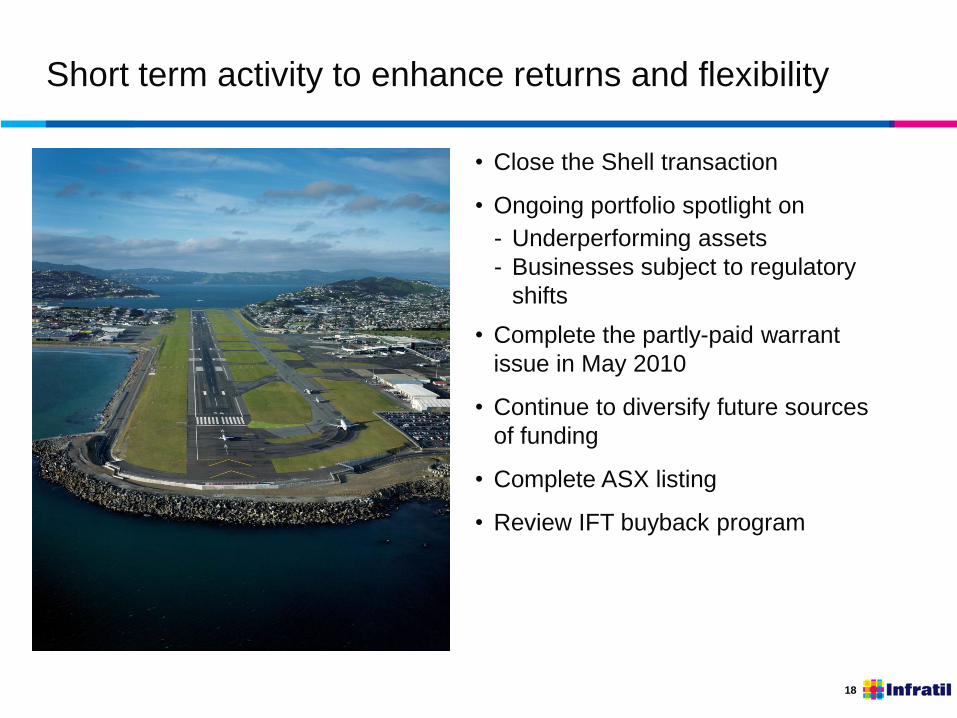
Short term activity to enhance returns and flexibility
• Close the Shell transaction
• Ongoing portfolio spotlight on
- Underperforming assets
- Businesses subject to regulatory
shifts
• Complete the partly-paid warrant
issue in May 2010
• Continue to diversify future sources
of funding
• Complete ASX listing
• Review IFT buyback program

19
Medium term investment program and outlook
• Group capex depends on TPW (wind
and irrigation) options and Australian
energy (generation and retail)
• Discretionary capex continues to be
carefully controlled – particularly in
sectors undergoing regulatory
reviews (public transport and airports)
• Origination activity is largely focused
on energy and transport opportunities
in Australia and NZ, although:
- Market scans are constantly conducted
across a broad range of infrastructure
sectors, and
- IFT has the ability to respond to
opportunistic situations
Projected IFT asset mix March 31, 2010
TrustPower
Infratil Energy Australia
Wellington Airport
European Airports
Public Transport/Property

20
Key investor questions
• What is the investment proposition?
• Does IFT represent value?
• Does recent activity make sense?
• What’s the plan from here?
• Is the model right?

21
Clarifying the investment story
Question Clarification
1 Is Infratil a specialist infrastructure investor or an
absolute return investment manager with a broad
infrastructure mandate?
Infratil is a specialist infrastructure
manager targeting investments benefiting
from long-term trends or industry change
2 Should Infratil have a tighter sector focus? Increasing energy bias
3 Should Infratil have a tighter geographic focus? Increasingly focused on investment
opportunities in Australia and NZ
4 What is the appropriate absolute level of
indebtedness?
Medium term metrics consistent with the
bottom end of investment grade credit
5 What is the appropriate capital structure? Debt next to cash flows where possible
6 Is Infratil an active manager? Active manager with influential stakes
7 What is the appropriate targeted return profile?
(and related dividend yield)
Maintain high absolute return targets over
the long-run, although this will be harder
given reduced leverage

22
Infratil – the bottom line
• Investment approach has withstood the test of time
• Operational capability enables IFT to pursue more difficult but rewarding
growth infrastructure opportunities
• Last 12 months of activity will improve performance and considerably
tighten the focus of IFT
• Internal pipeline of projects provides good visibility about future capex
opportunities and projected returns
• Pace of origination improving as second-order effects of financial crisis
result in dislocation and less competition for attractive assets
• Financial flexibility and co-investment model enables IFT to be a player
in material opportunities in Australia and NZ

www.infratil.com


