Inherent Uncertainties in Nearshore Fisheries: The Biocomplexity of Flow, Fish and Fishing Dave Siegel 1 , Satoshi Mitarai 1 , Crow White 1 , Heather Berkley 1 , Chris Costello 1 , Steve Gaines 1 , Ray Hilborn 2 , Bruce Kendall 1 , Steve Polasky 3 , Bob Warner 1 & Kraig Winters 4 1 = [UCSB], 2 = [UW], 3 = [UMn] & 4 = [SIO/UCSD]
Transcript
Inherent Uncertainties in Nearshore
Fisheries: The Biocomplexity of
Flow, Fish and Fishing
Dave Siegel1, Satoshi Mitarai1, Crow White1, Heather Berkley1, Chris Costello1,
Steve Gaines1, Ray Hilborn2, Bruce Kendall1, Steve Polasky3, Bob Warner1 &
• Human-natural system biocomplexity projectOceanography, population dynamics, marine ecology, fishery management, fisherman behavior & economics all wrapped up together
• Focus on California nearshore fisheries & role of uncertainty in management [but in a general way]
• Today – environmental uncertainties & their role on the stocks & harvest of a long-lived fish
Flow
Fish
Settlement
HabitatRecruitment
Harvest
RegulationFisherm
en
Market INFO
Climate
Flow
Fish
Settlement
HabitatRecruitment
Harvest
RegulationFisherm
en
Market INFO
Climate
Stock / Harvest Modeling
Next generation stocks = survivors - harvest + new recruits
SURVIVORS are surviving adults from previous time
HARVEST are those extracted from the fishery
NEW RECRUITS are a function of fecundity of the survivors, larval dispersal & mortality, settlement & recruitment to adult stages
Model System• Long lived, sessile, harvested fish
– M = 0.05 y-1, density dependence parameterized using Beverton-Holt on larval settling densities
• Larval dispersal scales (Gaussian kernel)
– PLD = 60 d, Dd = 150 km & Tspawn = 60 d
• Virgin carrying capacity set to 100 units
– Fixes fecundity
• 1-D coastline domain
– 2000 km long, x = 5 km & absorbing BC
Harvesting
• Total allowable catch (TAC) = f(recruitment)
TAC = 20% of the measured recruitment
Enables TAC to be set dynamically
• Spatial harvest allocation = f(adult density)
Fishermen fish where there are the highest fish densities & harvest up to the set TAC
So-called “ideal free distribution”
Base Case
Diffusive larval kernel, no sources of uncertainty
StochasticDriven by flow scales, short spawning durations & the low probability of survival
Model stochastically which matches Gaussian kernel when # of settlement events is large
Siegel et al. [in review]
Mitarai et al. [in prep.]
Destination Location (km)
Sou
rce
Loca
tion
(km
)
Self s
ettle
men
t
Patchy Settlement Case
Adults
Recruitment
Settlement
Harvest
Patchy larval kernel - PLD = 60 d, Dd = 150 km & Tspawn = 60 d
0 10 20 30 40 50 60 70 80 90 10030
40
50regional means - patchy dispersal
Adu
lts
0 10 20 30 40 50 60 70 80 90 1001.5
2
2.5
Rec
ruitm
ent
0 10 20 30 40 50 60 70 80 90 1000
0.5
1
1.5
Har
vest
0 10 20 30 40 50 60 70 80 90 1000
1
2
3
Larv
al P
rodu
ctiv
ity
years
Adult densities are lower, why?
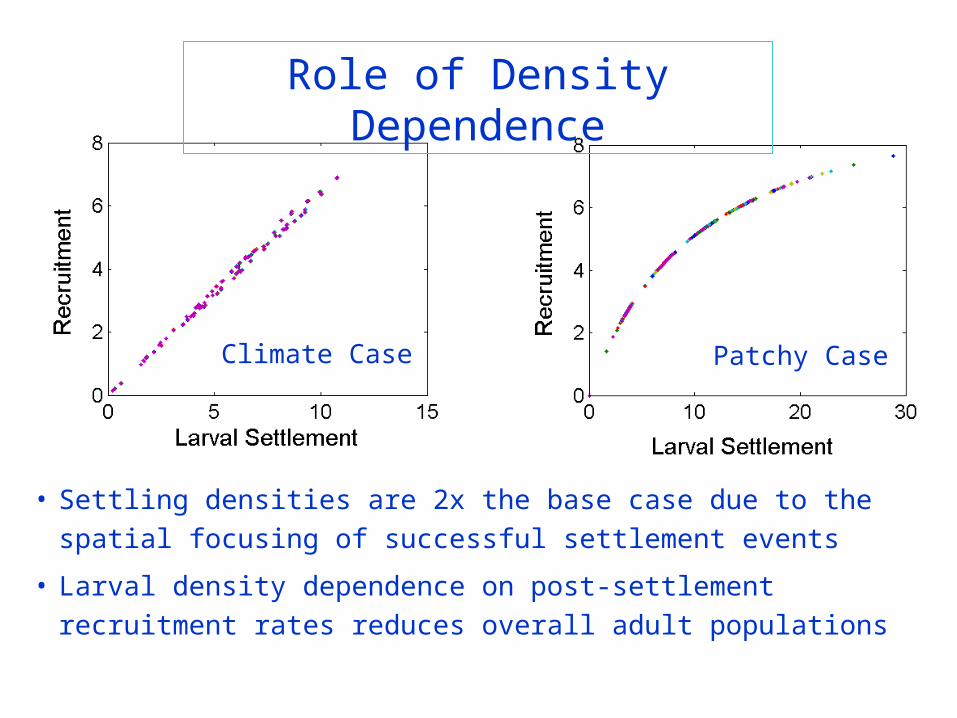
Climate Case Patchy Case
• Settling densities are 2x the base case due to the spatial focusing of successful settlement events
• Larval density dependence on post-settlement recruitment rates reduces overall adult populations
Role of Density Dependence
Flow
Fish
Settlement
HabitatRecruitment
Harvest
RegulationFisherm
en
Market INFO
Climate
Sample recruitment at only 5% of the sites to set the
TAC
Uncertainty Case
Adults
Recruitment
Settlement
Harvest
Patchy larval kernel, varying fecundity & assessment area = 5%
0 10 20 30 40 50 60 70 80 90 10020
40
60regional means - patchy dispersal
Adu
lts
0 10 20 30 40 50 60 70 80 90 1000
5
Rec
ruitm
ent
0 10 20 30 40 50 60 70 80 90 1000
1
2
3
Har
vest
0 10 20 30 40 50 60 70 80 90 1000
0.5
Larv
al P
rodu
ctiv
ity
years
• Regional scale harvest & recruitment are weakly correlated• Times when fishery is closed when TAC = 0 • Increases risk to sustainability of the stock & fishing profits
Uncertainty Case
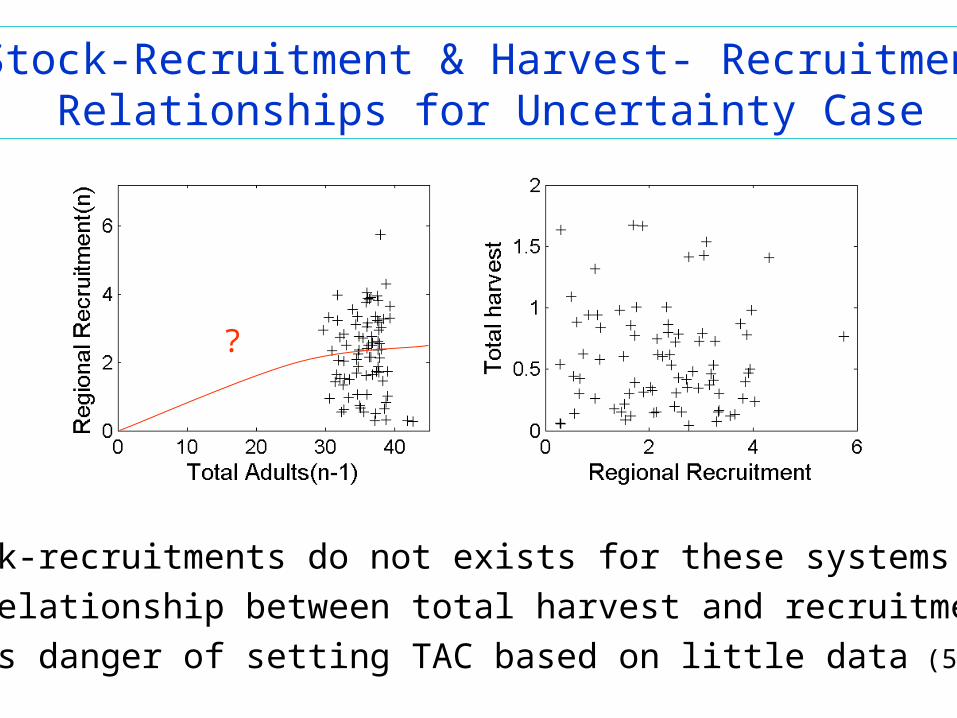
• Stock-recruitments do not exists for these systems • No relationship between total harvest and recruitment• Shows danger of setting TAC based on little data (5% sites)
Stock-Recruitment & Harvest- RecruitmentRelationships for Uncertainty Case
?
Conclusions to Date
•Created a caricature of a CA nearshore fishery
Climate forcing creates temporal variations though its effects are linear (time average = base case)