Initial Results of the Evaluation of the Tennessee Voluntary PreK Program Mark W. Lipsey Dale C. Farran Carol Bilbrey Kerry G. Hofer Nianbo Dong April 2011 Research Report Peabody Research Institute Vanderbilt University
Transcript
Initial Results of the Evaluation of the Tennessee Voluntary PreK Program
Mark W. Lipsey Dale C. Farran Carol Bilbrey Kerry G. Hofer Nianbo Dong
April 2011
Research Report Peabody Research Institute
Vanderbilt University
Peabody Research Institute, Vanderbilt University
2
Staff and Contact Information Peabody Research Institute, Vanderbilt University
Principal Investigator: Mark W. Lipsey, Director, Peabody Research Institute; [email protected].
CoPrincipal Investigator: Dale C. Farran, Senior Associate Director, Peabody Research Institute and Professor, Dept. of Teaching and Learning; [email protected].
Program Manager: Carol Bilbrey, Research Associate; [email protected]. Data Managers: Kerry Hofer and Nianbo Dong, Research Associates. Project Coordinator: Patricia Abelson. Research Analysts: Janie Hughart, Travis Wimsett, Ilknur Sekman, and Rick Feldser. Assessors and Observers across Tennessee. Tennessee Department of Education
Bobbi Lussier, Assistant Commissioner, Division of School Readiness and Early Learning; [email protected].
Connie Casha, Director of Early Childhood Programs, Division of School Readiness and Early Learning; [email protected].
Initial Results of the Evaluation of the Tennessee Voluntary PreK Program
Table of Contents Page
Staff and Contact Information ............................................................................................................... 2
Table of Contents ........................................................................................................................................ 3
Next Steps ....................................................................................................................................................29
Appendix A: Statistical Models for the Woodcock Johnson III Scales in the RCT .........31
Appendix B: Statistical Models for Teachers’ Ratings in the RCT .......................................35
Appendix C: Statistical Models for the Woodcock Johnson III Scales in the RDD ........38
Peabody Research Institute, Vanderbilt University
4
Initial Results of the Evaluation of the Tennessee Voluntary PreK Program
Summary
The Peabody Research Institute at Vanderbilt University, in partnership with the Division of School Readiness and Early Learning at the Tennessee State Department of Education, received a grant in 2009 from the U. S. Department of Education Institute of Education Sciences to conduct a study of the effectiveness of the Tennessee Voluntary Pre‐K program (TN‐VPK).
This five‐year project is in its second year and the first wave of data on TN‐VPK outcomes is now complete. These data provide initial results from two key studies: • A randomized control trial (RCT). A sample of 23 schools in 14 districts across the state
with more TN‐VPK applicants than places in their classrooms admitted children in order from a randomized list for school year 2009‐10. Individual assessments of literacy, language, and math skills at the beginning and end of the pre‐k year were conducted on the subset of these children with parental consent. In addition, their kindergarten teachers the next fall rated them on their preparedness for kindergarten and other characteristics. Comparison of the outcomes for those enrolled in TN‐VPK and those not enrolled provided estimates of the effects of TN‐VPK.
• A regression discontinuity design (RDD). Two cohorts of children in a representative sample of 36 schools in the Central West Tennessee area participated in this study. Individual assessments on the same literacy, language, and math measures used in the RCT were obtained at the beginning of kindergarten for children who were enrolled in TN‐VPK in one of these schools during school year 2009‐10. These were compared with the scores from the second cohort of children obtained just as they began Pre‐K at the start of the 2010‐11 school year. With the difference in age accounted for statistically in the analysis, this comparison provided another set of estimates of the effects of TN‐VPK.
This report presents initial results from the first cohort of the RCT design (a second was implemented for school year 2010‐11) and the first region in which the RDD was implemented (with the remaining three regions to follow in successive years). Initial results from both of these studies indicate a large beneficial effect for children who attended TN‐VPK relative to those who did not. The effects on the early literacy, language, and math skills of children who attended TN‐VPK were all statistically significant with gains ranging from 37% to 176% greater than those of children not in TN‐VPK. The Pre‐K children made the strongest gains in literacy and strong, but more moderate gains in language and math skills. These results were consistent across the RCT and RDD studies, lending credibility to their common conclusion. The RCT study also included ratings by kindergarten teachers and found positive and significant effects for TN‐VPK on their
Peabody Research Institute, Vanderbilt University
5
assessment of the children’s preparedness for kindergarten and work‐related abilities in the classroom. Though this study overall is still in an early stage, these initial results provide strong indications that TN‐VPK is boosting the school readiness skills of the economically disadvantaged children it serves.
The Tennessee Voluntary PreK program
Tennessee Voluntary Pre‐K1 (TN‐VPK) is a statewide program administered by the Division of School Readiness and Early Learning in the Tennessee Department of Education. It began as a pilot program in 1998 and expanded rapidly after 2005 with legislation that increased its funding by providing money from the state lottery. The program operates through competitive grants to local school systems who apply for approval and funding of one or more Pre‐K classrooms. However, those grants support only a portion of the actual cost; the balance must come from other sources. This arrangement permits and encourages collaboration between school systems and other organizations. In this “collaboration model,” school districts may, at their option, operate their Pre‐K programs through collaborative agreements with local non‐profit and for‐profit child care providers or Head Start programs so long as those agencies have attained the highest rating from the licensing system administered by the Tennessee Department of Human Services and meet the State Pre‐K standards. The four largest school districts in Tennessee, for example, operate 241 Pre‐K classrooms, 68 of which involve private providers or Head Start.
TN‐VPK is a full‐day prekindergarten program for four‐year‐old children expected to enter kindergarten in the following school year. By statute, the program gives priority to children eligible for free or reduced price lunch and, secondarily, to students with disabilities, identified as ELL, or otherwise at‐risk. The program in each participating school district must meet standards set by the State Board of Education that require each classroom to have a licensed teacher with a Prekindergarten Endorsement, an adult‐student ratio of no less than 1:10, a maximum class size of 20, and an approved age‐appropriate curriculum.
Tennessee invests over $85 million a year (FY 2010‐2011) in its TN‐VPK program. Currently, 934 state‐funded TN‐VPK classrooms serve more than 18,000 children from economically disadvantaged families across all 95 Tennessee counties.
Study Design
This study of the Tennessee Voluntary Pre‐K program was undertaken in partnership with the Division of School Readiness and Early Learning (DSREL) in the Tennessee Department of Education. The support and active participation of the DSREL staff, and their commendable openness to a fair and probing investigation of the effectiveness of TN‐VPK
1 Pre‐K will be capitalized throughout whenever it refers specifically to the Tennessee Voluntary Pre‐K program (TN‐VPK).
Peabody Research Institute, Vanderbilt University
6
for improving the school readiness of the children it serves, has been critical to the successful implementation of this study. The design of the study, the collection and analysis of data, and the description of the results, however, have been done by the research team at the Peabody Research Institute of Vanderbilt University as an independent evaluation.
This study focuses on four research questions pertinent to guiding future policy for the program:
1. Does participation in TN‐VPK improve the school readiness of the economically disadvantaged children eligible for the program?
2. What characteristics of teachers, classrooms, and organizational context are associated with improvements in school readiness?
3. Does participation in the TN‐VPK program improve subsequent academic performance?
4. What are the characteristics of the children who benefit the most from TN‐VPK in terms of subsequent academic performance?
The overall research design interleaves two distinct studies that together address these questions:
1. A randomized control trial (RCT) with participating schools across the state that had more Pre‐K applicants than could be accommodated in the number of spaces available. This study provides an evaluation of the effects of TN‐VPK on children who attend in comparison to comparable children who were not able to attend. It also allows the children to be followed into later grades to determine if those effects are sustained and, especially, whether TN‐VPK improves the children’s performance on the state achievement tests (TCAP) administered in the third grade. However, because there are more applicants than seats in only some areas, it has the disadvantage that the participating schools are not necessarily representative of the TN‐VPK program statewide.
The RCT has two components. All the participating children are being tracked in the State Education Information System (EIS), which will provide information on such outcomes as grade retentions, special education placements, and performance on the TCAP achievement tests. In addition, there is a more intensive study of a subsample of these children who are being individually assessed at the end of each school year with a battery of measures administered by our research team.
2. A regression‐discontinuity design (RDD) with children participating in a statewide sample of TN‐VPK classrooms across the four regions of the state. This research design compares outcomes for children who have completed Pre‐K with matched children just beginning Pre‐K while accounting for the age difference between them. The RDD has been implemented with a representative sample of TN‐VPK classrooms, teachers, and children. It allows the effects of Pre‐K on children’s school
Peabody Research Institute, Vanderbilt University
7
readiness to be determined and further examined in relationship to the characteristics of the classrooms and teachers those children experience. Whether those effects are sustained in later grades, however, cannot be examined in this design because it lacks a comparison group that never attends Pre‐K.
This report presents results from the first waves of outcome data from these two studies. Neither study is yet complete, and outcome data collection for additional waves is underway for both of them. The design, implementation, and results of the current phases of these two studies are described below.
Randomized Control Trial (RCT) Intensive Substudy: Cohort 1 (School Year 200910)
Prior to the 2009‐10 school year, administrators in schools that expected more applicants to their TN‐VPK program than available slots were asked to participate in the RCT. When parents applied to Pre‐K for their children, the participating school personnel added them to an applicant list. When the schools were ready to offer admission, that list was sent to our research team where it was shuffled into a random order using a random number table. The list was then returned to the school so that parents could be contacted and offered admission for their children in the order that those children appeared on the randomized list. School personnel were asked to make several attempts to contact parents on different days and at different times of the day to determine if admission would be accepted before moving on to the next name on the list. Once the available slots were filled with children whose parents accepted admission, no additional children on the randomized list were offered slots. This procedure gave each child an equal chance to be ranked high enough in the list to be admitted but also, by the same equal chance, left some children too low on the list for a seat in Pre‐K to be available for them.
For the full randomization sample, 23 schools in 14 Tennessee school districts with 907 applicants participated. The randomized admission procedure left some of those 907 children on the waiting list without enrollment in TN‐VPK (some other schools used the randomized procedure but were ultimately able to admit all the applicants). These 23 schools were spread across the state but the largest number was in the Central West region (Nashville and surrounding counties). Overall, their distribution was: • 5 schools (3 districts) in the West region • 13 schools (6 districts) in the Central West region • 2 schools (2 districts) in the Central East region • 3 schools (3 districts) in the East region. These included 12 urban schools (7 in large cities, 5 in smaller towns), 5 suburban ones (3 large and 2 small), and 6 rural schools.
Peabody Research Institute, Vanderbilt University
8
This sample of 907 randomly assigned children in the full randomization will continue to be tracked through the State Education Information System (EIS) database until their third grade year, but results from that source are not yet available. What is available are the results from a more intensive substudy of a smaller number of these children. The families of the children admitted and not admitted to Pre‐K were contacted and asked to consent for their children to be individually assessed for this intensive substudy. With this first RCT cohort, confidentiality concerns required us to use an indirect process for obtaining parental consent (a better procedure was implemented for a second cohort, but those results are not yet available). Consent forms were provided to the personnel in the State Department of Education who then mailed them to the parents with an envelope in which they could return them to the research office. The lack of personal contact with the parents, the time lag after notification about admission to Pre‐K, obsolete mailing addresses, and the expectable inattention to requests to return mailed material resulted in a low consent rate that was quite variable across sites.
Overall, consents for individual assessment were obtained for 342 age‐eligible children in the 23 schools whose randomized lists included both admitted children and children not admitted by the beginning of the school year. The consent rate averaged 38%, ranging from 8% to 83% across the schools. Of those children consented, spring posttest assessments were completed on 307 (86%), with the completion rate higher for the children admitted to Pre‐K (88%) than for those not enrolled (79%). Most of those not assessed in the spring were children who had been assessed in the fall but who moved before spring and could not be located.
The modest consent rate created the potential for differential loss of cases across the Pre‐K and no Pre‐K groups such that the children in this cohort of the intensive substudy who attended and did not attend Pre‐K cannot be viewed as fully randomized samples. Given that, we constructed the comparison groups for the analyses reported here by simply dividing the children into those who had attended a TN‐VPK classroom for at least half the school year and those who had not attended at all. The latter group included children who were on a school’s randomized admissions list with too low a rank to receive offers of admission. It also included some children with higher rankings who were skipped over because their parents could not be reached by school personnel attempting to contact them with an offer of admission and some whose parents were contacted but, at that point, declined admission. Without comparison groups formed solely and entirely by random assignment, it is especially important to assess their similarity on initial baseline characteristics and take the initial differences between the groups into account during the analyses. The baseline comparisons and associated analysis approaches are described in later sections of this report.
Peabody Research Institute, Vanderbilt University
9
Outcome Measures
Achievement on emergent literacy, language, and math school readiness measures was assessed for the children in the intensive substudy at the beginning and end of the Pre‐K school year. The children enrolled in Pre‐K were individually assessed by trained members of the research team on site at the school where they attended. The children in the control condition who thus were not enrolled in TN‐VPK (and the majority not in any prekindergartedn program) were assessed in places arranged with the parent/guardian and convenient for them, e.g., libraries, parks, homes, schools, child care sites, etc. The families in this sample are rather mobile and many moved out of the school district where they originally applied to Pre‐K for their children. The children of these families that could be located within Tennessee were assessed in their new locations.
The standardized assessments administered to each child included the scales listed below from the Woodcock Johnson III Achievement Battery (Woodcock, McGrew, and Mather, 2001). These instruments are widely used in prekindergarten research to assess emergent literacy, language, and math skills related to young children’s readiness to begin kindergarten.
Literacy • Letter Word Identification: Assesses children’s ability to identify and pronounce
alphabet letters and read words. • Spelling: Assesses children’s prewriting skills, such as drawing lines and tracing,
writing letters, and spelling orally presented words. Language
• Oral Comprehension: Assesses children’s ability to complete analogies and provide words with similar or different meanings from key words; it measures their listening ability and understanding.
• Picture Vocabulary: Assesses children’s ability to name the objects presented in pictures and point to the picture that goes with a word; it measures early language development and lexical knowledge.
Math • Applied Problems: Assesses children’s ability to solve small numerical and spatial
problems presented verbally with accompanying pictures of objects. • Quantitative Concepts: Assesses children’s ability to point to or state answers to
questions on number identification, sequencing, shapes, symbols, and the like; it measures aspects of quantitative reasoning and math knowledge.
Composite Measure • WJ Composite Scale: A principal components factor analysis revealed that all the
scales above were rather highly intercorrelated with high loadings on a single factor. The W‐scores on those scales were therefore averaged to create an overall
Peabody Research Institute, Vanderbilt University
10
composite measure representing children’s combined achievement in literacy, language, and math.
In addition, reports of the academic skills and behavior of the children were collected from their kindergarten teachers early in the fall of the school year after Pre‐K. Two teacher rating instruments were used for this purpose:
• CooperFarran Behavioral Rating Scales: Teacher ratings for each child on items about the child’s actions and interactions within the classroom context. Items include questions about a child’s ability to pay attention and engage in classroom activities, compliance with instructions, work and play with peers, ability to act independently, and similar themes (Cooper and Farran, 1991).
• Academic Classroom and Behavior Record: Teacher ratings for each child on items about the child’s preparedness for kindergarten work, liking school, behavior problems in the classroom, and relations with peers (Farran, Bilbrey, and Lipsey, 2003).
Finally, questionnaires were administered via telephone interviews to the parents of the consented children in this intensive substudy. These were conducted during the Pre‐K year to provide information about child and family characteristics that might impact achievement, such as demographic information and activities at home with the child. The parents whose children were not admitted to Pre‐K were also asked about any alternative preschool or childcare arrangements they had made.
Sample and Baseline Differences
Of the 307 age‐eligible consented children for whom posttest data were obtained, four who were enrolled in Pre‐K withdrew before completing half the school year. These were dropped from the analysis, leaving 303 children in the analysis sample—230 who attended TN‐VPK for at least half the school year and 73 who did not attend. For this sample overall, 51% were girls and 49% boys, and the mean age at the beginning of the Pre‐K year was 4.4 years. The racial distribution was 53% White, 27% Black, and 20% Hispanic. Thirty percent of the parents reported that they spoke a language other than English in the home. For the 73 children who did not attend TN‐VPK, parents were asked about their care arrangements during that school year. Twelve percent of the control sample attended Head Start, 26% attended a private childcare center or other non‐TN‐VPK preschool, 51% stayed home with a parent or other guardian, and for 11% the arrangements were not reported.
Although this analysis sample was derived from a larger randomized sample, the cumbersome consent procedure required for this RCT cohort provided only a modest portion (37%) of that sample for the intensive substudy. The loss of cases from that larger sample means that we cannot count on the initial randomization to produce groups of children attending and not attending Pre‐K that were equivalent at baseline on all other relevant characteristics. The analysis of Pre‐K effects, therefore, was conducted using
Peabody Research Institute, Vanderbilt University
11
propensity scores to adjust for baseline differences. The initial step in constructing those propensity scores was to compare the Pre‐K and no Pre‐K groups on all the available baseline variables to identify any on which they differed and to assess the appropriateness of those variables for inclusion in the propensity scores.
Baseline differences on demographic variables and the pretests of the Woodcock Johnson outcome measures were examined first. These were tested in multilevel statistical models with children nested within the schools that provided the randomized lists to the design. Data on ethnicity were available only from the State Educational Information System, which did not yet include information on the children who did not attend Pre‐K. No direct comparisons between the Pre‐K and no Pre‐K conditions were therefore possible on ethnic breakdown. To provide some basis for comparison, ethnicity was imputed using maximum likelihood estimates from all the other data available on the children in the sample.
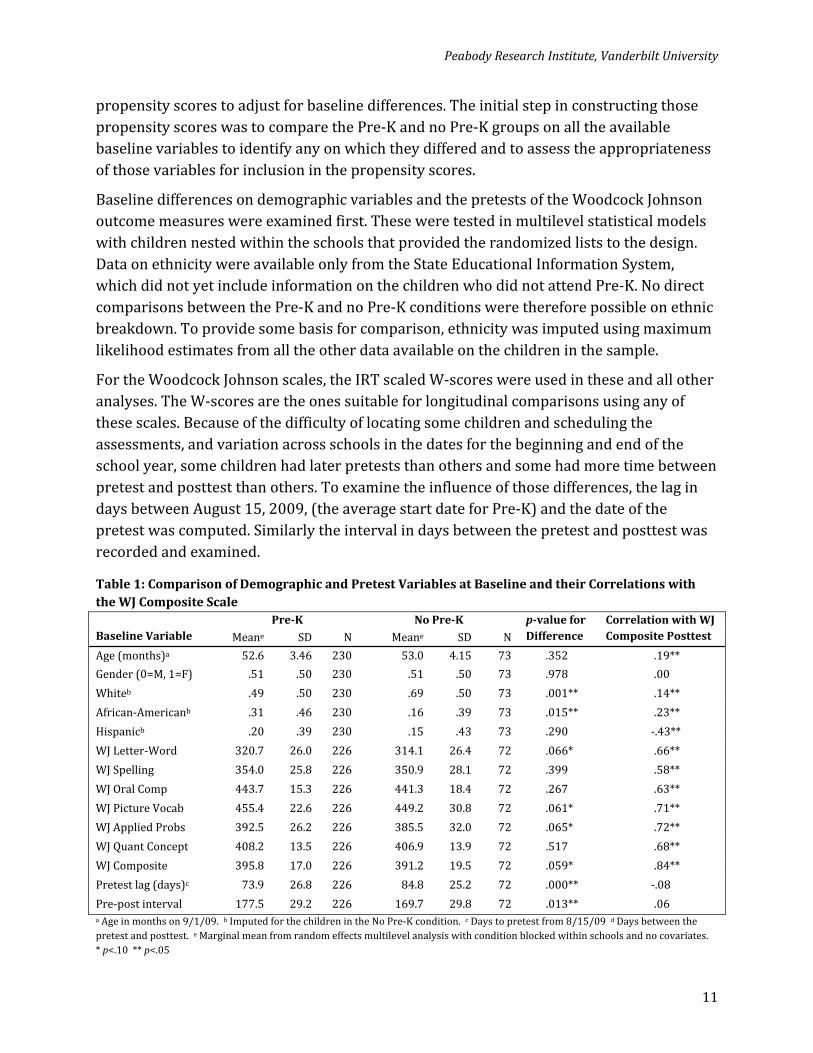
For the Woodcock Johnson scales, the IRT scaled W‐scores were used in these and all other analyses. The W‐scores are the ones suitable for longitudinal comparisons using any of these scales. Because of the difficulty of locating some children and scheduling the assessments, and variation across schools in the dates for the beginning and end of the school year, some children had later pretests than others and some had more time between pretest and posttest than others. To examine the influence of those differences, the lag in days between August 15, 2009, (the average start date for Pre‐K) and the date of the pretest was computed. Similarly the interval in days between the pretest and posttest was recorded and examined. Table 1: Comparison of Demographic and Pretest Variables at Baseline and their Correlations with the WJ Composite Scale Baseline Variable
PreK No PreK pvalue for Difference
Correlation with WJ Composite Posttest Meane SD N Meane SD N
Age (months)a 52.6 3.46 230 53.0 4.15 73 .352 .19** Gender (0=M, 1=F) .51 .50 230 .51 .50 73 .978 .00 Whiteb .49 .50 230 .69 .50 73 .001** .14** African‐Americanb .31 .46 230 .16 .39 73 .015** .23** Hispanicb .20 .39 230 .15 .43 73 .290 ‐.43** WJ Letter‐Word 320.7 26.0 226 314.1 26.4 72 .066* .66** WJ Spelling 354.0 25.8 226 350.9 28.1 72 .399 .58** WJ Oral Comp 443.7 15.3 226 441.3 18.4 72 .267 .63** WJ Picture Vocab 455.4 22.6 226 449.2 30.8 72 .061* .71** WJ Applied Probs 392.5 26.2 226 385.5 32.0 72 .065* .72** WJ Quant Concept 408.2 13.5 226 406.9 13.9 72 .517 .68** WJ Composite 395.8 17.0 226 391.2 19.5 72 .059* .84** Pretest lag (days)c 73.9 26.8 226 84.8 25.2 72 .000** ‐.08 Pre‐post interval 177.5 29.2 226 169.7 29.8 72 .013** .06 a Age in months on 9/1/09. b Imputed for the children in the No Pre‐K condition. c Days to pretest from 8/15/09 d Days between the pretest and posttest. e Marginal mean from random effects multilevel analysis with condition blocked within schools and no covariates. * p<.10 ** p<.05
Peabody Research Institute, Vanderbilt University
12
Table 1 shows the comparisons for the demographic variables, the pretests on the literacy, language, and math outcome measures, and the assessment timing measures. It also shows the correlation of each of these variables with the WJ Composite Scale measured at posttest. The baseline variables most strongly correlated with the outcome measures that also differ at baseline between the conditions are the ones that are most important to control in the analyses.
Another source of information about the backgrounds of the children in the Pre‐K and no Pre‐K conditions came from the parent questionnaire that was administered in a telephone interview. These were completed with the parent or guardian of 301 of the 303 children in the analysis sample (99%). Among the items on that questionnaire were questions about the parents’ education, the home language environment, and various activities of the child or the child and parent at home. Those most relevant to children’s early literacy, language, and math skills are shown in Table 2 for the children in the Pre‐K and no Pre‐K conditions. Presented there also are the correlations of these items with the WJ Composite posttest.
Table 2: Comparison of Home Environment Variables from Parent Questionnaire at Baseline and their Correlations with the WJ Composite Scale Baseline Variable
PreK (N=228) No PreK (N=73) pvalue for Difference
Parent educationa 3.96 1.52 3.83 1.50 .547 .25** Home language not English (1=Y) .29 .45 .29 .49 .905 ‐.42** TV hours on Saturdayb 2.31 1.18 2.01 1.22 .064* .19** TV hours on Sundayb 2.06 1.18 1.80 1.24 .112 .19** Number of children’s books in homec 4.01 1.16 3.73 1.28 .097* .31** Someone in home has library card (1=Y) .64 .48 .58 .50 .394 .24** How often practice letter namesd 4.40 .90 4.16 1.08 .063* .17** How often read to childd 4.30 1.00 4.14 1.02 .220 .15** How often play with computer/electronic toysd
2.54 1.25 2.82 1.28 .102 .20**
a 8‐point scale from 8th grade to master’s degree. b 6‐point scale from 0 hrs to 5 or more.. c 6‐point scale from 0 to over 50. d 5‐point scale from “almost never” to “daily.” e Marginal mean from multilevel analysis with condition blocked within schools and no covariates. * p<.10 ** p<.05
As Table 2 shows, the children in the Pre‐K and no Pre‐K groups were similar on many of these family background characteristics, though there were a few statistically significant differences at p < .10. The direction of the differences overall generally favored the Pre‐K group, as was the case for the demographic and pretest differences reported in Table 1 earlier.
Analysis Approach
The effects of the TN‐VPK program on the outcome variables were examined using multilevel regression models with children nested within the schools to which their
Peabody Research Institute, Vanderbilt University
13
parents initially applied for the TN‐VPK program. The school blocks in this randomized block design were treated as random effects. There was relatively little missing data for the 303 cases contributing to the analysis with the exception of ethnicity. As described earlier, ethnicity data were not available from the State Education Information System for the control group children not enrolled in Pre‐K and, for them, this variable was imputed from the other data available using maximum likelihood estimates. That gives it limited value in the analysis, but it was included anyway for what useful information it might provide. The scattered missing values on other variables, e.g., the few cases missing pretests on the Woodcock Johnson scales, were also imputed using maximum likelihood estimates.
To adjust for the baseline differences, propensity score techniques were used. To ensure that no baseline variable that might contribute to these adjustments was omitted, each of the applicable variables in Tables 1 and 2 was included in the respective propensity score. Separate propensity scores were created for each outcome variable to allow each to include the pretest for that outcome. Specifically, the variables that went into the propensity scores were the following:
• The pretest score for the outcome variable examined in each analysis; • Age, gender, ethnicity (dummy coded for African‐American yes/no and Hispanic
yes/no), and parent education; • A Home Literacy Factor that combined parent reports of the number of children’s
books in the home, whether anyone had a library card, and how often they practiced letter names, read to the child, and played with computers or electronic toys;
• A Weekend TV composite that was created by averaging together the parent ratings for amount of Saturday and Sunday TV watching;
• Home language not English; • The time lag to pretest and the interval between pretest and posttest.
These variables were used in logistic regressions to predict group membership (Pre‐K vs. no Pre‐K) and the predicted values in the form of the probability of being in the Pre‐K group were saved as the propensity scores. These propensity scores were then used in two ways in the analyses. First, the propensity score distributions for the Pre‐K and no Pre‐K groups were examined for overlap prior to analysis of each outcome. Cases in either distribution with propensity scores more than .01 below the minimum or above the maximum of the other distribution were dropped from the analysis. This reduced the sample size somewhat in both groups but helped improve their match on the variables included in the propensity scores. The number of dropped cases in the analysis for each outcome is evident in Table 3 below. Second, the propensity scores were included in the analysis of the remaining cases as a covariate. There are various other ways that propensity scores can be used in an analysis of intervention effects including as the basis for a weighting function, stratification and for matching with various caliper widths for what
Peabody Research Institute, Vanderbilt University
14
counts as a match (Guo & Fraser, 2010). A selection of these approaches was tried in analyses with the WJ Composite outcome variable and each gave somewhat different, though substantially similar effect estimates. The most conservative estimates resulted when the propensity score was simply used in the analysis as a covariate, so that is the approach that was adopted for use in all the analyses reported below.
Because of their correlations with the outcome variables and associated potential to improve statistical power, the individual variables used to create the propensity score were also included in each analysis as covariates along with the propensity score. In this role, those covariates were additionally able to adjust for any remaining imbalance between the Pre‐K and no Pre‐K groups on any of these variables that was not fully adjusted by the propensity score. After including all those individual covariates, however, a reduced model was fit in which those covariates with regression coefficients with p‐values greater than .20 were dropped.
At the school level in the multilevel analysis, the consent rate was also included as a covariate along with the interaction between it and the treatment variable (Pre‐K vs. no Pre‐K). The consent rate was computed as the proportion of the number of children on the full randomized list for that school whose parents consented to having them assessed for the intensive substudy. Recall that, because of the cumbersome consent procedure we were required to use for this first cohort of the RCT, we were able to obtain consents for an average of only 37% of the children in each school, ranging from 8% to 83% across schools. Including the school‐level consent rate and its interaction with treatment condition in the analysis allowed us to examine, and statistically control for, any influence the consents rate had on the estimates of the Pre‐K effects.
An additional consideration in formulating the analysis models was the imbalance across schools in the total number of cases contributed to the analysis and the proportions in the Pre‐K and no Pre‐K groups respectively. The no Pre‐K group was composed of children whose parents applied for Pre‐K but the child did not end up attending, and whose parents also provided consent for them to participate in the intensive substudy. In many schools, that was only one or two children, ranging up to 17 but with a median number of only 2. The Pre‐K group generally included more children but, in some cases, schools took all the applicants on their first randomized list and then used a second one for their waiting list, with some children then being admitted from that waiting list. The number of children in the Pre‐K condition in the initial analysis sample thus varied widely as well, ranging from 1 to 32 with a median of 9.
Though the analysis model represented the nesting of children within schools and, with both Pre‐K conditions within each school, thus treated schools as blocks in a blocked randomized design, the large disparities across schools in the numbers of cases in each condition was a concern. Such disparities allow each school to contribute a quite different
Peabody Research Institute, Vanderbilt University
15
proportion of the total number of children to the Pre‐K condition than they contribute to the total number of children in the no Pre‐K condition. That, in turn, allows for the possibility that between school differences will be confounded with the overall Pre‐K vs. no Pre‐K differences that constitute the estimates of the Pre‐K effects on the various outcome variables.
To examine the influence of these imbalances across schools, all the analyses were re‐run using a set of sampling weights. These weights were configured so that each school’s original randomized admissions list contributed the equivalent of the same proportions of its cases to the Pre‐K and no Pre‐K groups as the proportions in the overall sample. For the overall sample of 303, for example, 73 were in the no Pre‐K group, i.e., 24%. The 230 in the Pre‐K group similarly were 76% of the total sample. Within each school, the sampling weights then treated the number of cases actually in the no Pre‐K group as if they were 24% of the total number of cases from that school and the number of cases in the Pre‐K group as if they were 76% of the cases from that school. The exact weights varied for each outcome analyzed to reflect the number of cases in each school and each condition after cases were trimmed by the propensity score procedure. In all cases, the inclusion of these sampling weights produced somewhat smaller estimates of the Pre‐K effects than the same analysis without the weights. Given these more conservative results, the sampling weights were used in all the analyses providing the results reported below.
Finally, the statistical significance of the Pre‐K effects in all analyses was tested at alpha=.10 rather than the more conventional .05 level, though we report both. This slightly more liberal standard was adopted to better balance the probability of Type I and Type II error in light of the relatively low statistical power of the analyses to detect meaningful effects. The sample size of children in this first cohort of the intensive substudy was modest (initially 303 with disproportionately fewer in the control group, and reduced further when trimmed to match on propensity scores). The adjustment of the standard errors in multilevel analysis because of the similarity of students within schools further reduced the effective sample size.
To summarize, the analysis models that produced the results reported below were multilevel with children nested within schools and schools treated as random effects blocks contributing cases to both the Pre‐K and no Pre‐K treatment conditions. For each outcome variable, a propensity score was created from the baseline variables that differentiated the treatment conditions and/or had at least a modest correlation with the WJ composite outcome variable. Cases were then trimmed from the Pre‐K and no Pre‐K comparison groups if their propensity scores fell more than .01 outside the range of the other distribution. The remaining cases that were thus matched groupwise on the propensity score became the analysis sample for that outcome. The analysis was conducted with sampling weights that made the proportionate contribution of Pre‐K and no Pre‐K cases in each school the same as in the overall analysis sample. The baseline variables used to
Peabody Research Institute, Vanderbilt University
16
create the propensity score, along with the propensity score itself, were included as covariates in each analysis. The school level consent rate and the interaction of the consent rate with the treatment conditions were also included as covariates. After an initial analysis with these covariates, those with regression coefficients having p‐values greater than .20 were dropped except for the propensity score, consent rate, and consent by treatment interaction, which were retained in all analyses. These reduced models produced the estimates of the Pre‐K effect on the outcome variables reported here. Those effect estimates, in turn, were tested for statistical significance at alpha=.10 as well as at .05. The choices made in configuring these models were oriented toward more conservative (smaller) effect estimates than the other reasonable alternatives considered, but also gave some consideration to their limited statistical power for detecting meaningful effects.
Results of the Cohort 1 RCT Intensive Substudy
Note: The results reported here are based on refined analysis models that are somewhat different from those used in the brief reports released earlier summarizing the results of this study. These revised results are substantially similar to the earlier ones, however, and do not change any of the substantive conclusions about the nature and general magnitude of the Pre‐K effects found.
Effects on Woodcock Johnson Literacy, Language, and Math Scales
The analysis of TN‐VPK effects on the Woodcock Johnson III literacy, language, and math measures using the statistical models described above was done with the longitudinally scaled W‐scores for these measures to ensure appropriate comparisons over time. The results indicated that children who participated in TN‐VPK significantly outperformed the children who did not attend TN‐VPK on all the Woodcock Johnson scales examined. For each scale, and the WJ Composite Scale that averaged the W‐scores across all the individual scales, Table 3 shows the number of cases included in each analysis, the Pre‐K effect estimate in W‐score units, and the statistical significance of that effect. It also shows the standard deviations for the unadjusted posttest W‐scores, pooled across the Pre‐K and no Pre‐K conditions, and the corresponding standardized mean difference effect sizes. These effect sizes represent the Pre‐K effects in standard deviation units and are widely used in evaluation research to compare program effects. An effect size of 1.00 is equivalent to the difference between a score at the 50th percentile of the distribution of scores and a score at the 84th percentile.
As Table 3 shows, the effects of participation in TN‐VPK were statistically significant on all the Woodcock Johnson literacy, language, and math measures with effect sizes ranging from .28 to .42. The largest effects were on Letter‐Word Identification and Quantitative Concepts while the smallest were on Applied Problems and Picture Vocabulary. (Detailed results for each of the analyses summarized in Table 3 are presented in Appendix A).
Peabody Research Institute, Vanderbilt University
17
Table 3: PreK Effect Estimates from the RCT Intensive Substudy for the WJIII Scales
Outcome Measure
N in PreK Group
N in No PreK Group
PreK Effect Estimate in WScore Unitsa pvalue
Pooled Posttest Standard Deviationb Effect Size
WJ Composite Scale 210 71 5.48** .000 16.34 .34 Literacy Measures Letter‐Word Identification 208 66 10.64** .000 25.45 .42 Spelling 209 69 8.78** .025 25.28 .35 Language Measures Oral Comprehension 215 62 6.04** .003 17.34 .35 Picture Vocabulary 215 68 5.89** .001 19.43 .30 Math Measures Applied Problems 215 66 5.61** .007 20.40 .28 Quantitative Concepts 215 63 6.19** .000 15.88 .39 Note: Based on consented children who applied to 23 participating schools. a Based on the analysis models described in the previous section of this report. b Standard deviations computed with the same sampling weights used in the multilevel analysis of Pre‐K effects. ** p<.05, * p<.10.
To provide some context on the nature and magnitude of these Pre‐K effects, we examined them in relation to the gains made by the no Pre‐K control group over the period when the Pre‐K group was attending TN‐VPK. Children not in Pre‐K did, of course, make learning gains during that period as well. We can better assess the nature of these positive Pre‐K effects by considering how much they added to the gains found without TN‐VPK. To do that, we first calculated the mean pre‐post W‐score gain on each scale for the Pre‐K treatment group and subtracted the Pre‐K effect found in our analysis so that the result estimated the gain expected by the Pre‐K group had they not participated in Pre‐K. We then pooled that estimate with the mean pre‐post gain of the no Pre‐K control group to estimate the gain over the school year without Pre‐K for the whole sample. That gain was represented as a standardized mean difference effect size using the same pooled posttest standard deviations as in the Pre‐K effects shown above in Table 3. By representing pre‐post gain without Pre‐K effects and pre‐post gain with Pre‐K effects as effect sizes in standard deviation units, it was possible to determine the proportionate improvement in the outcomes produced by Pre‐K. Table 4 reports those comparisons.
Table 4 shows that the relative gains are considerable on all the Woodcock Johnson scales. The WJ Composite Scale, which provides the single best summary of the effects on overall academic skills, shows that the TN‐VPK children’s gains were 47% greater than those of the children who did not attend Pre‐K. In most of the individual skill areas, their relative gains were even larger, ranging from 37% to 176% with an average of 93%. The greatest relative gains were in the language measures, with the literacy and math measures showing gains that were large, but not as large as for the language measures.
Peabody Research Institute, Vanderbilt University
18
Table 4: PreK Effect Sizes (ES) for the WJIII Scales Relative to PrePost Gains
Effects on Kindergarten Teachers’ Ratings of Classroom Behavior
The children in the Cohort 1 RCT study were all eligible to attend kindergarten the next year whether they had participated in TN‐VPK or not. For those still in Tennessee, we attempted to identify the schools and kindergarten classrooms they attended. Early in the fall we then asked the kindergarten teachers to complete a questionnaire reporting their observations about the classroom behavior of the children in our sample. Of the 303 children in the analysis sample, we were able to obtain these teacher reports for 240 of them (79%). With these reports we can compare the teachers’ perceptions of the children who participated in Pre‐K the year before and those who did. Among the original Pre‐K schools contributing children to the Pre‐K and no Pre‐K conditions from their randomized lists, however, there were some schools for which no kindergarten teacher reports were obtained for either the consented Pre‐K or the no Pre‐K children. This left 203 children with kindergarten teacher reports from 18 of the schools with both Pre‐K and no Pre‐K children from each school. Of those, 150 children had attended TN‐VPK and 53 had not.
As noted earlier, the kindergarten teacher report questionnaire included two instruments, the Cooper‐Farran Behavioral Rating Scales and the Academic and Classroom Behavior Record. These instruments provided six outcome measures that were examined for evidence of Pre‐K effects:
Cooper‐Farran Behavioral Rating Scales • WorkRelated Skills. A factor score derived from a principal components factor
analysis that summarizes the teachers’ responses to a set of interrelated items about the child’s ability to work independently, listen to the teacher, remember and comply with instructions, complete games and activities, function within designated
Peabody Research Institute, Vanderbilt University
19
time periods, and otherwise behave appropriately in relation to classroom work and prescribed activities.
• Social Behavior. A factor score also derived from a principal components factor analysis that summarizes the teachers’ responses to a set of interrelated items about the child’s social interactions with peers including appropriate behavior while participating in group activities, play, and outdoor games; expression of feelings and ideas during group discussions; and response to others mistakes or misfortunes.
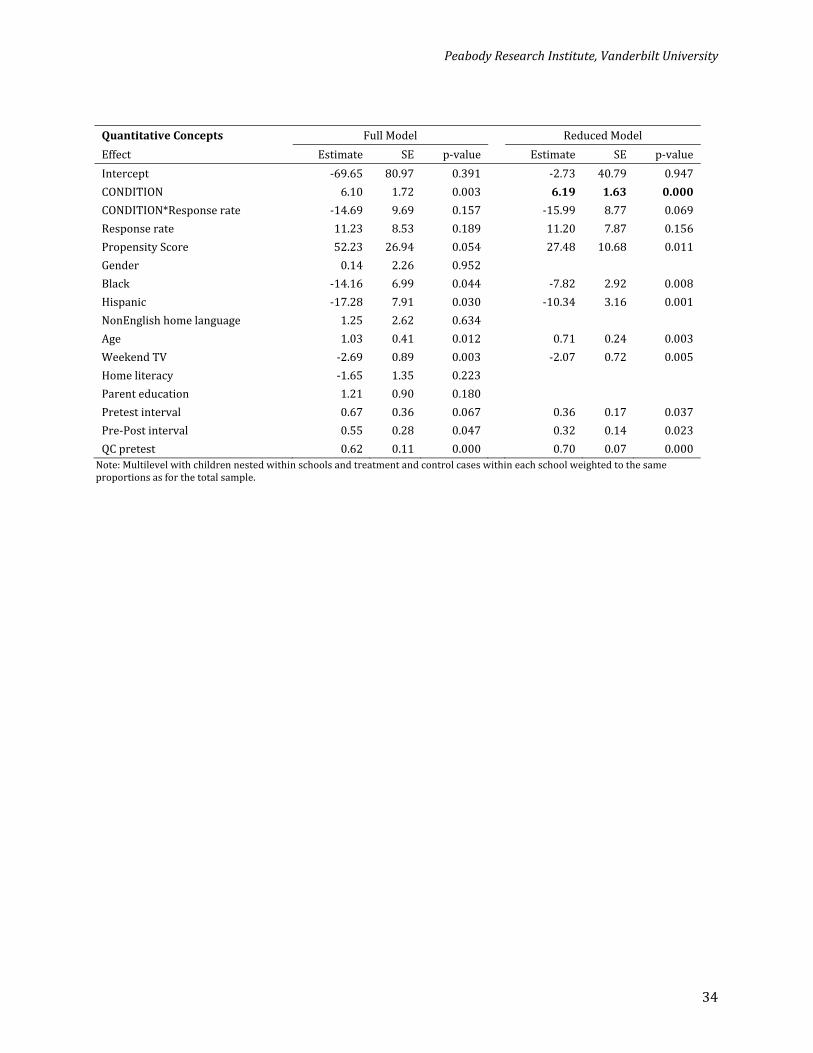
Academic and Classroom Behavior Record (ACBR) • Readiness for Kindergarten. A factor score derived from a principal components
factor analysis that summarizes the teachers’ responses to a set of interrelated items about how well prepared the child is for kindergarten in literacy and language skills, math skills, and social behavior.
• Liking for School. A factor score derived from a principal components factor analysis that summarizes the teachers’ responses to a set of interrelated items about the child liking or disliking school, having fun at school, enjoying and engaging in classroom activities, and seeming happy at school.
• Behavior Problems. Whether the child has shown any behavior problems from a list including explosive and overactive behaviors, attention problems, physical or relational aggression, social withdrawal or anxiety, motor difficulties, and the like. Teachers’ responses were coded into two outcome variables: (1) a dichotomous variable indicating whether any of the behavior problems on the list have been observed (0= no, 1=yes), and (2) the number of behavior problems on the list that were observed.
These outcome variables were analyzed in much the same fashion as the Woodcock Johnson scales described above. That is, the analysis was multilevel with propensity scores created and used for trimming the Pre‐K and no Pre‐K cases to improve their matching. The number of cases remaining from the 150 Pre‐K and 53 no Pre‐K groups after trimming are shown in Table 5 below. Some of the individual variables contributing to the propensity score were also included separately as covariates in the analysis to improve power if the p‐value for the regression coefficient was less than or equal to .20. Note, however, that there were no pretests on the teacher report outcome variables to include in either the propensity score or the individual covariates. The baseline score on the WJ Composite Scale, though not a direct pretest for the teacher ratings, was included in the propensity score to account for initial differences between the Pre‐K and no Pre‐K groups on cognitive skills. All analyses were weighted to balance the contribution of the Pre‐K and no Pre‐K cases from each school in the same proportions as for the overall sample.
Table 5 reports the results of these analyses. There were statistically significant differences favoring the children who had attended TN‐VPK on the kindergarten teachers’ ratings of Work‐Related Skills (p<.10) and Readiness for Kindergarten (p<.05). There were no
Peabody Research Institute, Vanderbilt University
20
differences on the other teacher rating measures. Aside from demonstrating that Pre‐K made a difference in academic preparedness, this result indicates that the kindergarten teachers were relatively discriminating in their ratings. It is possible that teachers knew about the prior Pre‐K experience of at least some of these children. If they had positive preconceptions about the effects of Pre‐K, we would expect them to give better ratings to the children who had attended Pre‐K on all the measures. The fact that they did so only on the measures most closely related to the aims of the TN‐VPK program adds credibility to these results. (Details of these analyses are provided in Appendix B).
Table 5: PreK Effect Estimates for the Outcome Measures from the Kindergarten Teachers’ Reports
ACBR Number of Behavior Problems 118 48 ‐.07 .776 1.17 .06
Note: Based on consented children who applied to 18 participating schools. a Based on the analysis models described in the text. b Standard deviations computed with the same sampling weights used in the multilevel analysis. * p<.10, ** p<.05.
RCT Cohort 1: Conclusions
Random assignment of eligible individuals to intervention and control conditions is the preferred procedure for evaluating the effects of any program. Though it represented a significant change for them, 23 schools in 14 districts cooperated with us to randomize their lists of applicants and then enroll children in the order in which they appeared on those lists. This procedure resulted in a group of 907 children randomly admitted or denied admission to Pre‐K classrooms. For the intensive substudy reported here, it was necessary to obtain parents’ consent to assess their children in the fall and spring of the Pre‐K year. The low consent rate in this cohort of the RCT meant that not all the children originally randomized were available for the intensive substudy. This attrition was not balanced across the Pre‐K and no Pre‐K comparison groups and resulted in initial baseline differences between those groups.
These baseline differences could bias the estimates of the Pre‐K effects and they were, therefore, addressed with a relatively strong set of statistical controls. Because we had a nearly full set of pretests for the participating children and had conducted in‐depth
Peabody Research Institute, Vanderbilt University
21
interviews with the parents, we were able to match the Pre‐K and no Pre‐K children on their initial skill levels, demographics, family backgrounds and home environments using propensity score techniques for all the analyses.
The results demonstrated strong, positive and statistically significant effects on all the literacy, language and math school readiness measures. Comparing the gains of the two groups across the year on standardized mean difference effect sizes for these measures showed that the achievement of the Pre‐K children improved 37‐176% more than that of the no Pre‐K children during the same period. Moreover, the kindergarten teacher ratings that were obtained for a smaller number of children reinforced the achievement test results. Kindergarten teachers rated the TN‐VPK children as being significantly more ready for school and as displaying the kinds of learning dispositions that bode well for future learning in school environments. These results are in line with the objectives and expectations of the TN‐VPK program.
Regression Discontinuity Design:
Central West Tennessee Region (School Year 200910)
Regression‐discontinuity is a research design in which a pre‐specified cutoff value on an observed characteristic of the participants determines whether or not they receive an intervention. To enroll in a given school year, TN‐VPK requires that children be four years old by September 30, and thus eligible for kindergarten the next year. Children who miss that cutoff must enter Pre‐K a year later. In the regression‐discontinuity design (RDD) study reported here, this birth date cutoff requirement sorted children into those who were in TN‐VPK during school year 2009‐10 and those who were not able to enter until school year 2010‐11 and thus were not yet in TN‐VPK during the 2009‐10 school year.
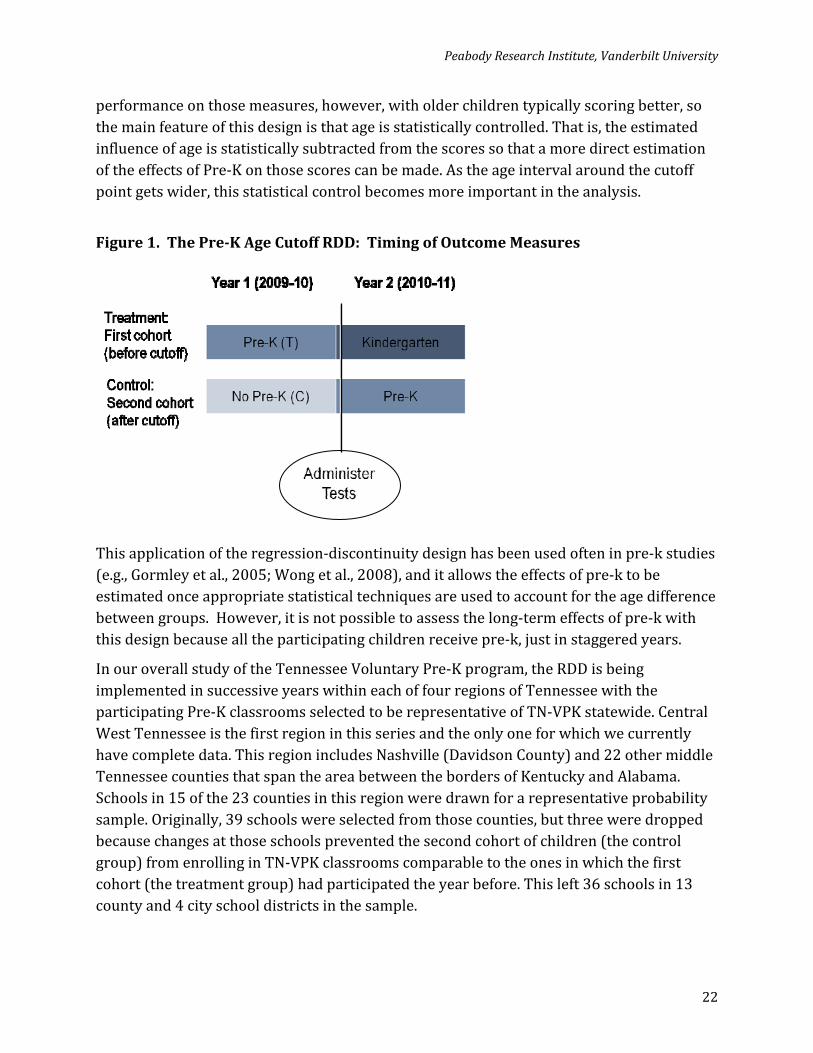
The children enrolled in Pre‐K in 2009‐10 were assessed on the school readiness measures at the beginning of kindergarten the next school year (2010‐11), after they had completed Pre‐K. At the same time, the children who had just entered Pre‐K in the same classrooms were assessed. These are comparable children who were not in Pre‐K in the same year as the first group (2009‐10) because they missed the age cutoff for that school year. The regression‐discontinuity design then compares the scores for these two groups while taking into account their age difference. Figure 1 below shows the timing of the assessments for the two groups of children who are compared in this design.
The closer children are to each other on either side of the age cutoff, the stronger the comparison is. For example, some children in Pre‐K in this design made the age cutoff by fewer than three months while some other children missed it by fewer than three months and thus were not in Pre‐K that year. These children differ in age by an average of three months and in no case by more than six‐months, so when we compare their scores on the school readiness measures, we are mainly seeing the effects of Pre‐K. Age is related to their
Peabody Research Institute, Vanderbilt University
22
performance on those measures, however, with older children typically scoring better, so the main feature of this design is that age is statistically controlled. That is, the estimated influence of age is statistically subtracted from the scores so that a more direct estimation of the effects of Pre‐K on those scores can be made. As the age interval around the cutoff point gets wider, this statistical control becomes more important in the analysis.
Figure 1. The PreK Age Cutoff RDD: Timing of Outcome Measures
This application of the regression‐discontinuity design has been used often in pre‐k studies (e.g., Gormley et al., 2005; Wong et al., 2008), and it allows the effects of pre‐k to be estimated once appropriate statistical techniques are used to account for the age difference between groups. However, it is not possible to assess the long‐term effects of pre‐k with this design because all the participating children receive pre‐k, just in staggered years.
In our overall study of the Tennessee Voluntary Pre‐K program, the RDD is being implemented in successive years within each of four regions of Tennessee with the participating Pre‐K classrooms selected to be representative of TN‐VPK statewide. Central West Tennessee is the first region in this series and the only one for which we currently have complete data. This region includes Nashville (Davidson County) and 22 other middle Tennessee counties that span the area between the borders of Kentucky and Alabama. Schools in 15 of the 23 counties in this region were drawn for a representative probability sample. Originally, 39 schools were selected from those counties, but three were dropped because changes at those schools prevented the second cohort of children (the control group) from enrolling in TN‐VPK classrooms comparable to the ones in which the first cohort (the treatment group) had participated the year before. This left 36 schools in 13 county and 4 city school districts in the sample.
Peabody Research Institute, Vanderbilt University
23
One TN‐VPK classroom from each of these 36 schools was included in the RDD. Each of these classrooms was in place for both the 2009‐10 and 2010‐11 school year with nearly all classrooms staffed by the same teacher both years. The children in those classrooms during the 2009‐10 school year (the Pre‐K “treatment” group) were tracked and assessed within the first six weeks of the beginning of kindergarten the next fall whether they were in the same school as their Pre‐K or not, so long as they were still in the Tennessee school system. The children entering those same Pre‐K classrooms for the 2010‐11 school year who missed the age cutoff for 2009‐10 (the no Pre‐K control group) were assessed within the first six weeks after they began Pre‐K. The requirement that both age cohorts of children be enrolled in the same Pre‐K classrooms was imposed to add assurance that the children in the two groups were comparable except for the age difference. From a research design standpoint, this makes the RDD a blocked design with each selected TN‐VPK classroom separately providing children to both the Pre‐K and no Pre‐K groups being compared.
Outcome Measures
The outcome measures for the children included in the RDD study are standardized assessments on the same Woodcock Johnson III scales used in the RCT study reported above (Woodcock, McGrew, and Mather, 2001). As noted there, these measures are widely used in pre‐k studies as indicators of children’s school readiness in the areas of emerging literacy, language, and math. These assessments were conducted individually with the children on site at their respective schools. The list of measures is repeated here for convenience; descriptions were provided earlier in the section on the RCT study.
Literacy • Letter Word Identification • Spelling
Language • Oral Comprehension • Picture Vocabulary
Math • Applied Problems • Quantitative Concepts
Composite Measure • WJ Composite Scale: The mean of the W‐scores on all the above scales.
Sample and Baseline Differences
The 17 Central West Tennessee school districts represented in this portion of the RDD study include 13 county‐wide systems and 4 city systems with a mix of urban, rural, and suburban schools. The sample of 36 schools includes one large city system that contributed
Peabody Research Institute, Vanderbilt University
24
13 schools and one mid‐sized city system that contributed 3 schools. It also includes 8 schools located in small cities or towns and 12 in rural areas.
The sample of children from these schools was drawn from one TN‐VPK classroom per school with an attempt to include all the children enrolled in those classrooms during the first half of either of the two school years (2009‐10 and 2010‐11). Outcome measures were obtained for 682 of the 733 eligible children (93%) in the first age cohort (treatment group) and for 676 of the 695 eligible children (97%) in the second age cohort (control group), for a total of 1358. Basic demographic information on these children was obtained from the State Education Information System (EIS) for all but 15 (1%) with the exception of ethnicity, which was missing for 7% of the children. The data available, including scores on the Woodcock Johnson measures and dummy codes for the schools in which they were enrolled, were used to impute the missing data using maximum likelihood estimates.
Overall, this sample was comprised of 50% girls and 50% boys, and the mean age at the beginning of the Pre‐K year was 4.4 years for the control sample and 5.4 years for the Pre‐K sample. The racial distribution was 52% White, 35% Black, and 13% Hispanic. Twelve percent of the sample spoke a native language other than English. Table 6 below shows the comparison between the Pre‐K and no Pre‐K comparison sample.
Table 6: Comparison of Demographic Variables at Baseline and their Correlations with the WJ Composite Scale
Baseline Variable
PreK (N=682) No PreK (N=676) pvalue for Difference
Correlation with WJ Composite
Posttest Meanc SD Meanc SD
Age (months)a 54.3 3.62 42.1 3.40 .000** .66** Gender (0=M, 1=F) .51 .50 .50 .50 .746 .06** White .51 .50 .52 .50 .839 .14** African‐American .34 .48 .36 .48 .400 .02 Hispanic .14 .35 .13 .33 .252 ‐.23** Non‐English language .14 .34 .10 .30 .019** ‐.18** Test lag (days)b 29.1 11.7 26.5 10.2 .000** .10** a Age in months on 10/1/09. b Days to testing from 8/15/10 e Marginal means from random effects multilevel analysis with condition blocked within schools and no covariates. * p<.10 ** p<.05
As Table 6 reports, the Pre‐K and no Pre‐K children were very similar except for the age difference, which is inherent in the design. However, two of the differences, though not large in magnitude were nonetheless statistically significant. The Pre‐K group had a higher proportion of children whose native language was not English (14%) than the no Pre‐K group (10%). Also, the mean lag from the nominal start of school to the date of testing was somewhat longer for the Pre‐K group (29.1 days) than the no Pre‐K group (26.5 days).
Peabody Research Institute, Vanderbilt University
25
In addition, all of the baseline variables in Table 6 except African‐American ethnicity were significantly correlated with the WJ Composite measure in this sample. Some of those correlations were relatively small, however, reaching statistical significance mainly because of the large sample size. Nonetheless, any difference between the Pre‐K and no Pre‐K groups on any of these variables has some potential to bias the Pre‐K effect estimates. Those of greatest concern in this regard are non‐English native language and test lag, both of which showed significant differences between the groups and significant correlations with the composite outcome variable. As described in the next section, an approach to the analysis was taken that addressed this source of possible bias.
Analysis Approach
There are two key requirements for the age‐cutoff regression‐discontinuity design used in this study to produce good estimates of the effects of Pre‐K on the outcome variables. First, there should be no differences between the age cohorts on characteristics related to the outcomes that might be confounded with Pre‐K effects, other than age itself. The difference in the proportion of children whose native language is not English reported above is a concern in this regard. Second, the functional relationships between age and the respective outcome variables must be fully accounted for in the statistical models, including any curvilinear relationships and interactions with the Pre‐K intervention conditions.
As reported above, information about only gender, ethnicity, non‐English native language, and the timing of the outcome assessments was available for the children in the RDD. This made for a limited set of covariates with which to compare the cohorts or adjust for any differences. The design used here, however, required that children in both cohorts enroll in the same Pre‐K classrooms in the same schools, with only one classroom per school represented. This made the selected classrooms a blocking factor in the design with each providing cases to both the Pre‐K and no Pre‐K comparison conditions. The importance of this particular blocking is that the children in the two age cohorts from each school are therefore matched on many characteristics relating to that school, such as the neighborhoods in which they reside, the nature of the surrounding community, and the characteristics of the families with school‐age children. These similarities help ensure that the two cohorts are comparable in many ways that were not directly measured.
When the children in the age cohorts within each school were compared on the available demographic variables, notable differences were apparent in some cases, especially in the ethnic mix from year to year. The number of children across the two cohorts in each school ranged from 30 to 41 with an average of 37.7. This was enough cases to create separate propensity scores for each school using the few covariates available, specifically gender, dummy codes for African‐American and Hispanic, non‐English native language, and age relative to the 4.5 and 5.5 mean age expected for the respective cohorts. The distributions of the resulting propensity scores for the Pre‐K and no Pre‐K groups in each school were
Peabody Research Institute, Vanderbilt University
26
then examined for degree of overlap. Children in each group whose propensity scores were outside the range of those for the other group were trimmed to improve the match of the remaining children. This was done with attention to the number remaining in each group to retain approximately equal numbers in each cohort, allowing them to differ by no more than three. This within school trimming based on within school propensity scores reduced the total sample from 1358 to 1225. After this trimming, there were no statistically significant difference between the Pre‐K and no Pre‐K cohorts on any of the demographic variables, including non‐English native language, originally found significant. Combined with the inherent similarity of children attending Pre‐K in the same school from one year to the next, this procedure should produce relatively well‐matched Pre‐K and no Pre‐K comparison groups for the RDD analysis.
The difference between the cohorts on the timing of the outcome assessments (test lag) was not included in the within‐school propensity score matching. The assessment circumstances were consistently different for the children in the Pre‐K cohort, who were tracked and assessed at the beginning of kindergarten, than for the children in the no Pre‐K cohort, who were assessed as they began Pre‐K. Thus it was not possible to match children across cohorts within school very well on that variable. Instead, it was used in all analyses as a covariate to adjust for any differences within and between cohorts associated with the timing of the assessments. To further adjust for any cohort differences on the available demographic variables that were not corrected by the within school matching, and to help with statistical power, those variables were also included in the analyses as individual covariates. Thus all analyses of TN‐VPK effects were conducted with the within‐school propensity matched cases using gender, dummy codes for African‐American and Hispanic ethnicity, non‐English native language, and test lag as covariates.
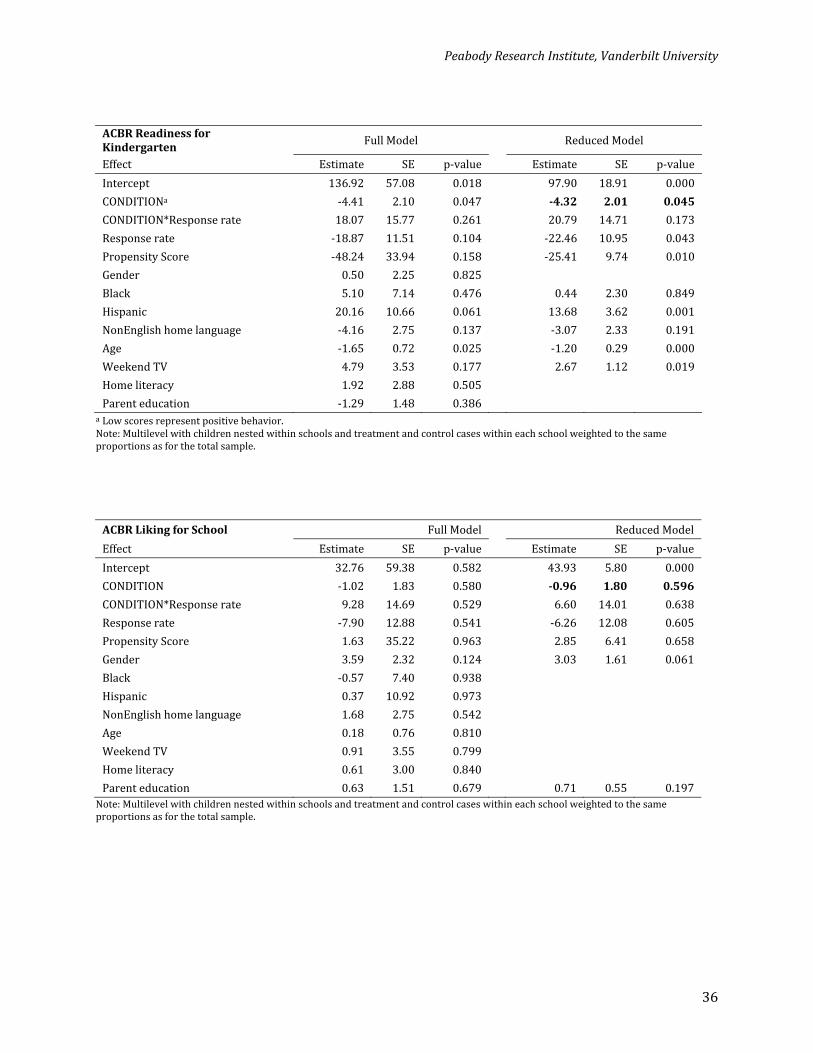
An additional crucial covariate also included in the analysis, of course, was age, the influence of which on the outcomes must be properly accounted for in order to obtain valid estimates of the Pre‐K effects. Age was centered at the cutoff for Pre‐K eligibility with children whose birthdays fell before September 30 receiving positive values according to how many months before (to two decimal places) and those with birthdays after that date receiving corresponding negative values. That centered variable was included in all analyses along with its quadratic and cubic forms to account for any curvature in the relationship of age to the various outcome variables. There was no evident curvature in the scatterplots of the relationship between age and the different outcomes, but the quadratic and cubic terms did make significant contributions in some analyses. In addition, the interaction between the centered age variable and the Pre‐K comparison conditions was also included in all analyses and it too reached statistical significance in some analyses.
All analyses were conducted using multilevel statistical models with children nested within schools. Because children closer to the cutpoint on each side are more similar in age, different age brackets around the cutpoint were examined for each outcome. These
Peabody Research Institute, Vanderbilt University
27
included the entire trimmed sample with ages extending 12 months on each side of the cutoff age, and narrower samples extending 6 months and 3 months on each side.
Results of the Central West Region RDD Study
Note: The results reported here are based on somewhat different analysis models than those used in the brief reports released earlier summarizing the results of this study. In particular, they used within school propensity scores to better match the children in the two age cohorts from each school. These revised results are substantially similar to the earlier ones, however, and do not change any of the conclusions about the nature and general magnitude of the Pre‐K effects found.
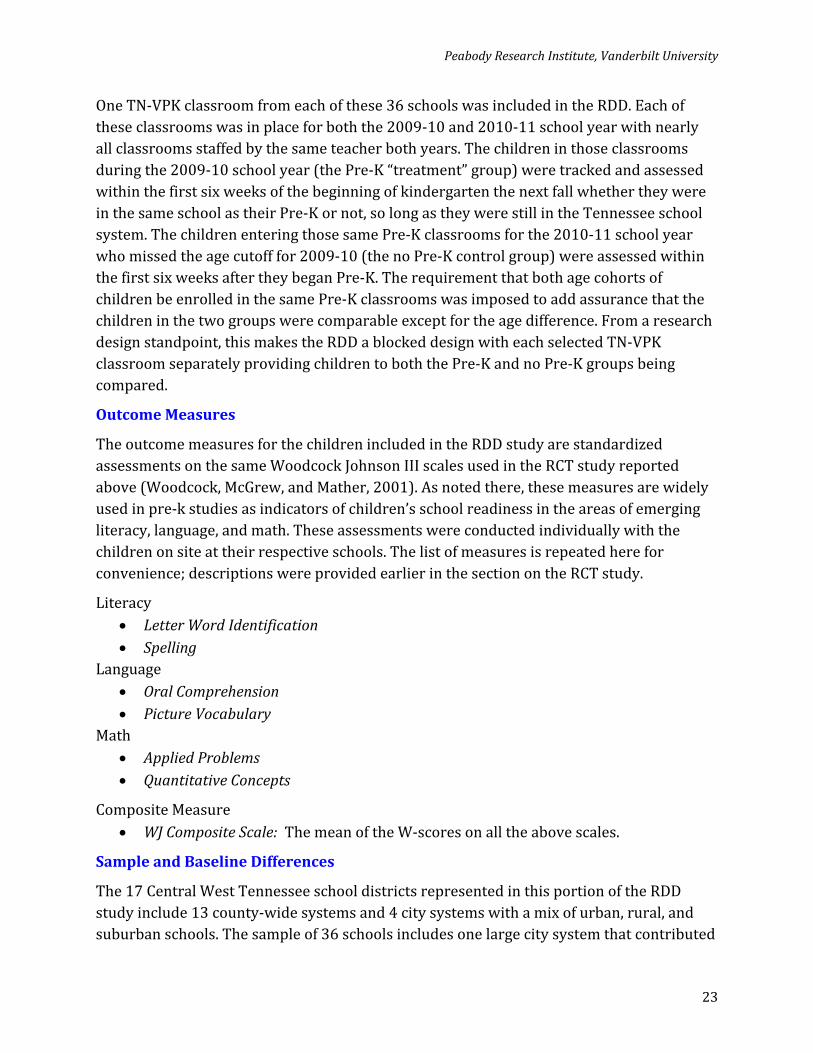
The analysis of TN‐VPK effects on the Woodcock Johnson III literacy, language, and math measures using the statistical procedures described above was done with the longitudinally scaled W‐scores, as it was for the RCT intensive substudy analyses reported earlier. As in the RCT, the results of the RDD indicated that children who participated in TN‐VPK significantly outperformed children who did not attend TN‐VPK on all the Woodcock Johnson scales examined. For each scale, and the WJ Composite Scale that averaged the W‐scores across all the individual scales, Table 7 shows the effect estimates for different age ranges around the cutoff date along with other details. (Detailed results for each of these analyses are presented in Appendix C).
The results reported in Table 7 below indicate positive effects on every Woodcock Johnson outcome measure, with all of them statistically significant except for a few in the ± 3 month interval around the cutpoint where the sample size is smallest. There is some variability in the effect sizes across the different outcome measures with Letter‐Word and Spelling showing the largest effects and Oral Comprehension showing the smallest. There is also variability across the different time intervals spanning the age cutoff for Pre‐K, but no clear pattern to the differences. Estimates with smaller spans, e.g., ± 3 month, compare children who are closest in age and therefore most similar in that regard. However, smaller spans also change the representativeness of the sample by including only the oldest children just entering Pre‐K with the youngest of those completing Pre‐K the previous year and just entering kindergarten.
RDD in Central West Tennessee: Conclusions
The RDD results for the Central West Tennessee schools in our sample showed a broad pattern of positive effects on all the Woodcock Johnson literacy, language, and math scales and across all the time intervals around the age cutoff for Pre‐K eligibility. The effect size estimates were generally about as large or, in many cases, larger than those found in the RCT intensive substudy reported above. Like those effect sizes, therefore, they represented gains by the children who completed Pre‐K that were considerably larger than those by the children who had not yet done so. These strong effects provide further evidence that TN‐
Peabody Research Institute, Vanderbilt University
28
VPK is achieving its objective of improving the academic skills and school readiness of the economically disadvantaged children it serves.
Table 7: PreK Effect Estimates from the RDD Study for the WJIII Scales
The RCT intensive substudy and the RDD in the Central West Tennessee region both found positive effects for TN‐VPK on all the outcome measures of emergent literacy, language,
Peabody Research Institute, Vanderbilt University
29
and math skills. Moreover, the magnitude of those effects represented a rather large acceleration of the gains during the school year for those attending Pre‐K relative to those not attending. Each of these studies has some limitations. The low consent rate in the intensive substudy resulted in differences between the Pre‐K and no Pre‐K comparison groups at baseline that had to be statistically adjusted in the analysis. It is possible that those adjustments were not sufficient to correct for those baseline differences, which would then bias the effect estimates. A relatively wide range of covariates was used for those adjustments, however, including pretest values and information about the children’s home environment. The RDD study, on the other hand, relies on the ability of the statistical model to account for the expected differences in performance level associated with the children’s age along with any systematic cohort differences. Though the modeling was rather thorough, accounting for both second and third order curvilinearity as well as simple linear relationships with age, and for interactions between age and the Pre‐K conditions, and with propensity score matching to reduce cohort differences, it too possibly was not sufficient.
Any study of these sorts conducted under field conditions will have shortcomings. What is most convincing about the results of these two studies is how much they agree. Each study has different limitations and it is not very likely that both would be wrong in the same way and the same direction. The corroboration each provides of the findings of the other lends credibility to both. Under these circumstances, the benefit of any doubt must go to the TN‐VPK program. There is every indication in these results that it is accomplishing its chief objective of accelerating the academic skills of the disadvantaged children it serves leaving them much better prepared for kindergarten than they would be had they not been able to participate in TN‐VPK.
Next Steps
The study of TN‐VPK is continuing and will soon produce additional findings about its effects, including how well those effects are sustained past the Pre‐K year.
RCT. More than 20 school systems that expected more applicants than places in their Pre‐K classooms participated in a second round of randomization for the 2010‐11 school year. This second cohort of children has produced a larger sample on which to assess Pre‐K effects and potentially replicate the findings reported above for the first RCT intensive substudy cohort. All the consented children in this second intensive study cohort will be followed through at least 3rd grade and individually assessed at the end of each school year. In addition, their teachers will rate their preparedness, data on retention and special education placements will be obtained from the state each year, and TCAP scores will be compiled when they become available. In addition, the data from the State EIS system (retention, special ed placements, and TCAP scores) will be compiled for all the children in both RCT cohorts; anonymized data from those records does not require parental consent.
Peabody Research Institute, Vanderbilt University
30
RDD: All four regions of the State will be covered by the end of the project. Data on the kindergarten readiness of the children as well as the features of the classrooms will be collected. Once data collection is complete, we will examine the relationship between important policy relevant variables and children’s kindergarten readiness. These variables include the experience and preparation of the teachers, the credentials of the Educational Assistants, the type of curriculum in use, and the quality of the classroom.
References
Cooper, D. H., & Farran, D. C. (1991). The CooperFarran Behavioral Rating Scales. Brandon, VT: Clinical Psychology Publishing.
Farran, D.C., Bilbrey, C. & Lipsey, M. (2003). Academic and Classroom Behavior Record. Unpublished scale available from D.C. Farran, Peabody Research Institute, Vanderbilt University, Nashville, TN.
Gormley, W. T., Gayer, T., Phillips, D., & Dawson, B. (2005). The effects of universal pre‐K on cognitive development. Developmental Psychology, 41, 872‐884.
Guo, S., & Fraser, M. W. (2010). Propensity score analysis. Statistical methods and applications. Thousand Oaks: Sage.
Wong, V. C., Cook, T. D., Barnett, W. S., & Jung, K. (2008). An effectiveness‐based evaluation of five state pre‐kindergarten programs. Journal of Policy Analysis and Management, 27(1), 122‐154.
Woodcock, R. W., McGrew, K. S., & Mather, N. (2001). WoodcockJohnson Tests of Cognitive Abilities. Itasca, IL: Riverside.
Peabody Research Institute, Vanderbilt University
31
Appendix A: Statistical Models and Results for the Woodcock Johnson III Scales in the RCT Intensive Substudy
WJ Composite Scale Full Model Reduced Model Effect Estimate SE p‐value Estimate SE p‐value Intercept ‐49.12 43.36 0.258 ‐43.82 42.26 0.301 CONDITION 5.48 1.28 0.000 5.48 1.28 0.000
CONDITION*Response rate ‐0.70 6.93 0.920 ‐0.65 6.93 0.925 Response rate 6.00 6.99 0.406 5.73 7.01 0.429 Propensity Score 45.23 16.06 0.005 43.76 15.86 0.006 Gender 3.12 1.43 0.029 3.01 1.41 0.034 Black ‐10.46 4.32 0.016 ‐10.08 4.27 0.019 Hispanic ‐14.18 6.14 0.022 ‐13.04 5.84 0.027 NonEnglish home language 1.08 1.70 0.527 Age 0.70 0.34 0.042 0.68 0.34 0.047 Weekend TV ‐1.57 0.63 0.013 ‐1.58 0.63 0.013 Home literacy ‐1.44 0.78 0.066 ‐1.44 0.78 0.067 Parent education 1.07 0.60 0.077 1.03 0.60 0.086 Pretest interval 0.63 0.23 0.007 0.61 0.23 0.008 Pre‐Post interval 0.56 0.18 0.002 0.55 0.18 0.002 WJ Composite pretest 0.61 0.10 0.000 0.61 0.10 0.000 Note: Multilevel with children nested within schools and treatment and control cases within each school weighted to the same proportions as for the total sample.
LetterWord Identification Full Model Reduced Model Effect Estimate SE p‐value Estimate SE p‐value Intercept ‐320.76 155.90 0.041 ‐273.57 141.63 0.055 CONDITION 10.63 2.84 0.000 10.64 2.84 0.000
CONDITION*Response rate 18.13 15.91 0.255 18.84 15.89 0.237 Response rate ‐3.22 15.26 0.835 ‐4.83 15.19 0.754 Propensity Score 126.37 44.16 0.005 112.56 40.04 0.005 Gender 6.74 4.04 0.097 5.68 3.78 0.134 Black ‐22.19 11.32 0.051 ‐18.72 10.31 0.071 Hispanic ‐33.28 13.47 0.014 ‐27.59 11.15 0.014 NonEnglish home language 3.16 4.12 0.445 Age 1.92 0.72 0.008 1.73 0.67 0.011 Weekend TV ‐4.10 1.76 0.021 ‐3.78 1.70 0.028 Home literacy ‐4.62 2.33 0.048 ‐4.14 2.24 0.066 Parent education 3.62 1.51 0.018 3.25 1.43 0.024 Pretest interval 1.53 0.58 0.009 1.36 0.53 0.011 Pre‐Post interval 1.28 0.44 0.004 1.16 0.40 0.005 LW pretest 0.37 0.11 0.001 0.39 0.10 0.000 Note: Multilevel with children nested within schools and treatment and control cases within each school weighted to the same proportions as for the total sample.
Peabody Research Institute, Vanderbilt University
32
Spelling Full Model Reduced Model Effect Estimate SE p‐value Estimate SE p‐value Intercept 17.00 185.15 0.927 130.86 16.98 0.000 CONDITION 8.42 3.44 0.032 8.78 3.60 0.025
CONDITION*Response rate ‐0.02 19.39 0.999 ‐4.04 19.93 0.842 Response rate 4.57 14.58 0.761 9.66 14.27 0.511 Propensity Score 32.78 46.81 0.485 14.06 8.74 0.110 Gender 5.01 4.15 0.229 Black ‐2.79 12.97 0.830 Hispanic ‐4.05 13.75 0.769 NonEnglish home language ‐1.60 4.83 0.741 Age 0.36 0.89 0.687 Weekend TV ‐0.41 1.73 0.813 Home literacy ‐0.56 2.44 0.817 Parent education 1.25 1.72 0.467 Pretest interval 0.36 0.67 0.592 Pre‐Post interval 0.36 0.52 0.485 SP pretest 0.60 0.11 0.000 0.65 0.05 0.000 Note: Multilevel with children nested within schools and treatment and control cases within each school weighted to the same proportions as for the total sample.
Oral Comprehension Full Model Reduced Model Effect Estimate SE p‐value Estimate SE p‐value Intercept 108.48 84.35 0.200 55.46 16.87 0.001 CONDITION 6.67 1.76 0.000 6.04 1.79 0.003
CONDITION*Response rate ‐16.46 10.14 0.109 ‐6.09 9.87 0.546 Response rate 14.09 7.17 0.051 6.90 7.66 0.381 Propensity Score 4.60 23.92 0.848 0.71 4.83 0.883 Gender ‐0.85 2.14 0.691 Black ‐2.17 6.51 0.739 Hispanic ‐9.92 6.85 0.150 NonEnglish home language 1.55 2.25 0.489 Age 0.13 0.31 0.683 Weekend TV 0.06 0.81 0.945 Home literacy 0.59 1.22 0.626 Parent education ‐0.95 0.79 0.230 Pretest interval ‐0.01 0.31 0.964 Pre‐Post interval ‐0.01 0.24 0.974 OC pretest 0.76 0.06 0.000 0.88 0.04 0.000 Note: Multilevel with children nested within schools and treatment and control cases within each school weighted to the same proportions as for the total sample.
Peabody Research Institute, Vanderbilt University
33
Picture Vocabulary Full Model Reduced Model Effect Estimate SE p‐value Estimate SE p‐value Intercept 117.67 45.71 0.015 151.61 10.04 0.000 CONDITION 5.72 1.46 0.001 5.89 1.50 0.001
CONDITION*Response rate ‐5.31 8.09 0.523 ‐4.26 7.93 0.602 Response rate 6.58 8.24 0.438 7.23 7.68 0.362 Propensity Score 4.65 16.82 0.783 0.97 4.06 0.811 Gender ‐0.46 1.55 0.766 Black ‐1.19 4.40 0.787 Hispanic ‐2.38 7.00 0.734 NonEnglish home language ‐2.38 1.84 0.197 Age 0.18 0.26 0.491 Weekend TV ‐0.78 0.63 0.216 Home literacy ‐0.05 0.84 0.954 Parent education ‐0.27 0.61 0.658 Pretest interval 0.15 0.21 0.489 Pre‐Post interval 0.17 0.17 0.320 PV pretest 0.64 0.07 0.000 0.67 0.02 0.000 Note: Multilevel with children nested within schools and treatment and control cases within each school weighted to the same proportions as for the total sample.
Applied Problems Full Model Reduced Model Effect Estimate SE p‐value Estimate SE p‐value Intercept 141.41 81.01 0.082 186.18 16.40 0.000 CONDITION 5.70 2.15 0.009 5.61 2.06 0.007
CONDITION*Response rate ‐19.92 11.91 0.096 ‐18.68 10.74 0.083 Response rate 26.32 11.00 0.030 27.23 9.46 0.004 Propensity Score 5.48 25.37 0.829 ‐8.63 6.30 0.172 Gender 4.51 2.21 0.042 3.79 1.66 0.023 Black ‐4.82 7.51 0.521 Hispanic ‐8.98 9.83 0.362 NonEnglish home language 0.58 2.92 0.843 Age 0.70 0.47 0.137 0.44 0.25 0.075 Weekend TV ‐0.21 1.05 0.840 Home literacy ‐0.69 1.27 0.590 Parent education 0.50 0.88 0.573 Pretest interval 0.19 0.36 0.587 Pre‐Post interval 0.19 0.27 0.483 AP pretest 0.44 0.10 0.000 0.51 0.03 0.000 Note: Multilevel with children nested within schools and treatment and control cases within each school weighted to the same proportions as for the total sample.
Peabody Research Institute, Vanderbilt University
34
Quantitative Concepts Full Model Reduced Model Effect Estimate SE p‐value Estimate SE p‐value Intercept ‐69.65 80.97 0.391 ‐2.73 40.79 0.947 CONDITION 6.10 1.72 0.003 6.19 1.63 0.000
CONDITION*Response rate ‐14.69 9.69 0.157 ‐15.99 8.77 0.069 Response rate 11.23 8.53 0.189 11.20 7.87 0.156 Propensity Score 52.23 26.94 0.054 27.48 10.68 0.011 Gender 0.14 2.26 0.952 Black ‐14.16 6.99 0.044 ‐7.82 2.92 0.008 Hispanic ‐17.28 7.91 0.030 ‐10.34 3.16 0.001 NonEnglish home language 1.25 2.62 0.634 Age 1.03 0.41 0.012 0.71 0.24 0.003 Weekend TV ‐2.69 0.89 0.003 ‐2.07 0.72 0.005 Home literacy ‐1.65 1.35 0.223 Parent education 1.21 0.90 0.180 Pretest interval 0.67 0.36 0.067 0.36 0.17 0.037 Pre‐Post interval 0.55 0.28 0.047 0.32 0.14 0.023 QC pretest 0.62 0.11 0.000 0.70 0.07 0.000 Note: Multilevel with children nested within schools and treatment and control cases within each school weighted to the same proportions as for the total sample.
Peabody Research Institute, Vanderbilt University
35
Appendix B: Statistical Models and Results for the Kindergarten Teachers’ Ratings in the RCT Intensive Substudy
a Low scores represent positive behavior. Note: Multilevel with children nested within schools and treatment and control cases within each school weighted to the same proportions as for the total sample.
CooperFarran Social Behavior Full Model Reduced Model Effect Estimate SE p‐value Estimate SE p‐value Intercept 70.27 56.72 0.217 44.56 15.46 0.005 CONDITIONa ‐0.96 1.69 0.570 0.94 1.66 0.572
a Low scores represent positive behavior. Note: Multilevel with children nested within schools and treatment and control cases within each school weighted to the same proportions as for the total sample.
a Low scores represent positive behavior. Note: Multilevel with children nested within schools and treatment and control cases within each school weighted to the same proportions as for the total sample.
ACBR Liking for School Full Model Reduced Model Effect Estimate SE p‐value Estimate SE p‐value Intercept 32.76 59.38 0.582 43.93 5.80 0.000 CONDITION ‐1.02 1.83 0.580 0.96 1.80 0.596
CONDITION*Response rate 9.28 14.69 0.529 6.60 14.01 0.638 Response rate ‐7.90 12.88 0.541 ‐6.26 12.08 0.605 Propensity Score 1.63 35.22 0.963 2.85 6.41 0.658 Gender 3.59 2.32 0.124 3.03 1.61 0.061 Black ‐0.57 7.40 0.938 Hispanic 0.37 10.92 0.973 NonEnglish home language 1.68 2.75 0.542 Age 0.18 0.76 0.810 Weekend TV 0.91 3.55 0.799 Home literacy 0.61 3.00 0.840 Parent education 0.63 1.51 0.679 0.71 0.55 0.197 Note: Multilevel with children nested within schools and treatment and control cases within each school weighted to the same proportions as for the total sample.
Peabody Research Institute, Vanderbilt University
37
ACBR Behavior Problems Yes/No Full Model Reduced Model Effect Estimate SE p‐value Estimate SE p‐value Intercept ‐1.20 2.92 0.682 ‐1.89 0.76 0.014 CONDITION 0.08 0.10 0.462 0.08 0.10 0.448
CONDITION*Response rate ‐0.67 0.76 0.396 ‐0.66 0.74 0.393 Response rate 0.44 0.65 0.507 0.44 0.60 0.475 Propensity Score 0.06 1.73 0.970 0.47 0.35 0.184 Gender 0.21 0.11 0.059 0.20 0.08 0.014 Black 0.01 0.36 0.968 Hispanic 0.12 0.53 0.821 NonEnglish home language 0.00 0.13 0.985 Age 0.03 0.04 0.376 0.04 0.01 0.001 Weekend TV ‐0.03 0.17 0.867 ‐0.07 0.04 0.097 Home literacy 0.06 0.15 0.666 Parent education ‐0.03 0.08 0.734 Note: Multilevel with children nested within schools and treatment and control cases within each school weighted to the same proportions as for the total sample.
CONDITION*Response rate ‐1.09 1.83 0.557 ‐0.25 1.70 0.886 Response rate 1.13 1.48 0.447 0.23 1.34 0.867 Propensity Score ‐4.73 4.19 0.262 ‐0.65 0.76 0.395 Gender ‐0.39 0.27 0.152 ‐0.58 0.18 0.002 Black 0.91 0.88 0.301 Hispanic 1.20 1.30 0.356 NonEnglish home language ‐0.55 0.32 0.084 ‐0.29 0.19 0.125 Age ‐0.15 0.09 0.105 ‐0.07 0.03 0.020 Weekend TV 0.37 0.42 0.380 Home literacy 0.29 0.36 0.415 Parent education ‐0.23 0.18 0.204 Note: Multilevel with children nested within schools and treatment and control cases within each school weighted to the same proportions as for the total sample.
Peabody Research Institute, Vanderbilt University
38
Appendix C: Statistical Models and Results for the Woodcock Johnson III Scales in the RDD