DOI: 10.1111/1475-679X.12067 Journal of Accounting Research Vol. 53 No. 1 March 2015 Printed in U.S.A. Inside the “Black Box” of Sell-Side Financial Analysts LAWRENCE D. BROWN, ∗ ANDREW C. CALL, † MICHAEL B. CLEMENT, ‡ AND NATHAN Y. SHARP § Received 7 March 2014; accepted 27 October 2014 ABSTRACT Our objective is to penetrate the “black box” of sell-side financial analysts by providing new insights into the inputs analysts use and the incentives they face. We survey 365 analysts and conduct 18 follow-up interviews covering a wide range of topics, including the inputs to analysts’ earnings forecasts and stock recommendations, the value of their industry knowledge, the de- terminants of their compensation, the career benefits of Institutional Investor All-Star status, and the factors they consider indicative of high-quality earn- ings. One important finding is that private communication with management is a more useful input to analysts’ earnings forecasts and stock recommen- dations than their own primary research, recent earnings performance, and ∗ Temple University; † Arizona State University; ‡ University of Texas at Austin; § Texas A&M University. Accepted by Christian Leuz. We appreciate helpful comments from two anonymous re- viewers, Mike Baer, David Bailey, Shuping Chen, Artur Hugon, Stephannie Larocque, Bill Mayew, Lynn Rees, Kim Ritrievi, Debika Sihi, Nathan Swem, Michael Tang (FARS discussant), Yen Tong, Senyo Tse, James Westphal, Richard Willis, Yong Yu, and workshop participants at Colorado State University, Georgetown University, Indiana University, Texas Christian Uni- versity, Tulane University, the 2013 Southeast Summer Accounting Research Conference (SESARC), the 2013 Temple University Accounting Conference, and the AAA Financial Ac- counting and Reporting Section 2014 Midyear Meeting. This paper was a finalist for the 2014 FARS Midyear Meeting best paper award. We are thankful for survey design assistance from Veronica Inchauste of the Office of Survey Research at the Annette Strauss Institute, and the excellent research assistance from John Easter, Alexandra Faulk, Emily Hammack, Ash- ley Loest, Lauren Schwaeble, Sarah Shaffell, and Paul Wong. An online appendix to this paper can be downloaded at http://research.chicagobooth.edu/arc/journal-of-accounting- research/online-supplements. 1 Copyright C , University of Chicago on behalf of the Accounting Research Center, 2014
Transcript
DOI: 10.1111/1475-679X.12067Journal of Accounting Research
Vol. 53 No. 1 March 2015Printed in U.S.A.
Inside the “Black Box” of Sell-SideFinancial Analysts
L A W R E N C E D . B R O W N ,∗ A N D R E W C . C A L L ,†
M I C H A E L B . C L E M E N T ,‡ A N D N A T H A N Y . S H A R P§
Received 7 March 2014; accepted 27 October 2014
ABSTRACT
Our objective is to penetrate the “black box” of sell-side financial analysts byproviding new insights into the inputs analysts use and the incentives theyface. We survey 365 analysts and conduct 18 follow-up interviews coveringa wide range of topics, including the inputs to analysts’ earnings forecastsand stock recommendations, the value of their industry knowledge, the de-terminants of their compensation, the career benefits of Institutional InvestorAll-Star status, and the factors they consider indicative of high-quality earn-ings. One important finding is that private communication with managementis a more useful input to analysts’ earnings forecasts and stock recommen-dations than their own primary research, recent earnings performance, and
∗Temple University; †Arizona State University; ‡University of Texas at Austin; §Texas A&MUniversity.
Accepted by Christian Leuz. We appreciate helpful comments from two anonymous re-viewers, Mike Baer, David Bailey, Shuping Chen, Artur Hugon, Stephannie Larocque, BillMayew, Lynn Rees, Kim Ritrievi, Debika Sihi, Nathan Swem, Michael Tang (FARS discussant),Yen Tong, Senyo Tse, James Westphal, Richard Willis, Yong Yu, and workshop participants atColorado State University, Georgetown University, Indiana University, Texas Christian Uni-versity, Tulane University, the 2013 Southeast Summer Accounting Research Conference(SESARC), the 2013 Temple University Accounting Conference, and the AAA Financial Ac-counting and Reporting Section 2014 Midyear Meeting. This paper was a finalist for the 2014FARS Midyear Meeting best paper award. We are thankful for survey design assistance fromVeronica Inchauste of the Office of Survey Research at the Annette Strauss Institute, andthe excellent research assistance from John Easter, Alexandra Faulk, Emily Hammack, Ash-ley Loest, Lauren Schwaeble, Sarah Shaffell, and Paul Wong. An online appendix to thispaper can be downloaded at http://research.chicagobooth.edu/arc/journal-of-accounting-research/online-supplements.
2 L. D. BROWN, A. C. CALL, M. B. CLEMENT, AND N. Y. SHARP
recent 10-K and 10-Q reports. Another notable finding is that issuing earn-ings forecasts and stock recommendations that are well below the consensusoften leads to an increase in analysts’ credibility with their investing clients.We conduct cross-sectional analyses that highlight the impact of analyst andbrokerage characteristics on analysts’ inputs and incentives. Our findings arerelevant to investors, managers, analysts, and academic researchers.
Sell-side financial analysts are of significant interest to academic researchersbecause of their prominent role in analyzing, interpreting, and disseminat-ing information to capital market participants. While early research on an-alysts focused on the statistical properties of their earnings forecasts and onimproving analysts’ expectations models (Fried and Givoly [1982], O’Brien[1988], Lys and Sohn [1990], Brown [1993]), later research investigatedthe investment value of analysts’ earnings forecasts and stock recommenda-tions (Womack [1996], Francis and Soffer [1997], Clement and Tse [2003],Howe, Unlu, and Yan [2009]). Starting with Schipper [1991] and Brown[1993], however, researchers have suggested the literature should focusmore on the context within which analysts make their decisions. More re-cently, Ramnath, Rock, and Shane [2008] and Bradshaw [2011] concludethat research on the “black box” of analysts’ decision processes is requiredfor the literature to progress. We penetrate this “black box” by surveying365 analysts and conducting 18 follow-up interviews to gain insights intothe inputs they use and the incentives they face.1
The inputs we investigate include the determinants of analysts’ earningsforecasts and stock recommendations; the frequency, nature, and useful-ness of their communication with senior management; the valuation mod-els they use to support their stock recommendations; their beliefs aboutwhat constitutes high-quality earnings; and, their perceptions of possible“red flags” of financial misrepresentation. With respect to incentives, we in-vestigate the determinants of analysts’ compensation, their motivation forgenerating accurate earnings forecasts and profitable stock recommenda-tions, and the consequences of issuing unfavorable earnings forecasts andstock recommendations. While prior research has generally focused on an-alysts’ incentives to please company management or generate underwritingbusiness, our findings highlight the strong incentives analysts face to satisfytheir investing clients.
1 Surveys have limitations, such as the potential for response bias, small sample sizes, socialdesirability biases, and construct validity issues. However, surveys enable researchers to askquestions that would be difficult to address with archival data.
INSIDE THE “BLACK BOX” OF SELL-SIDE FINANCIAL ANALYSTS 3
We summarize our main findings here and discuss our detailed results insection 3. Our findings shed light on the value of private communicationwith management as an input to analysts’ decision processes. Soltes [2014]finds that private communication with management is a valuable source ofinformation for analysts. We extend Soltes [2014] by providing evidencethat over half of the analysts we survey report that they have direct contactwith the CEO or CFO of the typical company they follow five or more timesa year. We also find that private communication with management is a moreimportant input to analysts’ earnings forecasts and stock recommendationsthan primary research, recent earnings performance, and recent 10-K and10-Q reports. Further, analysts rate private phone calls as one of the mostuseful types of direct contact with management for purposes of generat-ing their earnings forecasts and stock recommendations. Our follow-upinterviews reveal that some analysts avoid asking questions during publicconference calls and use private phone conversations to check the assump-tions of their models, to gain qualitative insights into the firm and its in-dustry, and to get other details not explained on public calls. Our findingsprovide a deeper understanding of analysts’ communication with manage-ment in the post–Regulation Fair Disclosure (Reg FD) environment andsuggest analysts incorporate pieces of nonpublic information from man-agement into a broader “mosaic.”
Institutional Investor (II) surveys regularly find that sell-side analysts’ indus-try knowledge is extremely valuable to their buy-side clients. We provide ev-idence that industry knowledge is a very important determinant of sell-sideanalysts’ compensation, suggesting brokerage houses provide analysts withincentives to satisfy their clients’ demand for industry knowledge (Brownet al. [2014]). We also find that industry knowledge is the single most usefulinput to analysts’ earnings forecasts and stock recommendations.
We asked analysts about their perceptions of earnings quality andtheir beliefs about potential “red flags” of intentional misreporting. Al-though Dichev et al. [2013] asked similar questions of the CFOs theysurveyed, users of financial accounting information (analysts) are likelyto have more informative views on financial reporting issues than pre-parers (CFOs). Specifically, analysts are an important source of infor-mation for their investing clients and have incentives to recognizeattributes of high-quality earnings because incorrect assessments of earn-ings quality could result in economic losses for their clients and havean adverse effect on their own reputation and compensation. Con-versely, CFOs face incentives to manage earnings, which could cre-ate a preference for low-quality earnings and bias their responses toquestions about earnings quality (Dechow et al. [2010], Nelson andSkinner [2013]). In addition, CFOs have other reporting incentives that arenot always consistent with those of investors (Nelson and Skinner [2013]).For example, Dichev et al. [2013] find that CFOs rate the avoidance of long-term estimates as an important feature of high-quality earnings. However,the analysts we survey do not believe this factor is an important earnings
4 L. D. BROWN, A. C. CALL, M. B. CLEMENT, AND N. Y. SHARP
attribute, suggesting CFOs may simply prefer earnings that do not requireadditional explanations to external parties (Nelson and Skinner [2013]).
The factors analysts believe are most indicative of high-quality earningsinclude that earnings are backed by operating cash flows, are sustainableand repeatable, reflect economic reality, and reflect consistent reportingchoices over time. While these findings suggest analysts could rein in earn-ings management before it escalates into more egregious misrepresenta-tions of the financial statements (Schrand and Zechman [2012]), we alsofind analysts generally do not focus on detecting fraud or intentional mis-reporting.
With respect to incentives, our results provide a better understanding ofthe nature and structure of analyst compensation. Regulators and investorshave expressed concerns about analysts’ conflicts of interest, and the SECand the major U.S. stock exchanges have worked together to fortify the“Chinese wall” separating the investment banking and research sides of bro-kerage houses. In spite of these efforts, 44% of our respondents say theirsuccess in generating underwriting business or trading commissions is veryimportant to their compensation, suggesting conflicts of interest remain apersistent concern for users of sell-side research.
While many prior studies emphasize II’s annual All-America ResearchTeam rankings (e.g., Stickel [1992], Leone and Wu [2007], Rees, Sharp,and Twedt [2014a]), the analysts we survey say broker votes are far moreimportant to their career advancement.2 Specifically, 83% of analysts indi-cate that broker votes are very important to their career advancement, whileonly 37% say the same about the II rankings. Our findings are consistentwith Maber, Groysberg, and Healy [2014], who find that unlike II rankings,broker votes translate directly into revenue for analysts’ employers.
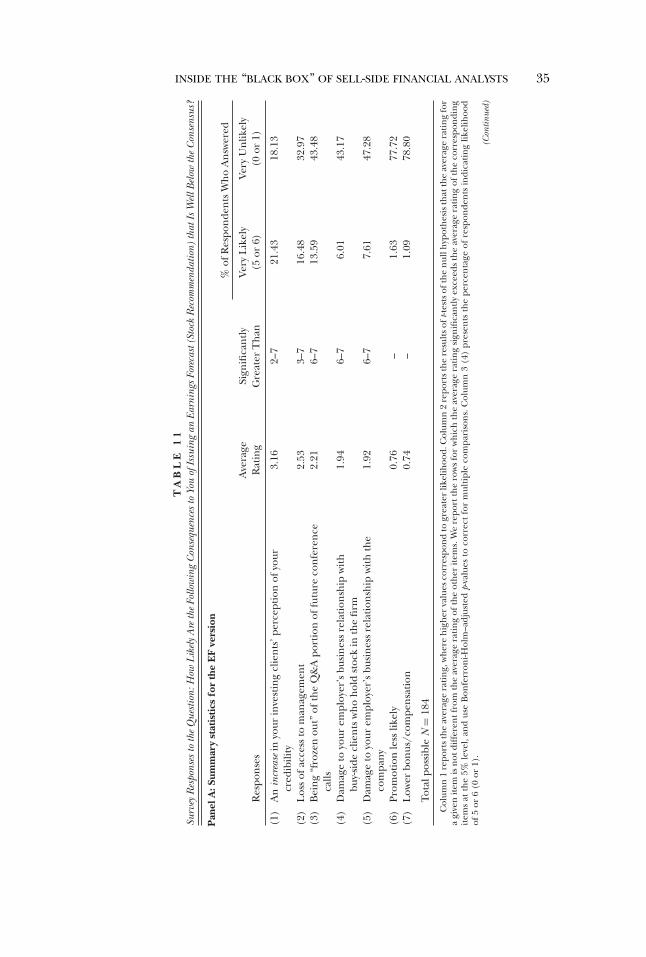
We highlight other incentives analysts face. For example, one of their pri-mary motivations for issuing accurate earnings forecasts is to use them asinputs to their own stock recommendations, revealing that analysts’ fore-casts are often a means to an end rather than an end unto themselves.In addition, analysts report that an increase in their credibility with investingclients is a more likely consequence of issuing unfavorable earnings fore-casts and stock recommendations than many of the negative consequencesdiscussed in prior research, such as being “frozen out” of the Q&A por-tion of future conference calls (Mayew [2008]). This finding underscoresanalysts’ balancing act of satisfying both company management and theirinvesting clients.
We conduct cross-sectional analyses that investigate the influence ofanalyst characteristics (gender, education, professional certifications,experience, and All-Star status) and brokerage house characteristics (size,investment banking activity, and client focus) on analysts’ inputs and incen-tives. Some of our results help explain findings in the existing literature.
2 Buy-side portfolio managers and buy-side analysts assess the value of research services pro-vided by sell-side brokerage houses and allocate research commissions through broker votes.
INSIDE THE “BLACK BOX” OF SELL-SIDE FINANCIAL ANALYSTS 5
For example, we find that female analysts are more motivated to issueaccurate earnings forecasts so they can use them as inputs to their stock rec-ommendations, providing a partial explanation for Kumar’s [2010] resultthat female analysts issue superior earnings forecasts. Other cross-sectionalresults add texture to our interviews and deepen our understanding of themain findings. For instance, our finding that analysts at large brokeragehouses are more likely to indicate that private communication with man-agement is a useful input to their stock recommendations is consistent witha potential information advantage for these analysts (Clement [1999]).
We make several contributions to the literature. A survey allows us to askanalysts questions about their inputs and incentives that would be difficultto address with archival data, enabling us to provide the literature with newinsights. Some of our findings strengthen the extant literature. For exam-ple, Soltes [2014] uses field evidence from a single large-cap firm to showthat private communication with management is valuable to sell-side an-alysts. We validate this finding with a broad sample of analysts followingmany firms from multiple industries and add context by assessing the valueof private communication relative to other inputs analysts employ.
We also highlight areas where analysts’ survey responses diverge from thefindings of prior research (e.g., the contrast between analysts’ and CFOs’views on earnings quality), and we provide direction for future research.For example, we address issues not considered by prior studies, such as thebenefits to analysts of issuing relatively pessimistic earnings forecasts andstock recommendations. In general, our findings underscore the challengeanalysts face when trying to maintain good relationships with firm manage-ment while also satisfying the demands of their investing clients. Our studyis relevant to investors who use analysts’ earnings forecasts and stock recom-mendations in their investing decisions, managers of companies followedby analysts, and analysts wishing to benchmark their practices and researchagainst a broad set of peers.
2. Survey Methodology, Interviews, and Cross-Sectional Analyses
2.1 SUBJECT POOL
Our subject pool consists of sell-side analysts with an equity research re-port published in Investext during the 12-month period from October 1,2011, to September 30, 2012. Investext includes more than 150,000 re-search reports from over 1,000 investment banks and brokerage housesduring our sample period. We recorded the name, email address, phonenumber, and employer of every analyst with a sole-authored research re-port in Investext during this period. Analysts sometimes submit multiau-thored (or team) research reports (Brown and Hugon [2009]). Thus, forevery lead analyst who submitted a team report, we identified his or hermost recent team report and collected contact information for every analyston that team. This process yielded 3,341 sell-side analysts with very recent
6 L. D. BROWN, A. C. CALL, M. B. CLEMENT, AND N. Y. SHARP
experience. As a frame of reference, our subject pool is 77.2% of the num-ber of analysts in I/B/E/S who issued an annual earnings forecast for atleast one U.S. firm in 2012.
2.2 SURVEY DESIGN AND DELIVERY
We initially developed a list of survey questions based on our review ofthe literature. Our intent was to identify relevant questions that would bedifficult to address using only archival data. After compiling a list of ques-tions, we contacted academic colleagues who are familiar with this litera-ture and asked them to suggest questions they would like to ask a groupof sell-side analysts.3 We received feedback on survey design from a profes-sional survey consultant who contracts with a large public university andfrom academic colleagues in various disciplines who are experienced inconducting surveys. We distributed pilot surveys to several analysts and aca-demic colleagues who helped us assess the reasonableness and presentationof our questions and the time required to complete the survey. This pro-cess helped reduce the possibility that we omitted fundamental questions,asked unimportant or ambiguous questions, or designed a survey requiringtoo much time to complete.
In an effort to address as many topics as possible, we created and admin-istered two related versions of the survey, each containing 14 questions fol-lowed by several demographic questions. Both versions of the survey beginwith five identical “common” questions, followed by six similar “twin” ques-tions. In one version, the twin questions are specific to earnings forecasts(hereafter, EF version); in the other version, the twin questions are specificto stock recommendations (hereafter, SR version) but are otherwise identi-cal. In each version, the twin questions are followed by three “unique” ques-tions that are loosely related to the theme of either the EF or SR version.For example, the EF version asks analysts about earnings quality, while theSR version asks analysts about the valuation models they employ. We askeda total of 23 questions across the two versions of the survey: 6 specific toearnings forecasts, 6 specific to stock recommendations, and 11 addressinganalysts’ inputs and incentives in other contexts. The survey instrument isavailable in an online appendix.4
We asked the common questions first because we did not want our sub-jects to think we deemed either earnings forecasts or stock recommen-dations (depending on which version of the survey they received) to beparticularly important. We asked the twin questions next to ensure thatthe responses to these questions would not be influenced by the differentsets of unique questions, which we presented last. With one exception, we
3 Other surveys of financial analysts include Bricker et al. [1995], Barker [1999], and Barkerand Imam [2008].
4 An online appendix to this paper can be downloaded at http://research.chicagobooth.edu/arc/journal-of-accounting-research/online-supplements.
INSIDE THE “BLACK BOX” OF SELL-SIDE FINANCIAL ANALYSTS 7
randomized the order of the questions presented within each set of ques-tions (common, twin, unique).5 Unless the options had a natural sequence(e.g., never, once a year, twice a year), we randomized the order of eachquestion’s options.6 Our survey ended with a series of demographic ques-tions. Demographic characteristics and the correlations among them areincluded in the online appendix.
We used Qualtrics.com to deliver the survey via email on January 9, 2013.Two weeks later, we sent a reminder email to analysts who had not com-pleted the survey.7 We closed the survey on February 6, 2013, four weeksafter our original email. To encourage participation, we told our subjectswe would donate $10,000 multiplied by the response rate to our survey andthat we would allocate the total donation among four charities from whichwe allowed the analysts to choose.
We informed analysts that their responses would be held in strict confi-dence, that no individual response would be reported, and that the surveyshould take less than 15 minutes to complete.8 Qualtrics.com assigned eachresponding analyst, in alternating fashion, one of the two versions of thesurvey. We received a total of 365 responses for a response rate of 10.9%,which exceeds that of other accounting and finance surveys administeredvia email (e.g., Dichev et al. [2013] report a response rate of 5.4%, andGraham, Harvey, and Rajgopal [2005] report an 8.4% response rate on theportion of their survey delivered via the internet).
2.3 INTERVIEWS
We asked analysts to provide their phone numbers if they were willingto be contacted for a follow-up interview. Eighty-two analysts provided theirphone numbers, and we conducted one-on-one interviews with 18 analyststo gain additional insights beyond those contained within the responses toour survey.9 We made audio recordings of 13 of these interviews (average
5 In each version of the survey, we asked two “twin” questions about how often researchmanagement exerts upward or downward pressure on analysts’ earnings forecasts (EF version)or stock recommendations (SR version). Because these two questions are naturally related toeach other, we wanted analysts to answer them in sequence. Therefore, we asked these two“twin” questions last.
6 See tables A3 and A5 in the online appendix.7 We used the Kolmogorov-Smirnov test (untabulated) to compare the distribution of de-
mographic characteristics between analysts who responded to the survey early (i.e., before wesent the reminder email) versus late (i.e., after we sent the reminder email). We cannot rejectthe null hypothesis of equal distributions for any characteristic except analyst age, where thep-value is a marginally significant 0.086 (two-tailed). We did not compare the distribution ofdegrees and certifications between early and late responders because analysts can have mul-tiple degrees (e.g., an undergraduate degree in economics and an MBA) and professionalcertifications (e.g., CPA and CFA).
8 Excluding 21 analysts who took more than one hour to complete the survey, likely becauseof interruptions at work, the mean (median) time the analysts took to complete the survey was14.1 (12.0) minutes.
9 We conducted 17 interviews by phone and one in person. Before conducting any inter-views, we tabulated all the demographic information for each analyst who volunteered to be
8 L. D. BROWN, A. C. CALL, M. B. CLEMENT, AND N. Y. SHARP
length was 30 minutes, 50 seconds) and took detailed notes on the otherfive. The 18 analysts we interviewed represent four of the nine primary in-dustries listed in the survey and six “other” industries: four are female, theyhave a median of three to six years of experience both as sell-side analystsand at their current employer, they follow a median of 16–25 companies,and 55% of them work at brokerage houses with more than 25 sell-sideanalysts.
2.4 CROSS-SECTIONAL ANALYSES
We explore cross-sectional variation in survey responses based on ana-lyst and brokerage house characteristics (Clement [1999]). For each surveyquestion, we regress analysts’ responses (which usually range from 0 to 6)on the following 12 characteristics:
+ ß5Experience + ß6I I AllStar + ß7StarMine + ß8WSJ
+ ß9Broker Size + ß10I Bank + ß11Retail Focus
+ ß12HF Focus + �Industry + ε, (1)
where Survey Response is the analyst’s response to the survey question beingexamined. We formally define the independent variables in the appendix.
We obtain values of six independent variables (Gender, Accounting, MBA,CFA, Experience, and Broker Size) from the results of demographic questionswe pose in the survey. Unlike Gender, Accounting, MBA, and CFA, neitherExperience nor Broker Size is a binary response. To facilitate interpretationof our results, we create indicator variables for Experience and Broker Sizebased on the median response for each variable, allowing for approximatelythe same number of analysts to be coded either 0 or 1 (e.g., 7+ years forExperience; 26+ sell-side analysts for Broker Size).
We hand-collect the data for WSJ, StarMine, and II AllStar to examinewhether award-winning analysts use different inputs or have different in-centives from other analysts.10 We define each of these variables basedon award status on the date we administered the survey. Following priorresearch (Bradshaw, Huang, and Tan [2014], Rees, Sharp, and Wong
interviewed. Our objective was to interview analysts with a range of demographic character-istics (e.g., gender, experience, primary industry, broker size) that represented the overallsample. Thus, we interviewed both male and female analysts with varying levels of experience,representing a variety of primary industries, and from brokerage houses of varying size. Asidefrom the demographic information, we did not refer to any individual survey responses whendeciding whom to call or what to ask. No analyst we contacted declined our request for aninterview.
10 WSJ analysts are selected based on the profitability of their recommendations. StarMineanalysts are awarded based on both the profitability of their recommendations and the accu-racy of their earnings forecasts. II All-America Research analysts are selected based on votes byinstitutional investors.
INSIDE THE “BLACK BOX” OF SELL-SIDE FINANCIAL ANALYSTS 9
[2014b]), we use Thomson One Banker to determine whether analysts’ em-ployers provide underwriting of debt or equity issuances (I Bank). We codethe last two indicator variables, Retail Focus and HF Focus, based on the sur-vey responses compiled in table 12, to capture the extent to which retailinvesting clients and hedge funds are important to the analyst’s employer.We include industry fixed effects based on the primary industry the analystcovers.
For brevity, we report all cross-sectional results in the online appendix.We limit our discussion of cross-sectional results in the text to those thatare significant at the 5% level or better, briefly summarizing the results weconsider most interesting.
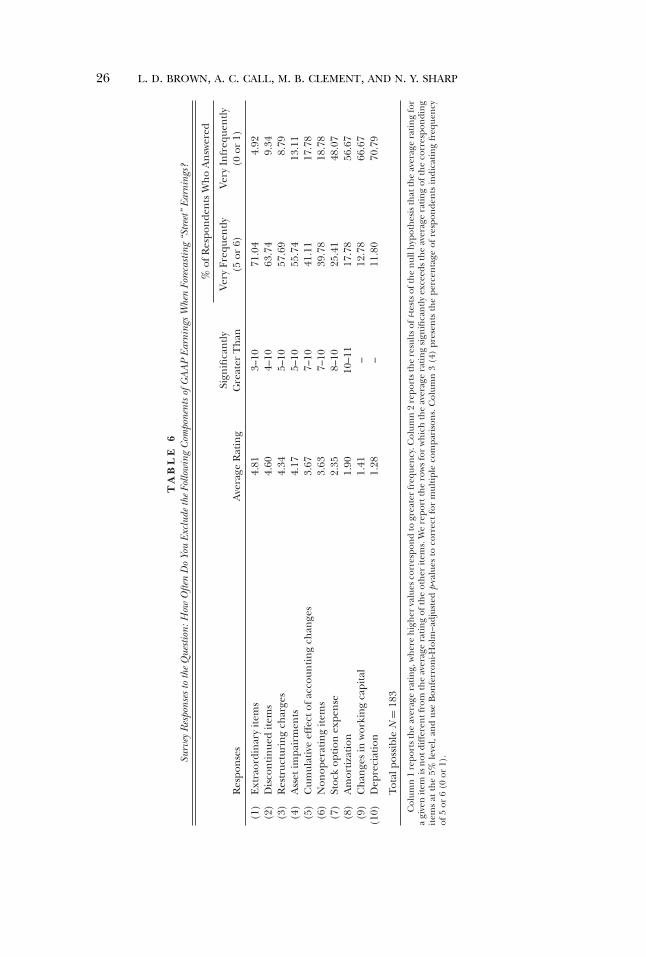
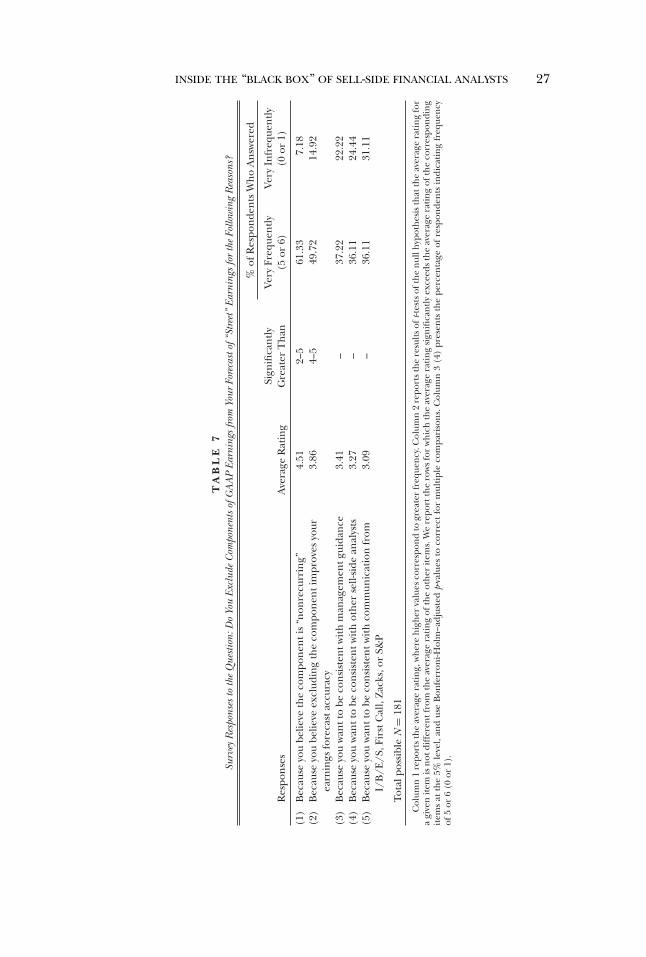
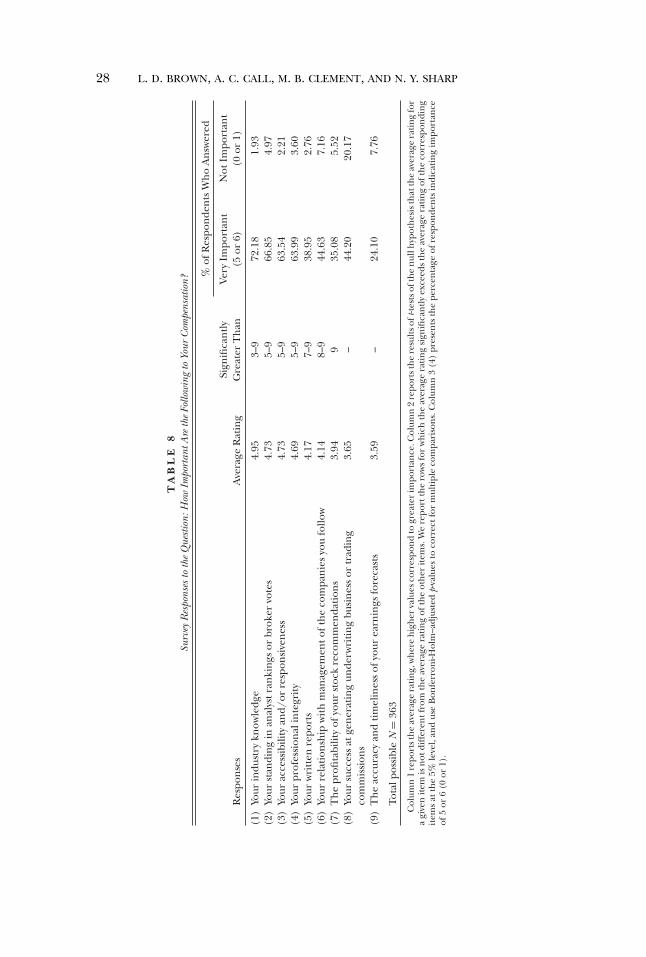
3. Results and Interview Responses
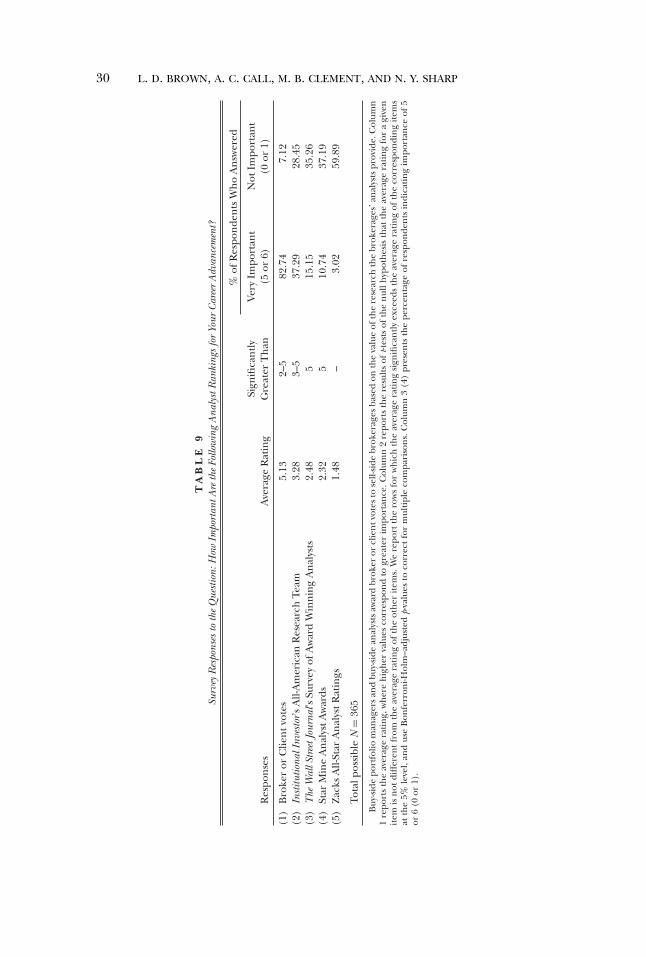
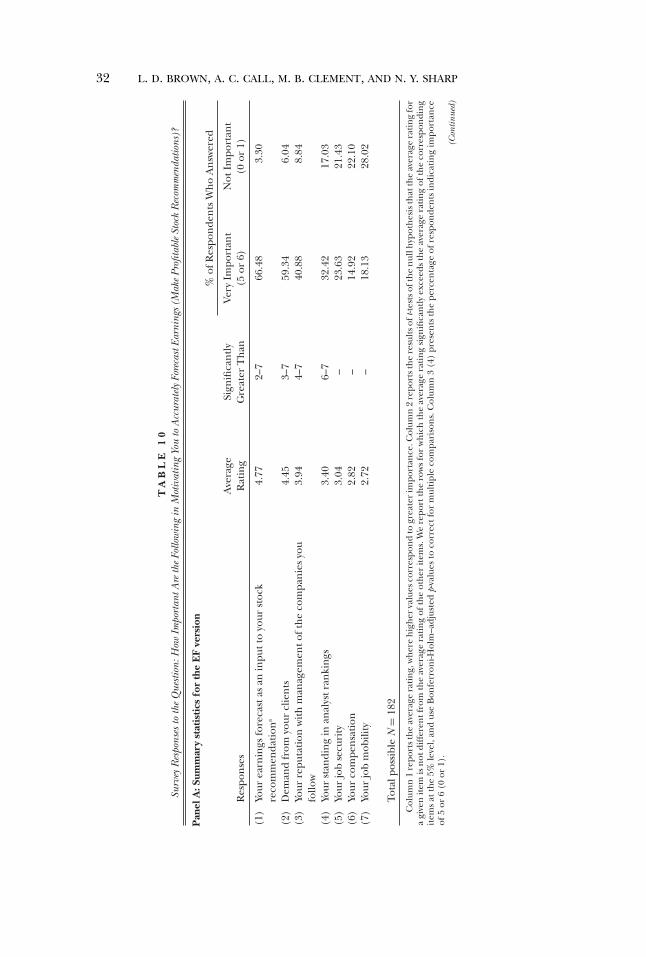
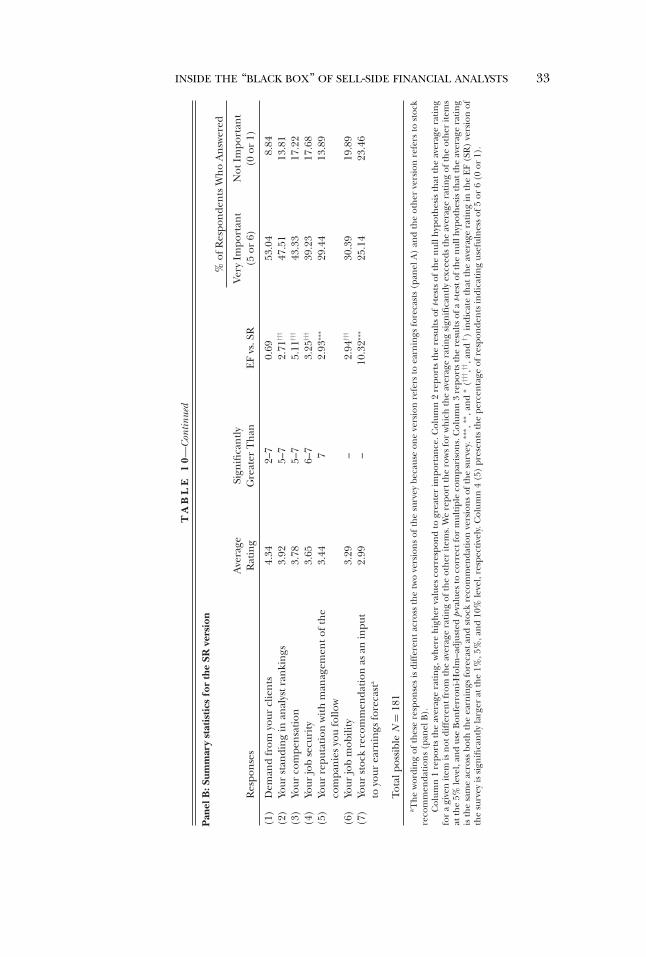
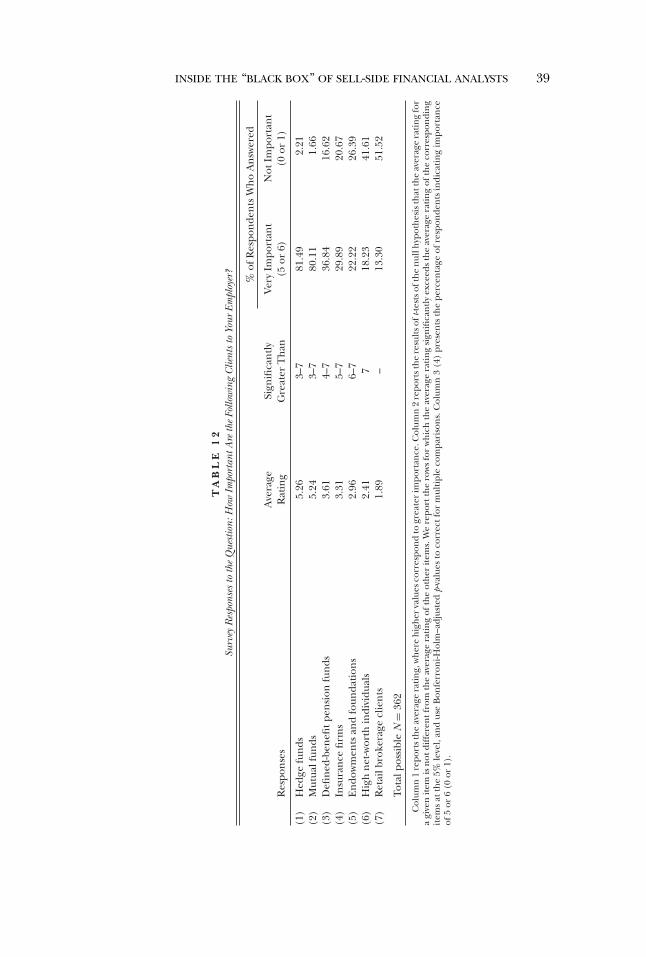
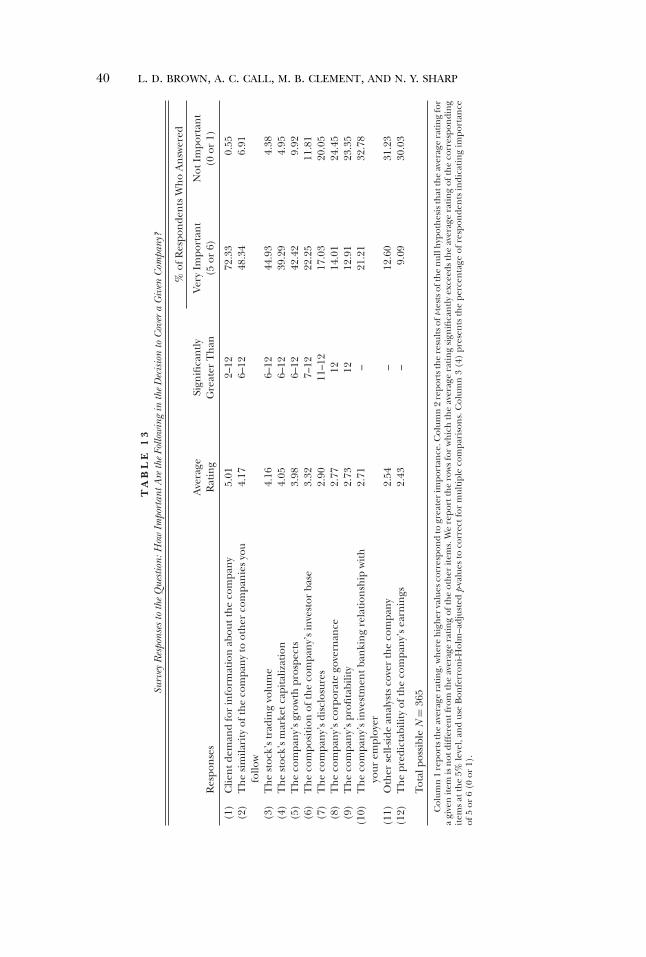
We organize the results based on the primary themes of our survey.Tables 1 through 7 address the inputs analysts use in their decisions. Specif-ically, tables 1 and 2 relate to general inputs to analysts’ earnings forecastsand stock recommendations, table 3 pertains to analyst direct contact withmanagement, and tables 4 to 7 present results relating to analysts’ assess-ments of financial reporting quality. Tables 8 through 13 address the incen-tives analysts face. Specifically, tables 8 and 9 report on the determinantsof analysts’ career success, tables 10 and 11 present responses to questionsabout factors that influence analysts’ earnings forecasts and stock recom-mendations, and tables 12 and 13 relate to other incentives analysts face.
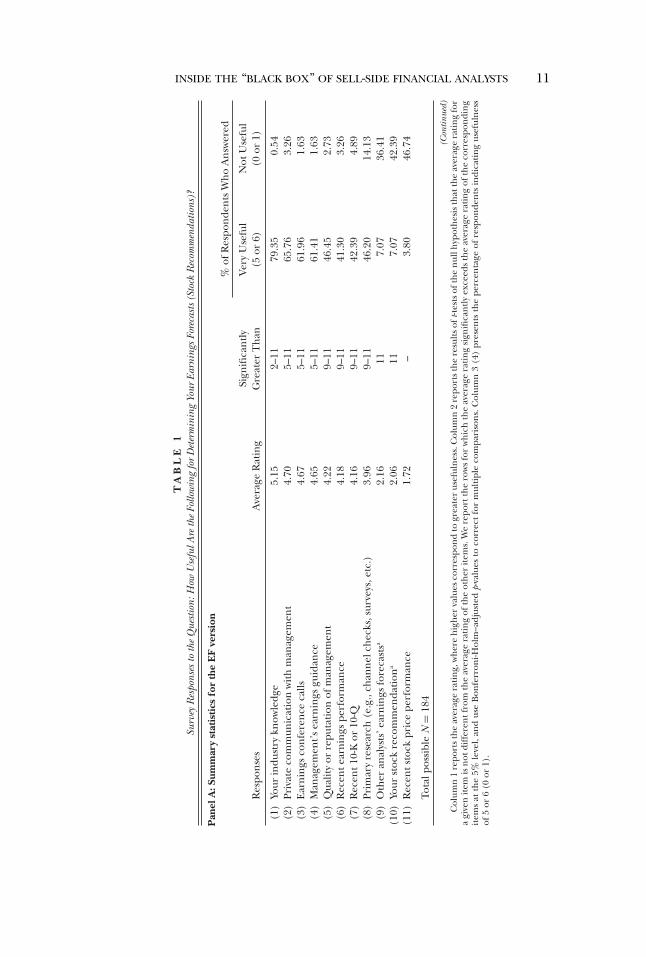
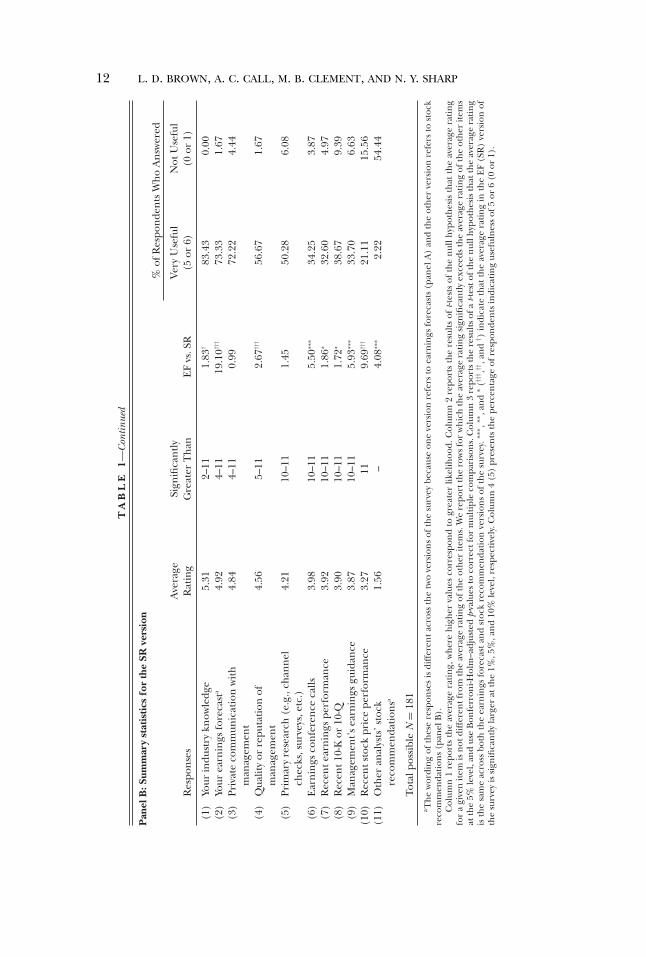
In the first column of each table, we report the choices for each questionbased on the average ratings from the analysts. We also test whether theaverage rating for a given choice exceeds the average rating of the otherchoices, and, in the second column, we report the rows corresponding toa significant difference at the 5% level, using Bonferroni-Holm–adjustedp-values to correct for multiple comparisons. The final two columns indi-cate the percentage of respondents who rate each choice near the top andbottom of the scale. In panel B of the four tables that contain the “twin”questions (tables 1, 3, 10, and 11), the middle column further reports theresults of a t-test of the null hypothesis that the average rating is the sameacross both the EF and SR versions of the survey.
3.1 FREQUENCY AND CORRELATIONS OF DEMOGRAPHIC CHARACTERISTICS(ONLINE APPENDIX)
Among the analysts responding to the survey, the most commonlycovered “primary” industries are banking/finance/insurance (15.1%),transportation/energy (14.5%), technology (12.3%), and retail/wholesale(9.3%).11 Of those stating “other,” 29 analysts indicated health care, mak-ing it the fifth most covered industry (7.9%). Nearly half cover only one
11 We follow Dichev et al. [2013] in our choice of industries.
10 L. D. BROWN, A. C. CALL, M. B. CLEMENT, AND N. Y. SHARP
industry, and the median and modal analyst follows 16–25 firms. The vastmajority of our respondents are male and under 50 years of age. Almost halfhave either an MBA or an undergraduate degree in economics or finance.More than a third are CFAs, but less than 4% are CPAs. Approximately halfhave been sell-side analysts for at least six years, have worked for their em-ployer for at least three years, and work for a brokerage house with morethan 25 analysts. For comparative purposes, we provide statistics for all ana-lysts in I/B/E/S during 2012. The primary difference between our sampleand I/B/E/S analysts is that our sample analysts follow more firms, suggest-ing I/B/E/S potentially excludes some firms that analysts follow.12
3.2 GENERAL INPUTS
One limitation of the existing literature is researchers’ inability to ob-serve the inputs that shape analysts’ outputs (Ramnath, Rock, and Shane[2008], Bradshaw [2011]). We asked survey questions with the goal of shed-ding light on the inputs analysts use when forming their earnings forecastsand stock recommendations.
3.2.1. How Useful Are the Following for Determining Your Earnings Forecasts/Stock Recommendations? (Table 1). While II surveys regularly find that indus-try knowledge is highly valued by analysts’ buy-side clients, little evidenceexists regarding the importance of industry knowledge to sell-side analysts.Table 1 reveals that industry knowledge is the single most useful input toboth analysts’ earnings forecasts (panel A) and their stock recommenda-tions (panel B). Industry knowledge includes understanding the indus-try’s key trends and technologies; its supply chains, distribution models,and margins; and its customers, labor, and management teams. Consistentwith evidence from archival research that industry knowledge is an impor-tant strength of sell-side analysts (Piotroski and Roulstone [2004], Kadanet al. [2012]), our respondents indicate that industry knowledge is the mostuseful input to their earnings forecasts and stock recommendations.
Private communication with management is another useful input toanalysts’ earnings forecasts and stock recommendations, underscoringthe importance of analysts’ access to management. While prior researchdemonstrates that private communication with management is valuableto sell-side analysts (Soltes [2014]), we document that it is even moreuseful to analysts than their own primary research, the firms’ recentearnings performance, and the recent 10-K or 10-Q reports. Analysts atthe largest brokerage houses indicate that private communication withmanagement is a more useful input to their stock recommendations than
12 We unambiguously identified 209 of our sample analysts in I/B/E/S, and we comparedthe number of firms these analysts say they follow with the number that I/B/E/S reports theyfollowed in January 2013 (immediately before we administered the survey). Sixty-four analystsreport following more firms than I/B/E/S suggests, while only 21 analysts report followingfewer firms than I/B/E/S indicates.
INSIDE THE “BLACK BOX” OF SELL-SIDE FINANCIAL ANALYSTS 11
TA
BL
E1
Surv
eyR
espo
nses
toth
eQ
uest
ion:
How
Use
fulA
reth
eFo
llow
ing
for
Det
erm
inin
gYo
urEa
rnin
gsFo
reca
sts
(Sto
ckR
ecom
men
datio
ns)?
Pan
elA
:Sum
mar
yst
atis
tics
for
the
EF
vers
ion
%of
Res
pon
den
tsW
ho
An
swer
ed
Sign
ifica
ntl
yVe
ryU
sefu
lN
otU
sefu
lR
espo
nse
sA
vera
geR
atin
gG
reat
erT
han
(5or
6)(0
or1)
(1)
Your
indu
stry
know
ledg
e5.
152–
1179
.35
0.54
(2)
Priv
ate
com
mun
icat
ion
wit
hm
anag
emen
t4.
705–
1165
.76
3.26
(3)
Ear
nin
gsco
nfe
ren
ceca
lls4.
675–
1161
.96
1.63
(4)
Man
agem
ent’s
earn
ings
guid
ance
4.65
5–11
61.4
11.
63(5
)Q
ualit
yor
repu
tati
onof
man
agem
ent
4.22
9–11
46.4
52.
73(6
)R
ecen
tear
nin
gspe
rfor
man
ce4.
189–
1141
.30
3.26
(7)
Rec
ent1
0-K
or10
-Q4.
169–
1142
.39
4.89
(8)
Prim
ary
rese
arch
(e.g
.,ch
ann
elch
ecks
,sur
veys
,etc
.)3.
969–
1146
.20
14.1
3(9
)O
ther
anal
ysts
’ear
nin
gsfo
reca
stsa
2.16
117.
0736
.41
(10)
Your
stoc
kre
com
men
dati
ona
2.06
117.
0742
.39
(11)
Rec
ents
tock
pric
epe
rfor
man
ce1.
72–
3.80
46.7
4
Tota
lpos
sibl
eN
=18
4
(Con
tinue
d)C
olum
n1
repo
rts
the
aver
age
rati
ng,
wh
ere
hig
her
valu
esco
rres
pon
dto
grea
ter
usef
uln
ess.
Col
umn
2re
port
sth
ere
sult
sof
t-tes
tsof
the
nul
lhyp
oth
esis
that
the
aver
age
rati
ng
for
agi
ven
item
isn
otdi
ffer
entf
rom
the
aver
age
rati
ng
ofth
eot
her
item
s.W
ere
port
the
row
sfo
rw
hic
hth
eav
erag
era
tin
gsi
gnifi
can
tly
exce
eds
the
aver
age
rati
ng
ofth
eco
rres
pon
din
git
ems
atth
e5%
leve
l,an
dus
eB
onfe
rron
i-Hol
m–a
djus
ted
p-va
lues
toco
rrec
tfo
rm
ulti
ple
com
pari
son
s.C
olum
n3
(4)
pres
ents
the
perc
enta
geof
resp
onde
nts
indi
cati
ng
usef
uln
ess
of5
or6
(0or
1).
12 L. D. BROWN, A. C. CALL, M. B. CLEMENT, AND N. Y. SHARP
TA
BL
E1—
Con
tinue
d
Pan
elB
:Sum
mar
yst
atis
tics
for
the
SRve
rsio
n%
ofR
espo
nde
nts
Wh
oA
nsw
ered
Ave
rage
Sign
ifica
ntl
yVe
ryU
sefu
lN
otU
sefu
lR
espo
nse
sR
atin
gG
reat
erT
han
EF
vs.S
R(5
or6)
(0or
1)
(1)
Your
indu
stry
know
ledg
e5.
312–
111.
83†
83.4
30.
00(2
)Yo
urea
rnin
gsfo
reca
sta
4.92
4–11
19.1
0†††
73.3
31.
67(3
)Pr
ivat
eco
mm
unic
atio
nw
ith
man
agem
ent
4.84
4–11
0.99
72.2
24.
44
(4)
Qua
lity
orre
puta
tion
ofm
anag
emen
t4.
565–
112.
67†††
56.6
71.
67
(5)
Prim
ary
rese
arch
(e.g
.,ch
ann
elch
ecks
,sur
veys
,etc
.)4.
2110
–11
1.45
50.2
86.
08
(6)
Ear
nin
gsco
nfe
ren
ceca
lls3.
9810
–11
5.50
∗∗∗
34.2
53.
87(7
)R
ecen
tear
nin
gspe
rfor
man
ce3.
9210
–11
1.86
∗32
.60
4.97
(8)
Rec
ent1
0-K
or10
-Q3.
9010
–11
1.72
∗38
.67
9.39
(9)
Man
agem
ent’s
earn
ings
guid
ance
3.87
10–1
15.
93∗∗
∗33
.70
6.63
(10)
Rec
ents
tock
pric
epe
rfor
man
ce3.
2711
9.69
†††
21.1
115
.56
(11)
Oth
eran
alys
ts’s
tock
reco
mm
enda
tion
sa
1.56
–4.
08∗∗
∗2.
2254
.44
Tota
lpos
sibl
eN
=18
1a T
he
wor
din
gof
thes
ere
spon
ses
isdi
ffer
ent
acro
ssth
etw
ove
rsio
ns
ofth
esu
rvey
beca
use
one
vers
ion
refe
rsto
earn
ings
fore
cast
s(p
anel
A)
and
the
oth
erve
rsio
nre
fers
tost
ock
reco
mm
enda
tion
s(p
anel
B).
Col
umn
1re
port
sth
eav
erag
era
tin
g,w
her
eh
igh
erva
lues
corr
espo
nd
togr
eate
rlik
elih
ood.
Col
umn
2re
port
sth
ere
sult
sof
t-tes
tsof
the
nul
lhyp
oth
esis
that
the
aver
age
rati
ng
for
agi
ven
item
isn
otdi
ffer
entf
rom
the
aver
age
rati
ng
ofth
eot
her
item
s.W
ere
port
the
row
sfo
rw
hic
hth
eav
erag
era
tin
gsi
gnifi
can
tly
exce
eds
the
aver
age
rati
ng
ofth
eot
her
item
sat
the
5%le
vel,
and
use
Bon
ferr
oni-H
olm
–adj
uste
dp-
valu
esto
corr
ectf
orm
ulti
ple
com
pari
son
s.C
olum
n3
repo
rts
the
resu
lts
ofa
t-tes
toft
he
nul
lhyp
oth
esis
that
the
aver
age
rati
ng
isth
esa
me
acro
ssbo
thth
eea
rnin
gsfo
reca
stan
dst
ock
reco
mm
enda
tion
vers
ion
sof
the
surv
ey.∗∗
∗ ,∗∗
,an
d∗
(†††
,††,a
nd
† )in
dica
teth
atth
eav
erag
era
tin
gin
the
EF
(SR
)ve
rsio
nof
the
surv
eyis
sign
ifica
ntl
yla
rger
atth
e1%
,5%
,an
d10
%le
vel,
resp
ecti
vely
.Col
umn
4(5
)pr
esen
tsth
epe
rcen
tage
ofre
spon
den
tsin
dica
tin
gus
eful
nes
sof
5or
6(0
or1)
.
INSIDE THE “BLACK BOX” OF SELL-SIDE FINANCIAL ANALYSTS 13
other analysts do, offering a possible explanation for Ertimur, Sunder, andSunder’s [2007] finding that analysts at large brokerage houses issue moreprofitable stock recommendations.
More than 70% of analysts indicate that their own earnings forecasts area very useful input to their stock recommendations, consistent with ourevidence in table 10 that analysts’ most important motivation for issuing ac-curate earnings forecasts is to use them as inputs to their own stock recom-mendations. Our findings reveal that analysts’ earnings forecasts are usefulnot only as a stand-alone output but also as an input to their stock recom-mendations.
Stock prices are a leading indicator of future earnings (Beaver,Lambert, and Morse [1980], Basu [1997]), and prior research indicates an-alysts’ earnings forecasts do not fully reflect the information in prior stockprice changes (Lys and Sohn [1990], Abarbanell [1991]). Similarly, our re-spondents indicate that recent stock price performance is not particularlyuseful for determining their earnings forecasts.
Although analysts generally report that other analysts’ earnings forecasts(stock recommendations) are not useful for determining their own earn-ings forecasts (stock recommendations), some interviewees said they some-times examine other analysts’ reports.13 One said the main reason his teamlooks at other analysts’ estimates is to remove stale earnings forecasts fromthe consensus. Another reported, “Some analysts are just better than oth-ers, so I watch them more closely. If I notice that they’re very light on anestimate, then it gives me pause. I say, ‘Why am I 10 cents above this guy?’And I go back and look, and I say, ‘Am I still comfortable that I did it right?’I’m not going to change it, but I am going to double-check. This isn’t anidiot, and he’s 10 cents below me. Why is that?”
One analyst stated, “You keep an eye on the outliers, because a lot oftimes if people do have a contrarian opinion, it’s interesting to see howthey’re thinking about it.” Another analyst said, “We don’t care about otheranalysts’ stock ratings. We never look. But we do care about where esti-mates come out after the quarter, especially for new companies . . . If we’reoff, and we don’t have a non-consensus view on something, we ask, ‘OK,why are we this low?’ And usually there’s a reason why, and that’s OK. Butif there’s not, it’s a red flag to us that maybe we’re overlooking part of thestory or making an error.” Consistent with prior research on herding inanalyst earnings forecasts (Trueman [1994], Welch [2000], Clement andTse [2005]), our comparison of responses to the twin questions reveals that
13 One inherent difficulty with surveys is that respondents may be reluctant to disclose thefull extent of certain beliefs or practices if they perceive that such disclosure could result inan unfavorable portrayal of them or their profession. Despite evidence of herding behavioramong sell-side analysts in the literature, our respondents give other analysts’ earnings fore-casts and stock recommendations low ratings in terms of their usefulness as inputs to theirown forecasts and recommendations. We cannot rule out the possibility that analysts biasedtheir responses downward to avoid appearing to rely heavily on other analysts.
14 L. D. BROWN, A. C. CALL, M. B. CLEMENT, AND N. Y. SHARP
analysts find other analysts’ earnings forecasts more useful than other ana-lysts’ stock recommendations.14
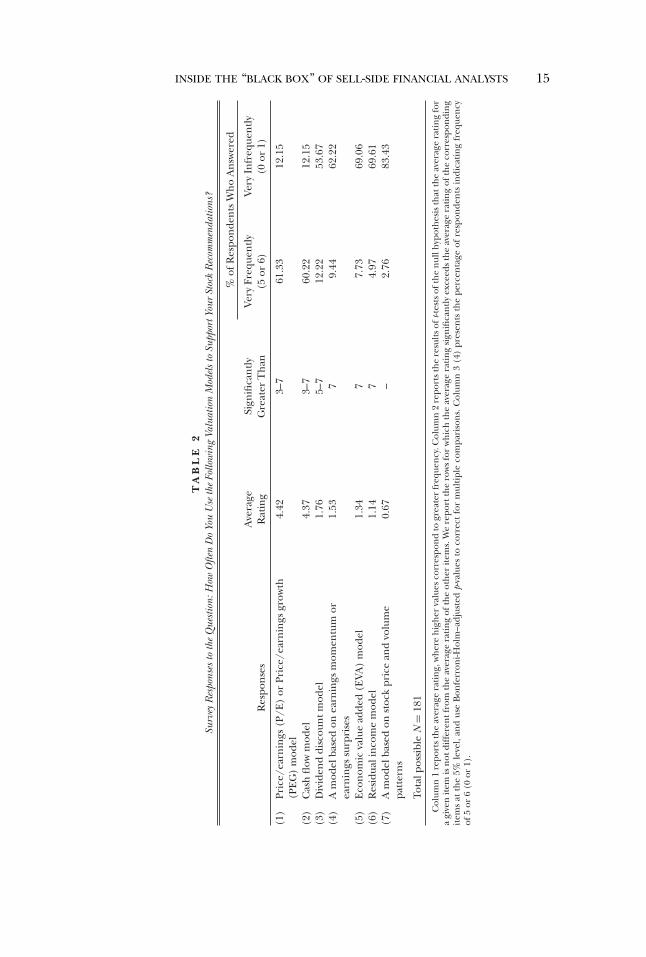
3.2.2. How Often Do You Use the Following Valuation Models to Support YourStock Recommendations? (Table 2). Consistent with Bradshaw [2004], mostanalysts state that they very frequently rely on price-earnings (P/E) or price-earnings-growth (PEG) models to support their stock recommendations.Reliance on P/E or PEG models implies that analysts’ earnings forecastsare a key factor in their valuation models, consistent with our result in table10 that analysts’ most important motivation for issuing accurate earningsforecasts is to use their forecasts as an input to their stock recommenda-tions. We also find that most analysts frequently use cash flow models butuse the other five models much less frequently.
3.3 COMMUNICATION WITH MANAGEMENT
Although prior research examines the role of analysts’ communicationwith company management (Chen and Matsumoto [2006], Ke and Yu[2006], Soltes [2014]), several important questions remain unanswered,such as the usefulness of private communication with management relativeto other inputs analysts employ, the frequency of analysts’ communicationwith management, and the relative usefulness of different venues for con-tact with management. We asked analysts several questions to address theseissues.
3.3.1. How Often Do You Have Direct Contact with the CEO or CFO of the Typ-ical Company You Cover? (Online Appendix). Among our responding analysts,98.4% say they have direct contact with the CEO or CFO of the typical firmthey cover at least once a year, and 53.2% have direct contact at least fivetimes a year. Although our interviewees said Reg FD was a “game changer”that profoundly affected the way management communicates with analysts,several stated that managers are more accessible now than when Reg FDwas first implemented. One analyst described the changes from the pre–Reg FD period to today as follows: “There was a lot of backroom chatterbefore Reg FD. Now management has figured out how to ‘paper things up’[with an 8-K]. So now we’re almost back to where we were pre–Reg FD, butnot quite because that backroom chatter is shut down. It’s just now it’s notin the backroom; it’s everywhere.”
14 To determine whether we can reliably compare answers to twin questions in the EF andSR versions of our survey, we test whether respondents to the two versions of the survey pro-vide similar answers to the five common questions discussed earlier. The respondents to the EFand SR versions of the survey provide virtually identical answers to the five common questions.Specifically, for each of the 39 choices available in these questions, we compare the averagerating between the EF respondents and the SR respondents. Untabulated t-tests reveal no sig-nificant differences between the two groups at the 1% level, no significant differences betweenthe two groups at the 5% level, and only three significant differences between the two groupsat the 10% level. Establishing the similarity of these two groups of analysts enables us to reliablycompare answers to twin questions in the two versions of our survey.
INSIDE THE “BLACK BOX” OF SELL-SIDE FINANCIAL ANALYSTS 15
TA
BL
E2
Surv
eyR
espo
nses
toth
eQ
uest
ion:
How
Ofte
nD
oYo
uU
seth
eFo
llow
ing
Valu
atio
nM
odel
sto
Supp
ortY
our
Stoc
kR
ecom
men
datio
ns?
%of
Res
pon
den
tsW
ho
An
swer
ed
Ave
rage
Sign
ifica
ntl
yVe
ryFr
eque
ntl
yVe
ryIn
freq
uen
tly
Res
pon
ses
Rat
ing
Gre
ater
Th
an(5
or6)
(0or
1)
(1)
Pric
e/ea
rnin
gs(P
/E)
orPr
ice/
earn
ings
grow
th(P
EG
)m
odel
4.42
3–7
61.3
312
.15
(2)
Cas
hfl
owm
odel
4.37
3–7
60.2
212
.15
(3)
Div
iden
ddi
scou
ntm
odel
1.76
5–7
12.2
253
.67
(4)
Am
odel
base
don
earn
ings
mom
entu
mor
earn
ings
surp
rise
s1.
537
9.44
62.2
2
(5)
Eco
nom
icva
lue
adde
d(E
VA)
mod
el1.
347
7.73
69.0
6(6
)R
esid
uali
nco
me
mod
el1.
147
4.97
69.6
1(7
)A
mod
elba
sed
onst
ock
pric
ean
dvo
lum
epa
tter
ns
0.67
–2.
7683
.43
Tota
lpos
sibl
eN
=18
1
Col
umn
1re
port
sth
eav
erag
era
tin
g,w
her
eh
igh
erva
lues
corr
espo
nd
togr
eate
rfr
eque
ncy
.Col
umn
2re
port
sth
ere
sult
sof
t-tes
tsof
the
nul
lhyp
oth
esis
that
the
aver
age
rati
ng
for
agi
ven
item
isn
otdi
ffer
entf
rom
the
aver
age
rati
ng
ofth
eot
her
item
s.W
ere
port
the
row
sfo
rw
hic
hth
eav
erag
era
tin
gsi
gnifi
can
tly
exce
eds
the
aver
age
rati
ng
ofth
eco
rres
pon
din
git
ems
atth
e5%
leve
l,an
dus
eB
onfe
rron
i-Hol
m–a
djus
ted
p-va
lues
toco
rrec
tfo
rm
ulti
ple
com
pari
son
s.C
olum
n3
(4)
pres
ents
the
perc
enta
geof
resp
onde
nts
indi
cati
ng
freq
uen
cyof
5or
6(0
or1)
.
16 L. D. BROWN, A. C. CALL, M. B. CLEMENT, AND N. Y. SHARP
Another analyst reported that buy-side clients believe the insights of sell-side analysts are more valuable when analysts have direct contact with man-agement: “Regardless of Reg FD, investors value analysts’ direct contactswith management more than anything. As an analyst, if I call up a moneymanager, a hedge fund, whoever, and I’ve got a call to make on a stock,and I’m able to say, ‘Hey, by the way, we were able to spend 20–30 minutestalking to senior management,’ boom! Their ears are just straight up.”
One analyst provided an interesting anecdote about the extent to whichsome brokerage houses go in order to understand how to read cues frommanagement in the post–Reg FD environment: “We had an FBI profilercome in, and all the analysts and portfolio managers spent four hours withthis profiler trying to understand how to read management teams, to tellwhen they’re lying, to tell when they were uncomfortable with a question.That’s how serious this whole issue has become.” Although the evidence insection 3.4.2 suggests analysts do not focus on uncovering intentional mis-representation in the financial statements, this interview anecdote is consis-tent with recent empirical research suggesting senior management’s vocalcues can be used to assess firms’ future prospects (Mayew and Venkatacha-lam [2012]).
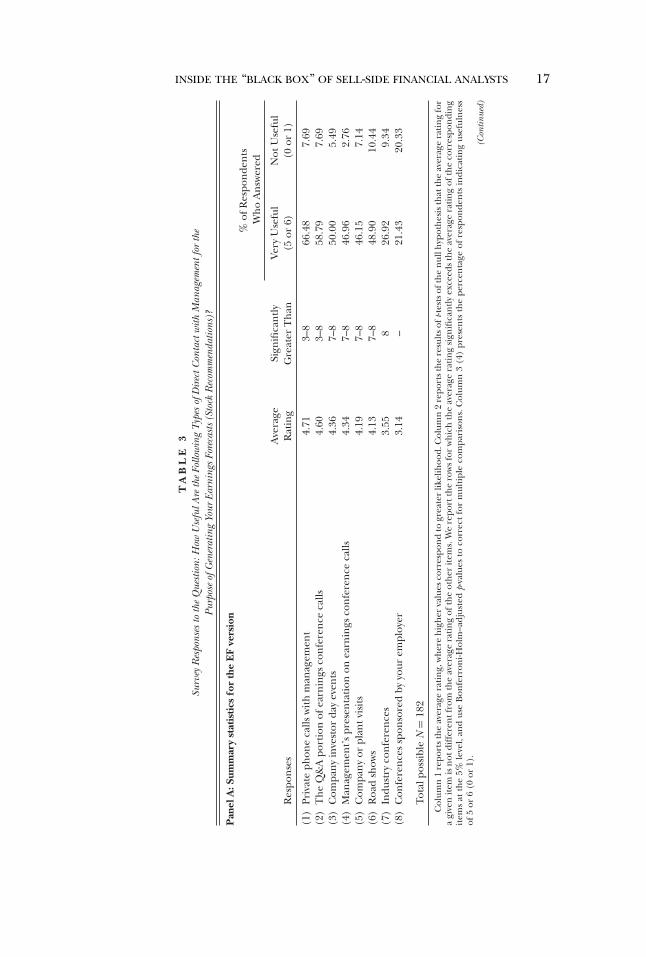
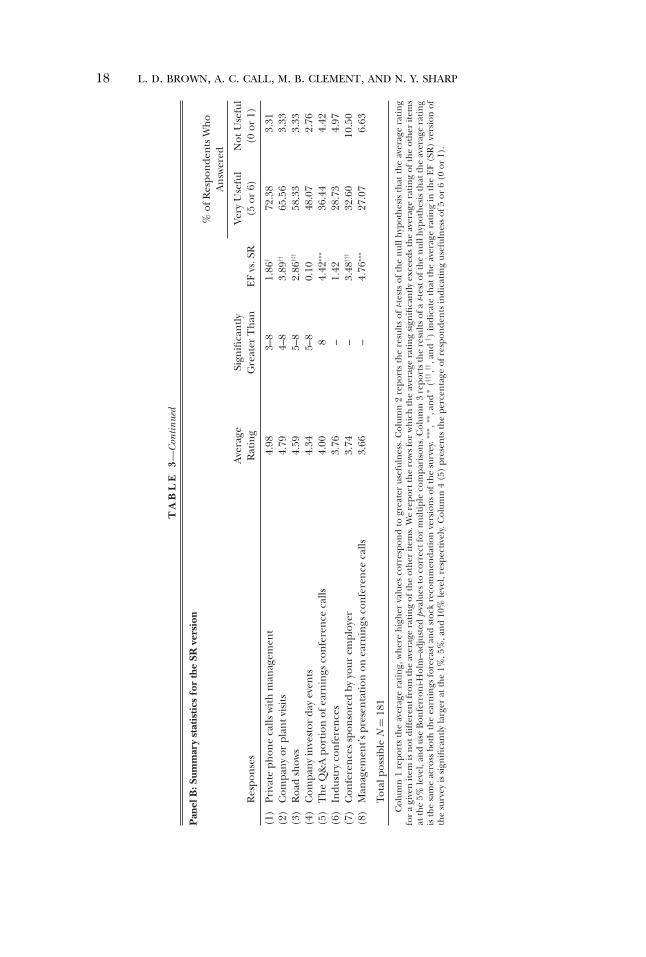
3.3.2. How Useful Are the Following Types of Direct Contact with Managementfor the Purpose of Generating Your Earnings Forecasts/Stock Recommendations?(Table 3). More than 66% (72%) of analysts report that private phone callsare a very useful source of direct contact with management for the pur-pose of generating their earnings forecasts (stock recommendations), re-inforcing our findings that analyst communication with management isboth frequent (section 3.3.1) and useful (section 3.2.1). Analysts say privatephone calls with management are at least as useful as other venues exam-ined by recent research, including earnings conference calls, company in-vestor day events, and conferences sponsored by brokerage houses (Greenet al. [2014], Kirk and Markov [2014], Mayew, Sharp, and Venkatachalam[2013]).
Our cross-sectional evidence reveals that analysts for whom hedge fundsare an important client are more likely to indicate that private phone callswith management are useful for their earnings forecasts.15 If private phonecalls with managers provide analysts with an information advantage, ourresults suggest analysts catering to hedge funds are likely to make superiorearnings forecasts.
We used our interviews to inquire into the nature, timing, and content ofanalysts’ private phone calls with management. Consistent with the resultsof our survey, our interviewees reported having private phone calls with
15 Solomon and Soltes [2013] find that hedge funds are more likely than other investors tobenefit from private meetings with managers, which they attribute to hedge funds’ superiorability to process the information disclosed in private meetings or to their having possessionof other information that makes the discussions in meetings especially valuable.
INSIDE THE “BLACK BOX” OF SELL-SIDE FINANCIAL ANALYSTS 17
TA
BL
E3
Surv
eyR
espo
nses
toth
eQ
uest
ion:
How
Use
fulA
reth
eFo
llow
ing
Type
sof
Dir
ectC
onta
ctw
ithM
anag
emen
tfor
the
Purp
ose
ofG
ener
atin
gYo
urEa
rnin
gsFo
reca
sts
(Sto
ckR
ecom
men
datio
ns)?
Pan
elA
:Sum
mar
yst
atis
tics
for
the
EF
vers
ion
%of
Res
pon
den
tsW
ho
An
swer
ed
Ave
rage
Sign
ifica
ntl
yVe
ryU
sefu
lN
otU
sefu
lR
espo
nse
sR
atin
gG
reat
erT
han
(5or
6)(0
or1)
(1)
Priv
ate
phon
eca
llsw
ith
man
agem
ent
4.71
3–8
66.4
87.
69(2
)T
he
Q&
Apo
rtio
nof
earn
ings
con
fere
nce
calls
4.60
3–8
58.7
97.
69(3
)C
ompa
ny
inve
stor
day
even
ts4.
367–
850
.00
5.49
(4)
Man
agem
ent’s
pres
enta
tion
onea
rnin
gsco
nfe
ren
ceca
lls4.
347–
846
.96
2.76
(5)
Com
pan
yor
plan
tvis
its
4.19
7–8
46.1
57.
14(6
)R
oad
show
s4.
137–
848
.90
10.4
4(7
)In
dust
ryco
nfe
ren
ces
3.55
826
.92
9.34
(8)
Con
fere
nce
ssp
onso
red
byyo
urem
ploy
er3.
14–
21.4
320
.33
Tota
lpos
sibl
eN
=18
2
Col
umn
1re
port
sth
eav
erag
era
tin
g,w
her
eh
igh
erva
lues
corr
espo
nd
togr
eate
rlik
elih
ood.
Col
umn
2re
port
sth
ere
sult
sof
t-tes
tsof
the
nul
lhyp
oth
esis
that
the
aver
age
rati
ng
for
agi
ven
item
isn
otdi
ffer
entf
rom
the
aver
age
rati
ng
ofth
eot
her
item
s.W
ere
port
the
row
sfo
rw
hic
hth
eav
erag
era
tin
gsi
gnifi
can
tly
exce
eds
the
aver
age
rati
ng
ofth
eco
rres
pon
din
git
ems
atth
e5%
leve
l,an
dus
eB
onfe
rron
i-Hol
m–a
djus
ted
p-va
lues
toco
rrec
tfo
rm
ulti
ple
com
pari
son
s.C
olum
n3
(4)
pres
ents
the
perc
enta
geof
resp
onde
nts
indi
cati
ng
usef
uln
ess
of5
or6
(0or
1).
(Con
tinue
d)
18 L. D. BROWN, A. C. CALL, M. B. CLEMENT, AND N. Y. SHARP
TA
BL
E3—
Con
tinue
d
Pan
elB
:Sum
mar
yst
atis
tics
for
the
SRve
rsio
n%
ofR
espo
nde
nts
Wh
oA
nsw
ered
Ave
rage
Sign
ifica
ntl
yVe
ryU
sefu
lN
otU
sefu
lR
espo
nse
sR
atin
gG
reat
erT
han
EF
vs.S
R(5
or6)
(0or
1)
(1)
Priv
ate
phon
eca
llsw
ith
man
agem
ent
4.98
3–8
1.86
†72
.38
3.31
(2)
Com
pan
yor
plan
tvis
its
4.79
4–8
3.89
††65
.56
3.33
(3)
Roa
dsh
ows
4.59
5–8
2.86
†††
58.3
33.
33(4
)C
ompa
ny
inve
stor
day
even
ts4.
345–
80.
1048
.07
2.76
(5)
Th
eQ
&A
port
ion
ofea
rnin
gsco
nfe
ren
ceca
lls4.
008
4.42
∗∗∗
36.4
44.
42(6
)In
dust
ryco
nfe
ren
ces
3.76
–1.
4228
.73
4.97
(7)
Con
fere
nce
ssp
onso
red
byyo
urem
ploy
er3.
74–
3.48
†††
32.6
010
.50
(8)
Man
agem
ent’s
pres
enta
tion
onea
rnin
gsco
nfe
ren
ceca
lls3.
66–
4.76
∗∗∗
27.0
76.
63
Tota
lpos
sibl
eN
=18
1
Col
umn
1re
port
sth
eav
erag
era
tin
g,w
her
eh
igh
erva
lues
corr
espo
nd
togr
eate
rus
eful
nes
s.C
olum
n2
repo
rts
the
resu
lts
oft-t
ests
ofth
en
ullh
ypot
hes
isth
atth
eav
erag
era
tin
gfo
ra
give
nit
emis
not
diff
eren
tfro
mth
eav
erag
era
tin
gof
the
oth
erit
ems.
We
repo
rtth
ero
ws
for
wh
ich
the
aver
age
rati
ng
sign
ifica
ntl
yex
ceed
sth
eav
erag
era
tin
gof
the
oth
erit
ems
atth
e5%
leve
l,an
dus
eB
onfe
rron
i-Hol
m–a
djus
ted
p-va
lues
toco
rrec
tfor
mul
tipl
eco
mpa
riso
ns.
Col
umn
3re
port
sth
ere
sult
sof
at-t
esto
fth
en
ullh
ypot
hes
isth
atth
eav
erag
era
tin
gis
the
sam
eac
ross
both
the
earn
ings
fore
cast
and
stoc
kre
com
men
dati
onve
rsio
ns
ofth
esu
rvey
.∗∗∗ ,
∗∗,a
nd
∗(†
††,††
,an
d† )
indi
cate
that
the
aver
age
rati
ng
inth
eE
F(S
R)
vers
ion
ofth
esu
rvey
issi
gnifi
can
tly
larg
erat
the
1%,5
%,a
nd
10%
leve
l,re
spec
tive
ly.C
olum
n4
(5)
pres
ents
the
perc
enta
geof
resp
onde
nts
indi
cati
ng
usef
uln
ess
of5
or6
(0or
1).
INSIDE THE “BLACK BOX” OF SELL-SIDE FINANCIAL ANALYSTS 19
senior management—most often the CFO—at least quarterly.16 Many an-alysts said companies schedule analyst “call-backs” immediately after theirpublic earnings conference calls: one-on-one, private calls from the CFO,who answers additional questions from individual analysts.
Several analysts discussed the importance of these follow-up calls. Oneanalyst suggested the order of calls is based on the analysts’ valuations ofthe company: “Management will call the analysts who are at the low endof their valuation, if they want the stock to move up. By the order in whichmanagement calls analysts, they can move the consensus to where they wantit to be.”17
Another analyst explained the benefits of private calls as follows: “In pri-vate conversations with management, you get details that they’re not neces-sarily going to go into on a public call with investors. They might be morewilling to share that with us because we can then go to clients and say, ‘Thisis our understanding of the situation. This is what the company says; this iswhat we think.’ It’s a way for them to broadcast. We’re sort of like a mega-phone for them.”
Another said, “We ask for qualitative thoughts and insights into industrytrends or specific business lines, just so that we’re also double-checking ourown thought processes and that our models are solid.” Consistent with em-pirical evidence (Mayew and Venkatachalam [2012], Hobson, Mayew, andVenkatachalam [2012]), one analyst reported, “The CEO and CFO, youcan read their body language—even on the phone—and get a feel for howoptimistic they are or how realistic something might be. And it’s really thatkind of information you’re looking for—it’s not something specific thatthey wouldn’t tell someone else.” This same analyst went on to say, “Forthe calls around the earnings calls, a lot of management teams want to callall the analysts and say, ‘Did you understand what happened? Do you haveany questions? Was anything confusing about the results themselves? Be-fore you write your note, are you thinking badly about this? Can we maybetalk with you about it so you don’t think so badly about it?’” Finally, anotheranalyst described the information discussed on the private calls as follows,“It’s not nonpublic material information; it’s clarification of points. Theyhelp you digest the information a little bit better.” Thus, our intervieweessuggested that the follow-up calls they receive from management after pub-lic earnings conference calls are a valuable source of information.
16 In contrast, Solomon and Soltes [2013] report that the investor relations officer and theCEO of a single mid-cap company were more likely than the CFO to meet with institutionalinvestors in one-on-one meetings.
17 It is plausible that managers use a similar technique to walk down analysts’ earnings fore-casts ( Richardson, Teoh, and Wysocki [2004], Libby et al. [2008]). In this scenario, a managerseeking to lower the consensus forecast would first call the analyst with the highest earningsforecast, pointing out, among other things, that every other analyst has a lower forecast. Fol-lowing this initial call, the manager would then call the analyst with the next-highest forecastand use a similar line of reasoning to encourage the analyst to lower his or her forecast, andso on.
20 L. D. BROWN, A. C. CALL, M. B. CLEMENT, AND N. Y. SHARP
In spite of restrictions on selective disclosure enacted through Reg FDin October 2000, our findings are consistent with a provision of Reg FDthat allows managers to disclose immaterial information to an analyst that“helps the analyst complete a ‘mosaic’ of information that, taken together,is material” (Securities and Exchange Commission [2000]). In other words,information analysts obtain privately from management can become usefulwithin the context of other information the analyst already possesses. Thus,while our findings do not constitute direct evidence of violations of RegFD, they do show that information conveyed in private conversations withmanagement is extremely valuable to sell-side analysts in the post–Reg FDenvironment.18
Although academic research finds evidence consistent with the notionthat analysts who ask questions on earnings conference calls are eitherhighly favored by management (Mayew [2008]) or possess superior infor-mation about the firm ( Mayew, Sharp, and Venkatachalam [2013]), someanalysts told us they purposely avoid asking questions on public conferencecalls. One analyst stated, “There are three things that can happen whenyou ask a question on an earnings conference call: one, you sound like acomplete idiot; two, they give you no information at all; and three, you geta really insightful answer except you’ve just shared it with all your competi-tion. So I don’t ask questions on calls.”
A comparison of responses to these twin questions reveals that the Q&Aportion of earnings conference calls and management’s presentation onearnings conference calls are more useful for generating earnings forecaststhan stock recommendations. In contrast, company or plant visits, roadshows, and conferences sponsored by their employers are more useful forgenerating stock recommendations than earnings forecasts.
3.4 ASSESSMENTS OF FINANCIAL REPORTING QUALITY
Recent survey evidence sheds light on the perspective of CFOs regard-ing earnings quality (Dichev et al. [2013]). However, CFOs’ views on thistopic are likely influenced by financial reporting concerns. For example,CFOs have incentives related to compensation, litigation risk, or the firm’sstock price, which could create a preference for managed earnings and biastheir responses to questions about earnings quality (Dechow et al. [2010],Nelson and Skinner [2013]). In contrast, analysts are an important sourceof information for their investing clients (Brown et al. [2014]) and haveincentives to identify attributes of high-quality earnings, because incorrectassessments of earnings quality could result in economic losses for theirclients and have an adverse effect on their own reputation and compen-sation. Thus, because analysts’ views on earnings quality are likely to bemore informative than those of financial statement preparers (Nelson and
18 This evidence is similar to what Solomon and Soltes [2013] report with respect to thevalue of private meetings with management to institutional investors.
INSIDE THE “BLACK BOX” OF SELL-SIDE FINANCIAL ANALYSTS 21
Skinner [2013]), we asked analysts for their views on various financial re-porting issues.
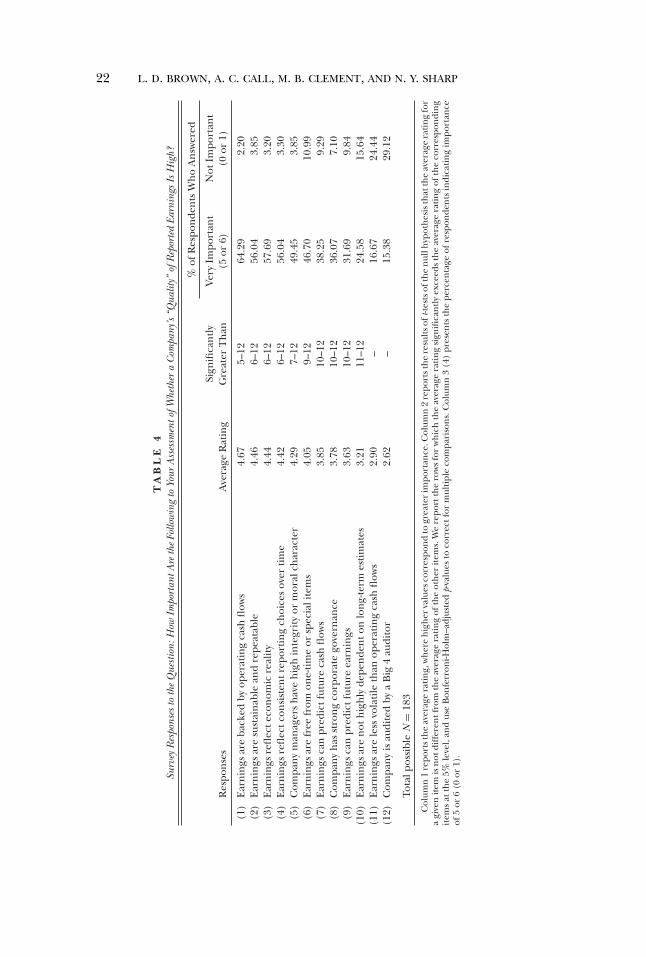
3.4.1. How Important Are the Following to Your Assessment of Whether a Com-pany’s “Quality” of Reported Earnings Is High? (Table 4). Analysts respond that“high-quality” earnings are backed by operating cash flows (Sloan [1996]),are sustainable and repeatable, reflect economic reality, and reflect con-sistent reporting choices over time. In contrast to the views of CFOs sur-veyed by Dichev et al. [2013] who rate avoidance of long-term estimates asan important factor in assessing earnings quality (2nd of 12 choices), ana-lysts rate it much lower (10th of our 12 choices). This finding underscoresNelson and Skinner’s [2013] concern that CFOs’ preference for earningsthat are free of long-term estimates may reflect their bias toward earningsthat are easy to explain to external parties rather than representing theviews of users of accounting information.
The lowest rated responses are that earnings are less volatile than operat-ing cash flows and that the company is audited by one of the Big 4. Analystsview a Big 4 audit as relatively unimportant (12th of 12 choices), contrast-ing with research that indicates a Big 4 audit is associated with high-qualityearnings (Khurana and Raman [2004], Behn, Choi, and Kang [2008]).However, analysts who primarily follow companies with Big 4 auditors maynot view a Big 4 auditor as a distinguishing feature.
Our cross-sectional evidence shows that, consistent with their training,analysts with a bachelor’s degree in accounting are more likely to considera Big 4 audit a sign of high-quality earnings. II All-Stars, who receive votesfrom buy-side analysts and portfolio managers for providing the best eq-uity research, are less likely than other analysts to believe many of the con-structs the literature associates with high-quality earnings (e.g., earningsare backed by operating cash flows, are sustainable and repeatable, are lessvolatile than operating cash flows, and are predictive of future cash flowsand earnings) are important.
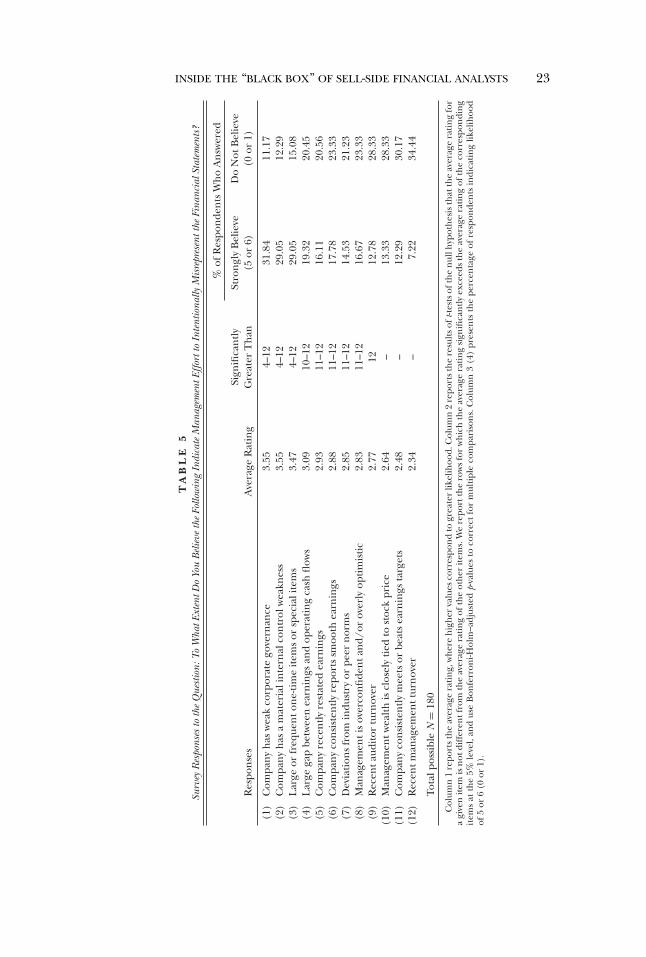
3.4.2. To What Extent Do You Believe the Following Indicate Management Effortto Intentionally Misrepresent the Financial Statements? (Table 5). We asked an-alysts about the extent to which they believe potential “red flags” of misre-porting indicate management effort to intentionally misrepresent financialstatements. Financial statement users, such as analysts and investors, arelikely to have more informative views on this topic than financial statementpreparers because CFOs often have incentives to manage earnings and mayhave biased views of the indicators of financial misrepresentation (Nelsonand Skinner [2013]). Although prior research suggests recent managementturnover, consistently meeting or beating earnings targets, managementwealth being closely tied to stock price, and recent auditor turnover aresignals of financial misrepresentation (e.g., Krishnan and Krishnan [1997],Desai, Hogan, and Wilkins [2006], Efendi, Srivastava, and Swanson [2007],Myers, Myers, and Skinner [2007]), these items received relatively low
22 L. D. BROWN, A. C. CALL, M. B. CLEMENT, AND N. Y. SHARP
TA
BL
E4
Surv
eyR
espo
nses
toth
eQ
uest
ion:
How
Impo
rtan
tAre
the
Follo
win
gto
Your
Ass
essm
ento
fWhe
ther
aC
ompa
ny’s
“Qua
lity”
ofR
epor
ted
Earn
ings
IsH
igh?
%of
Res
pon
den
tsW
ho
An
swer
ed
Sign
ifica
ntl
yVe
ryIm
port
ant
Not
Impo
rtan
tR
espo
nse
sA
vera
geR
atin
gG
reat
erT
han
(5or
6)(0
or1)
(1)
Ear
nin
gsar
eba
cked
byop
erat
ing
cash
flow
s4.
675–
1264
.29
2.20
(2)
Ear
nin
gsar
esu
stai
nab
lean
dre
peat
able
4.46
6–12
56.0
43.
85(3
)E
arn
ings
refl
ecte
con
omic
real
ity
4.44
6–12
57.6
93.
20(4
)E
arn
ings
refl
ectc
onsi
sten
trep
orti
ng
choi
ces
over
tim
e4.
426–
1256
.04
3.30
(5)
Com
pan
ym
anag
ers
hav
eh
igh
inte
grit
yor
mor
alch
arac
ter
4.29
7–12
49.4
53.
85(6
)E
arn
ings
are
free
from
one-
tim
eor
spec
iali
tem
s4.
059–
1246
.70
10.9
9(7
)E
arn
ings
can
pred
ictf
utur
eca
shfl
ows
3.85
10–1
238
.25
9.29
(8)
Com
pan
yh
asst
ron
gco
rpor
ate
gove
rnan
ce3.
7810
–12
36.0
77.
10(9
)E
arn
ings
can
pred
ictf
utur
eea
rnin
gs3.
6310
–12
31.6
99.
84(1
0)E
arn
ings
are
not
hig
hly
depe
nde
nto
nlo
ng-
term
esti
mat
es3.
2111
–12
24.5
815
.64
(11)
Ear
nin
gsar
ele
ssvo
lati
leth
anop
erat
ing
cash
flow
s2.
90–
16.6
724
.44
(12)
Com
pan
yis
audi
ted
bya
Big
4au
dito
r2.
62–
15.3
829
.12
Tota
lpos
sibl
eN
=18
3
Col
umn
1re
port
sth
eav
erag
era
tin
g,w
her
eh
igh
erva
lues
corr
espo
nd
togr
eate
rim
port
ance
.Col
umn
2re
port
sth
ere
sult
soft
-test
soft
he
nul
lhyp
oth
esis
that
the
aver
age
rati
ng
for
agi
ven
item
isn
otdi
ffer
entf
rom
the
aver
age
rati
ng
ofth
eot
her
item
s.W
ere
port
the
row
sfo
rw
hic
hth
eav
erag
era
tin
gsi
gnifi
can
tly
exce
eds
the
aver
age
rati
ng
ofth
eco
rres
pon
din
git
ems
atth
e5%
leve
l,an
dus
eB
onfe
rron
i-Hol
m–a
djus
ted
p-va
lues
toco
rrec
tfor
mul
tipl
eco
mpa
riso
ns.
Col
umn
3(4
)pr
esen
tsth
epe
rcen
tage
ofre
spon
den
tsin
dica
tin
gim
port
ance
of5
or6
(0or
1).
INSIDE THE “BLACK BOX” OF SELL-SIDE FINANCIAL ANALYSTS 23
TA
BL
E5
Surv
eyR
espo
nses
toth
eQ
uest
ion:
ToW
hatE
xten
tDo
You
Bel
ieve
the
Follo
win
gIn
dica
teM
anag
emen
tEffo
rtto
Inte
ntio
nally
Mis
repr
esen
tthe
Fina
ncia
lSta
tem
ents
?
%of
Res
pon
den
tsW
ho
An
swer
ed
Sign
ifica
ntl
ySt
ron
gly
Bel
ieve
Do
Not
Bel
ieve
Res
pon
ses
Ave
rage
Rat
ing
Gre
ater
Th
an(5
or6)
(0or
1)
(1)
Com
pan
yh
asw
eak
corp
orat
ego
vern
ance
3.55
4–12
31.8
411
.17
(2)
Com
pan
yh
asa
mat
eria
lin
tern
alco
ntr
olw
eakn
ess
3.55
4–12
29.0
512
.29
(3)
Lar
geor
freq
uen
ton
e-ti
me
item
sor
spec
iali
tem
s3.
474–
1229
.05
15.0
8(4
)L
arge
gap
betw
een
earn
ings
and
oper
atin
gca
shfl
ows
3.09
10–1
219
.32
20.4
5(5
)C
ompa
ny
rece
ntl
yre
stat
edea
rnin
gs2.
9311
–12
16.1
120
.56
(6)
Com
pan
yco
nsi
sten
tly
repo
rts
smoo
thea
rnin
gs2.
8811
–12
17.7
823
.33
(7)
Dev
iati
ons
from
indu
stry
orpe
ern
orm
s2.
8511
–12
14.5
321
.23
(8)
Man
agem
enti
sov
erco
nfi
den
tan
d/or
over
lyop
tim
isti
c2.
8311
–12
16.6
723
.33
(9)
Rec
enta
udit
ortu
rnov
er2.
7712
12.7
828
.33
(10)
Man
agem
entw
ealt
his
clos
ely
tied
tost
ock
pric
e2.
64–
13.3
328
.33
(11)
Com
pan
yco
nsi
sten
tly
mee
tsor
beat
sea
rnin
gsta
rget
s2.
48–
12.2
930
.17
(12)
Rec
entm
anag
emen
ttur
nov
er2.
34–
7.22
34.4
4
Tota
lpos
sibl
eN
=18
0
Col
umn
1re
port
sth
eav
erag
era
tin
g,w
her
eh
igh
erva
lues
corr
espo
nd
togr
eate
rlik
elih
ood.
Col
umn
2re
port
sth
ere
sult
sof
t-tes
tsof
the
nul
lhyp
oth
esis
that
the
aver
age
rati
ng
for
agi
ven
item
isn
otdi
ffer
entf
rom
the
aver
age
rati
ng
ofth
eot
her
item
s.W
ere
port
the
row
sfo
rw
hic
hth
eav
erag
era
tin
gsi
gnifi
can
tly
exce
eds
the
aver
age
rati
ng
ofth
eco
rres
pon
din
git
ems
atth
e5%
leve
l,an
dus
eB
onfe
rron
i-Hol
m–a
djus
ted
p-va
lues
toco
rrec
tfo
rm
ulti
ple
com
pari
son
s.C
olum
n3
(4)
pres
ents
the
perc
enta
geof
resp
onde
nts
indi
cati
ng
likel
ihoo
dof
5or
6(0
or1)
.
24 L. D. BROWN, A. C. CALL, M. B. CLEMENT, AND N. Y. SHARP
ratings from analysts.19 Instead, analysts consider weak corporate gover-nance, internal control deficiencies, and large one-time or special itemsto be more indicative of financial reporting irregularities. When we com-pare analysts’ responses with the responses of CFOs of public companiesregarding red flags of misreporting (Dichev et al. [2013]), it is evident thatmanagers and analysts have widely divergent views.20
In follow-up interviews, we asked analysts directly about their attention to“red flags” of potential misreporting. Most responded that they exert littleeffort trying to determine whether firms misreport earnings. Prior researchprovides evidence that sell-side analysts play a role in uncovering corporatefraud (Dyck, Morse, and Zingales [2010]), but analysts say it is not theirjob to look for earnings manipulation (Abarbanell and Lehavy [2003]). Fi-nancial misrepresentation is often difficult to detect, and analysts’ buy-sideclients value industry-level insights above all other services sell-side analystsprovide; therefore, sell-side analysts are unlikely to have incentives to try touncover firm-specific financial misrepresentation.
On the topic of intentional financial misrepresentation, one analyst saidhe “takes the financial statements at face value,” because it is extremely dif-ficult to uncover intentional misconduct. Another said, “It’s up to the audi-tor to catch that . . . If they were able to fool the auditor into a clean auditopinion, I’m never going to be able to catch it just from the informationthat’s in a Q or a K.” Another analyst said that, if a company has auditedfinancial statements, “It’s somebody else’s job to figure out if the informa-tion they’re giving us is correct. We have to take that on faith.” We note,however, that our collective evidence does not imply that analysts ignoremore benign forms of earnings management (e.g., within-GAAP discretionto manage earnings). Indeed, as discussed in section 3.4.1, analysts pre-fer earnings that are backed by operating cash flows, that are sustainable,and that reflect economic reality, suggesting analysts could actually rein inearnings management before it escalates into more egregious misrepresen-tations of the financial statements (Schrand and Zechman [2012]).
Our cross-sectional evidence provides additional evidence that analystsare not a strong line of defense against financial reporting irregularities.II All-Stars and analysts employed at large brokerage houses are less likelythan other analysts to be concerned with many common signs of financialstatement misrepresentation, suggesting uncovering intentional financialmisrepresentation is not a priority for even highly regarded analysts.
19 If analysts are complicit in the “numbers game” that results in companies consistentlymeeting or beating earnings targets, they may be reluctant to respond that consistently meet-ing or beating earnings targets is a “red flag” of intentional financial misrepresentation.
20 For example, analysts rate material internal control weakness as an important red flagof misreporting (2nd of 12 choices), but internal control weaknesses do not make the list of20 types of red flags mentioned by CFOs in Dichev et al.’s table 14. Moreover, that the com-pany consistently meets or beats earnings targets receives little support from analysts (11th of12 choices) but strong support from CFOs as a red flag of misreporting (3rd of 20 choices).
INSIDE THE “BLACK BOX” OF SELL-SIDE FINANCIAL ANALYSTS 25
3.4.3. How Likely Are You to Take the Following Actions if You Observe a “RedFlag” of Management Effort to Intentionally Misrepresent the Financial Statements?(Online Appendix). The two most common actions analysts take when ob-serving a “red flag” of management effort to intentionally misrepresent fi-nancial statements are to seek additional information from managementand to seek additional information from nonmanagement sources. Whilenot nearly as prevalent as the first two actions, more than half of our sur-veyed analysts say they are very likely to revise their stock recommendationsand earnings forecasts downwards after observing a “red flag” of intentionalmisrepresentation. The only action analysts say they are unlikely to take isto cease covering the firm.
3.4.4. How Often Do You Exclude the Following Components of GAAP Earn-ings When Forecasting Street Earnings? (Table 6). A majority of analysts veryfrequently exclude extraordinary items, discontinued items, restructuringcharges, and asset impairments when forecasting “street earnings,” butmost include amortization, changes in working capital, and depreciationin these forecasts. These findings shed light on the earnings componentsanalysts include in their forecasts and are of interest given the importanceof “street” earnings as a determinant of stock prices (Bradshaw and Sloan[2002]).
3.4.5. Do You Exclude Components of GAAP Earnings from Your Forecast of“Street” Earnings for the Following Reasons? (Table 7). The primary reason ana-lysts exclude components of GAAP earnings from their forecasts of “street”earnings is their belief that the component is nonrecurring. In addition,nearly half say they exclude components of GAAP earnings because of theirdesire to improve earnings forecast accuracy.
3.5 DETERMINANTS OF ANALYSTS’ CAREER SUCCESS
In contrast to archival studies that must infer analysts’ incentives fromobserved statistical associations, we asked analysts directly about the factorsthat determine their compensation and the importance of various analystrankings for their career advancement.
3.5.1. How Important Are the Following to Your Compensation? (Table 8). IIsurveys suggest institutional investors highly value sell-side analysts’ industryknowledge, so it is reasonable for brokerage houses to compensate sell-sideanalysts for the industry knowledge they provide to institutional investors,their most important clients (see table 12). Indeed, sell-side analysts rate in-dustry knowledge and their standing in analyst rankings or broker votes asthe most important determinants of their compensation.21 Broker votes area process whereby buy-side portfolio managers and buy-side analysts vote to
21 Our cross-sectional evidence reveals that experienced analysts are more likely to statethat industry knowledge is important to their compensation, in contrast to MBAs, who are lesslikely to make this statement.
26 L. D. BROWN, A. C. CALL, M. B. CLEMENT, AND N. Y. SHARP
TA
BL
E6
Surv
eyR
espo
nses
toth
eQ
uest
ion:
How
Ofte
nD
oYo
uEx
clud
eth
eFo
llow
ing
Com
pone
nts
ofG
AA
PEa
rnin
gsW
hen
Fore
cast
ing
“Str
eet”
Earn
ings
?
%of
Res
pon
den
tsW
ho
An
swer
ed
Sign
ifica
ntl
yVe
ryFr
eque
ntl
yVe
ryIn
freq
uen
tly
Res
pon
ses
Ave
rage
Rat
ing
Gre
ater
Th
an(5
or6)
(0or
1)
(1)
Ext
raor
din
ary
item
s4.
813–
1071
.04
4.92
(2)
Dis
con
tin
ued
item
s4.
604–
1063
.74
9.34
(3)
Res
truc
turi
ng
char
ges
4.34
5–10
57.6
98.
79(4
)A
sset
impa
irm
ents
4.17
5–10
55.7
413
.11
(5)
Cum
ulat
ive
effe
ctof
acco
unti
ng
chan
ges
3.67
7–10
41.1
117
.78
(6)
Non
oper
atin
git
ems
3.63
7–10
39.7
818
.78
(7)
Stoc
kop
tion
expe
nse
2.35
8–10
25.4
148
.07
(8)
Am
orti
zati
on1.
9010
–11
17.7
856
.67
(9)
Ch
ange
sin
wor
kin
gca
pita
l1.
41–
12.7
866
.67
(10)
Dep
reci
atio
n1.
28–
11.8
070
.79
Tota
lpos
sibl
eN
=18
3
Col
umn
1re
port
sth
eav
erag
era
tin
g,w
her
eh
igh
erva
lues
corr
espo
nd
togr
eate
rfr
eque
ncy
.Col
umn
2re
port
sth
ere
sult
sof
t-tes
tsof
the
nul
lhyp
oth
esis
that
the
aver
age
rati
ng
for
agi
ven
item
isn
otdi
ffer
entf
rom
the
aver
age
rati
ng
ofth
eot
her
item
s.W
ere
port
the
row
sfo
rw
hic
hth
eav
erag
era
tin
gsi
gnifi
can
tly
exce
eds
the
aver
age
rati
ng
ofth
eco
rres
pon
din
git
ems
atth
e5%
leve
l,an
dus
eB
onfe
rron
i-Hol
m–a
djus
ted
p-va
lues
toco
rrec
tfo
rm
ulti
ple
com
pari
son
s.C
olum
n3
(4)
pres
ents
the
perc
enta
geof
resp
onde
nts
indi
cati
ng
freq
uen
cyof
5or
6(0
or1)
.
INSIDE THE “BLACK BOX” OF SELL-SIDE FINANCIAL ANALYSTS 27
TA
BL
E7
Surv
eyR
espo
nses
toth
eQ
uest
ion:
Do
You
Excl
ude
Com
pone
nts
ofG
AA
PEa
rnin
gsfr
omYo
urFo
reca
stof
“Str
eet”
Earn
ings
for
the
Follo
win
gR
easo
ns?
%of
Res
pon
den
tsW
ho
An
swer
ed
Sign
ifica
ntl
yVe
ryFr
eque
ntl
yVe
ryIn
freq
uen
tly
Res
pon
ses
Ave
rage
Rat
ing
Gre
ater
Th
an(5
or6)
(0or
1)
(1)
Bec
ause
you
belie
veth
eco
mpo
nen
tis
“non
recu
rrin
g”4.
512–
561
.33
7.18
(2)
Bec
ause
you
belie
veex
clud
ing
the
com
pon
enti
mpr
oves
your
earn
ings
fore
cast
accu
racy
3.86
4–5
49.7
214
.92
(3)
Bec
ause
you
wan
tto
beco
nsi
sten
twit
hm
anag
emen
tgui
dan
ce3.
41–
37.2
222
.22
(4)
Bec
ause
you
wan
tto
beco
nsi
sten
twit
hot
her
sell-
side
anal
ysts
3.27
–36
.11
24.4
4(5
)B
ecau
seyo
uw
antt
obe
con
sist
entw
ith
com
mun
icat
ion
from
I/B
/E/S
,Fir
stC
all,
Zac
ks,o
rS&
P3.
09–
36.1
131
.11
Tota
lpos
sibl
eN
=18
1
Col
umn
1re
port
sth
eav
erag
era
tin
g,w
her
eh
igh
erva
lues
corr
espo
nd
togr
eate
rfr
eque
ncy
.Col
umn
2re
port
sth
ere
sult
sof
t-tes
tsof
the
nul
lhyp
oth
esis
that
the
aver
age
rati
ng
for
agi
ven
item
isn
otdi
ffer
entf
rom
the
aver
age
rati
ng
ofth
eot
her
item
s.W
ere
port
the
row
sfo
rw
hic
hth
eav
erag
era
tin
gsi
gnifi
can
tly
exce
eds
the
aver
age
rati
ng
ofth
eco
rres
pon
din
git
ems
atth
e5%
leve
l,an
dus
eB
onfe
rron
i-Hol
m–a
djus
ted
p-va
lues
toco
rrec
tfo
rm
ulti
ple
com
pari
son
s.C
olum
n3
(4)
pres
ents
the
perc
enta
geof
resp
onde
nts
indi
cati
ng
freq
uen
cyof
5or
6(0
or1)
.
28 L. D. BROWN, A. C. CALL, M. B. CLEMENT, AND N. Y. SHARP
TA
BL
E8
Surv
eyR
espo
nses
toth
eQ
uest
ion:
How
Impo
rtan
tAre
the
Follo
win
gto
Your
Com
pens
atio
n?
%of
Res
pon
den
tsW
ho
An
swer
ed
Sign
ifica
ntl
yVe
ryIm
port
ant
Not
Impo
rtan
tR
espo
nse
sA
vera
geR
atin
gG
reat
erT
han
(5or
6)(0
or1)
(1)
Your
indu
stry
know
ledg
e4.
953–
972
.18
1.93
(2)
Your
stan
din
gin
anal
ystr
anki
ngs
orbr
oker
vote
s4.
735–
966
.85
4.97
(3)
Your
acce
ssib
ility
and/
orre
spon
sive
nes
s4.
735–
963
.54
2.21
(4)
Your
prof
essi
onal
inte
grit
y4.
695–
963
.99
3.60
(5)
Your
wri
tten
repo
rts
4.17
7–9
38.9
52.
76(6
)Yo
urre
lati
onsh
ipw
ith
man
agem
ento
fth
eco
mpa
nie
syo
ufo
llow
4.14
8–9
44.6
37.
16(7
)T
he
profi
tabi
lity
ofyo
urst
ock
reco
mm
enda
tion
s3.
949
35.0
85.
52(8
)Yo
ursu
cces
sat
gen
erat
ing
unde
rwri
tin
gbu
sin
ess
ortr
adin
gco
mm
issi
ons
3.65
–44
.20
20.1
7
(9)
Th
eac
cura
cyan
dti
mel
ines
sof
your
earn
ings
fore
cast
s3.
59–
24.1
07.
76
Tota
lpos
sibl
eN
=36
3
Col
umn
1re
port
sth
eav
erag
era
tin
g,w
her
eh
igh
erva
lues
corr
espo
nd
togr
eate
rim
port
ance
.Col
umn
2re
port
sth
ere
sult
soft
-test
soft
he
nul
lhyp
oth
esis
that
the
aver
age
rati
ng
for
agi
ven
item
isn
otdi
ffer
entf
rom
the
aver
age
rati
ng
ofth
eot
her
item
s.W
ere
port
the
row
sfo
rw
hic
hth
eav
erag
era
tin
gsi
gnifi
can
tly
exce
eds
the
aver
age
rati
ng
ofth
eco
rres
pon
din
git
ems
atth
e5%
leve
l,an
dus
eB
onfe
rron
i-Hol
m–a
djus
ted
p-va
lues
toco
rrec
tfor
mul
tipl
eco
mpa
riso
ns.
Col
umn
3(4
)pr
esen
tsth
epe
rcen
tage
ofre
spon
den
tsin
dica
tin
gim
port
ance
of5
or6
(0or
1).
INSIDE THE “BLACK BOX” OF SELL-SIDE FINANCIAL ANALYSTS 29
assess the value of research services from sell-side brokerage houses and todetermine how to allocate research commissions. Two-thirds of analysts in-dicate their standing in analyst rankings or broker votes is very important,while fewer than 5% say it is not important to their compensation. Experi-enced analysts and analysts from large brokerage houses are more likely tosay their standing in analyst rankings or broker votes is important to theircompensation, consistent with evidence that these analysts are more likelyto become II All-Stars (Rees, Sharp, and Wong [2014b]).
Industry knowledge is potentially important to analysts’ compensationfor several reasons. First, providing buy-side analysts with industry knowl-edge helps sell-side analysts generate broker votes. Second, analysts whoare industry experts are more likely to develop investment banking re-lationships, which are important to their employers. Third, institutionalinvestors highly value sell-side analysts’ industry knowledge, suggesting bro-kerage houses likely reward industry experts in an effort to prevent themfrom being hired away by competitors.
Although its average rating is relatively low, 44% of analysts say their suc-cess at generating underwriting business or trading commissions is veryimportant to their compensation. This result suggests conflicts of interestremain a persistent issue for a substantial number of sell-side analysts.22 Fi-nally, although the accuracy and timeliness of analysts’ earnings forecastsand the profitability of their stock recommendations receive relatively lowaverage ratings, 35% and 24% of our respondents, respectively, say they arevery important determinants of their compensation. Retail-focused analystsare more likely to say the accuracy and timeliness of their earnings fore-casts are important to their compensation, suggesting that they are moremotivated to make accurate and timely earnings forecasts.
3.5.2. How Important Are the Following Analyst Rankings for Your Career Ad-vancement? (Table 9). Although much of the prior literature on analyst rank-ings emphasizes the II All-America Research Team awards (Stickel [1992],Cox and Kleiman [2000], Leone and Wu [2007], Rees, Sharp, and Twedt[2014a]), analysts indicate that broker or client votes are significantly moreimportant to their career advancement than the II awards.23 More than
22 Jack Grubman (2013), the highest paid sell-side analyst on Wall Street before being per-manently banned from the securities industry for simultaneously advising both firms and in-vestors, recently suggested the analyst industry has changed in form but not in substance. Asan example, he says that, prior to the reforms of the past decade, an investment banker anda research analyst would hold a single meeting with management in an attempt to secure thefirm’s underwriting business. Now, he says, there are two meetings instead of one—one meet-ing in which the investment banker meets with management to try to gain the firm’s under-writing business and another meeting in which the research analyst meets with managementand makes another pitch for the underwriting business.
23 In cross-sectional tests, we find that, although II All-Stars are more likely than other an-alysts to state that being an II All-Star is important for their career advancement, both IIAll-Stars and non–II All-Stars consider broker votes to be equally important for their careeradvancement.
30 L. D. BROWN, A. C. CALL, M. B. CLEMENT, AND N. Y. SHARP
TA
BL
E9
Surv
eyR
espo
nses
toth
eQ
uest
ion:
How
Impo
rtan
tAre
the
Follo
win
gA
naly
stR
anki
ngs
for
Your
Car
eer
Adv
ance
men
t?
%of
Res
pon
den
tsW
ho
An
swer
ed
Sign
ifica
ntl
yVe
ryIm
port
ant
Not
Impo
rtan
tR
espo
nse
sA
vera
geR
atin
gG
reat
erT
han
(5or
6)(0
or1)
(1)
Bro
ker
orC
lien
tvot
es5.
132–
582
.74
7.12
(2)
Inst
itutio
nalI
nves
tor’
sA
ll-A
mer
ican
Res
earc
hTe
am3.
283–
537
.29
28.4
5(3
)T
heW
allS
tree
tJou
rnal
’sSu
rvey
ofA
war
dW
inn
ing
An
alys
ts2.
485
15.1
535
.26
(4)
Star
Min
eA
nal
ystA
war
ds2.
325
10.7
437
.19
(5)
Zac
ksA
ll-St
arA
nal
ystR
atin
gs1.
48–
3.02
59.8
9
Tota
lpos
sibl
eN
=36
5
Buy
-sid
epo
rtfo
liom
anag
ers
and
buy-
side
anal
ysts
awar
dbr
oker
orcl
ien
tvot
esto
sell-
side
brok
erag
esba
sed
onth
eva
lue
ofth
ere
sear
chth
ebr
oker
ages
’an
alys
tspr
ovid
e.C
olum
n1
repo
rts
the
aver
age
rati
ng,
wh
ere
hig
her
valu
esco
rres
pon
dto
grea
ter
impo
rtan
ce.C
olum
n2
repo
rts
the
resu
lts
oft-t
ests
ofth
en
ullh
ypot
hes
isth
atth
eav
erag
era
tin
gfo
ra
give
nit
emis
not
diff
eren
tfr
omth
eav
erag
era
tin
gof
the
oth
erit
ems.
We
repo
rtth
ero
ws
for
wh
ich
the
aver
age
rati
ng
sign
ifica
ntl
yex
ceed
sth
eav
erag
era
tin
gof
the
corr
espo
ndi
ng
item
sat
the
5%le
vel,
and
use
Bon
ferr
oni-H
olm
–adj
uste
dp-
valu
esto
corr
ect
for
mul
tipl
eco
mpa
riso
ns.
Col
umn
3(4
)pr
esen
tsth
epe
rcen
tage
ofre
spon
den
tsin
dica
tin
gim
port
ance
of5
or6
(0or
1).
INSIDE THE “BLACK BOX” OF SELL-SIDE FINANCIAL ANALYSTS 31
twice as many analysts indicate that broker or client votes are important forcareer advancement (83%) than say the same thing about II status (37%).Researchers who seek to obtain more powerful tests of analyst rankingsshould use broker or client votes in lieu of II awards, if they are able toaccess the relevant data.
The analysts we interviewed explained why broker or client votes areso important for their career advancement. Broker votes translate directlyinto revenue from the sell-side analysts’ clients to their employers ( Maber,Groysberg, and Healy [2014]), and several stated that their bonuses are di-rectly affected by broker votes. One analyst stated, “The part to me that’sshocking about the industry is that I came into the industry thinking [suc-cess] would be based on how well my stock picks do. But a lot of it endsup being ‘What are your broker votes?’” Another analyst said, “Broker voteshave become very important in this business, not necessarily just to the ana-lysts, but to the sales and trading part of the equation, too.” Another analystremarked, “Broker votes translate into revenue for my firm. They directlyimpact my compensation and directly impact my firm’s compensation.” Go-ing further, the analyst stated: “25% of the allocation of our bonus pool isbased on broker votes.” These comments highlight analysts’ incentives tosatisfy their investing clients (Firth et al. [2013]).
We also asked analysts about the benefits of being an II All-Star. Oneanalyst described it as “your external stamp of approval” and, consistentwith prior research, said that, because the II results are visible to outsiders,“Your access to management teams is greatly increased by your II rank-ing” (Mayew [2008], Soltes [2014]). Another said, “The II rankings . . . giveyou significant leverage within your own firm” because II-rated analysts caneasily find employment elsewhere. In summary, analysts indicate that, al-though broker votes are more important than II rankings for their careeradvancement, both forms of recognition provide analysts with valuable ben-efits (Groysberg, Healy, and Maber [2011]).
3.6 INFLUENCES ON EARNINGS FORECASTS AND STOCK RECOMMENDATIONS
Although academic researchers and market participants focus heavilyon analysts’ earnings forecasts (Mikhail, Walther, and Willis [1999], Hongand Kubik [2003], Call, Chen, and Tong [2009]) and stock recommenda-tions ([Womack [1996], Francis and Soffer [1997], Bradshaw [2004]), rela-tively little is known about analysts’ motivation for issuing accurate earningsforecasts and profitable stock recommendations. In addition to examin-ing these issues, we consider the consequences to analysts who issue below-consensus earnings forecasts and stock recommendations and the internalpressures they face to alter their research outputs.
3.6.1. How Important Are the Following in Motivating You to AccuratelyForecast Earnings/Make Profitable Stock Recommendations? (Table 10). Consis-tent with research suggesting analysts’ stock recommendations are moreprofitable when supported by accurate earnings forecasts (Loh and Mian
32 L. D. BROWN, A. C. CALL, M. B. CLEMENT, AND N. Y. SHARP
TA
BL
E1
0Su
rvey
Res
pons
esto
the
Que
stio
n:H
owIm
port
antA
reth
eFo
llow
ing
inM
otiv
atin
gYo
uto
Acc
urat
ely
Fore
cast
Earn
ings
(Mak
ePr
ofita
ble
Stoc
kR
ecom
men
datio
ns)?
Pan
elA
:Sum
mar
yst
atis
tics
for
the
EF
vers
ion
%of
Res
pon
den
tsW
ho
An
swer
ed
Ave
rage
Sign
ifica
ntl
yVe
ryIm
port
ant
Not
Impo
rtan
tR
espo
nse
sR
atin
gG
reat
erT
han
(5or
6)(0
or1)
(1)
Your
earn
ings
fore
cast
asan
inpu
tto
your
stoc
kre
com
men
dati
ona
4.77
2–7
66.4
83.
30
(2)
Dem
and
from
your
clie
nts
4.45
3–7
59.3
46.
04(3
)Yo
urre
puta
tion
wit
hm
anag
emen
toft
he
com
pan
ies
you
follo
w3.
944–
740
.88
8.84
(4)
Your
stan
din
gin
anal
ystr
anki
ngs
3.40
6–7
32.4
217
.03
(5)
Your
job
secu
rity
3.04
–23
.63
21.4
3(6
)Yo
urco
mpe
nsa
tion
2.82
–14
.92
22.1
0(7
)Yo
urjo
bm
obili
ty2.
72–
18.1
328
.02
Tota
lpos
sibl
eN
=18
2
Col
umn
1re
port
sth
eav
erag
era
tin
g,w
her
eh
igh
erva
lues
corr
espo
nd
togr
eate
rim
port
ance
.Col
umn
2re
port
sth
ere
sult
soft
-test
soft
he
nul
lhyp
oth
esis
that
the
aver
age
rati
ng
for
agi
ven
item
isn
otdi
ffer
entf
rom
the
aver
age
rati
ng
ofth
eot
her
item
s.W
ere
port
the
row
sfo
rw
hic
hth
eav
erag
era
tin
gsi
gnifi
can
tly
exce
eds
the
aver
age
rati
ng
ofth
eco
rres
pon
din
git
ems
atth
e5%
leve
l,an
dus
eB
onfe
rron
i-Hol
m–a
djus
ted
p-va
lues
toco
rrec
tfor
mul
tipl
eco
mpa
riso
ns.
Col
umn
3(4
)pr
esen
tsth
epe
rcen
tage
ofre
spon
den
tsin
dica
tin
gim
port
ance
of5
or6
(0or
1).
(Con
tinue
d)
INSIDE THE “BLACK BOX” OF SELL-SIDE FINANCIAL ANALYSTS 33
TA
BL
E1
0—C
ontin
ued
Pan
elB
:Sum
mar
yst
atis
tics
for
the
SRve
rsio
n%
ofR
espo
nde
nts
Wh
oA
nsw
ered
Ave
rage
Sign
ifica
ntl
yVe
ryIm
port
ant
Not
Impo
rtan
tR
espo
nse
sR
atin
gG
reat
erT
han
EF
vs.S
R(5
or6)
(0or
1)
(1)
Dem
and
from
your
clie
nts
4.34
2–7
0.69
53.0
48.
84(2
)Yo
urst
andi
ng
inan
alys
tran
kin
gs3.
925–
72.
71†††
47.5
113
.81
(3)
Your
com
pen
sati
on3.
785–
75.
11†††
43.3
317
.22
(4)
Your
job
secu
rity
3.65
6–7
3.25
†††
39.2
317
.68
(5)
Your
repu
tati
onw
ith
man
agem
ento
fth
eco
mpa
nie
syo
ufo
llow
3.44
72.
93∗∗
∗29
.44
13.8
9
(6)
Your
job
mob
ility
3.29
–2.
94†††
30.3
919
.89
(7)
Your
stoc
kre
com
men
dati
onas
anin
put
toyo
urea
rnin
gsfo
reca
sta
2.99
–10
.32∗∗
∗25
.14
23.4
6
Tota
lpos
sibl
eN
=18
1a T
he
wor
din
gof
thes
ere
spon
ses
isdi
ffer
ent
acro
ssth
etw
ove
rsio
ns
ofth
esu
rvey
beca
use
one
vers
ion
refe
rsto
earn
ings
fore
cast
s(p
anel
A)
and
the
oth
erve
rsio
nre
fers
tost
ock
reco
mm
enda
tion
s(p
anel
B).
Col
umn
1re
port
sth
eav
erag
era
tin
g,w
her
eh
igh
erva
lues
corr
espo
nd
togr
eate
rim
port
ance
.Col
umn
2re
port
sth
ere
sult
sof
t-tes
tsof
the
nul
lhyp
oth
esis
that
the
aver
age
rati
ng
for
agi
ven
item
isn
otdi
ffer
entf
rom
the
aver
age
rati
ng
ofth
eot
her
item
s.W
ere
port
the
row
sfo
rw
hic
hth
eav
erag
era
tin
gsi
gnifi
can
tly
exce
eds
the
aver
age
rati
ng
ofth
eot
her
item
sat
the
5%le
vel,
and
use
Bon
ferr
oni-H
olm
–adj
uste
dp-
valu
esto
corr
ectf
orm
ulti
ple
com
pari
son
s.C
olum
n3
repo
rts
the
resu
lts
ofa
t-tes
toft
he
nul
lhyp
oth
esis
that
the
aver
age
rati
ng
isth
esa
me
acro
ssbo
thth
eea
rnin
gsfo
reca
stan
dst
ock
reco
mm
enda
tion
vers
ion
sof
the
surv
ey.∗∗
∗ ,∗∗
,an
d∗
(†††
,††,a
nd
† )in
dica
teth
atth
eav
erag
era
tin
gin
the
EF
(SR
)ve
rsio
nof
the
surv
eyis
sign
ifica
ntl
yla
rger
atth
e1%
,5%
,an
d10
%le
vel,
resp
ecti
vely
.Col
umn
4(5
)pr
esen
tsth
epe
rcen
tage
ofre
spon
den
tsin
dica
tin
gus
eful
nes
sof
5or
6(0
or1)
.
34 L. D. BROWN, A. C. CALL, M. B. CLEMENT, AND N. Y. SHARP
[2006], Ertimur, Sunder, and Sunder [2007]), our surveyed analysts saytheir single most important motivation for issuing accurate earnings forecastsis for use as inputs to their stock recommendations. Female analysts aremore likely to be motivated to issue accurate earnings forecasts for thispurpose, consistent with evidence that they issue more accurate earningsforecasts than male analysts do (Kumar [2010]).
Demand from their clients is analysts’ most important motivation formaking profitable stock recommendations and their second most impor-tant motivation for issuing accurate earnings forecasts. Analysts’ concernsabout their standings in analyst rankings, compensation, job security, andjob mobility are more important for motivating them to make profitablestock recommendations than to make accurate earnings forecasts.
3.6.2. How Likely Are the Following Consequences to You of Issuing EarningsForecasts/Stock Recommendations That Are Well Below the Consensus? (Table 11).Collectively, the seven choices for the EF version of the survey received thelowest ratings of any question in our survey. The only response where moreanalysts believe the outcome is very likely than believe it is very unlikely is anincrease in investing clients’ perception of the analyst’s credibility (the onlyfavorable consequence we presented to the analysts). In contrast, far feweranalysts say the loss of access to management is very likely than say it isvery unlikely. Our cross-sectional analyses suggest CFAs are less concernedabout many negative repercussions of issuing earnings forecasts well belowthe consensus, suggesting they may be more likely to make bold, pessimisticforecasts.
In the SR version of the survey, “an increase in your investing clients’perception of your credibility” and “loss of access to management” are thetwo most likely consequences of issuing below-consensus stock recommen-dations. The fact that analysts perceive that the issuance of below-consensusstock recommendations improves their standing with investing clients un-derscores analysts’ need to please not only the management of the compa-nies they cover but also their investing clients.24
A comparison of responses between the two versions of the survey in-dicates that analysts believe issuing a below-consensus stock recommen-dation is more likely to lead to a loss of access to management thanis issuing a below-consensus earnings forecast, possibly because issuingbelow-consensus earnings forecasts makes it easier for management to re-port a positive earnings surprise (Brown [2001], Richardson, Teoh, andWysocki [2004], Graham, Harvey, and Rajgopal [2005], Ke and Yu [2006],Libby et al. [2008]). Our cross-sectional results reveal that female analystsare less concerned about lower bonus/compensation if they issue stock
24 The upward bias in analysts’ stock recommendations (Womack [1996], Barber et al.[2001], Chen and Matusmoto [2006], Mayew [2008]) is consistent with analysts’ perceptionthat a loss of access to management is a potential consequence of issuing below-consensusstock recommendations.
INSIDE THE “BLACK BOX” OF SELL-SIDE FINANCIAL ANALYSTS 35
TA
BL
E1
1Su
rvey
Res
pons
esto
theQ
uest
ion:
How
Lik
ely
Are
theF
ollo
win
gC
onse
quen
cest
oYo
uof
Issu
ing
anEa
rnin
gsFo
reca
st(S
tock
Rec
omm
enda
tion)
that
IsW
ellB
elow
theC
onse
nsus
?
Pan
elA
:Sum
mar
yst
atis
tics
for
the
EF
vers
ion
%of
Res
pon
den
tsW
ho
An
swer
ed
Ave
rage
Sign
ifica
ntl
yVe
ryL
ikel
yVe
ryU
nlik
ely
Res
pon
ses
Rat
ing
Gre
ater
Th
an(5
or6)
(0or
1)
(1)
An
incr
ease
inyo
urin
vest
ing
clie
nts
’per
cept
ion
ofyo
urcr
edib
ility
3.16
2–7
21.4
318
.13
(2)
Los
sof
acce
ssto
man
agem
ent
2.53
3–7
16.4
832
.97
(3)
Bei
ng
“fro
zen
out”
ofth
eQ
&A
port
ion
offu
ture
con
fere
nce
calls
2.21
6–7
13.5
943
.48
(4)
Dam
age
toyo
urem
ploy
er’s
busi
nes
sre
lati
onsh
ipw
ith
buy-
side
clie
nts
wh
oh
old
stoc
kin
the
firm
1.94
6–7
6.01
43.1
7
(5)
Dam
age
toyo
urem
ploy
er’s
busi
nes
sre
lati
onsh
ipw
ith
the
com
pan
y1.
926–
77.
6147
.28
(6)
Prom
otio
nle
sslik
ely
0.76
–1.
6377
.72
(7)
Low
erbo
nus
/com
pen
sati
on0.
74–
1.09
78.8
0
Tota
lpos
sibl
eN
=18
4
Col
umn
1re
port
sth
eav
erag
era
tin
g,w
her
eh
igh
erva
lues
corr
espo
nd
togr
eate
rlik
elih
ood.
Col
umn
2re
port
sth
ere
sult
sof
t-tes
tsof
the
nul
lhyp
oth
esis
that
the
aver
age
rati
ng
for
agi
ven
item
isn
otdi
ffer
entf
rom
the
aver
age
rati
ng
ofth
eot
her
item
s.W
ere
port
the
row
sfo
rw
hic
hth
eav
erag
era
tin
gsi
gnifi
can
tly
exce
eds
the
aver
age
rati
ng
ofth
eco
rres
pon
din
git
ems
atth
e5%
leve
l,an
dus
eB
onfe
rron
i-Hol
m–a
djus
ted
p-va
lues
toco
rrec
tfo
rm
ulti
ple
com
pari
son
s.C
olum
n3
(4)
pres
ents
the
perc
enta
geof
resp
onde
nts
indi
cati
ng
likel
ihoo
dof
5or
6(0
or1)
.(C
ontin
ued)
36 L. D. BROWN, A. C. CALL, M. B. CLEMENT, AND N. Y. SHARP
TA
BL
E1
1—C
ontin
ued
Pan
elB
:Sum
mar
yst
atis
tics
for
the
SRve
rsio
n%
ofR
espo
nde
nts
Wh
oA
nsw
ered
Ave
rage
Sign
ifica
ntl
yVe
ryL
ikel
yVe
ryU
nlik
ely
Res
pon
ses
Rat
ing
Gre
ater
Th
anE
Fvs
.SR
(5or
6)(0
or1)
(1)
An
incr
ease
inyo
urin
vest
ing
clie
nts
’per
cept
ion
ofyo
urcr
edib
ility
3.55
3–7
2.38
††26
.55
9.04
(2)
Los
sof
acce
ssto
man
agem
ent
3.24
3–7
3.95
†††
24.4
417
.78
(3)
Dam
age
toyo
urem
ploy
er’s
busi
nes
sre
lati
onsh
ipw
ith
the
com
pan
y2.
625–
74.
00†††
12.7
826
.67
(4)
Bei
ng
“fro
zen
out”
ofth
eQ
&A
port
ion
offu
ture
con
fere
nce
calls
2.35
6–7
0.71
15.0
040
.56
(5)
Dam
age
toyo
urem
ploy
er’s
busi
nes
sre
lati
onsh
ipw
ith
buy-
side
clie
nts
wh
oh
old
stoc
kin
the
firm
2.26
6–7
1.99
††6.
6732
.78
(6)
Low
erbo
nus
/com
pen
sati
on1.
04–
2.26
††2.
7868
.89
(7)
Prom
otio
nle
sslik
ely
0.97
–1.
73†
0.56
72.7
8
Tota
lpos
sibl
eN
=18
0
Col
umn
1re
port
sth
eav
erag
era
tin
g,w
her
eh
igh
erva
lues
corr
espo
nd
togr
eate
rlik
elih
ood.
Col
umn
2re
port
sth
ere
sult
sof
t-tes
tsof
the
nul
lhyp
oth
esis
that
the
aver
age
rati
ng
for
agi
ven
item
isn
otdi
ffer
entf
rom
the
aver
age
rati
ng
ofth
eot
her
item
s.W
ere
port
the
row
sfo
rw
hic
hth
eav
erag
era
tin
gsi
gnifi
can
tly
exce
eds
the
aver
age
rati
ng
ofth
eot
her
item
sat
the
5%le
vel,
and
use
Bon
ferr
oni-H
olm
–adj
uste
dp-
valu
esto
corr
ectf
orm
ulti
ple
com
pari
son
s.C
olum
n3
repo
rts
the
resu
lts
ofa
t-tes
toft
he
nul
lhyp
oth
esis
that
the
aver
age
rati
ng
isth
esa
me
acro
ssbo
thth
eea
rnin
gsfo
reca
stan
dst
ock
reco
mm
enda
tion
vers
ion
sof
the
surv
ey.∗∗
∗ ,∗∗
,an
d∗
(†††
,††,a
nd
† )in
dica
teth
eav
erag
era
tin
gin
the
EF
(SR
)ve
rsio
nof
the
surv
eyis
sign
ifica
ntl
yla
rger
atth
e1%
,5%
,an
d10
%le
vel,
resp
ecti
vely
.Col
umn
4(5
)pr
esen
tsth
epe
rcen
tage
ofre
spon
den
tsin
dica
tin
gus
eful
nes
sof
5or
6(0
or1)
.
INSIDE THE “BLACK BOX” OF SELL-SIDE FINANCIAL ANALYSTS 37
recommendations below the consensus. In addition, analysts with a hedgefund focus are less likely to believe issuing stock recommendations well be-low the consensus will result in lower compensation or damage to theiremployer’s relationship with buy-side clients, perhaps due to their clients’unique ability to execute short positions and profit from analysts’ negativeratings.25
Several analysts said a good relationship with management is critical tosucceed as a sell-side analyst (Francis and Philbrick [1993]). One intervie-wee described an experience where company management canceled analready-scheduled road show with the analyst immediately after the analystlowered his stock recommendation for the company. Another responded,“If I’ve got a sell rating on a stock, is that company really going to wantto come attend a conference we’re hosting? Is that company really goingto give me three days to go market with them in New York? No, they’renot. So you have to factor that in.” One analyst stated, “When a companycuts you off, not only do you lose the information value of that [access],but you actually lose revenue. The company won’t come to your confer-ence; therefore, your conference is going to be less important. Clients paya boatload for that access.” Another candidly told us, “Most of the sell-side isworried more about what management thinks of them than they are aboutwhether they’re doing a good job for investors.” Finally, one analyst said,“It’s a needle you have to thread sometimes, between being intellectuallyhonest yet not offensive. It’s always in the back of your mind, because oneof the biggest things the buy-side compensates sell-side research firms foris corporate access: road shows, meetings, access to management teams. Soyou obviously want to keep an amicable relationship with the companiesthat you follow.”
Our findings highlight an important conflict in sell-side research.Whereas issuing earnings forecasts and stock recommendations that arewell below the consensus increases analysts’ credibility with investingclients, it can also damage analysts’ relationships with managers of the firmsthey follow.
3.6.3. How Often Does Research Management Pressure You to Issue an Earn-ings Forecast That Is Lower Than (Exceeds) What Your Own Research WouldSupport? (EF Version) How Often Does Research Management Pressure You to Is-sue a Stock Recommendation Vhat Is Less Favorable (More Favorable) than WhatYour Own Research Would Support? (SR Version) (Online Appendix). Pressurerelated to issuing earnings forecasts or stock recommendations is notpervasive within analysts’ own firms. The vast majority of analysts havenever experienced pressure from research management to alter their earn-ings forecasts or stock recommendations. Consistent with the positive biasin analysts’ recommendations (Barber et al. [2006]), we find research
25 Cross-sectional tests also reveal that II All-Stars are less likely to miss a promotion due toa stock recommendation that is well below the consensus.
38 L. D. BROWN, A. C. CALL, M. B. CLEMENT, AND N. Y. SHARP
management is more likely to pressure analysts to raise rather than to lowertheir stock recommendations.26
In response to questions about why research management pressures sell-side analysts, one interviewee explained: “Something like two-thirds of ourclients are long-only shops. So even if you have a sell, the best the clientcan do is either own less of it or just not own it. They can’t do much witha sell rating; unless they’re a hedge fund, they can’t profit directly from it.”Another analyst put it simply: “There are lots of constituencies that analystshave to answer to, and none of them likes an under-perform.”
Consistent with the literature suggesting analyst impartiality is influencedby investment banking relationships or trading incentives of the firm atwhich the analyst is employed (Lin and McNichols [1998], Michaely andWomack [1999], Lin, McNichols, and O’Brien [2005], Cowen, Groysberg,and Healy [2006], Ljungqvist, Marston, and Wilhelm [2006]), one intervie-wee said, “Equity analysts . . . are very, very reluctant—even after the Spitzerrules—to upset the investment bankers, because the investment bankersbring in so much more profitability . . . They certainly realize that the suc-cess of their company is tied to the performance of this much higher-margin business than the business that they’re part of.”
3.7 OTHER INCENTIVES
Finally, we explore two other incentives that shape sell-side research: theimportance of various investing clients to analysts’ employers and analysts’motivation to initiate coverage of a firm.
3.7.1. How Important Are the Following Clients to Your Employer? (Table 12).Hedge funds and mutual funds are the two most important clients to ana-lysts’ employers, and retail brokerage clients are the least important. Theseresponses suggest that most analysts focus on addressing the needs of large,institutional investors, rather than the needs of small, individual investors(De Franco, Lu, and Vasvari [2007]).
3.7.2. How Important Are the Following in Your Decision to Cover a GivenCompany? (Table 13). Table 13 reveals that client demand for informationabout the company is the most important determinant of analysts’ cover-age decisions, with less than 1% of analysts saying this factor is not im-portant to their coverage decision. Earnings predictability is among theleast important determinants. Although prior archival research suggestsdisclosure quality (Lang and Lundholm [1996]) and company profitability(McNichols and O’Brien [1997]) are important factors in analysts’ cover-age decisions, these items receive relatively low ratings from our respon-dents. Our findings suggest analyst coverage is largely driven by a desire tosatisfy client demand, with relatively little consideration given to financial
26 A t-test indicates that research management exerts more downward pressure on earningsforecasts than on stock recommendations.
INSIDE THE “BLACK BOX” OF SELL-SIDE FINANCIAL ANALYSTS 39
TA
BL
E1
2Su
rvey
Res
pons
esto
the
Que
stio
n:H
owIm
port
antA
reth
eFo
llow
ing
Clie
nts
toYo
urEm
ploy
er?
%of
Res
pon
den
tsW
ho
An
swer
ed
Ave
rage
Sign
ifica
ntl
yVe
ryIm
port
ant
Not
Impo
rtan
tR
espo
nse
sR
atin
gG
reat
erT
han
(5or
6)(0
or1)
(1)
Hed
gefu
nds
5.26
3–7
81.4
92.
21(2
)M
utua
lfun
ds5.
243–
780
.11
1.66
(3)
Defi
ned
-ben
efitp
ensi
onfu
nds
3.61
4–7
36.8
416
.62
(4)
Insu
ran
cefi
rms
3.31
5–7
29.8
920
.67
(5)
En
dow
men
tsan
dfo
unda
tion
s2.
966–
722
.22
26.3
9(6
)H
igh
net
-wor
thin
divi
dual
s2.
417
18.2
341
.61
(7)
Ret
ailb
roke
rage
clie
nts
1.89
–13
.30
51.5
2
Tota
lpos
sibl
eN
=36
2
Col
umn
1re
port
sth
eav
erag
era
tin
g,w
her
eh
igh
erva
lues
corr
espo
nd
togr
eate
rim
port
ance
.Col
umn
2re
port
sth
ere
sult
soft
-test
soft
he
nul
lhyp
oth
esis
that
the
aver
age
rati
ng
for
agi
ven
item
isn
otdi
ffer
entf
rom
the
aver
age
rati
ng
ofth
eot
her
item
s.W
ere
port
the
row
sfo
rw
hic
hth
eav
erag
era
tin
gsi
gnifi
can
tly
exce
eds
the
aver
age
rati
ng
ofth
eco
rres
pon
din
git
ems
atth
e5%
leve
l,an
dus
eB
onfe
rron
i-Hol
m–a
djus
ted
p-va
lues
toco
rrec
tfor
mul
tipl
eco
mpa
riso
ns.
Col
umn
3(4
)pr
esen
tsth
epe
rcen
tage
ofre
spon
den
tsin
dica
tin
gim
port
ance
of5
or6
(0or
1).
40 L. D. BROWN, A. C. CALL, M. B. CLEMENT, AND N. Y. SHARP
TA
BL
E1
3Su
rvey
Res
pons
esto
the
Que
stio
n:H
owIm
port
antA
reth
eFo
llow
ing
inth
eD
ecis
ion
toC
over
aG
iven
Com
pany
?
%of
Res
pon
den
tsW
ho
An
swer
ed
Ave
rage
Sign
ifica
ntl
yVe
ryIm
port
ant
Not
Impo
rtan
tR
espo
nse
sR
atin
gG
reat
erT
han
(5or
6)(0
or1)
(1)
Clie
ntd
eman
dfo
rin
form
atio
nab
outt
he
com
pan
y5.
012–
1272
.33
0.55
(2)
Th
esi
mila
rity
ofth
eco
mpa
ny
toot
her
com
pan
ies
you
follo
w4.
176–
1248
.34
6.91
(3)
Th
est
ock’
str
adin
gvo
lum
e4.
166–
1244
.93
4.38
(4)
Th
est
ock’
sm
arke
tcap
ital
izat
ion
4.05
6–12
39.2
94.
95(5
)T
he
com
pan
y’s
grow
thpr
ospe
cts
3.98
6–12
42.4
29.
92(6
)T
he
com
posi
tion
ofth
eco
mpa
ny’
sin
vest
orba
se3.
327–
1222
.25
11.8
1(7
)T
he
com
pan
y’s
disc
losu
res
2.90
11–1
217
.03
20.0
5(8
)T
he
com
pan
y’s
corp
orat
ego
vern
ance
2.77
1214
.01
24.4
5(9
)T
he
com
pan
y’s
profi
tabi
lity
2.73
1212
.91
23.3
5(1
0)T
he
com
pan
y’s
inve
stm
entb
anki
ng
rela
tion
ship
wit
hyo
urem
ploy
er2.
71–
21.2
132
.78
(11)
Oth
erse
ll-si
dean
alys
tsco
ver
the
com
pan
y2.
54–
12.6
031
.23
(12)
Th
epr
edic
tabi
lity
ofth
eco
mpa
ny’
sea
rnin
gs2.
43–
9.09
30.0
3
Tota
lpos
sibl
eN
=36
5
Col
umn
1re
port
sth
eav
erag
era
tin
g,w
her
eh
igh
erva
lues
corr
espo
nd
togr
eate
rim
port
ance
.Col
umn
2re
port
sth
ere
sult
soft
-test
soft
he
nul
lhyp
oth
esis
that
the
aver
age
rati
ng
for
agi
ven
item
isn
otdi
ffer
entf
rom
the
aver
age
rati
ng
ofth
eot
her
item
s.W
ere
port
the
row
sfo
rw
hic
hth
eav
erag
era
tin
gsi
gnifi
can
tly
exce
eds
the
aver
age
rati
ng
ofth
eco
rres
pon
din
git
ems
atth
e5%
leve
l,an
dus
eB
onfe
rron
i-Hol
m–a
djus
ted
p-va
lues
toco
rrec
tfor
mul
tipl
eco
mpa
riso
ns.
Col
umn
3(4
)pr
esen
tsth
epe
rcen
tage
ofre
spon
den
tsin
dica
tin
gim
port
ance
of5
or6
(0or
1).
INSIDE THE “BLACK BOX” OF SELL-SIDE FINANCIAL ANALYSTS 41
reporting attributes, such as disclosure quality and earnings predictability,that would make it easier to issue accurate forecasts. That analyst cover-age decisions are so strongly motivated by investor demand for informationabout the company highlights the importance of analysts’ investing clientsand corroborates the idea that analyst following is a reasonable proxy forthe firm’s information environment (Bowen, Chen, and Cheng [2008],Derrien and Kecskes [2013]).
We asked analysts for additional insights about their coverage decisions.Most said they are required to run their coverage decisions through theirfirm’s research management. One analyst reported, “The decision to pickup or drop a company or change your rating always runs through researchmanagement. They vet every change to make sure it’s well founded.”
4. Conclusion
In spite of the vast academic literature on sell-side analysts, the decisionprocesses analysts employ have largely remained a “black box” (Ramnath,Rock, and Shane [2008], Bradshaw [2011]). We survey 365 sell-side analystsand conduct 18 follow-up interviews to gain insight into the inputs analystsuse to make their decisions and the incentives they face.
We examine a wide range of topics, including the inputs analysts usewhen forming their earnings forecasts and stock recommendations; thefrequency, nature, and usefulness of their communication with seniormanagement; the valuation models they use to support their stock rec-ommendations; their beliefs about earnings quality and financial misrep-resentation; the factors affecting their compensation; their motivation forgenerating accurate earnings forecasts and profitable stock recommenda-tions; and the consequences of publishing unfavorable assessments aboutthe firms they follow.
Most analysts have contact with the CEO or CFO of the typical companythey follow more than once per quarter, and they rate their private com-munication with management as a very useful input to both their earningsforecasts and stock recommendations—even more useful than primary re-search, recent earnings performance, or the recent 10-K or 10-Q. They alsoreport that their private phone conversations with company managementare more useful than interactions with management at road shows, industryconferences, or company investor day events.
We find that industry knowledge is an important determinant of sell-sideanalysts’ compensation, consistent with brokerage houses rewarding ana-lysts for providing their clients with the information they demand (Brownet al. [2014]). We also find industry knowledge is the single most usefulinput to analysts’ earnings forecasts and stock recommendations.
We asked analysts about their perceptions of earnings quality. Analysts’views on earnings quality are important because incorrect assessments ofearnings quality could result in economic losses for their investing clientsand have an adverse effect on analysts’ reputation and compensation. In
42 L. D. BROWN, A. C. CALL, M. B. CLEMENT, AND N. Y. SHARP
contrast, CFOs often have incentives to manage earnings, which is notalways consistent with a preference for high-quality earnings (Dechow et al.[2010], Nelson and Skinner [2013]). Analysts believe earnings are of highquality if they are backed by operating cash flows, are sustainable and re-peatable, reflect economic reality, and reflect consistent reporting choicesover time. In addition, they do not believe many “red flags” of financialmisrepresentation the academic literature has identified are indicative ofmisreporting. In our interviews, analysts made it clear that attempting touncover intentional financial misrepresentation is not cost-beneficial forthem, suggesting that they are unlikely to discover financial reporting ir-regularities. However, this evidence should not be interpreted to mean thatanalysts ignore other, more benign forms of earnings management that areoften easier to detect than fraud. Indeed, their preference for earningsthat are backed by operating cash flows, that are sustainable and repeat-able, and that reflect economic reality suggests that analysts may indirectlyguard against financial misreporting by reining in more benign forms ofearnings management.
We also find that generating underwriting business or trading commis-sions continues to be an important determinant of compensation for manyanalysts. Further, we find that broker votes are an important determinantof analysts’ career advancement, even more important than public rank-ings such as II All-Star status. Analysts indicate their single most importantmotivation for issuing accurate earnings forecasts is to use them as an inputinto their stock recommendations, revealing that analysts’ earnings fore-casts are often a means to an end and not ends in themselves. Analysts alsoreport that issuing unfavorable stock recommendations often leads to anincrease in their credibility with investing clients and to a loss of access tomanagement. These findings highlight the notion that analysts face com-peting demands from their investing clients and company management.
As called for by prior research (Schipper [1991], Ramnath, Rock, andShane [2008], Bradshaw [2011]), we penetrate the “black box” of analysts’decision processes and incentives. We provide insights relevant to investorswho use analysts’ forecasts and stock recommendations in their investingdecisions and to managers whose companies are followed by sell-side ana-lysts. Analysts who wish to benchmark their practices and research againsta broad set of peers will also benefit from our findings, and academic re-searchers can use our findings as motivation for further study.
Our paper is subject to several limitations. First, although we carefullydesigned our survey instrument and received feedback from a professionalsurvey consultant and pilot participants, we cannot be certain that analystsinterpreted every question the way we intended. For example, we askedanalysts about the consequences of issuing earnings forecasts and stock rec-ommendations that are “well below” the consensus, but it is possible thatsome analysts interpreted this question to be about more modest depar-tures from the consensus. Second, even with anonymous surveys, partici-pants may intentionally or unintentionally bias their responses to portray
INSIDE THE “BLACK BOX” OF SELL-SIDE FINANCIAL ANALYSTS 43
themselves or their profession in a positive light. For instance, in contrastto the existing literature, our findings suggest that analysts do not incor-porate other analysts’ earnings forecasts and stock recommendations intotheir own forecasts and recommendations. However, the analysts we sur-veyed may have been reluctant to acknowledge the usefulness of informa-tion provided by competing analysts. Third, although we believe sell-sideanalysts’ insights on topics such as financial reporting quality are a valu-able contribution to the literature, we acknowledge that analysts have theirown biases. Specifically, although analysts indicate that they do not believeconsistently meeting or beating earnings targets is an indicator of inten-tionally misrepresented financial statements, this finding may be due toanalysts’ complicity in issuing earnings forecasts that managers are able tobeat. Fourth, while our response rate exceeds that of other recent surveys(e.g., Dichev et al. [2013]), nearly 90% of the analysts we invited did notparticipate in the survey. In spite of these limitations, we believe our studyprovides many important insights that should be considered by future re-search.
APPENDIX
Definitions of Independent Variables for Cross-Sectional Analyses
Gender = indicator variable equal to 1 if the analyst is male, and 0 ifthe analyst is female.
Accounting = indicator variable equal to 1 if the analyst has an undergrad-uate degree in accounting, and 0 otherwise.
MBA = indicator variable equal to 1 if the analyst has an MBA, and0 otherwise.
CFA = indicator variable equal to 1 if the analyst is a CFA, and 0otherwise.
Experience = indicator variable equal to 1 if the analyst has 7+ years ofexperience as a sell-side analyst, and 0 otherwise.
II AllStar = indicator variable equal to 1 if the analyst is listed by Insti-tutional Investor as an All-Star analyst, based on the rankingspublished closest to the time the survey was administered,and 0 otherwise.
StarMine = indicator variable equal to 1 if the analyst is ranked byStarMine in the rankings published closest to the time thesurvey was administered, and 0 otherwise.
WSJ = indicator variable equal to 1 if the analyst received The WallStreet Journal’s “Best on the Street” award in the rankings pub-lished closest to the time the survey was administered, and 0otherwise.
Broker Size = indicator variable equal to 1 if the analyst works for an em-ployer with 26+ sell-side analysts, and 0 otherwise.
44 L. D. BROWN, A. C. CALL, M. B. CLEMENT, AND N. Y. SHARP
I Bank = indicator variable if Thomson One Banker indicates the ana-lyst’s employer provides debt or equity underwriting services,and 0 otherwise (Bradshaw, Huang, and Tan [2014]).
Retail Focus = indicator variable equal to 1 if the analyst indicated that “re-tail brokerage clients” are “very important” (a response of 5or 6) to his/her employer, and 0 otherwise.
HF Focus = indicator variable equal to 1 if the analyst indicated that“hedge funds” are “very important” (a response of 5 or 6)to his/her employer, and 0 otherwise.
Industry = industry fixed effects based on the primary industry the an-alyst covers.
REFERENCES
ABARBANELL, J. S. “Do Analysts’ Earnings Forecasts Incorporate Information in Prior StockPrice Changes?” Journal of Accounting and Economics 14 (1991): 147–65.
ABARBANELL, J. S., AND R. LEHAVY. “Can Stock Recommendations Predict Earnings Manage-ment and Analysts’ Earnings Forecast Errors?” Journal of Accounting Research 41 (2003): 1–32.
BARBER, B. M.; R. LEHAVY; M. MCNICHOLS; AND B. TRUEMAN. “Can Investors Profit from theProphets? Security Analyst Recommendations and Stock Returns.” Journal of Finance 56(2001): 531–63.
BARBER, B.M.; R. LEHAVY; M. MCNICHOLS; AND B. TRUEMAN. “Buys, Holds, and Sells: The Dis-tribution of Investment Banks’ Stock Ratings and the Implications for the Profitability ofAnalysts’ Recommendations.” Journal of Accounting and Economics 41 (2006): 87–117.
BARKER, R. G. “The Role of Dividends in Valuation Models Used by Analysts and Fund Man-agers.” European Accounting Review 8 (1999): 195–218.
BARKER, R. G., AND S. IMAM. “Analysts’ Perceptions of ‘Earnings Quality.’” Accounting and Busi-ness Research 38 (2008): 313–29.
BASU, S. “The Conservatism Principle and the Asymmetric Timeliness of Earnings.” Journal ofAccounting and Economics 24 (1997): 3–37.
BEAVER, W.; R. LAMBERT; AND D. MORSE. “The Information Content of Security Prices.” Journalof Accounting and Economics 2 (1980): 3–28.
BEHN, B.; J. H. CHOI; AND T. KANG. “Audit Quality and Properties of Analyst Earnings Fore-casts.” The Accounting Review 83 (2008): 327–59.
BOWEN, R. M.; X. CHEN; AND Q. CHENG. “Analyst Coverage and the Cost of Raising EquityCapital: Evidence from Underpricing of Seasoned Equity Offerings.” Contemporary Account-ing Research 25 (2008): 657–700.
BRADSHAW, M. T. “How Do Analysts Use Their Earnings Forecasts in Generating Stock Recom-mendations?” The Accounting Review 79 (2004): 25–50.
BRADSHAW, M. T. “Analysts’ Forecasts: What Do We Know After Decades of Work?”Working paper, Boston College, 2011. Available at http://papers.ssrn.com/sol3/papers.cfm?abstract id=1880339.
BRADSHAW, M. T.; A. G. HUANG; AND H. TAN. “Analyst Target Price Optimism Around theWorld.” Working paper, Boston College, University of Waterloo, SUNY-Buffalo, 2014. Avail-able at http://papers.ssrn.com/sol3/papers.cfm?abstract id=2137291.
BRADSHAW, M. T., AND R. G. SLOAN. “GAAP Versus the Street: An Empirical Assessment of TwoAlternative Definitions of Earnings.” Journal of Accounting Research 40 (2002): 41–66.
BRICKER, R.; G. PREVITS; T. ROBINSON; AND S. YOUNG. “Financial Analyst Assessment of Com-pany Earnings Quality.” Journal of Accounting, Auditing and Finance 10 (1995): 541–54.
BROWN, L. D. “Earnings Forecasting Research: Its Implications for Capital Markets Research.”International Journal of Forecasting 9 (1993): 295–320.
BROWN, L. D. “A Temporal Analysis of Earnings Surprises: Profits Versus Losses.” Journal ofAccounting Research 39 (2001): 221–41.
INSIDE THE “BLACK BOX” OF SELL-SIDE FINANCIAL ANALYSTS 45
BROWN, L. D.; A. C. CALL; M. B. CLEMENT; AND N. Y. SHARP. “Skin in the Game: The Inputsand Incentives That Shape Buy-Side Analysts’ Stock Recommendations.” Working paper,Temple University, Arizona State University, University of Texas at Austin, Texas A&M Uni-versity, 2014. Available at http://papers.ssrn.com/sol3/papers.cfm?abstract id=2458544.
BROWN, L. D., AND A. HUGON. “Team Earnings Forecasting.” Review of Accounting Studies 14(2009): 587–607.
CALL, A. C.; S. CHEN; AND Y. H. TONG. “Are Analysts’ Earnings Forecasts More Accurate WhenAccompanied by Cash Flow Forecasts?” Review of Accounting Studies 14 (2009): 358–91.
CHEN, S., AND D. A. MATSUMOTO. “Favorable Versus Unfavorable Recommendations: The Im-pact on Analyst Access to Management-Provided Information.” Journal of Accounting Research44 (2006): 657–89.
CLEMENT, M. B. “Analyst Forecast Accuracy: Do Ability, Resources, and Portfolio ComplexityMatter?” Journal of Accounting and Economics 27 (1999): 285–303.
CLEMENT, M. B., AND S. TSE. “Do Investors Respond to Analysts’ Forecast Revisions as if Fore-cast Accuracy Is All that Matters?” The Accounting Review 78 (2003): 227–49.
CLEMENT, M. B., AND S. TSE. “Financial Analyst Characteristics and Herding Behavior in Fore-casting.” The Journal of Finance 60 (2005): 307–41.
COWEN, A.; B. GROYSBERG; AND P. HEALY. “Which Types of Analyst Firms Are More Optimistic?”Journal of Accounting and Economics 41 (2006): 119–46.
COX, R. A. K., AND R. T. KLEIMAN. “A Stochastic Model of Superstardom: Evidence from Institu-tional Investor’s All-American Research Team.” Review of Financial Economics 9 (2000): 43–53.
DECHOW, P.; W. GE; AND C. SCHRAND. “Understanding Earnings Quality: A Review of the Prox-ies, Their Determinants and Their Consequences.” Journal of Accounting and Economics 50(2010): 344–401.
DE FRANCO, G.; H. LU; AND F. P. VASVARI. “Wealth Transfer Effects of Analysts’ MisleadingBehavior.” Journal of Accounting Research 45 (2007): 71–110.
DERRIEN, F., AND A. KECSKES. “The Real Effects of Financial Shocks: Evidence from ExogenousChanges in Analyst Coverage.” The Journal of Finance 68 (2013): 1407–40.
DESAI, H.; C. E. HOGAN; AND M. S. WILKINS. “The Reputational Penalty for Aggressive Account-ing: Earnings Restatements and Management Turnover.” The Accounting Review 81 (2006):83–112.
DICHEV, I. D.; J. R. GRAHAM; C. R. HARVEY; AND S. RAJGOPAL. “Earnings Quality: Evidence fromthe Field.” Journal of Accounting and Economics 56 (2013): 1–33.
DYCK, A.; A. MORSE; AND L. ZINGALES. “Who Blows the Whistle on Corporate Fraud?” TheJournal of Finance 65 (2010): 2213–53.
EFENDI, J.; A. SRIVASTAVA; AND E. P. SWANSON. “Why Do Corporate Managers Misstate Finan-cial Statements? The Role of Option Compensation and Other Factors.” Journal of FinancialEconomics 85 (2007): 667–708.
ERTIMUR, Y.; J. SUNDER; AND S. V. SUNDER. “Measure for Measure: The Relation Between Fore-cast Accuracy and Recommendation Profitability of Analysts.” Journal of Accounting Research45 (2007): 567–606.
FIRTH, M.; C. LIN; P. LIU; AND Y. XUAN. “The Client Is King: Do Mutual Fund RelationshipsBias Analyst Recommendations?” Journal of Accounting Research 51 (2013): 165–200.
FRANCIS, J., AND D. PHILBRICK. “Analysts’ Decisions as Products of a Multi-Task Environment.”Journal of Accounting Research 31 (1993): 216–30.
FRANCIS, J., AND L. SOFFER. “The Relative Informativeness of Analysts’ Stock Recommendationsand Earnings Forecast Revisions.” Journal of Accounting Research 35 (1997): 193–211.
FRIED, D., AND D. GIVOLY. “Financial Analysts’ Forecasts of Earnings: A Better Surrogate forMarket Expectations.” Journal of Accounting and Economics 4 (1982): 85–107.
GRAHAM, J. R.; C. R. HARVEY; AND S. RAJGOPAL. “The Economic Implications of CorporateFinancial Reporting.” Journal of Accounting and Economics 40 (2005): 3–73.
GREEN, T. C.; R. E. JAME; S. MARKOV; AND M. SUBASI. “Access to Management and the Informa-tiveness of Analyst Research.” Journal of Financial Economics (2014): Forthcoming.
GROYSBERG, B.; P. M. HEALY; AND D. A. MABER. “What Drives Sell-Side Analyst Compensationat High-Status Investment Banks?” Journal of Accounting Research 49 (2011): 969–1000.
46 L. D. BROWN, A. C. CALL, M. B. CLEMENT, AND N. Y. SHARP
GRUBMAN, J. B. “Squawk Box” interview, CNBC, May 30, 2013. Available at http://www.cnbc.com/id/100780232.
HOBSON, J. L.; W. J. MAYEW; AND M. VENKATACHALAM. “Analyzing Speech to Detect FinancialMisreporting.” Journal of Accounting Research 50 (2012): 349–92.
HONG, H., AND J. D. KUBIK. “Analyzing the Analysts: Career Concerns and Biased EarningsForecasts.” The Journal of Finance 58 (2003): 313–51.
HOWE, J. S.; E. UNLU; AND X. YAN. “The Predictive Content of Aggregate Analyst Recommen-dations.” Journal of Accounting Research 47 (2009): 799–821.
KADAN, O.; L. MADUREIRA; R. WANG; AND T. ZACH. “Analysts’ Industry Expertise.” Journal ofAccounting and Economics 54 (2012): 95–120.
KE, B., AND Y. YU. “The Effect of Issuing Biased Earnings Forecasts on Analysts’ Access toManagement and Survival.” Journal of Accounting Research 44 (2006): 965–99.
KHURANA, L., AND K. RAMAN. “Litigation Risk and the Financial Reporting Credibility of Big 4Versus Non-Big 4 Audits: Evidence from Anglo-American Countries.” The Accounting Review79 (2004): 473–95.
KIRK, M., AND S. MARKOV. “Come on Over: Analyst/Investor Days as a Disclosure Medium.”Working paper, University of Florida, University of Texas at Dallas, 2014. Available athttp://papers.ssrn.com/sol3/papers.cfm?abstract id=2144972.
KRISHNAN, J., AND J. KRISHNAN. “Litigation Risk and Auditor Resignations.” The AccountingReview 72 (1997): 539–60.
KUMAR, A. “Self-Selection and the Forecasting Abilities of Female Equity Analysts.” Journal ofAccounting Research 48 (2010): 393–435.
LANG, L. H., AND R. J. LUNDHOLM. “Corporate Disclosure Policy and Analyst Behavior.” TheAccounting Review 71 (1996): 467–92.
LEONE, A. J., AND J. S. WU. “What Does It Take to Become a Superstar? Evidence from Institu-tional Investor Rankings of Financial Analysts.” Working paper, University of Miami, 2007.Available at http://papers.ssrn.com/sol3/papers.cfm?abstract id = 313594.
LIBBY, R.; J. E. HUTTON; H. T. TAN; AND N. SEYBERT. “Relationship Incentives and the Opti-mistic/Pessimistic Pattern in Analysts’ Forecasts.” Journal of Accounting Research 46 (2008):173–98.
LIN, H., AND M. MCNICHOLS. “Underwriting Relationships, Analysts’ Earnings Forecasts, andInvestment Recommendations.” Journal of Accounting and Economics 25 (1998): 101–27.
LIN, H.; M. MCNICHOLS; AND P. O’BRIEN. “Analyst Impartiality and Investment Banking Rela-tionships.” Journal of Accounting Research 43 (2005): 623–50.
LJUNGQVIST, A.; F. MARSTON; AND W. J. WILHELM, Jr. “Competing for Securities Underwrit-ing Mandates: Banking Relationships and Analyst Recommendations.” Journal of Finance 61(2006): 301–40.
LOH, R. K., AND G. M. MIAN. “Do Accurate Earnings Forecasts Facilitate Superior InvestmentRecommendations?” Journal of Financial Economics 80 (2006): 455–83.
LYS, T., AND S. SOHN. “The Association Between Revisions of Financial Analysts’ Earnings Fore-casts and Security-Price Changes.” Journal of Accounting and Economics 13 (1990): 341–63.
MABER, D. A.; B. GROYSBERG; AND P. M. HEALY. “The Use of Broker Votes to Reward Broker-age Firms’ and Their Analysts’ Research Activities.” Working paper, University of Michigan,Harvard University, 2014. Available at http://papers.ssrn.com/sol3/papers.cfm?abstract id= 2311152.
MAYEW, W. J. “Evidence of Management Discrimination Among Analysts During Earnings Con-ference Calls.” Journal of Accounting Research 46 (2008): 627–59.
MAYEW, W. J.; N. Y. SHARP; AND M. VENKATACHALAM. “Using Earnings Conference Calls toIdentify Analysts with Superior Private Information.” Review of Accounting Studies 18 (2013):386–413.
MAYEW, W. J., AND M. VENKATACHALAM. “The Power of Voice: Managerial Affective States andFuture Firm Performance.” The Journal of Finance 67 (2012): 1–43.
MCNICHOLS, M., AND P. C. O’BRIEN. “Self-Selection and Analyst Coverage.” Journal of AccountingResearch 35 (1997): 167–99.
INSIDE THE “BLACK BOX” OF SELL-SIDE FINANCIAL ANALYSTS 47
MICHAELY, R., AND K. WOMACK. “Conflict of Interest and the Credibility of Underwriter AnalystRecommendations.” The Review of Financial Studies 12 (1999): 653–86.
MIKHAIL, M. B.; B. R. WALTHER; AND R. H. WILLIS. “Does Forecast Accuracy Matter to SecurityAnalysts?” The Accounting Review 74 (1999): 185–200.
MYERS, J. N.; L. A. MYERS; AND D. J. SKINNER. “Earnings Momentum and Earnings Manage-ment.” Journal of Accounting, Auditing and Finance 22 (2007): 249–84.
NELSON, M. W., AND D. J. SKINNER. “How Should We Think About Earnings Quality? A Discus-sion of ‘Earnings Quality: Evidence from the Field.’ Journal of Accounting and Economics 56(2013): 34–41.
O’BRIEN, P. “Analysts’ Forecasts as Earnings Expectations.” Journal of Accounting and Economics10 (1988): 53–83.
PIOTROSKI, J. D., AND D. T. ROULSTONE. “The Influence of Analysts, Institutional Investors,and Insiders on the Incorporation of Market, Industry, and Firm-Specific Information intoStock Prices.” The Accounting Review 79 (2004): 1119–51.
RAMNATH, S.; S. ROCK; AND P. SHANE. “The Financial Analyst Forecasting Literature: A Tax-onomy with Suggestions for Further Research.” International Journal of Forecasting 24 (2008):34–75.
REES, L.; N. Y. SHARP; AND B. J. TWEDT. “Who’s Heard on the Street? Determinants and Con-sequences of Financial Analyst Coverage in the Business Press.” Review of Accounting Studies(2014a): Forthcoming.
REES, L.; N. Y. SHARP; AND P. A. WONG. “Working on the Weekend: Do Analysts StrategicallyTime the Release of Their Recommendation Revisions?” Working paper, Texas A&M Uni-versity, 2014b. Available at http://papers.ssrn.com/sol3/papers.cfm?abstract id=2354561.
RICHARDSON, S.; S. H. TEOH; AND P. D. WYSOCKI. “The Walk-Down to Beatable Analyst Fore-casts: The Role of Equity Issuance and Insider Trading Incentives.” Contemporary AccountingResearch 21 (2004): 885–924.
SCHIPPER, K. “Analysts’ Forecasts.” Accounting Horizons 5 (1991): 105–21.SCHRAND, C. M., AND S. L. C. ZECHMAN. “Executive Overconfidence and the Slippery Slope to
Financial Misreporting.” Journal of Accounting and Economics 53 (2012): 311–29.SECURITIES AND EXCHANGE COMMISSION. “Final Rule: Selective Disclosure and Insider Trad-
ing.” 2000. Available at http://www.sec.gov/rules/final/33--7881.htm.SLOAN, R. G. “Do Stock Prices Fully Reflect Information in Accruals and Cash Flows About
Future Earnings?” The Accounting Review 71 (1996): 289–315.SOLOMON, D. H., AND E. F. SOLTES. “What Are We Meeting For? The Consequences of Pri-
vate Meetings with Investors.” Working paper, University of Southern California and Har-vard University, 2013. Available at https://papers.ssrn.com/sol3/papers.cfm?abstract id=1959613.
SOLTES, E. F. “Private Interaction Between Firm Management and Sell-Side Analysts.” Journalof Accounting Research 52 (2014): 245–72.
STICKEL, S. E. “Reputation and Performance Among Security Analysts.” The Journal of Finance47 (1992): 1811–36.
TRUEMAN, B. “Analyst Forecasts and Hearing Behavior.” Review of Financial Studies 7 (1994):97–124.
WELCH, I. “Herding Among Security Analysts.” Journal of Financial Economics 58 (2000): 369–96.WOMACK, K. “Do Brokerage Analysts’ Recommendations Have Investment Value?” The Journal