INSIDER TRADING, TRADED VOLUME AND RETURNS FABIO C. BAGLIANO CARLO A. FAVERO GIOVANNA NICODANO Working paper No. 26 - October 2011 DEPARTMENT OF ECONOMICS AND PUBLIC FINANCE “G. PRATO” WORKING PAPER SERIES Founded in 1404 UNIVERSITÀ DEGLI STUDI DI TORINO ALMA UNIVERSITAS TAURINENSIS
Transcript
INSIDER TRADING, TRADED VOLUME AND RETURNS
FABIO C. BAGLIANO
CARLO A. FAVERO
GIOVANNA NICODANO
Working paper No. 26 - October 2011
DEPARTMENT OF ECONOMICS AND
PUBLIC FINANCE “G. PRATO” WORKING PAPER SERIES
Founded in 1404
UNIVERSITÀ DEGLI STUDI
DI TORINO
ALMA UNIVERSITAS TAURINENSIS
Insider trading, traded volume and returns�
Fabio C. Bagliano a Carlo A. Favero b
Giovanna Nicodano ca Università di Torino and CeRP (Collegio Carlo Alberto)
b IGIER - Università Bocconi and CEPRc Università di Torino, Collegio Carlo Alberto, and ECGI
August 2011
Abstract
Several models predict that both market liquidity and trading vol-ume generated by less informed traders do not increase when there isinsider trading. Available empirical evidence is mixed and still rela-tively small, because of the inherent di¢ culty to identify insider trad-ing events. Our econometric work, based on 19 suspect insider tradingevents drawn from the non-public �le of the Italian supervisory au-thority, provides further insight on these key implications of stockmarket models. The second purpose of this paper is to assess whetherinsider trading changes the distribution of volume and returns in away that can be used by supervisory authorities in order to detect itspresence through statistical methods.
�Corresponding author: G. Nicodano ([email protected]). We are in-debted to Utpal Bhattacharya, Arturo Bris, Nadia Linciano, Alfredo Macchiatiand Giovanni Siciliano and to participants at the workshop �Market Abuses: Law,Economics, and Regulation� (Università Bocconi) and at the �IV Workshop inQuantitative Finance�(ICER, Torino) for useful suggestions, to CoNSoB for pro-viding us with the investigation �le, to Borsa Italiana and Maurizio Murgia forsupplying stock market data, to Diego Bonsignore and Enrica Marasso for researchassistance. We gratefully acknowledge �nancial support from Centro Paolo Ba¢ ,CoNSoB and MURST Co�n. This paper is a revised version of a 2001 workingpaper draft.
1
1 Introduction
This paper studies trading volume, returns and liquidity when there is insidertrading. Several models, which follow the seminal analysis in Kyle (1985),predict that the insiders�presence in a stock market is associated with pricerun-ups (downs) when the insiders�news are good (bad). Moreover, tradingvolume generated by less informed traders should not increase as the insider�sdesire to sell or buy implies a higher than average probability of losing moneyfor the trading counterpart. For the same reason the market becomes lessliquid because market makers broaden the bid-ask spread so as to cover higheranticipated losses to the insider.The empirical evidence concerning the occurrence of these e¤ects is rel-
atively small, because of the inherent di¢ culty to identify insider tradingevents even when it is not illegal. Indeed, an insider avoids diluting the valueof private information by taking actions that would reveal it to other marketparticipants too quickly. For instance the insider may rely on several brokersso as to hide the size of her overall trade to each of them. She may distributeher trades over time so as to prevent generating a burst in the order �ow,which would be interpreted unambiguously by other market participants.Given this strategy of hiding behind other traders� trades, data on in-
sider trading are costly to �nd. Such data are gathered by stock marketauthorities when it is banned by the law, but illegal insider trading �lesare often non-public. One detailed analysis is provided by Cornell and Sirri(1992) con�rming the existence of a price run-up, while challenging the viewthat liquidity and uninformed trading volume do not increase. This evidencerefers to one case only, however. The large sample of prosecuted cases usedby Meulbroek (1992) also con�rms the price run-up occurring in the dayswhen insiders are in the market, but outsiders�abnormal volume is equalacross insider trading days and other days. Fishe and Robe (2004) analyzea recent court case involving 116 publicly traded companies, con�rming theoutsiders�volume puzzle while arguing that market depth falls. Our econo-metric work is based on 19 suspect insider trading events occurred in the1990s, drawn from the non-public �le of the Italian supervisory authority,CoNSoB. To preview the results, we also �nd a price run-up, together withan increase in liquidity when insiders trade.The assessment of returns and volume during illegal insider trading days
is also useful for regulatory enforcement. Estimates of abnormal returns canbe used by courts for proving the �materiality�of inside information. Thisis related to the sum of abnormal returns (CAR) over the days in which theinside information was available up to and including the announcement date.If CAR is statistically di¤erent from zero, then the information traded on by
2
insiders was able to a¤ect prices - in other words, it was material. Courts alsorely on CAR for deciding on the penalty of the defendant (�disgorgement�),when the law mandates a penalty proportional to insider trading pro�ts.These are estimated as the product of CAR during the holding period timesthe quantity purchased or sold by the insider (Mitchell and Netter, 1994).Last but not least, the detection of illegal insider trading is not straight-
forward as the insider�s strategy consists in hiding behind other traders�trades. Statistical detection can rely on abnormal price and volume move-ments, but these are also observed in conjuction with public announcementswhich need not always be associated with insider trading activity. We pro-pose two ways to identify insider trading, that rely on a change in the timeseries pattern of returns and volume when there is insider trading. Accordingto the model of He and Wang (1995), insider trading has persistent e¤ectswhich are discernible �long� before the announcement dates, whereas an-nouncements without insider trading a¤ect volume and returns only in thedays immediately preceding and following the information release. Moreover,insider trading could be distinguished from public information because newshave a marked e¤ect on returns and none on traded volume when there ishomogeneous information in the market before the news and the updatingmethod is the same across investors (Kandel and Pearson, 1995). Thus the�rst method studies whether insider trading increases the autocorrelation ofreturns and volume, whereas the second method focuses on the di¤erentialreaction of volume and returns to announcements.Corporate insiders disclose their legal trading in the US and a few other
countries to the stock market authority, which makes this information avail-able to the public. There is a growing literature studying whether thesetrades help predict future returns and the associated corporate insiders�abor-mal trading pro�ts (Seyhun, 1988; Zaman, 1988; Lakonishok and Lee, 2001).We prefer using investigation data, since the private information content ofthese o¢ cial trades is still debated (Cohen et al., 2011; Eckbo and Smith,1998; Jeng, Metrick and Zeckhauser, 2003). However, the empirical analysisby Cao et al. (2005) con�rms that market depth increases while directorsand o¢ cers trade based on the expiration of lock up provisions after IPOs.This paper is organised as follows. In the next section we describe the
behaviour of volume and returns around public announcements with andwithout insider trading, and review previous empirical work on US data.In section 3 we describe the non-public investigation �le and our sample,contrasting its characteristics with Meulbroek�s sample. Section 4 presentsempirical results. Concluding comments follow.
3
2 The behavior of returns, volume and liq-uidity: some previous results
The pattern of volume and returns in a stock market depends on traders�preferences, on the initial distribution of information across market partici-pants and on the way they process news.If there is homogeneous information, the short-run time-series behaviour
of expected returns is in�uenced by volume (or turnover), which is in turndetermined by orders placed for liquidity reasons. Volume reduces the auto-correlation of returns because risk-averse speculators and dealers accept tobear larger risk - which is associated to larger liquidity orders - by increasingthe required return. If liquidity orders are i.i.d., conditional on low liquid-ity orders yesterday (and therefore low required returns), high liquidity or-ders (and therefore high required returns) tomorrow are expected (Campbell,Grossman and Wang, 1993).1
Consider now the possibility that some public announcement takes place.If there is homogeneous information before the announcement there is no mo-tive for trade among agents who similarly update their forecasts. There canbe a marked price variation - if some information was unexpected - but thereshould be no abnormal trading at the announcement date, because there isno a priori reason for orders related to liquidity motives to become morefrequent around announcements (Kandel and Pearson, 1995). Homogeneousinformation among market participants is likely when future announcementsrefer to macroeconomic events. Indeed Jain (1988) �nds a strong price e¤ectof certain macroeconomic news, whereas there is no signi�cant reaction inturnover. As far as �rm-relevant events are concerned, Kandel and Pearson(1995) also show that excess volume is concentrated on dates {-1,0,+1}. Ab-normal trading and excess absolute returns are also found by Morse (1981)in those same days only2. Event studies focussing on take-overs �nd a moremarked e¤ect prior to announcement dates, namely a price run-up during 10
1To capture the interaction between voume and the (�rst-order) autocorrelation inreturns, they estimate the following equation:
rt+1 = �+ ( 1Vt + 2V2t ) rt + "t
where r is daily aggregate return and V is daily aggregate detrended log turnover. They�nd 1 < 0 and statistically signi�cant as expected, and no strong evidence for nonlinear-ities (captured by the squared-volume term). This relationship also holds for individualstock return, with the aggregate turnover �gure as a measure of volume V .
2Penman (1982) �nds some excess returns in day -3 as well. However, he uses a di¤erentapproach in that he estimates normal expected returns with a speci�c parametric model,namely the CAPM.
4
to 20 days preceding the announcement (Jarrell and Poulsen, 1989). HoweverGupta and Misra (1989) argue that a large part of the excess return is due toother kinds of publicly available information, such as rumours in the press.When companies which were not subject to rumours are examined, there isno excess return but in the day prior to the announcement. Hence, there islittle or no evidence of abnormal behaviour preceding day -1 for in samplesof US company announcements, once rumours in the press are accounted for.When there is insider trading in the market, the asset price approaches
the value implied by the inside information over time so that there should beno price surprise upon the announcement if insider trading is unregulated.3
Orders placed by insiders push up total trading volume while orders placedfor liquidity reasons should not change (Kyle, 1985; Foster and Viswanathan,1996; Back Cao Willard, 2000)4. The bid-ask spread charged by risk-neutralmarket-makers widens (Glosten and Milgrom, 1985), as they expect to losewhen they �ll the orders placed by insiders, and need to gain more from lessinformed traders. As a consequence market liquidity falls.It would be wrong to conclude that all abnormal trading occurring before
or after public information is due to insider trading. When speculators havedi¤erent signals with equal precision, a public announcement generates vol-ume of trade because investors correct their previous forecasts with di¤erentintensity (Grundy and McNichols, 1990). Excess volume is concentrated justprior to and after the announcement because di¤erently informed specula-tors bet on the outcome of the news release and close their positions justafterwards. �New public information mainly generates trade in the currentperiod.�On the contrary, �new private information not only generates trad-ing in the current period, but also generates trading in future periods. Thisimplies that when there is private information, independent arrival of newinformation can generate serially correlated volume� (He and Wang, 1995,p.957-958). High volume is not always a symptom of new information arrivalto market participants, whereas high volume and large price changes are. In-deed, high volume of trade may not be accompanied by large price changes,when information is already in the economy and it is being revealed throughprices by the speculators�trades. When new exogenous information arrives,
3In the Kyle (1985) model, the insider is risk-neutral. While risk-neutrality is not ingeneral interesting for stock markets (since prices include a risk-premium) an insider oftenenjoys highly precise information on the content of the announcement, which makes himbehave as if he was risk-neutral.
4Volume may change if outsiders, endowed with well de�ned preferences, choose in-vestment in stocks anticipating future insider trading. If risk sharing gains exceed adverseselection losses, volume may increase (Bu¤a, 2004). If the opposite holds, it falls (Bu¤aand Nicodano, 2008).
5
on the contrary, there is an abrupt change in the investors�perception of thestock�s underlying value- and high volume is associated with large absoluteprice changes.Cumulative abnormal returns and abnormal trading volume for individual
stocks are indeed found during days of illegal insider trading well before theannouncement date after controlling for news in the press. Insider trading,and the associated abnormal volume and price run-up, typically takes place6 (median) to 13 (mean) days before the public announcement (Meulbroek,1992). A similar evidence is presented by Cornell and Sirri (1992). Bothare consistent with the insight according to which new private informationgenerates a persistent e¤ect on volume and returns.5 However, the increasein both outsiders�volume and liquidity - highlighted by Cornell and Sirri(1992)- is inconsistent with a key implication of adverse selection models.Fishe and Robe (2004) con�rm the outsiders�volume puzzle, yet they arguethat quoted depth falls in both specialist�s and dealers�market.6 Below weprovide further evidence based on a sample of stock traded at the main Italianexchange.
3 Consob investigations
The Stock Exchange Authority - upon receiving an insider trading alert -gathers preliminary information on transactions performed and intermedi-aries involved. Then it reports the case to the judicial authority with orwithout a recommendation to further the enquiry. Our �le of CoNSoB inves-tigations includes all insider trading events occurred from 1991, when the lawwas �rst enacted, and �led to courts before July 1999 with recommendationto enquire.The non-public �le indicates whether each episode involves insider trad-
ing, manipulation or both. In Table I insider trading investigations are 58,while market manipulations are 18. The number of suspect insider traders is311. The list of suspects includes funds, banks, foreign intermediaries, groupholding companies, individual companies as well as investors with (memberof the board, manager..) or without connections with the issuer of the traded
5It is also consistent with the e¤ects of the introduction of binding restrictions on insidertrading e¤ected in the Amsterdam Stock Exchange in 1987. Trading volume fell and theprice run-up was smaller when insiders were not allowed to trade (Kabir and Vermaelen,1996).
6The specialist also increases the spread. Fishe and Robe�s experiment refers to 2-trading days advance knowledge of a column to be published in Business Week, ratherthan inside information on a company�s future announcement.
6
stock. Indeed, the ultimate insider trader may still be unknown to the mar-ket authority during the investigation7. This is typical in cases involvingforeign intermediaries, that will reveal the identity of the person placing theorder only if requested by courts. Suspect insiders may thus outnumber theultimate insider traders, which may explain why the number of insiders perepisodes (5.36) is much higher than Meulbroek�s (2.5). The total numberof companies involved in the deals (and not necessarily in the trading) is111. Each insider trading episode may involve more than one company, forinstance during a merger.Table II lists the type of corporate event involved. In the vast majority
of episodes (76%), the information concerns corporate control transactionssuch as trades of control blocks in the company or its parent, stock issuesor conversions, mergers, restructuring. This �gure is similar to Meulbroek�s(79%). Her sample includes many cases of hostile take-overs while in Italythese were rare because corporate control was highly concentrated during thesample years.Records provide information on the trades performed by each insider (or
intermediary), the date, volume and cost. Table III reports pro�ts gained orlosses avoided by insiders, as estimated by CoNSoB. These �gures are notbased on abnormal returns. They are set equal to the di¤erence betweenamount paid by the suspects for buying shares and the amount receivedfor selling them on the basis of actual transaction data. When stock mar-ket data record only some purchases (or sales) before the announcement,CoNSoB assumes that the missing closing transaction was performed on theannouncement date by the insider. In the case of insiders�sales before a liq-uidation event, the estimated gain is set equal to the receipts from the sales-which can be very large. When we exclude (include) the liquidation events,the per-episode mean pro�t is equal to 1464.7 (5044) millions lira, with manycases involving small gains.In our econometric analysis we focus on all events which took place af-
ter December 1994. We drop previous observations because major marketreforms were implemented in the early nineties,8 altering the time-series of
7This may hold during litigation, as the identi�cation of ultimate insiders was di¢ cultfor the stock market authority due to its limited investigation powers. Linciano (2003)analyzes the e¤ectiveness of insider trading regulation in Italy. A 1998 amendment of thelaw required prosecutors to prove that insiders actually used price-sensitive non-publicinformation.
8In 1991 there were changes in securities regulation, prohibiting o¤-exchange tradingand dealers. In 1992 a block market began operations. Between 1991 and 1994 there wasa gradual transition from a call auction to a continuous screen-based auction, followed in1994 by a gradual change to cash settlement and the opening of trading in stock indexfutures. These reforms appear to have altered the returns - volume relationship for large
7
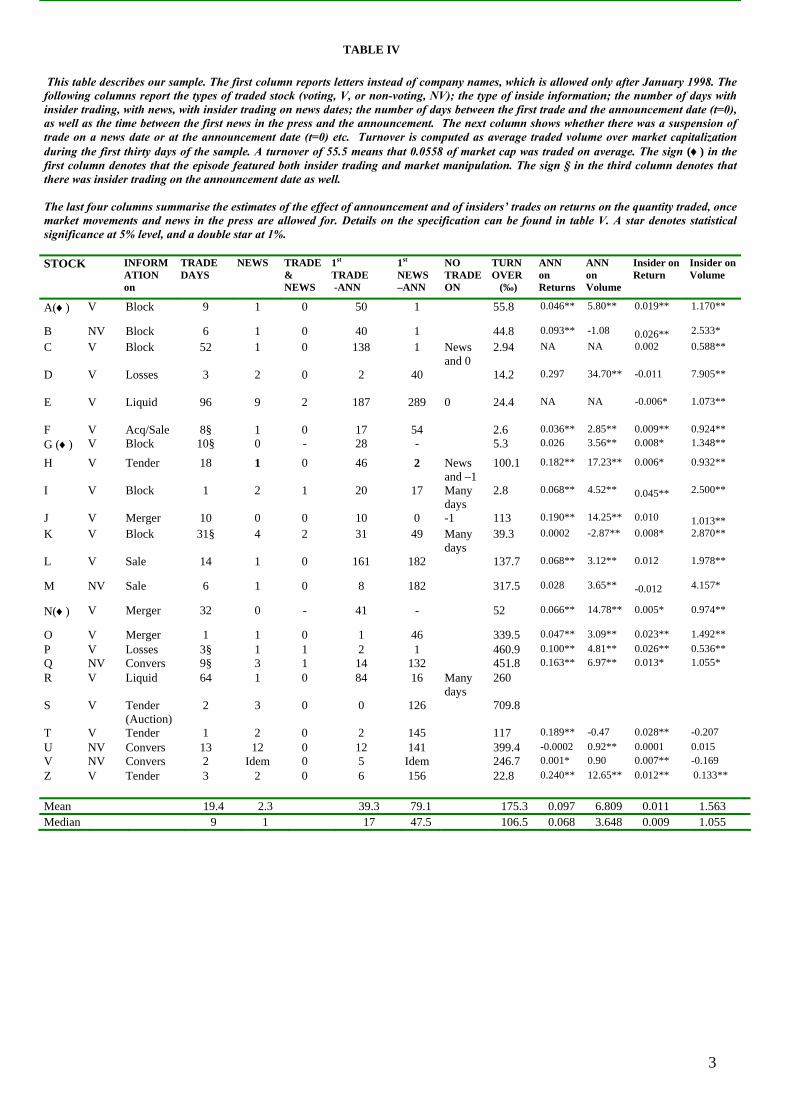
returns and trading volume. Stocks trading either outside the main market-place or too infrequently are dropped, thus remaining with 23 events listedin Table IV. These events involve 22 stocks, which are non-voting in 5 cases.The types of companies range from small caps to both large private group-a¢ liated �rms and privatising companies, with widely di¤erent turnover ra-tios. Table IV also reports the mean and median number of insider tradingdays (19.4; 9), which is far higher than the estimate for the US (3.2;2), whilenews days (2.3; 1) are not dissimilar (0.7;0). Insiders in Italy also begintrading much earlier (39.3;17) than in the US (13.2; 6). This di¤erence canbe ascribed to SEC investigation method, if it focuses attention on the twoweeks preceding announcements only. Alternatively, it may be that timelyreporting requirements are enforced more strictly in the US, thus allowingless time for insider trading.
4 Empirical Analysis
We collect �news� on these episodes, consisting of articles in the �nancialdaily Il Sole-24 Ore concerning the content of the future announcement. Wesearched for the names of the company in the year preceding and followingthe episode, and kept track of the dates of all articles referring to the futureevent (losses, tender) - irrespective of the precision of the information. Dailydata on prices, volume, turnover, the market index and aggregate lira tradevolume have been provided by Borsa Italiana.
4.1 Speci�cation and estimation method
We estimate three equations for each episode (indexed by i = 1::I), one forreturn (Ri), one for number of shares traded (Vi), and one for stock illiquidity
liquid companies (Majnoni and Massa, 1996) and increased volatility of excess returns forless liquid stocks (Impenna et al., 1995).
The �rst control in equation (1), Rmt, is the return on a market index, whichin our case is the MIBTEL index. The regressor Vmt in equation (2) is thetotal value of traded shares divided by a �market price� Pmt obtained asPmt = (1+Rmt)Pmt�1; with Pm0 = 100: Illiquidity in equation (3), ILLIQit,is measured as the ratio of absolute return to trading volume. This is aproxy for the price impact suggested by Amihud (2002) and supported byHasbrouck (2009), which shows strong correlation with conventional mea-sures of illiquidity. Since the price impact in several models (e.g. Kyle, 1985)is de�ned as absolute return over uninformed volume, we also run the regres-sion with this de�nition of ILLIQ. The dummy variables INSIDE, ANNand NEWSj respectively indicate the days when insider trade occurred, asreported in the investigation �le, and when the announcement and the newsare released. NEWS refer to newspaper articles concerning the inside infor-mation, as in Meulbroek (1992). Since their precision varies, we insert onedummy NEWSj for each article in order to allow for di¤erent impacts. Inthe �rst two equations we also insert the lagged dependent variable - alsointeracted with the INSIDE dummy - so as to check whether there is a sig-ni�cant change in the �rst-order autocorrelation of the series, as suggestedin section 2.9
We run the three regressions for each stock separately. The initial dateis 150 days before the �rst news or insider trade, and the �nal date is theannouncement day except when no quotation is available on that day, whichoccurs in two cases in our sample. OLS estimates show no correlation ofresiduals, and coe¢ cients�standard errors are corrected for heteroskedasticitywhen detected by appropriate speci�cation tests.
9We also allowed for dependence of returns on contemporaneous volume as in Campbell,Grossman and Wang (1993), but the regressor itself has no statistical power. Since theother results are unaltered, we do not report them.
9
Table V reports the mean and median coe¢ cient estimates on the ANN ,INSIDE, and lagged dependent variables for equations (1) and (2). Toallow comparability across stocks, the estimated e¤ects of the ANN andINSIDE variables on volumes are expressed as percentage of the averagevolume traded in the stock over the estimation period. Since our sample issmall, we cannot construct meaningful cross-sectional standard errors and wereport the number of statistically signi�cant cases. The individual coe¢ cientsare reported also in the last four columns of Table IV. Insider trades havea statistically signi�cant e¤ect in 13 regressions out of 21 both on returnsand on volumes; in 20 on either returns, or volume or both. When the co-e¢ cient of insiders�trades in the returns equation is statistically signi�cant,which occurs in 15 cases, it is possible to compute insiders� excess pro�tswhich can then be used to determine disgorgement, as explained below insection 5. News and announcement days have a statistical signi�cant impacton both returns and volume in several episodes. The return autocorrelationparameter is statistically signi�cant in four cases: while it is generally ac-cepted that returns are predictable over longer horizons, it is unusual to �ndthis result in daily data for individual stock returns. Volume is predictable,consistent with the presumption - outlined in section 2 - that private andinside information get incorporated slowly in asset prices through trading.Table VI reports estimates for equation (3). The coe¢ cient associated
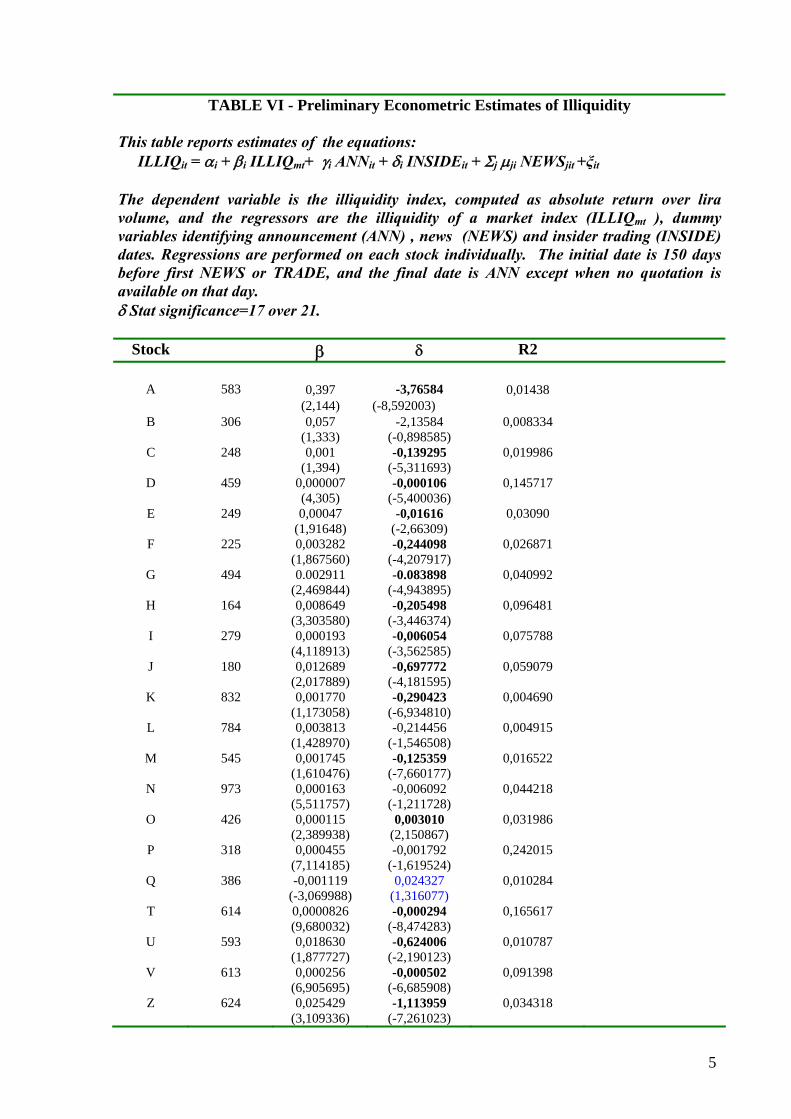
with insider trading dates, �, is negative and statistically signi�cant in 16cases out of 21, suggesting that market liquidity increases when there isinsider trading. This supports the �nding by Cornell and Sirri (1992) basedon only one court case.
4.2 Insider trades, run ups and volume
Consider the price run-up, averaged across episodes, associated with insideinformation:
APR =
Pi(
i+ ni �i +
Pj �ji)
I(4)
where I is the number of insider trading episodes and ni denotes the numberof days with insiders�trades in each episode i. This measure is obtained asthe sum of three components: announcement, insider trading, and news.The impact of insider trading on daily returns, averaged across episodes
(computed as 1I
Pi �i and reported in Table V), is equal to 1:1%. Meul-
broek�s (1992) estimates are higher (3%, see her Table V, p.1679); howeverthe median number of trading days in her sample (2) is smaller than in ours(19:4) suggesting that cumulatively insider trading is more visible on theMilan exchange than in the US stock markets (6:85).
10
The relative size of the announcement component can be related to theintensity of insider trading. Indeed inside information is incorporated intoprices by the time its public announcement occurs, if insider trading is unre-stricted (Kyle, 1985), in which case there should be no abnormal behaviouron announcement dates.10 This is precisely what happens on the Bolsa Mexi-cana to stocks which are traded only by local citizens, as unrestricted insidertrading takes place in advance of public disclosure (Bhattacharya, Daouk,Jorgenson and Kehr, 2000). Our results show average abnormal returns onannouncement dates (9:67% in absolute value, as reported in Table V) whichare smaller than in the US (18:50%) but larger than in Mexico (very closeto 0%). The ratio of the price run-up associated with insider trading daysrelative to the price run-up at announcement dates, know as �price accuracy�(PA, Meulbroek, 1992):
PA =1
I
Xi
n�i
i
(5)
is in�nite in Mexico, intermediate in Italy (222%, when attention is restrictedto statistically signi�cant estimates) and moderate in the US (47:56%). Thisresult may be due to stricter enforcement of insider trading regulation and/orof disclosure requirements in the US. Indeed the US have a longer traditionthan Italy of prosecution of insider trading, as the law was instituted in 1934rather than 1991 and the �rst enforcement (prosecution in court) took placein 1961 instead of 1996 (Bhattacharya and Daouk, 2002).11
The mean abnormal volume on insider trading days in our sample is1.563, that is volume is 156.3% higher than usual (0.93 in Meulbroek). Insection 2 we report that there is no signi�cant reaction to macroeconomicannouncements in the US (Jain, 1988) which is consistent with absence ofprivate information among investors since everyone would like to trade in thesame direction. In our sample there is an almost seven-fold increase in volumeon announcement dates, consistent with the presumption that investors whobought (sold) on both private and inside information sell (buy) to the newlyinformed ones after the announcement.Finally, the average daily quantity traded by insiders signi�cantly in-
creases in the number of trading days available before the announcement. Itis therefore not the case in our sample that insiders choose to trade more (andbecome more visible) when time is shorter. There is also a positive relationwith average turnover in �normal�days, suggesting that insiders trade more
10A similar pattern emerges also when there is an abstain-or-disclose rule for corporateinsiders�trading (Huddart, Hughes and Levine, 2001).11This suggests to experiment this ratio as a metric for the e¤ectiveness of insider trading
regulation in a cross-country study.
11
when higher liquidity provides them with better camou�age.
5 Enforcing insider trading regulation
5.1 Disgorgement
Courts can rely on estimated Cumulative Abnormal Returns (CAR) for de-ciding on the penalty of the defendant (�disgorgement�), when the law man-dates a penalty proportional to insider trading pro�ts. These are estimatedas the product of CAR during the holding period times the quantity pur-chased or sold by the insider (Mitchell and Netter, 1994). Abnormal returnsto insider trading are in turn computed as the di¤erence between the ac-tual returns and an estimate of the portion of returns which is associated tofactors di¤erent from the inside information.The estimate of abnormal returns is usually based on a simple �market
model�, with a market return as the sole regressor (Mitchell and Netter,1994). In Table V news and announcement-day dummies have a statisticalsigni�cant impact on both returns and volume in most episodes. Thereforethe estimate of abnormal returns based on a simple �market model�yieldsbiased results in general. In other words, the abnormal return is often setequal to:
ARit = b�i (6)
where b� is estimated from the �market model�:
Rit = �i + �iRmt + ei (7)
According to our analysis, the speci�cation for returns should include alsodummy variables for both news and announcement days, and the abnormalreturn should then be computed as:
using the parameter estimates from equation (1). Equation (7) thus providesbiased estimates of abnormal returns.
5.2 Materiality of Information
Estimates of abnormal returns can also be used by courts for proving the�materiality� of inside information. This is usually related to the sum ofabnormal returns over the days in which the inside information was availableup to and including the announcement date, when the speci�cation adopted
12
is a simple market model (Mitchell and Netter, 1994). If CAR is statisticallydi¤erent from zero, then the information traded on by insiders was able toa¤ect prices - in other words, it was material.Given our speci�cation, materiality should be linked to the statistical
signi�cance of:
�̂i+(�̂2iINSIDEit)Rit�1+ ̂iANNit+ �̂iINSIDEit+Xj
�̂jiNEWSjit (9)
In our sample inside information appears as material in all episodes. Indeed,the announcement e¤ect on returns is below statistical signi�cance in �vecases, but in those cases the coe¢ cient of the dummy associated with ei-ther insider trading or news or both are statistically signi�cant. It followsthat the inside information is able to signi�cantly alter prices, which impliesmateriality.
5.3 Detection of insider trading with abnormal timeseries behavior
Section 2 argues that insider trading is associated with abnormal patterns ofindividual volume and returns and that, a priori, these can be distinguishedfrom pure news and announcements e¤ects because the former appear andpersist before release dates while the latter closely surround the release time.Moreover, the e¤ect of announcements and news on traded volume is negli-gible compared to that on absolute returns, if there is no private informationand the method for updating information is similar across investors. Figure1 shows that both news and insider trading usually signi�cantly a¤ect bothreturns and volume, suggesting that information was not homogeneously dis-tributed prior to the announcement.We cannot also detect any systematic ordering in the ratio of absolute
return to absolute volume changes between news and insiders�dates, while weexpected the former to be lower. There is, however, some clustering of pointsaround the horizontal axis for the case of news, suggesting less asymmetricinformation before news release rather than before announcements. Figure 1and Figure 2 together show that the response of prices and volumes to publicand private information is not markedly di¤erent in our sample.We also checked whether the serial dependence of volume (and returns)
is increased by insider trading. However the latter does not change in asystematic way the autocorrelation parameter, as shown by the high numberof insigni�cant estimates of the coe¢ cient �2i in Table V. These results ruleout the possibility to re�ne along these lines existing detection methods.
13
6 Summary of results and concluding com-ments
Our econometric results con�rm the robustness of the speci�cation for re-turns used by Meulbroek (1992), with the return on the stock index, theannouncement day dummy and the news date dummies being statisticallysigni�cant explanatory variables. This implies that abnormal returns areestimated with systematic errors if a pure market model is used. Furtherspeci�cations for returns can be investigated in future work following thelarge debate on multi-factor analysis.On the basis of our estimates, inside information can be shown to be
�material� in all episodes occurred at the Milan exchange in the 1990s andconsidered worth of further judicial investigation by the stock market au-thority. Moreover, reliable measures of �disgorgement�can be constructedin �fteen cases out of twenty-one on the basis of a statistically-signi�cantestimate of the coe¢ cient associated with insider trades.The comparison between our sample and Meulbroek�s suggests that in-
sider trading is more pervasive in Italy than in the US. Indeed, the meannumber of insider trading days is far higher in Italy than in the US, whilethat of news days is not dissimilar. Our estimates of abnormal returns on theannouncement date also indicate that the �price surprise�in Italy is smallerthan in the US. Conversely, the average price run-up during insider tradingdays is larger in Italy than in the US.In our sample, insider trading does not change the time-series behaviour
of volume and returns in a way that can be used by supervisory authori-ties in order to re�ne existing detection methods. Our results indicate thatit is not possible to devise an alert system based on the changing patternof returns autocorrelation, because estimates of the correlation parameteron insider trading dates are too unstable and imprecise. Moreover, in oursample there is also no detectable di¤erence between abnormal return re-sponse to news and to insiders�trades, suggesting that there was di¤erentialinformation prior to the announcement. However, further insight could begained by contrasting the current sample with another matched by size andannouncement type. We expect the suspect sample to feature higher abnor-mal volume at the announcement date than the matched one, because ofasymmetric information prior to the announcement. Moreover, the suspectsample should show both higher �price accuracy�and abnormal volume overthe interval from 15 days to two days prior to the announcement, as privateinformation is incorporated into prices.Finally, the small size of our sample prevents formal testing of micro-
14
structural theories of insider trading. However, our evidence con�rms boththe price run-up and the increase in liquidity found by Cornell and Sirri(1992). While these results challenge conventional wisdom based on adverseselection models with risk neutral pricing, they should not be interpretedas evidence that regulation is detrimental to the stock market because itslows down the revelation of information. Indeed, insider trading reducesother investors�welfare even when it enhances price informativeness, pro-vided that its positive e¤ects on investment (Leland, 1992) and risk sharing(Bhattacharya and Nicodano, 2001) are o¤set by ousiders�trading losses.
15
References
[1] Amihud Y., Illiquidity and Stock Returns: Cross Section and Time-Series E¤ects, Journal of Financial Markets, 5, 2002, 31-56
[2] Back K., Cao H. and G.A. Willard, Imperfect Competition among In-formed Traders, Journal of Finance, 55, 2000, 2117-2155
[3] Bhattacharya U., H. Daouk, TheWorld Price of Insider Trading, Journalof Finance, 57(1), 2002, 75-108
[4] Bhattacharya U., H. Daouk, B. Jorgenson and C. Kehr, When an eventis not an event: the curious case of an emerging market, Journal ofFinancial Economics, 55, 2000, 69-101
[5] Bhattacharya S. and G. Nicodano, Insider Trading, Investment and Liq-uidity: A Welfare Analysis, Journal of Finance, 56(3), 2001, 1141-1156
[6] Bu¤a A., Strategic Insider Trading with Imperfect Information: A Trad-ing Volume Analysis, Rivista di Politica Economica, 2004, 101-143
[7] Bu¤a A., and G. Nicodano, Should Insider Trading Be Prohibited WhenShare Repurchases Are Allowed?, Review of Finance, 12(4), 2008 735-765
[8] Cao C., Casares Field L., and G. Hanka, Does Insider Trading ImpairMarket Liquidity? Evidence from IPO Lockup Expirations,
Journal of Financial and Quantitative Analysis, 78, 2005, 1073-1109
[9] Campbell J., Grossman S. and J. Wang, Trading Volume and the SerialCorrelation in Stock Returns, Quarterly Journal of Economics, 1993,108, 905-940
[11] Cornell B. and E. Sirri, The reaction of investors and stock prices toinsider trading, Journal of Finance, 47(3), 1992, 1031-1059
[12] Eckbo Espen B. and David C. Smith, The Conditional Performance ofInsider Trades, Journal of Finance, 53(2), 1998, 467-498
[13] Fishe R. P.H. and M. A. Robe, The Impact of Illegal Insider Tradingin Dealer and Specialist Market: Evidence from a Natural Experiment,Journal of Financial Economics, 71, 2004, 461-488
16
[14] Foster F.D. and S. Viswanathan, Strategic Trading when Agents�Fore-casts the Forecasts of Others, Journal of Finance, 51, 1996, 1437-1478
[15] Glosten L. and P. Milgrom, Bid, Ask and Transaction Prices in a Special-ist Market with Heterogenously Informed Traders, Journal of FinancialEconomics, 1985, 14, 71-100
[16] Grundy B.D. and M. McNichols, Trade and the Revelation of Informa-tion through Prices and Direct Disclosure, Review of Financial Studies,2(4), 1990,495-592
[17] Gupta A. And L. Misra, Public Information and Pre-Announcementtrading in Takeover Stocks, Journal of Economics and Business, 41,1989, 225-233
[18] Hasbrouck J., Trading Costs and Returns for US Equities: EstimatingE¤ective Costs from Daily Data, Journal of Finance, 64(3), 2009, 1445-1477
[19] He H. and J. Wang, Di¤erential Information and the Dynamic Behaviorof Stock Trading Volume, Review of Financial Studies, 8(4), 1995, 919-972
[20] Huddart S., Hughes J.S. and C. B. Levine, Public Disclosure and Dis-simulation of Insider Trades, Econometrica, 69(3), 2001, 665-681
[21] Impenna C., P. Maggio and F. Panetta, Innovazioni strutturali nel mer-cato azionario: gli e¤etti della contrattazione continua, Banca d�Italia,Temi di discussione, 248, 1995
[22] Jain P.C., Response of Hourly Stock Prices and Trading Volume toEconomic News, Journal of Business, 1988, 61(2), 219-231
[23] Jarrell G. and Poulsen A., Stock Trading before the Announcement ofTender O¤ers: insider trading or market anticipation?, Journal of Law,Economics and Organization, 5, 1989, 225-248
[24] Jeng Leslie A., Metrick Andrew and Richard Zeckhauser, Estimatingthe Returns to Insider Trading: A Performance- Evaluation Perspective,Review of Economics and Statistics, 85(2), 2003, 453-471
[25] Kabir R. and T. Vermaelen, Insider Trading and the Stock Market:Evidence from the Amsterdam Stock Exchange, European EconomicReview, 40, 1996, 1591-1603
17
[26] Kandel E. and N.D. Pearson, Di¤erential Interpretation of Public Signalsand Trade in Speculative Markets, Journal of Political Economy, 103(4),1995, 831-872
[27] Kyle A., Continuous Auctions and Insider Trading, Econometrica, 53(6),1985, 1315-1336
[28] Lakonishok J. and I. Lee, Are Insiders�Trades Informative?, Review ofFinancial Studies, 14(1), 2001, 35-67
[29] Leland H., Insider Trading: Should it be Prohibited?, Journal of Polit-ical Economy, 100(4), 1992, 859-887
[30] Linciano N., The E¤ectiveness of Insider Trading Regulation in Italy.Evidence from Stock Price Run-Ups around Announcements of Corpo-rate Control Transactions, European Journal of Law and Economics, 16,2003, 199-218
[31] Majnoni G., and M. Massa, Share prices and Trading Volume: Indica-tions of Stock Exchange E¢ ciency, Banca d�Italia, Temi di discussione,263, 1996
[32] Meulbroek L.K., An Empirical Analysis of Illegal Insider Trading, Jour-nal of Finance, 47(5), 1992, 1661-1701
[33] Michaeli R. and J.L.Vila, Trading Volume with Private Valuation: Ev-idence from the Ex-Dividend Day, Review of Financial Studies, 9(2),1996, 471-509
[34] Mitchell M.L. and J.M. Netter, The Role of Financial Economics inSecurities Fraud Cases: Applications at the Securities and ExchangeCommission, Business Lawyer, 49, 1994, 545-590
[35] Morse D., Price and Trading Volume Reaction Surrounding EarningsAnnouncements: A Closer Examination, Journal of Accounting Re-search, 19(2), 1981, 375-383
[36] Penman S.H., Insider Trading and the Dissemination of Firms�ForecastInformation, Journal of Business, 1982,55(4), 479-503
[37] Seyhun N., The Information Content of Aggregate Insider Trading,Journal of Business,. 61, 1988, 1-24
[38] Wang J., A Model of Competitive Stock Trading Volume, Journal ofPolitical Economy, 102(1), 1994, 127-168
18
[39] Zaman M.A., Market E¢ ciency and Insider Trading: New Evidence,Journal of Business, 61(1), 1988, 25-44
19
Table I – CoNSoB Investigation activity (1991-7/1999). This table reports the number of both insider trading and market manipulation episodes, which were investigated and filed to courts before July 1999 by CoNSoB. They are listed by the year in which the violation occurred. Insider trading events are reported in the first row, followed by the number of suspect insiders and by the number of companies involved. Market manipulation episodes are listed in the last row. The suspect insiders sometimes are unknown (typically in cases involving foreign intermediaries), in which case the numbers refer to intermediaries used by insiders. Each insider trading episode may involve more than one company (e.g. in case of a merger). 91 92 93 94 95 96 97 98 99 TOTAL # InsiderTrading 5 9 10 11 4 8 6 3 2 58 # Insider traders 15 21 44 50 28 63 64 10 16 311 # Companies 11 20 21 19 8 13 10 6 3 111 # Manipulation 0 0 0 3 4 3 7 1 0 18
TABLE II- Type of inside information. This table reports the type of inside information associated with the episodes investigated. Corporate control transactions are highlighted in bold. Stock Conversion 4 Stock Issue 2 Control Block Transaction/Tender Offer 25 Sale/acquisition of another company 3 Friendly Merger 8 Restructuring 2 Losses 3 (Near) Liquidation 5 Others 6 TOTAL 58
1
Table III- Profit gained (loss avoided) by insiders. This table reports the year of the violation, the number of insider trading episodes, the total profits per year as well as the mean, minimum and maximum profit per year. Profits reported in this table are estimated by CoNsoB. These are the insider's holding period gains, calculated from actual buy and sell prices when available. If the insider's position is still open after the public announcement, CoNsoB assumes that the insider closed it at the first price prevailing after the announcement. In the case of liquidation, the estimated gain is set equal to the amount of sales. When liquidation events occur in a given year, we report the statistics including these cases in parentheses. Figures are in thousand euro. # Total Mean Min Max 1991 5 371.3 74.1 6.7 222.6 1992 9 1594.8 177.2 11.9 1084.6 1993 8(10) 3782.5 (40300.7) 472.8 (5037.6) 5.2 2685.6 (22724.1)1994 11 15590.1 1417.4 5.7 7746.9 1995 3 1357.2 447.8 14.5 1239.5 1996 6(7) 8234.9 (41029.9) 1372.5 (5861.3) 27.4 5061.3 (32795) 1997 5(6) 10061.1 (57576) 2012.4 (9596) 82.2 6713.9 (47514) 1998 3 1053.1 350.1 49.6 619.7 1999 2 965.8 482.9 242.7 723
2
TABLE IV This table describes our sample. The first column reports letters instead of company names, which is allowed only after January 1998. The following columns report the types of traded stock (voting, V, or non-voting, NV); the type of inside information; the number of days with insider trading, with news, with insider trading on news dates; the number of days between the first trade and the announcement date (t=0), as well as the time between the first news in the press and the announcement. The next column shows whether there was a suspension of trade on a news date or at the announcement date (t=0) etc. Turnover is computed as average traded volume over market capitalization during the first thirty days of the sample. A turnover of 55.5 means that 0.0558 of market cap was traded on average. The sign (♦) in the first column denotes that the episode featured both insider trading and market manipulation. The sign § in the third column denotes that there was insider trading on the announcement date as well. The last four columns summarise the estimates of the effect of announcement and of insiders’ trades on returns on the quantity traded, once market movements and news in the press are allowed for. Details on the specification can be found in table V. A star denotes statistical significance at 5% level, and a double star at 1%. STOCK
INFORMATION on
TRADE DAYS
NEWS TRADE& NEWS
1st
TRADE -ANN
1st NEWS –ANN
NO TRADE ON
TURNOVER (‰)
ANN on Returns
ANN on Volume
Insider on Return
Insider onVolume
A(♦) V Block 9 1 0 50 1 55.8 0.046** 5.80**
0.019** 1.170**
B NV Block 6 1 0 40 1 44.8 0.093** -1.08 0.026** 2.533* C V Block 52 1 0 138 1 News
and 0 2.94 NA NA 0.002 0.588**
D V Losses 3 2 0 2 40 14.2 0.297 34.70** -0.011 7.905**
E V Liquid 96 9 2 187 289 0 24.4 NA NA -0.006* 1.073**
F V Acq/Sale 8§ 1 0 17 54 2.6 0.036** 2.85** 0.009** 0.924** G (♦) V Block 10§ 0 - 28 - 5.3 0.026 3.56** 0.008* 1.348**
H V Tender 18 1 0 46 2 News and –1
100.1 0.182** 17.23** 0.006* 0.932**
I V Block 1 2 1 20 17 Many days
2.8 0.068** 4.52** 0.045** 2.500**
J V Merger 10 0 0 10 0 -1 113 0.190** 14.25** 0.010 1.013** K V Block 31§ 4 2 31 49 Many
days 39.3 0.0002 -2.87** 0.008* 2.870**
L V Sale 14 1 0 161 182 137.7 0.068** 3.12** 0.012 1.978**
M NV Sale 6 1 0 8 182 317.5 0.028 3.65** -0.012 4.157*
The dependent variables are stock return and traded volume, and the regressors are the return of a market index (Rmt), aggregate trading volume (Vmt) the lagged dependent variable, and dummy variables identifying announcement (ANN , news (NEWS) and insider trading (INSIDE) dates. Regressions are performed on each stock individually. The initial date is 150 days before first NEWS or INSIDE date, and the final date is the announcement day, except when no quotation is available on that day. The numbers below are the mean and the median of estimated parameters in our sample.
Estimated
coefficient: γ δ ρ1 ρ2
Mean 9.67% 1.10% 0.066 0.415
Median 6.80% 0.90% 0.079 0.436 Equation
For Returns
n. of coeff. stat. signif
(5%)
14 (out of 19)
15 (out of 21)
5 (out of 21)
2 (out of 19)
Mean 680.9% 156.3% 0.307 -0.337 Median 364.8% 105.5% 0.084 -0.110
Equation For
Volumes
n. of coeff. stat. signif
(5%)
16 (out of 19)
18 (out of 21)
20 (out of 21)
6 (out of 19)
4
5
TABLE VI - Preliminary Econometric Estimates of Illiquidity This table reports estimates of the equations: ILLIQit = αi + βi ILLIQmt+ γi ANNit + δi INSIDEit + Σj μji NEWSjit +ξit
The dependent variable is the illiquidity index, computed as absolute return over lira volume, and the regressors are the illiquidity of a market index (ILLIQmt ), dummy variables identifying announcement (ANN) , news (NEWS) and insider trading (INSIDE) dates. Regressions are performed on each stock individually. The initial date is 150 days before first NEWS or TRADE, and the final date is ANN except when no quotation is available on that day. δ Stat significance=17 over 21.
Stock β δ R2
A 583 0,397 -3,76584 0,01438 (2,144) (-8,592003)
B 306 0,057 -2,13584 0,008334 (1,333) (-0,898585)
C 248 0,001 -0,139295 0,019986 (1,394) (-5,311693)
D 459 0,000007 -0,000106 0,145717 (4,305) (-5,400036)
E 249 0,00047 -0,01616 0,03090 (1,91648) (-2,66309)
F 225 0,003282 -0,244098 0,026871 (1,867560) (-4,207917)
G 494 0.002911 -0.083898 0,040992 (2,469844) (-4,943895)
T 614 0,0000826 -0,000294 0,165617 (9,680032) (-8,474283)
U 593 0,018630 -0,624006 0,010787 (1,877727) (-2,190123)
V 613 0,000256 -0,000502 0,091398 (6,905695) (-6,685908)
Z 624 0,025429 -1,113959 0,034318 (3,109336) (-7,261023)
Figure 1 - Effect of insider trading and announcements on returns and volumes The left-hand side panels report the point estimates of δi (upper) and of γi (lower) in the return and volume equations. The right-hand side panels report the t-statistics associated with estimates of δi (upper) and of γi (lower). Points to the right of the vertical axis represent statistically significant estimates in the return equation. Points above the horizontal axis represent statistically significant estimates in the volume equation.
T-stat. on ANNOUNCEMENT(two additional observations)
-100
1020
3040
5060
7080
90
0 10 20 30 40
Equation for return
Equ
atio
n fo
r vol
ume
Figure 2- Effects of news on returns and volumes This table represents the point estimates of μij in the return and volume equations (left-hand side) and to the T-statistics associated to them (right-hand side). Points to the right of the vertical axis represent statistically significant estimates in the return equation. Points above the horizontal axis represent statistically significant estimates in the volume equation.
Effect of NEWS
-2
0
2
4
6
8
10
12
14
16
-0,01 0,01 0,03 0,05 0,07 0,09 0,11 0,13 0,15
Equation for return
Equ
atio
n fo
r vol
ume
T-stat on NEWS(two additional observations)
-20
-10
0
10
20
30
40
0 5 10 15 20 25 30
Equation for returnE
quat
ion
for v
olum
e
7
DEPARTMENT OF ECONOMICS AND PUBLIC FINANCE “G. PRATO”
UNIVERSITY OF TORINO Corso Unione Sovietica 218 bis - 10134 Torino (ITALY)