INSTITUTIONAL BOTTLENECKS OF AGRICULTURAL SECTOR DEVELOPMENT: THE CASE OF RESEARCH AND EXTENSION PROVISION IN GHANA by Samuel Asuming-Brempong 1 Daniel B. Sarpong Felix Asante 1 The authors are Senior Lecturers at the Department of Agricultural Economics and Agribusiness, and a Research Fellow at the Institute of Statistical, Social and Economic Research (ISSER), both at the University of Ghana, Legon, Accra. Funding for the research has been provided by the OECD Development Centre, Paris, France.
Transcript
INSTITUTIONAL BOTTLENECKS OF AGRICULTURAL SECTOR DEVELOPMENT: THE CASE OF RESEARCH
AND EXTENSION PROVISION IN GHANA
by
Samuel Asuming-Brempong1 Daniel B. Sarpong
Felix Asante
1 The authors are Senior Lecturers at the Department of Agricultural Economics and Agribusiness, and a Research Fellow at the Institute of Statistical, Social and Economic Research (ISSER), both at the University of Ghana, Legon, Accra. Funding for the research has been provided by the OECD Development Centre, Paris, France.
2
Abstract The study of the institutional bottlenecks in respect of research and extension provision for agriculture in Ghana is motivated by the interest in trying to ascertain what impact agricultural research and extension has had on growth and productivity in the agricultural sector in Ghana within the context of the decentralisation policy. The main objective of the study therefore is to examine the level of awareness of extension officials and agents of government policies that relate to extension delivery, how such knowledge affects performance, and to what extent the expectations of the beneficiaries of extension services are fulfilled. Specifically, the study focuses, among others, on whether different layers of governance within the research and extension institution (Directors and frontline staff within a directorate and across directorates) comply and perform differently. The study shows that even though most of the personnel at the Metropolitan, Municipal and district levels know or have heard of the decentralization policy (Local Government Act, Act 462), implementation is however a problem. Knowledge and focus of the policy is high among the MoFA Directors, whilst knowledge and focus of the policy decreases as one moves down towards the district level among the frontline staff. Whilst Directors at the district level indicate the transfer of responsibility at the district level is happening, those in the metropolitan and municipal levels think it is partly happening. For AEAs, the transfer is relatively not happening. Whilst Directors and AEAs perceive that their information dissemination has impacted positively on farmer yields, actual crop yields for the Metropolitan, Municipal and Districts covered in the sample shows that there are wide growth rate swings in area cultivated and yield from year to year with certain districts recording declining growth rates each year. Across the locations, output growths in the cereals are relatively better than growth rates under the roots and tubers. The general observations of actual yield performance are that there is no systematic growth trend pattern in crop output characteristics. The observed perceptions on farmer cultural practices as a result of research and extension impacts are mixed. Farmer beneficiaries are almost equally divided on the observed impact of research and extension on their soil conservation practices but indicate positive changes in their cultural practices in the burning of bush/forests. Again, farmer beneficiaries see MoFA’s performance on input supply on crop and animal farming as average to bad. This is perhaps understandable since the MoFA as an institution is not directly involved in input supply to farmer beneficiaries. Despite the low ratings on input supply delivery of the institutional system, farmer beneficiary assessment of the delivery quality of field staff is good.
3
These empirical results tend to imply that compliance with the policy of decentralisation is less than perfect across and within directorates and has impacted differently on agricultural performance and outcomes. Indeed, the national and regional MoFA administration still dictates the content of job schedules at the district levels. There are also issues of conceptual differences in the interpretation of the policy. While the first is more of de-concentration – that is opening up offices in all the districts, the second takes the form of the establishment of centralized public services parallel to the local government service but whose staffs are essentially in the service of the local governments (District Assemblies). In order to remedy the key bottlenecks that constrain the effectiveness of the agricultural research and extension processes in Ghana, various aspects of the structure need to be reviewed and reorganized. These include: (a) co-ordination of actors and building linkages, (b) addressing manpower issues, (c) strengthening the collaboration among the various directorates within and outside the ministry, (d) the existence of a more purposeful research and extension linkages, and (e) the creation of more incentives to reward hard working staff, particularly at the community level.
4
1 Introduction and Motivation 1.1 Introduction The Ghanaian economy experienced a real Gross Domestic Product (GDP) growth rate of between 3.3% and 4.7% over the decade, 1993-2002 (See Table 1). This growth rate increased in the subsequent years to 5.2% in 2003, 5.8% in 2004, and an estimated 5.8% in 2005 (Ghana Budget Statements, January and November 2005). Table 1 GDP, Agriculture and other Sectoral Growth Rates, 1998-2005
Source: Budget Statement and Economic Policy of the Government of Ghana (Annual Series) *Provisional The positive performance of the economy has been led by improvements in domestic production and in the export sector. The major export commodities of the Ghanaian economy are cocoa, timber and gold, and together accounted for US$1.3 billion (or 64.7%) and 1.8 billion (or 78.8%) of total export revenues in 2002 and 2003, respectively. Non-traditional exports (horticultural products, handicrafts, textiles, processed fish, etc) amounted to US$490.1 million in 2003, down from US$728.7 million in 2002 due to declining exports of aluminium products as the Volta Aluminium Company (VALCO) remained closed (MoFE, 2004). The country joined the Heavily Indebted Poor Country (HIPC) group in 2002 (i.e. it reached the decision point in February 2002 and completion point in July 2004), and this has improved Ghana’s external debt profile significantly with debt service savings averaging US $170 million annually.
In 2005 headline inflation rate declined continually from April, except in September, that recorded a marginal increase from 14.7 per cent to 14.9 percent as a result of petroleum price realignment. The growth of the economy has been broad-based in the recent past, with positive contributions from all the three broad sectors, namely Agriculture, Industry, and Services.
5
The total population stood at more than 20 million in 2004, and has a growth rate of 2.7% per annum. Nearly 60% of the population live in rural areas. It is estimated that about 2.74 million households operate a farm or keep livestock. The total labour force in the same year was 8.3 million and agriculture accounted for 4.2 million (50.6%). About 90% of farm holdings are less than 2 hectares in size. Ghana’s land area is in excess of 23.8 million hectares, with a coastline of some 550 kilometres long. The geographical location is demarcated by Latitude 4o 44’N and 11o 11’N and Longitude 3o 11’W and 1o 11’E. There are 5 main agro-ecological zones defined on the basis of climate (particularly rainfall), which also reflects the natural vegetation and influenced by the soils. These are Rain Forest, Deciduous Forest, Transitional Zone, Coastal Savannah and Northern Savannah (Guinea and Sudan Savannah). Table 2 provides a summary of the agricultural land use in Ghana.
Table 2 Land Use in Ghana (Specific to Agriculture) Hectares %
Total Land Area (T.L.A.) Agric. Land Area (A.L.A.) Area under cultivation (2004) Total area under irrigation (2004) Area under inland waters Others (forest reserves, savannah woodland, etc)
Sources: Survey Dep’t, MOFA, Accra. Note: Percentages will not add up to 100, because area under cultivation is part of agricultural land area, while area under irrigation is part of area under cultivation. Ghana’s economy, however, is basically agrarian due to the dominance of the agricultural sector. Table 3 describes the contributions of the various sectors to GDP. On the average the agriculture sector contributes about 40% to GDP annually.
Table 3 Contribution to GDP by Sector, 1998-2005 at Constant 1993 Prices (%)*
Figure 1 also presents a summary of the performance of the agricultural sector over the last six years from 2000 to 2005.
Figure 1 Growth Performance of the Agricultural Sector, 2000-2005
2.1% 4.0% 4.4%
6.1% 7.5%
6.5%
0.0%1.0%2.0%3.0%4.0%5.0%6.0%7.0%8.0%
2000 2001 2002 2003 2004 2005Y ears
Source: Budget Statement and Economic Policy of the Government of Ghana (Annual Series). The agricultural sector contribution to GDP, export earnings, and employment of the country’s labour force, grew at the rate of 7.5% in 2004, but declined to 6.5% in 2005 due to a significant decline in the growth of the cocoa sub-sector between the two periods. Growth in the cocoa sub-sector (including marketing) was estimated at 13.2% in 2005, which was far below its record performance of 29.9% in 2004 (See Figure 2). Growth in the Forestry and Logging sub-sector in 2005 was also estimated at 5.6% compared to its performance of 5.8% in 2004, while the Fisheries sub-sector grew at 3.6% and 3.5% in 2005 and 2004, respectively. The average contributions to agricultural GDP from the various sub-sectors were 64% from crops (other than cocoa), 13% from cocoa, 7% from livestock, 5% from fisheries, and 11% from forestry. The performance of the agricultural sector, which over the years has driven the entire Ghanaian economy because of its size, has been determined to a large extent by the kind of institutional arrangements that have directed the research and extension activities of the sector. The declines the sector experienced during the late 1970s and early 1980s, and subsequent revival of the sector under the Economic Recovery Program (ERP) and related Structural Adjustment Program (SAP) of the 1980s both resulted from the kind of institutional arrangements that influenced research and extension activities in the sector. It is therefore imperative that the institutional context of the agricultural sector is examined to address any bottlenecks that persist, and to facilitate growth.
7
Figure 2 Growth Performance of Agricultural Sub-Sectors
-5
0
5
10
15
20
25
30
35
2000 2001 2002 2003 2004 2005
Ye a r scrops/llivestock cocoa forestry fishries
Source: Ministry of Food and Agriculture (MOFA). 1.2 Emerging issues Despite the positive growth experienced by the agricultural sector since the mid 1980s, bottlenecks that inhibit agricultural productivity remain. Average yields have remained stagnant. Generally increases in agricultural production have been achieved primarily by farmers using extensive methods (increased land area and manual labour) and only secondarily by intensive farming methods (seeds, fertilizer, mechanization, etc.). The majority of agricultural producers in Ghana still use the “cutlass and hoe” approach in crop production. Agriculture is predominantly rain-fed, and practiced on a smallholder basis on family–operated farms. Fertilizer usage for the whole country has averaged about 34,000 metric tones per annum for the last ten years, and it is one of the lowest in Africa. Estimates indicate that average yields of most major crops are less than 50% of achievable yields. Technological change has been very slow and minimal. The slow growth of agriculture is therefore a combination of several factors that reduce farmers’ incentives to invest and produce. These include inappropriate policies, lack of technological change and poor basic infrastructure, and are ascribed to institutional bottlenecks and ineffectiveness of research and extension linkages and the slow pace of the decentralisation policy. To what extent therefore has the process of decentralization in the agricultural sector facilitated or inhibited growth in the sector?
8
Before 1987, agricultural extension was fragmented among various departments within MoFA, and therefore MoFA established the Department of Agricultural Extension Services (DAES) to bring all splinter MOFA extension services under one umbrella. Agriculture research, however, is primarily carried out mainly by eight semi-autonomous institutes under the Council for Scientific and Industrial research (CSIR). However, cocoa research is carried out by the Cocoa Research Institute of Ghana (CRIG). The 1992 constitution made provision for the decentralization of government machinery. The decentralization of MOFA started in 1997 (based on a ministerial directive) and was meant to empower the districts to plan and implement their own agricultural extension activities and manage their resources within the framework of the national decentralization policy. Some of the problems associated with the decentralization of MOFA include (1) lack of financial decentralization, (2) inadequate training in extension management coupled with lack of full complement of staff, and (3) undefined roles and responsibilities of some of the staff at the national, regional and district levels. Given that the Government of Ghana’s policy, through the GPRS II, is a strategic focus on ‘accelerated growth as a means of wealth creation, poverty reduction and equitable social development’, and given that agriculture is a dominant sector of the economy, the performance of the agricultural sector will play a crucial role in providing the necessary inputs for a vibrant agro-processing industrial sector in the medium to long term. This puts issues of the agricultural sector, such as research and extension linkages, and the effectiveness of decentralization in the sector at the core of any progress that can be made in the growth and development of the economy. The main objective of the study therefore is to examine, within the decentralisation policy, the level of awareness of extension officials and agents of government policies that relate to extension delivery, how such knowledge affects performance, and to what extent the expectations of the beneficiaries of extension services are fulfilled. The study of the institutional bottlenecks in respect of research and extension provision for agriculture in Ghana is motivated by the interest in trying to ascertain what impact agricultural research and extension has had on growth and productivity in the agricultural sector in Ghana within the decentralisation policy. 1.3 Structure of the report The report is structured into five sections. Following the introduction and the emerging issues of section 1, the analytical framework of the study is presented in section 2. Section 3 presents an overview of Ghana’s Agricultural Research and Extension system, and section 4 is an assessment of the performance of the decentralized research and extension activities. Based on the assessment made, Section 5 suggests solutions to remedying key bottlenecks identified, and Section 6 concludes the study.
9
2 Analytical Framework Agricultural Research and Extension provision in Ghana falls broadly within the ambit of the Council for Scientific and Industrial Research (CSIR) and the Ministry of Food and Agriculture (MoFA). The basic functioning of these organizations (CSIR and MOFA) as within the institutional scope, to Lin and Nugent (1995), are to economize (reducing transaction costs, for example of extending research output between agents) and redistribute (fairness, causing resources to be re-distributed for the sake of attaining a higher level of equality rather than efficiency) their provision of these services. The outcome of organizations such as the CSIR and MoFA, however, depends on the quality of the institutions responsible for them. Institutional development, in the sense of increasing the ability of organizations to set clear development objectives and work effectively with their human, financial and other resource constraints towards meeting these objectives, is difficult for many developing countries including Ghana. Organizations in agricultural research and extension in Ghana typically suffers from serious shortages of skilled and experienced staff, an excessive number of untrained staff, overloaded services and poor facilities, inadequate wages and salaries and a counter productive policy environment (often conflicting requirements and inadequate authority). These greatly affect institutional performance. Institutions, when they are inefficient, increase transaction costs. The MoFA, as an organization created to reduce the transaction costs of delivering research outputs through effective extension methods to farmers, lends itself to analyzing the institutional bottlenecks it faces with a focus on research and extension provision for agricultural sector development in Ghana. Within this analytical framework, and given the link between institutions and organizational performance, the following constitutes the broad framework for analyzing the quality of research and extension performance in Ghana (see Table 3):
• Institutional characteristics of research and extension: levels of decentralization and governance: structure (finance, accountability), capacity (technical ability)
• Compliance: dissemination techniques (participation, user assessment), motivation and incentives of agents
• Performance: outputs of the research and extension system : technology opportunity set (content, quality of service delivery)
• Household or Farm outcomes: technology choice/adoption, change in practices, building of a knowledge base
• Aggregate Outcomes: Yields, composition of output, distributional effects, sustainability.
The relevant components of the analytical framework that were applied in this study included a review of the institutional characteristics of research and extension (levels of decentralization and governance structure as well as the technical ability of these
10
institutions); an analysis of the compliance process (such as the techniques for disseminating relevant extension messages and the incentive systems in place for motivating extension agents); an assessment of the performance of the research and extension system (in terms of the technology packages available and the mode of delivery of the extension message); and an assessment of the household or farm outcomes (based on the changes that have occurred in the practices of farm households in response to the extension messages). However, aggregate outcome test of research and extension activities was not possible due mainly to lack of data, particularly information for a before/after or with/without analysis. Various stakeholders at both the national and local levels from various units under MoFA, as well as some selected farming communities shall were interviewed. The purpose was to document the experiences of all stakeholders during the period of implementing the unified extension system and the decentralization of MoFA. For example, the major difficulties encountered during the implementation process, and the important factors that account for such constraints that were experienced were explored. Also, problems associated with technology development and dissemination and how these have affected agricultural production in the context of the unified extension system and decentralization were addressed. In terms of the specific issue of the decentralization of MoFA, stakeholder interviews also were conducted to document the experiences of both national and local level staff during the implementation process. An attempt was made to identify current problems at the various levels as they are affected by policy, such as national, district and household/farm levels; and suggestions made to mitigate these constraints. Also, an overview of the stages of the decentralization process as has been carried out in MoFA, and the way forward in addressing various fall-outs from the implementation of decentralization provided.
Tab
le 3
Mea
suri
ng th
e Q
ualit
y of
Inst
itutio
ns: A
Fra
mew
ork
for
Ana
lysi
s
I In
stitu
tiona
l C
hara
cter
istic
s of
Res
earc
h an
d E
xten
sion
-L
evel
s of
Dec
entra
lizat
ion
and
Gov
erna
nce
stru
ctur
e:
-Fin
ance
-A
ccou
ntab
ility
C
apac
ity:
Tech
nica
l ab
ility
II
Com
plia
nce
Dis
sem
inat
ion
Tech
niqu
es
(Par
ticip
atio
n,
Use
r as
sess
men
t, M
otiv
atio
n of
ag
ents
and
In
cent
ives
of
Age
nts)
III
Perf
orm
ance
–
Out
puts
of
Res
earc
h an
d E
xten
sion
Sy
stem
Te
chno
logy
O
ppor
tuni
ty se
t
- Con
tent
- Q
ualit
y of
Se
rvic
e D
eliv
ery
IV
Hou
seho
ld o
r Fa
rm
Out
com
es
Tech
nolo
gy
choi
ce/a
dopt
ion
Cha
nges
in
prac
tices
B
uild
ing
of a
K
now
ledg
e B
ase
V
Agg
rega
te
Out
com
es
Yie
lds
Com
posi
tion
of O
utpu
t D
istri
butio
nal
Effe
cts
Sust
aina
bilit
y
3 Ghana’s Agricultural Research and Extension: An Overview
3.1 Agricultural Research Most of the agricultural research done in Ghana is carried out within several research institutes and stations under the umbrella of the Council for Scientific and Industrial Research (CSIR), a body reporting to the Ministry of Environment, Science and Technology (MEST). Agriculture research is carried out by eight semi-autonomous institutes with specialization in crops; soils, animals, oil palm, fisheries and food (see Table 4). All these institutes are affiliated to the CSIR. The Crop Research Institute for example, is in charge of food crop research and has two major stations; one in the forest region (Kumasi) and the other in the Savanna region (Nyankpala). Some technical departments of the Ministry of Food and Agriculture (MOFA) also undertake some adaptive trials on crops, livestock and fisheries with or without the collaboration of the research institutes of CSIR. Cocoa research is however carried out by the Cocoa Research Institute of Ghana (CRIG) under the management of Ghana Cocoa Board (COCOBOD). The universities and some private agro-industrial companies are also active in agricultural research. An important share of the financial resources for agricultural research is provided by external donors. Currently, the Canadian International Development Agency grain project and the Agricultural Services Sub-sector Investment Programme (AgSSIP) by the World Bank are the two major sources of research finance (cocoa sub-sector excluded). The objective of agriculture research (National Science and Technology Policy) is to strengthen the development, application and transfer of agro-based technologies, both soft and hard, to support sustainable agricultural production. The strategies to achieve this objective are:
(i) sustain and improve agriculture-related research competence of the National Agricultural Research System (NARS) to raise the productivity of crops, livestock, fish resources, production tools and implements with due regard being taken of the impact on the environment. Special preference will be given to agriculture in dry and arid regions of the country;
(ii) promote the research and application of new technologies including biotechnology, genetic engineering, etc., which hold potential for increasing productivity;
(iii) enhance research on pre-harvest and post-harvest losses in agricultural production;
(iv) promote the development of food preservation and processing, through participatory technology development; and
(v) strengthen the production of non-traditional export commodities to enhance the foreign exchange earning power of the country.
13
Table 4 Agricultural Research Institutions in Ghana Research Organizations Cocoa Research Institute of Ghana (CRIG) Council for Scientific and Industrial Research (CSIR)
- Water Research Institute (WRI) - Soil Research Institute (SRI) - Savanna Agricultural Research Institute (SARI) - Plant Genetic Resources Centre (PGRC) - Oil Palm Research Institute (OPRI) - Forestry Research Institute of Ghana (FORIG) - Food Research Institute (FRI) - Crops Research Institute (CRI) - Animal Research Institute (ARI)
Universities Kwame Nkrumah University of Science and Technology (KNUST) University of Cape Coast (UCC) University of Development Studies (UDS) University of Ghana (UG)
- Institute of Statistical, Social and Economic Research (ISSER) - Faculty of Agriculture
Other Ministry of Food and Agriculture 3.2 Agricultural Extension 3.2.1 Historical Perspective Agricultural extension activities were initiated in Ghana in the nineteenth century by the early missionaries and foreign owned companies involved in the production of export crops such as coffee, cocoa and rubber. After independence, Ghana tried various approaches including extension under the farmers’ co-operative movement and several donor-assisted projects. The United Ghana Farmers’ Co-operative Council (UGFCC) provided extension services in the 1960s. These services were supplemented at the time by the “Focus and Concentrate” project of the United States Agency for International Development (USAID). Under both initiatives, extension agents advised and supplied inputs to farmers. In the 1970s and 1980s, all the departments of the Ministry of Food and Agriculture undertook separate extension services. Agricultural extension was therefore fragmented among the various departments within the ministry. In 1987 however, MOFA established the Department of Agricultural Extension Services (DAES) to bring all splinter MOFA extension services under one umbrella. The DAES used a strategy based on the Training and Visit (T&V) extension system which involves regular training and field visits. This system also saw the withdrawal of MOFA from the procurement and distribution of agricultural inputs, including credit.
14
This extension initiative was supported with World Bank funding through the National Agricultural Extension Project (NAEP) which was implemented between 1992 and 1999. This project was set up and implemented to help (i) improve efficiency in the management and delivery of extension services, (ii) improve the relevance of technologies available to farmers, and (iii) strengthen the technical departments of MOFA. 3.2.2 Unified Extension System In August 1998, the government unified the extension services of MOFA and COCOBOD2 for the purpose of providing farmers with more cost-effective agricultural extension services. With the merger, MOFA took ministerial responsibility for cocoa extension. The challenge for MOFA is to (i) develop the capacity for cocoa extension and (ii) collaborate with the relevant agencies and private sector organizations to support the cocoa industry. As part of the unified agricultural extension strategy, Agricultural Extension Agents (AEAs) are trained once a month by Subject Matter Specialists (SMSs) drawn from the subject matter or technical departments of MOFA. The AEAs visit groups of contact farmers on a fortnightly basis. Each contact farmer group has a minimum of 10 farmers and each AEA interacts with between 16 and 24 of such groups in a farming season. Interaction with farmers is done by way of farm demonstrations and discussions with farmer groups. 3.3 The Role of Decentralization Ghana inherited a highly centralized system of government from the colonial administration. The history of decentralization in Ghana is traced back by Ayee (2000) to the introduction of indirect rule by the British colonial authorities in 1878, lasting until 1951. During this period the colonial administration ruled indirectly through the native political institution (i.e. the chiefs), by constituting the chief and elders in a given district as the local authority, with powers “to establish treasuries, appoint staff and perform local government functions” (Nkrumah, 2000). In the post-independence period from 1957 onwards, local government was generally weak and subject to the centralisation of power that was typical of the post-colonial state in Africa (Tordoff, 1997). Attempts at decentralisation reforms were introduced at different times, for instance in 1974 under the military regime of Lt. Col. Acheampong, generally characterised by de-concentration, and aimed at strengthening central government control at the local level (Nkrumah 2000). Ayee (2000) perceives a key feature of local governance in the pre-1988 period as a dual hierarchical structure in which central and local government institutions “operated in parallel”, but with encroachment at times by better-resourced central government on the 2 In 1973, the Cocoa Production Division of the Ministry of Agriculture was transferred to a newly created Ministry of Cocoa Affairs. It was re-named Cocoa Services Division (CSD) and placed directly under COCOBOD which manages all organizations dealing with cocoa. The CSD gave technical advice to cocoa and coffee farmers in addition to the production and distribution of cocoa and coffee planting materials.
15
roles and responsibilities of an under-resourced local government. The 1992 constitution therefore made provision for the decentralization of the government machinery. The aim was to (i) create a conducive environment within which people could participate in their own development, and (ii) encourage self-help, local responsibility and ownership of development programmes. The decentralization of MOFA, which started in 1997 based on a ministerial directive, was meant to empower the districts to plan and implement their own agricultural extension activities and manage their resources within the framework of the national policy. It also sought to put in place a more conducive institutional structure to enable MOFA respond more effectively to the contextual needs of farmers and the agricultural industry. This is premised on the understanding that farmers’ problems can be better understood and solved at the level where they actually occur. The legal, organisational and administrative framework for decentralised development and governance in Ghana is provided by the ‘decentralisation Law’ – the Local Government Act, 1993 (Act 462). This Act itself was an update of PNDC Law 207 of 1988 which laid the basis for the entire decentralisation programme. In addition to the Local Government Act, a number of legislative acts also govern the decentralisation programme in Ghana. These pieces of legislation include: Chapter 6 of the 1992 Constitution of Ghana which deals with the ‘Directive Principles of State Policy’; and Chapter 20, on ‘Decentralisation and Local Government’; National Development Planning Commission Act (Act 479 of 1994); National Development Planning (Systems) Act (Act 480 of 1994); Civil Service Law 1993 (PNDCL 327); Local Government (Urban, Zonal, Town Councils and Unit Committees) (Establishment) Instrument 1993, L.I. 1589; District Assemblies Common Fund Act 1993 (Act 455); Local Government (District Tender Boards) (Establishment) Regulations, 1995, L.I. 1606; and L.Is establishing the Metropolitan, Municipal, and District Assemblies. All these pieces of enactment were to facilitate the implementation of decentralisation. The policy sought to transfer responsibilities, including administration and the provision of services, to the District Assemblies while at the regional and the national levels, attention was focused on policy planning, co-ordination, technical backstopping, monitoring and evaluation. 3.4 Structure of Ghana’s Local Governance and its link to Agriculture (MOFA) The local government system in Ghana is made up of a Regional Co-ordinating Council and a four-tier Metropolitan and three-tier Municipal District Assemblies structure (Figure 4). A total of 138 District Assemblies, of which 28 are new, have been created under the local governance system.
16
Figure 4 Structure of the Local Governance System in Ghana
Regional Co-ordinating Council
Metropolitan Municipal District
Sub-Metropolitan District Council
Town Councils Zonal Councils Urban/Town/Area Councils
Unit Committees District Assemblies are either Metropolitan (one mega-city with population over 250,000), Municipal (one-town assembly with a population of over 95,000), or District (several towns and villages grouped with population of 75,000 and over). Unit committees form the base structure of the local governance system. A unit is normally a settlement or group of settlements with a population of between 500 and 1,000 in the rural areas, and a higher population of 1,500 for urban areas. The Regional Coordinating Council (RCC) consists of the Regional Minister as Chairman, his Deputy, the Presiding Member of each District Assembly, the District Chief Executive of each district in the region, two chiefs from the Regional House of Chiefs, and the regional heads of the decentralized ministries, including Agriculture, without voting rights. Figure 5 shows the organogram of the decentralized MOFA and its link to the District Assembly.
17
Figure 5 Organogram of Decentralized MOFA 3.5 Agriculture Research–Extension Linkage In 1991, the World Bank supported the National Agricultural Research Project (NARP) to (i) improve upon the institutional arrangements that govern agricultural research; (ii) ensure that research priorities reflect national agricultural development objectives, and (iii) ensure that research is responsive to farmers’ needs. Through the formation of the Research Extension Linkage Committees (RELCs) under the National Agricultural Extension Project (NAEP) and NARP, a close working relationship was forged between research and extension. The RELCs are made up of researchers, Regional Directors of Agriculture (RDAs), Subject Matter Specialists
District Assembly
Executive Committee
District Chief Executive
Dist Coordinating Director
Regional Director of Agriculture
District Director of Agriculture
Finance and Administration
Information Systems and Database
Projects, Programmes and Budgets
District Development Officer
Agricultural Extension Agent
18
(SMSs), Regional Development Officers (RDOs), farmers’ representatives, NGOs and input suppliers. The responsibility of these RELCs is to assess the adoption of technologies by farmers, review research and extension programmes, assess their relevance to agricultural development in the various zones and make appropriate recommendations. Other mechanisms have been put in place to ensure effective research and extension linkage. For example, there are
(i) technical review meetings which are attended by extension, research and technical departments of MOFA. At these meetings, SMSs are introduced to new technologies, specific technologies are evaluated based on field experiences and farmer’s problems are discussed and solutions sought for them; and
(ii) various stages of technological development and delivery exist in which researchers, SMSs, extension staff and farmers are involved. These include adaptive trials on the MOFA zonal research stations, on-farm trials carried out by SMSs and extension staff in collaboration with farmers and small plot demonstrations carried out on specific technologies by farmers and AEAs.
3.6 The Current Extension Policy In June 2003 a new agricultural extension policy was implemented in line with the government’s new objectives of agricultural extension becoming more focused on the following:
(i) ensuring equity in the distribution of the benefits from development; and (ii) improving rural livelihood; and reducing poverty especially among rural
women, the youth and the physically challenged. Agricultural extension delivery is still constrained by a number of factors such as high cost of agricultural inputs, inadequate credit to farmers, poor rainfall distribution, inadequate processing and marketing facilities and high incidence of pests and diseases, among others. There is thus the need for agricultural extension to develop strategies to support farmers to respond to these challenges. The vision for the future of agricultural extension services in the short to medium term (2-10 years) is an efficient and demand-driven extension service in a decentralized system established through partnership between the government and the private sector. It is envisaged that clients (farmers and other users of services) would participate in extension programme formulation, implementation, monitoring and evaluation to ensure that their needs are met. The extension delivery system will not only be concerned with technological issues, but will also deal with other issues that affect the general livelihood of the farming communities such as marketing, health (HIV/AIDS, guinea worm, etc.), gender balance in development and sustainable natural resource management. The new extension policy is based on nine objectives. The objectives for achieving the policy in the short to medium term are:
19
(i) MOFA will promote farmer-driven extension and research to ensure that services provided are relevant to farmers’ needs;
(ii) MOFA will empower farmers through the formation and development of Farmer Based Organizations (FBOs) including marketing and agro-processing associations and co-operatives in collaboration with the Department of Co-operatives;
(iii) MOFA will promote the best agricultural practices; (iv) MOFA will improve on the efficiency and cost-effectiveness of publicly
funded extension services; (v) MOFA will broaden extension services delivery; (vi) MOFA will ensure that appropriate institutional structures are developed at all
implementation levels to operate the new agricultural extension policy. MOFA will therefore make more operational the roles and responsibilities of staff at the various levels (national, regional and districts) as defined in the decentralization policy;
(vii) MOFA will implement an effective monitoring and evaluation system for agricultural extension services;
(viii) MOFA will undertake a broad based human resource development programme by ensuring continuous capacity building of agricultural development workers; and
(ix) The national agricultural extension system will respond to the emerging issues of HIV/AIDS pandemic, environmental degradation and poverty reduction. Extension efforts will also focus on the areas of gender, equity and client empowerment as they relate to sustainable agricultural production.
20
4 Assessing the performance of the decentralized research and extension activities
This subsection presents an assessment of the performance of the decentralised research and extension activities, and is organised around the methodology of the empirical assessment focusing on the selection of the different agro-ecological zones and the production systems in these zones, among others. The compliance and performance tests follow. The outcomes and the summary conclude this section.
4.1 Methodology
Assessing the performance of the decentralized research and extension activities of MoFA proceeded in the following sequence: 1) Sampling: Ghana’s agriculture is traditionally divided into agro-ecological zones: Northern Savanna (Sudan and Guinea), Transitional, Forest and Coastal Savanna. The agro-ecological zones exhibit different production and farming practices. For example, roots and tubers such as cassava and cocoyam are predominant in the forest zones, whilst tubers such as yams and cereals are predominant in the transitional and savanna zones. Following this agro-ecological zoning, and within each agro-ecological zone, three-tier hierarchies of MoFA centers were developed. These are Metropolitan, Municipal and District level MoFA activities. The Metropolitan and Municipal Districts are urban locations whilst the District is more rural. It is assumed that as one move away from the centre of political administration, compliance and other performance of the institution declines and similarly, compliance and performance within the layer in the unit (directorate) will also decline from the Director to the frontline staff (AEA). Table 5 presents the locations where the sampling was taken in assessing the performance.
Table 5 Selected MoFA locations for the Performance Assessment Agro-Ecological Zone
In Table 5 the northern savanna agro-ecological zone, for example, has Tamale Metropolitan, Bolgatanga Municipality and West Mamprusi District as the focus for the assessment of performance. Table 6 summarizes the caliber of personnel interviewed for the assessment in each of these locations.
21
Table 6 MoFA Staff and other stakeholders interviewed in the selected locations for the Performance Assessment
• Two (2) Agricultural Extension Agents (AEAs) in the Metropolitan
• Four (4) farmers, two (2) each under the two AEAs.
• Municipal Director of MoFA
• Two (2) Agricultural Extension Agents (AEAs) in the Municipality
• Four (4) farmers, two (2) each under the two AEAs.
• District Director of MoFA
• Two (2) Agricultural Extension Agents (AEAs) in the District
• Four (4) farmers, two (2) each under the two AEAs.
Actual number of Directors interviewed: 10; AEAs, 16 and Farmers, 33. As can be seen in Table 6, for each hierarchy, the Director of the MoFA unit was interviewed. Then two of the hierarchy’s Agricultural Extension Agents (AEAs) were randomly selected and interviewed. Subsequently, four (4) farmers, two each under the selected AEAs were interviewed. In all a total of 26 MoFA staff (Directors and AEAs) were interviewed across the three demarcated agro-ecological zones. In addition, thirty-three (33) farmers across the three demarcated agro-zones were interviewed for a total of fifty-nine (59) stakeholders. 2) Survey development: The study identified and reviewed (after a pre-test survey) topical questions related to the MoFA as an institution (Metropolitan/Municipal/District Directors, Agricultural Extension Agents and Farmers) to help assess the performance and have a better understanding of the constraints that face MoFA. After discussing the questions in terms of comprehensiveness and effectiveness in addressing the issues at stake, the study used a combination of standardized questionnaires (semi-structured interviews including qualitative and quantitative questions) and focus group discussions/in-depth interviews to complete the task for analysis. Separate semi-structured questionnaires were developed for the Directors, AEAs and the farmers (See Appendix A). 4.2 Compliance
The issue of how well the functioning of the system corresponds to the intended functioning are analysed with respect to (a) MoFA officials (Directors and AEAs) level of knowledge of the Local Government Act 462 (Policy), (b) how the Policy, which seeks to transfer responsibilities including administration and the provision of services (extension messages, etc) to the District Assemblies, is being implemented, and (c) whether at the institutional levels, attention of the policy is focused on policy planning, coordination, technical backstopping, monitoring and evaluation. In addition, the analysis focused on officials as the analysis checks whether knowledge and the functioning of the policy as indicated by officials, differ from the centre (Municipality/District) to the periphery (District) and also within the same directorate. Table 7 summarizes the
22
responses of MoFA Directors and Agricultural Extension Agents (AEAs) as to the percentage who know of the Policy (Act 462).
Table 7 Percentages of Directors and AEA’s of MoFA in Metropolitan, Municipal and District Offices who know of the Policy (Act 462)
Metropolitan Municipal District Total YES NO YES NO YES NO YES NO AEA 50 50 75 25 37.5 62.5 50 50 Directors 100 0 100 0 80 20 90 10 TOTAL 66.7 33.3 85.7 14.3 53.8 46.2 65.4 34.6
Source: Survey data
Relative to the flow of information from the centre (Metropolitan/Municipal where the Regional Directors also function, and are urban centres) to the periphery (Districts, with more rural concentrations), one observes a phenomenon (see row values) where Directors and the AEAs in the metropolitan and municipal directorates relatively have a high knowledge of the Local Government Act 462 compared to those at the district level. For instance, from Table 7 for AEAs, clearly those who do not know of the policy increases as one moves down towards the district level. Similarly, whilst all the Directors in the survey in the Metropolitan/Municipal directorates know of the policy, at least one of the directors (20 percent) at the district level did not know of the policy. Within the same directorate (along a column in Table 7), knowledge of the policy declines more within the district directorate. It is however expected that, since the policy was to be implemented at the district and particularly AEA level, AEAs and other officials at the district level should have a high knowledge of the policy (Act 462).
Not knowing of the policy and its devolution of responsibilities could also differ in responses between the AEAs and their Directors across location and within directorates. As to whether the transfer of responsibilities including administration and the provision of services to the District Assemblies is happening, one observes a pattern that declines from the Metro/Municipal to the District, in terms of space and the administrative hierarchy (Table 8).
Table 8 Percentage of Directors and AEA’s of MoFA in Metropolitan, Municipal and District Offices who know of transfer of responsibility under the Policy (Act 462)
Metropolitan Municipal District Total YES NO Partly YES NO Partly YES NO Partly YES NO Partly AEA 0 75 25 50 0 50 43 57 0 33 47 20 Directors 0 0 100 33 0 67 40 0 60 30 0 70 TOTAL 0 50 50 43 0 57 42 33 25 32 28 40
Source: Survey data Whilst Directors at the district level indicate the transfer of responsibility at the district level is happening, most of those in the metropolitan and municipal levels think it is partly happening. For AEAs, the transfer is relatively not happening. This gives spatial
23
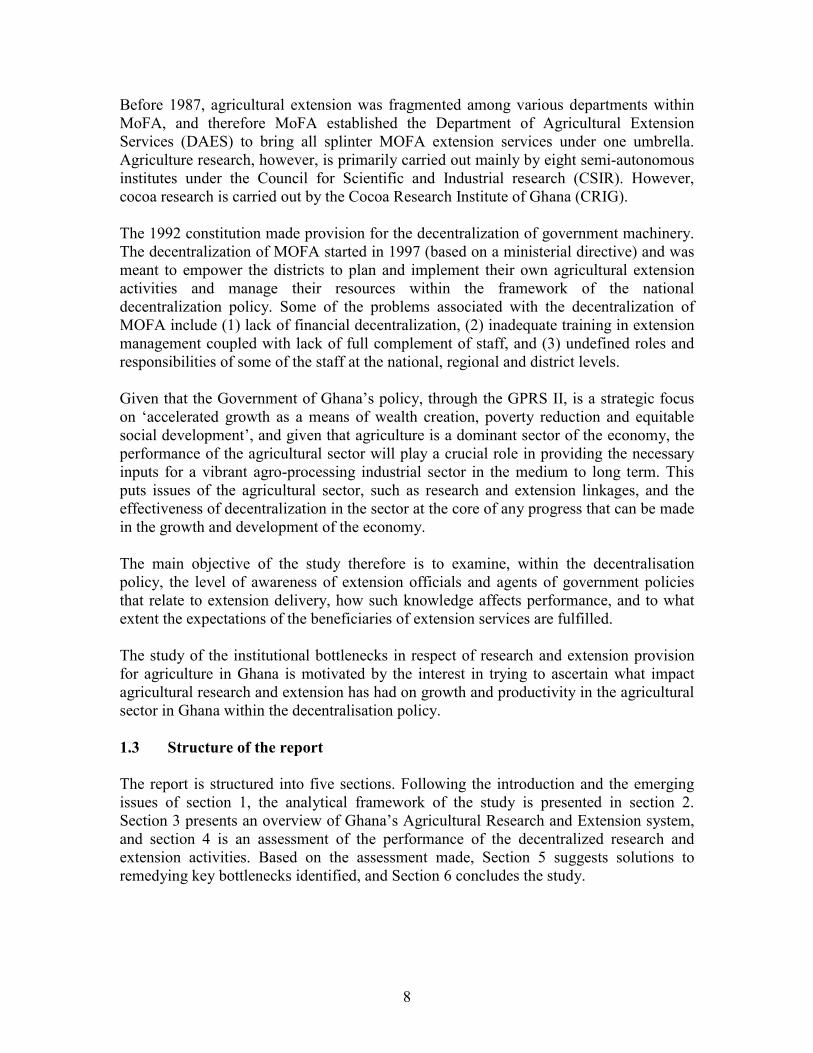
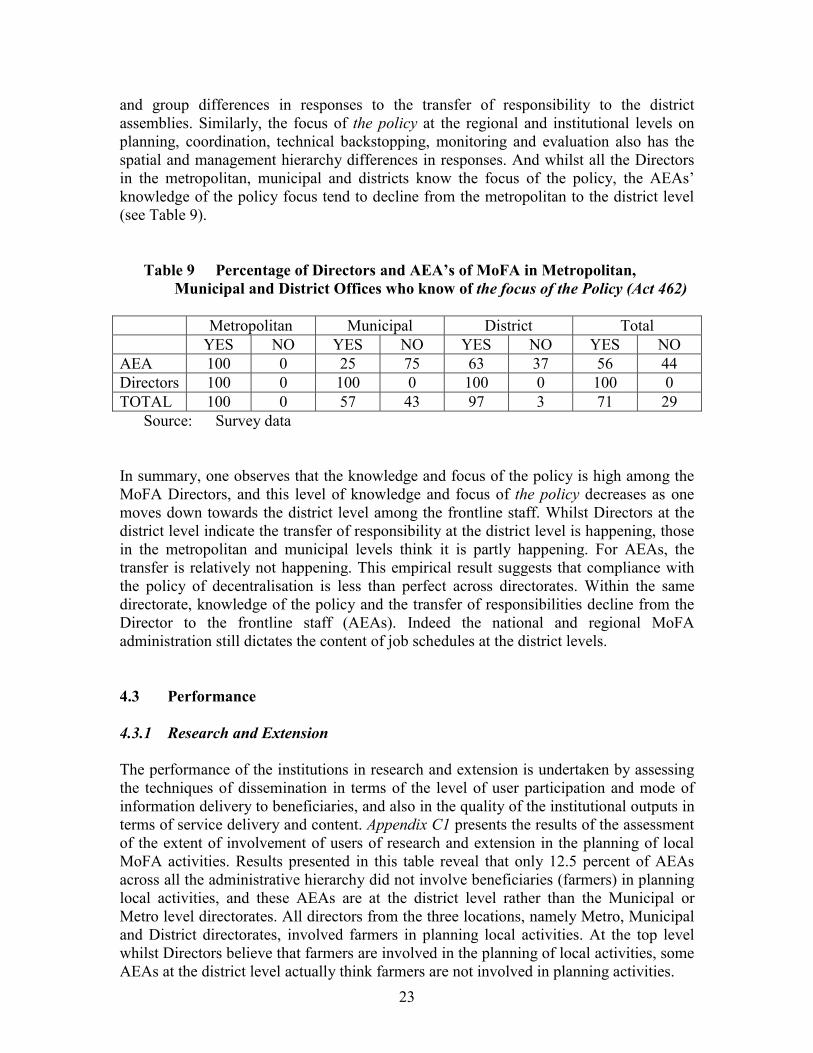
and group differences in responses to the transfer of responsibility to the district assemblies. Similarly, the focus of the policy at the regional and institutional levels on planning, coordination, technical backstopping, monitoring and evaluation also has the spatial and management hierarchy differences in responses. And whilst all the Directors in the metropolitan, municipal and districts know the focus of the policy, the AEAs’ knowledge of the policy focus tend to decline from the metropolitan to the district level (see Table 9).
Table 9 Percentage of Directors and AEA’s of MoFA in Metropolitan, Municipal and District Offices who know of the focus of the Policy (Act 462)
Metropolitan Municipal District Total YES NO YES NO YES NO YES NO AEA 100 0 25 75 63 37 56 44 Directors 100 0 100 0 100 0 100 0 TOTAL 100 0 57 43 97 3 71 29
Source: Survey data
In summary, one observes that the knowledge and focus of the policy is high among the MoFA Directors, and this level of knowledge and focus of the policy decreases as one moves down towards the district level among the frontline staff. Whilst Directors at the district level indicate the transfer of responsibility at the district level is happening, those in the metropolitan and municipal levels think it is partly happening. For AEAs, the transfer is relatively not happening. This empirical result suggests that compliance with the policy of decentralisation is less than perfect across directorates. Within the same directorate, knowledge of the policy and the transfer of responsibilities decline from the Director to the frontline staff (AEAs). Indeed the national and regional MoFA administration still dictates the content of job schedules at the district levels.
4.3 Performance
4.3.1 Research and Extension The performance of the institutions in research and extension is undertaken by assessing the techniques of dissemination in terms of the level of user participation and mode of information delivery to beneficiaries, and also in the quality of the institutional outputs in terms of service delivery and content. Appendix C1 presents the results of the assessment of the extent of involvement of users of research and extension in the planning of local MoFA activities. Results presented in this table reveal that only 12.5 percent of AEAs across all the administrative hierarchy did not involve beneficiaries (farmers) in planning local activities, and these AEAs are at the district level rather than the Municipal or Metro level directorates. All directors from the three locations, namely Metro, Municipal and District directorates, involved farmers in planning local activities. At the top level whilst Directors believe that farmers are involved in the planning of local activities, some AEAs at the district level actually think farmers are not involved in planning activities.
24
Of those respondents (Directors and AEAs) who involve beneficiaries in planning local activities, very few involved beneficiaries in needs assessment. The focus is more on drawing up local farm extension activities and priorities (Appendix C2). Officials (Directors and AEAs) in the Metro Directorates do not involve farmers in training programme schedules and needs assessment at all. The dissemination of information (technology) differs mainly across location of directorates (Appendix C3). The trend indicates that MoFA officials at the district level disseminated information on technology mostly through training and visitations (TV) whilst those in the urban areas (metro and municipal) disseminated information to farmers by combining TV and organising workshops and farmer field days.
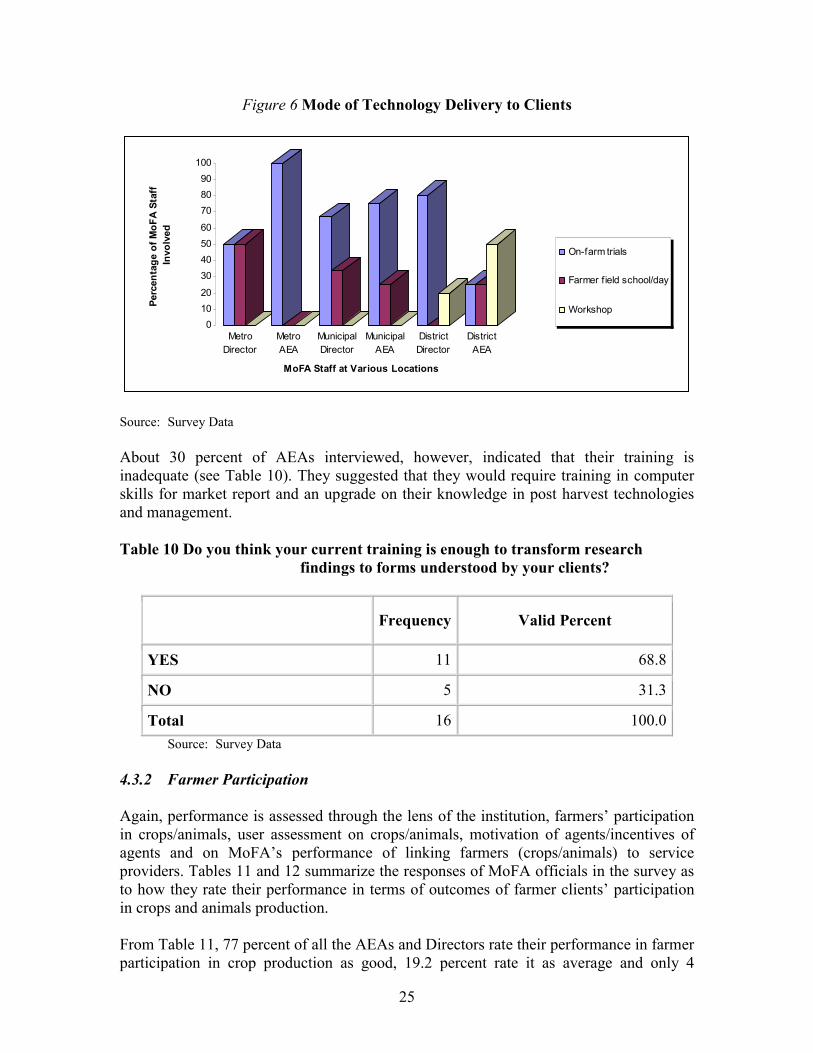
The type of technologies available and being used by the Metropolitan and District directorates were usually improved crop varieties and improved animal breeds (Appendix C4). This is evident from responses of both AEAs and Directors. AEAs in the municipal directorates gave other technologies being used as post harvest, non traditional animal rearing and soil fertility improvement. The technologies promoted are seen by the officials as good and easy to apply by beneficiaries. MoFA officials across all locations believed that the technologies they have introduced to the farmers are readily available and easy to use. Eighty (80) percent of all AEAs and Directors are of this view. Only 20 percent were of the view that the technologies are not readily available or easy to use. Such officials were mainly AEAs from the Municipal and District levels. The technologies are tailored, according to MoFA directorates, to address constraints of beneficiaries. These constraints are summarized in Appendix C5. The major constraint the technologies addressed includes food insecurity, post-harvest crop damage through insect attacks, low income levels, and high fertilizer cost. From Appendix C5, AEAs at the district levels indicated that the technologies of improved crop varieties and improved animal breeds promoted are to address food insecurity. All the Directors and AEAs indicated that the technologies promoted are sustainable and they cater for both male and female farmer clients except only one (in the metro directorate) which had only male clients. This technology was livestock (cattle) improvement programme and the AEAs involved believed that female farmers may not live up to expectation because of the rigorous nature of the work involved. Technology delivery by AEAs and Directors across locations is mainly through on-farm trials (62 percent), farmer field school/days (19 percent) and workshops (19 percent) (see Figure 6). AEAs and Directors in the metro directorates usually delivered technologies to farmers through on-farm trials. AEAs at the districts tended to deliver technologies to their clients through workshops (50 percent), On-farm Trials (25 percent) and through Farmer Field days (25 percent). As many as 90 percent of all Directors and AEAs think that the approach of technology delivery in the light of their institution’s objectives is good, and only 10 percent believed that their approach was average.
25
Figure 6 Mode of Technology Delivery to Clients
01020
30405060
708090
100Pe
rcen
tage
of M
oFA
Sta
ff
Invo
lved
MetroDirector
MetroAEA
MunicipalDirector
MunicipalAEA
DistrictDirector
DistrictAEA
MoFA Staff at Various Locations
On-farm trials
Farmer field school/day
Workshop
Source: Survey Data About 30 percent of AEAs interviewed, however, indicated that their training is inadequate (see Table 10). They suggested that they would require training in computer skills for market report and an upgrade on their knowledge in post harvest technologies and management.
Table 10 Do you think your current training is enough to transform research
findings to forms understood by your clients?
Frequency Valid Percent
YES 11 68.8
NO 5 31.3
Total 16 100.0 Source: Survey Data 4.3.2 Farmer Participation Again, performance is assessed through the lens of the institution, farmers’ participation in crops/animals, user assessment on crops/animals, motivation of agents/incentives of agents and on MoFA’s performance of linking farmers (crops/animals) to service providers. Tables 11 and 12 summarize the responses of MoFA officials in the survey as to how they rate their performance in terms of outcomes of farmer clients’ participation in crops and animals production. From Table 11, 77 percent of all the AEAs and Directors rate their performance in farmer participation in crop production as good, 19.2 percent rate it as average and only 4
26
percent rate it as bad. In MoFA’s performance concerning farmer participation in animal farming (Table 12), 54 percent of AEAs and Directors indicated that it was good, whilst 42.3 percent indicated it was average. Only 4 percent indicated farmer participation in animal production activities were bad. It appears farmer participation in crop activities are more intense than in animal activities.
Table 11 MoFA’s assessment of her performance in farmer participation concerning
crop farming
GOOD AVERAGE BAD
Total
Count 11 4 1 16 AEA
% 68.8% 25.0% 6.3% 100.0%
Count 9 1 10 What is your position
DIRECTOR % 90.0% 10.0% 100.0%
Count 20 5 1 26 Total
% 76.9% 19.2% 3.8% 100.0%
Source: Survey Data Table 12 MoFA’s assessment of her performance in farmer participation concerning
animal farming
GOOD AVERAGE BAD
Total
Count 7 8 1 16 AEA
% 43.8% 50.0% 6.3% 100.0%
Count 7 3 10 What is your position
DIRECTOR % 70.0% 30.0% 100.0%
Count 14 11 1 26 Total
% 53.8% 42.3% 3.8% 100.0%
Source: Survey Data On user assessment of crops, about 69 percent of AEAs rated it as good whilst about 25 percent rated it as average. Ninety percent (90 percent) of Directors rated user assessment as good whilst 10 percent rated it as average (see Table 11). On user assessment of animals, 44 percent of AEAs and 70 percent of Directors rated it as good, whilst 50 percent of AEAs and 30 percent of Directors rated it as average (see Table 12). Outcomes on motivation and incentives for extension agents in MoFA is relatively bad. In rating the institution's outcomes on motivation of agents, about 38 percent of AEAs rated it as good and 25 percent as bad, whilst 40 percent of Directors rated it as good with 50 percent of them rating it as average (Table 13).
27
Table 13 MoFA’s assessment of motivation of agents
GOOD AVERAGE BAD Total
Count 6 6 4 16 AEA
% 37.5% 37.5% 25.0% 100.0%
Count 4 5 1 10 What is your position
DIRECTOR % 40.0% 50.0% 10.0% 100.0%
Count 10 11 5 26 Total
% 38.5% 42.3% 19.2% 100.0%
Source: Survey Data Overall, from Table 13, 42.3 percent of the AEAs and Directors sampled view agents’ motivation as, at best, average. However, Table 14 indicates that incentives provided to the institutions’ agents are bad with only 4 percent indicating incentives available as good.
Table 14 MoFA’s assessment on incentives to agents
GOOD AVERAGE BAD Total
Count 8 8 16 AEA
% 50.0% 50.0% 100.0%
Count 1 5 4 10 What is your position
DIRECTOR % 10.0% 50.0% 40.0% 100.0%
Count 1 13 12 26 Total
% 3.8% 50.0% 46.2% 100.0%
Source: Survey Data In institutional outcomes of linking crop farmers to service providers, overall 54.5 percent of AEAs and Directors in the survey rate linkages as good, compared to 36.4 percent who rate it as average, and 9.1 percent who rate it as bad. In terms of animal farmer linkages to service providers, overall, AEAs and Directors rate linkages as good (45.5 percent), average (40.9 percent) and bad (13.6 percent). Whilst Directors rate linkages relatively high (good) for both crops and animals, the AEAs ratings are mostly average and bad (see Tables 15 and 16).
28
Table 15 MoFA’s performance on linking farmers to service providers on crops
GOOD AVERAGE BAD Total
Count 6 7 1 14 AEA
% 42.9% 50.0% 7.1% 100.0%
Count 6 1 1 8 What is your position
DIRECTOR % 75.0% 12.5% 12.5% 100.0%
Count 12 8 2 22 Total
% 54.5% 36.4% 9.1% 100.0%
Source: Survey Data
Table 16 MoFA’s performance on linking farmers to service providers on animals
GOOD AVERAGE BAD Total
Count 5 7 2 14 AEA
% 35.7% 50.0% 14.3% 100.0%
Count 5 2 1 8 What is your position
DIRECTOR % 62.5% 25.0% 12.5% 100.0%
Count 10 9 3 22 Total
% 45.5% 40.9% 13.6% 100.0%
Source: Survey Data
4.3.3 Farmer Beneficiary assessment of institutional performance Farmer beneficiaries of research and extension provision assessment of the institution's performance are rated by farmer participation concerning crops/animals, access to input supply on crops/animals, the delivery quality of field staff, the number of farmer field schools/days conducted per year, the type of technologies available and a rating on constraints these technologies address. Tables 17 and 18 indicate how farmers rate their participation in crop and animal activities at the institutional level. Farmer participation in crop activities are relatively better (good—65.6 percent) for crop related activities than animal related activities (good—48.4 percent). In terms of crop activity participation, there was an increase from the Metropolitan areas to the district level (see Table 17).
Table 18 Farmer beneficiary assessment on farmer participation concerning animal
farming
GOOD AVERAGE BAD Total
Count 2 3 1 6 METRO
% 33.3% 50.0% 16.7% 100.0%
Count 6 2 3 11 MUNICIPAL
% 54.5% 18.2% 27.3% 100.0%
Count 7 6 1 14
LOCATION
DISTRICT % 50.0% 42.9% 7.1% 100.0%
Count 15 11 5 31 Total
% 48.4% 35.5% 16.1% 100.0%
Source: Survey Data On the contrary, farmer beneficiaries see MoFA’s performance on input supply on crops and animals as average to bad (Tables 10 and 20). This is perhaps understandable since the MoFA as an institution is not directly involved in input supply to farmer beneficiaries
30
Table 19 Farmer beneficiary assessment on MoFA’s performance on input supply in crop farming
GOOD AVERAGE BAD Total
Count 1 6 7 METRO
% 14.3% 85.7% 100.0%
Count 10 2 12 MUNICIPAL
% 83.3% 16.7% 100.0%
Count 5 7 1 13
LOCATION
DISTRICT % 38.5% 53.8% 7.7% 100.0%
Count 5 18 9 32 Total
% 15.6% 56.3% 28.1% 100.0%
Source: Survey Data
Table 20 Farmer beneficiary assessment on MoFA’s performance on input supply in
animal farming
GOOD AVERAGE BAD Total
Count 1 5 6 METRO
% 16.7% 83.3% 100.0%
Count 8 2 10 MUNICIPAL
% 80.0% 20.0% 100.0%
Count 5 7 2 14
LOCATION
DISTRICT % 35.7% 50.0% 14.3% 100.0%
Count 5 16 9 30 Total
% 16.7% 53.3% 30.0% 100.0%
Source: Survey Data Despite the low ratings on input supply delivery outcomes of the institutional system, farmer beneficiary ratings of the delivery quality of field staff is good (96.8 percent) and increases from the Metropolitan to the district level. However, the number of farmer field schools/days conducted per year is rated good (31.3 percent), average (46.9 percent) and bad (21.9 percent). The number of farmer field days per year ratings increases from the metropolis to the district level. Tables 21 and Figure 7 show farmer ratings of the technologies promoted by the research and extension institution and how these address farmer constraints
31
Table 21 Farmer beneficiary assessment on institution's type of technology promoted
POST HARVEST IMPROVED
CROP VARIETIES
IMPROVEDANIMAL BREEDS
NON TRAD. ANIMAL REARING
SOIL FERTILITY IMPROVEMENT
Total
Count 5 2 7 METRO
% 71.4% 28.6% 100.0%
Count 6 1 1 1 3 12 MUNICIPAL
% 50.0% 8.3% 8.3% 8.3% 25.0% 100.0%
Count 5 3 4 2 14
LOCATION
DISTRICT % 35.7% 21.4% 28.6% 14.3% 100.0%
Count 16 6 5 3 3 33 Total
% 48.5% 18.2% 15.2% 9.1% 9.1% 100.0%
Source: Survey Data
Figure 7 Farmer beneficiary assessment on technology promoted and constraints they address
05
101520253035404550
Perc
enta
ge o
f MoF
A S
taff
Invo
lved
METRO MUNICIPAL DISTRICT
Location
Dietary proteininsufficiencyBad grain quality
Disease prone
Food insecurity
Insect damage
Low income levels
Low quality
Low soil fertility
Source: Survey Data From Table 21, farmers acknowledge the promotion of several technologies but rate post harvest (48.5 percent), improved crop variety (18.2 percent) and improved animal varieties (15.2 percent) as noticeable. The rating of promotion of post harvest technology as most important however declines as one moves from the metropolis to the districts. In Figure 7, farmers see the promotion of post harvest technologies to prevent insect damage (30.3 percent) as the most significant.
32
In conclusion, directors from the three locations, namely Metro, Municipal and District directorates involved farmers in planning local activities. At the top level whilst Directors believe that farmers are involved in the planning of local activities, some AEAs at the district level actually think farmers are not involved in planning activities. MoFA officials at the district level (peri-urban) disseminated information on technology mostly through training and visitations (TV) than those in the urban areas (metro and municipal) who rather disseminated information to farmers by organising workshops and farmer field days. Institutional rating of outcomes on motivation and incentives for extension agents in MoFA is relatively bad. The AEAs and Directors sampled, view agents motivation as, at best, average. Some AEAs, however, indicated that their training is inadequate, and suggest training in computer skills for market report and an upgrade on their knowledge in post harvest technologies and management. Farmer beneficiaries assess MoFA’s performance on input supply in crop and animal farming as average to bad. Despite the low ratings on input supply delivery of the institutional system, farmer beneficiary assessment of the delivery quality of field staff is good and increases from the Metropolitan to the district level. The rating of promotion of post harvest technology as most important, however, declines as one moves from the metropolis to the districts. Also all the AEAs and Directors agree that information delivered to farmer beneficiaries have had positive impacts on farmer yields. 4.4 Outcome Test: Changes in farmer practices
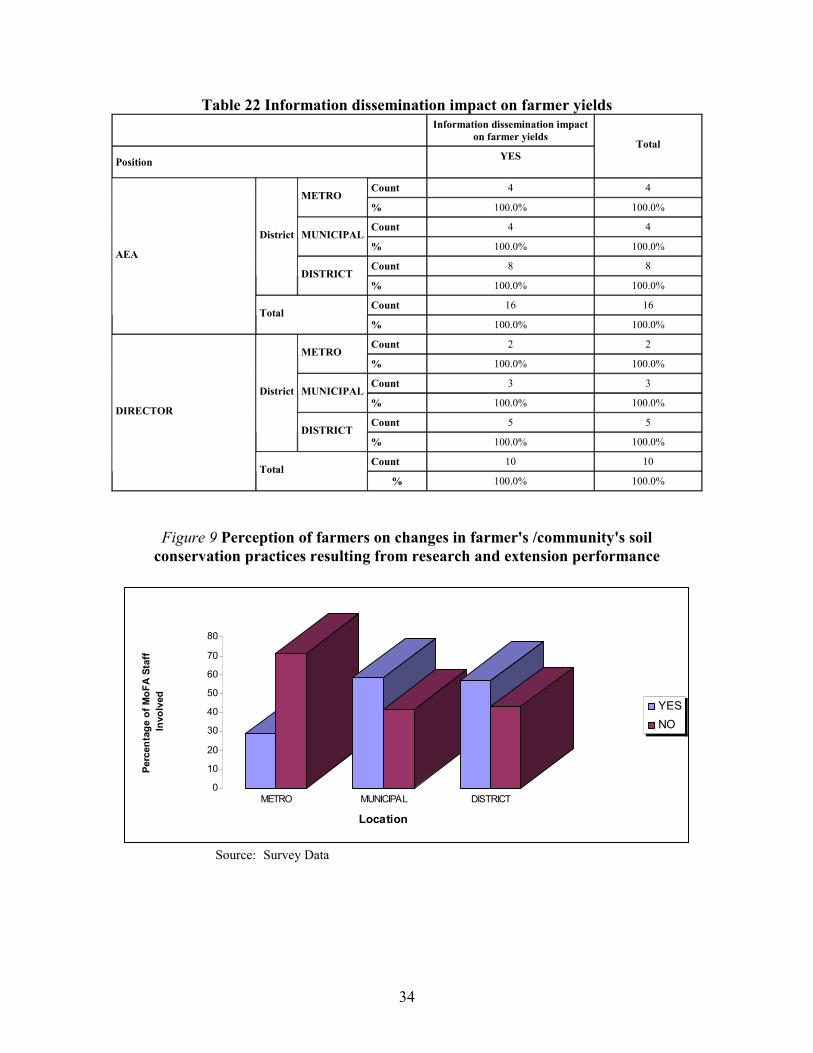
Outcome assessments of institutional performance is undertaken in terms of changes in practices associated with the farmer beneficiary. The assessment of the effect of institutional research and extension information delivered to beneficiaries are assessed mainly through the number of technologies adopted by beneficiary farmers, their changes in cultural practices and changes in their yields, mainly crop yields. In addition, changes in farmer/community soil conservation practices, changes in farmer/community bush burning, and whether Community/Farmer Based Organisations that practice group financing schemes/group marketing are functional in the communities. In Figure 8, the number of technologies adopted by beneficiary farmers, their changes in cultural practices and changes in their yields, mainly crop yields, is presented. Indications from Figure 8 are that AEAs in the Municipal and District directorates assessed farmers’ uptake of information by the number of technologies adopted. Overall, both AEAs and Directors assessed information uptake through the number of technologies adopted, changes in cultural practices and change in yields, in that order. Results from Table 22 show that Directors and AEAs perceive that their information dissemination has impacted positively on farmer yields across all three locations, namely
33
metropolitan, municipal and district directorates. Contrasting this perception with actual crop yields for the Metropolitan, Municipal and Districts covered in the sample, trends in aggregate outcomes in terms of growth rates in crop production characteristics (output, acreage, yields) shows that a) there are wide growth rate swings in areas under cultivation in cereals (maize, rice) in the metropolitan, municipal and district levels; b) yield performance in the cereals also fluctuate from year to year with certain districts recording declining growth rates each year (Dangbe West, GA district and West Mamprusi); c) across the metropolitan, municipal and district locations, output growth in the cereals are relatively better than growth rates under the roots and tubers. The general observations are that there is no systematic growth trend pattern in crop output characteristics, 2000-2003 (see Appendix D). However, the observed perceptions on farmer cultural practices are mixed. Farmer beneficiaries are almost equally divided on the observed impact of research and extension on their soil conservation practices (see Figure 9). However, farmers indicate changes in their cultural practices in the burning of bush fires (Table 23).
Figure 8 Assessment of Impact of Information delivered to the farmer
Source: Survey Data
0 10 20 30 40 50 60 70 80 90
100 Percentage of MoFA Staff
MetroDirector
Metro AEA
Municipal Director
MunicipalAEA
DistrictDirector
DistrictAEA
MoFA Staff at Various Locations
No. of technologiesadopted Change in culturalpractices Change in yields
34
Table 22 Information dissemination impact on farmer yields
Information dissemination impact on farmer yields
Position YES
Total
Count 4 4 METRO
% 100.0% 100.0%
Count 4 4 MUNICIPAL
% 100.0% 100.0%
Count 8 8
District
DISTRICT % 100.0% 100.0%
Count 16 16
AEA
Total % 100.0% 100.0%
Count 2 2 METRO
% 100.0% 100.0%
Count 3 3 MUNICIPAL
% 100.0% 100.0%
Count 5 5
District
DISTRICT % 100.0% 100.0%
Count 10 10
DIRECTOR
Total % 100.0% 100.0%
Figure 9 Perception of farmers on changes in farmer's /community's soil conservation practices resulting from research and extension performance
0
10
20
30
40
50
60
70
80
Perc
enta
ge o
f MoF
A S
taff
In
volv
ed
METRO MUNICIPAL DISTRICT
Location
YESNO
Source: Survey Data
35
Table 23 Perception of farmers on changes in farmer's /community's bush burning resulting from research and extension performance
YES NO Total
Count 3 4 7 METRO
% 42.9% 57.1% 100.0%
Count 10 1 11 MUNICIPAL
% 90.9% 9.1% 100.0%
Count 11 3 14
LOCATION
DISTRICT % 78.6% 21.4% 100.0%
Count 24 8 32 Total
% 75.0% 25.0% 100.0%
Source: Survey Data The impact on institutional performance on group formation at the farmer/community level to enhance their own financing and marketing arrangements however is rated as poor by the farmers (see Table 24). The percentage of farmers indicating that there have been positive changes in their group formation performance in marketing is as low as 12.5 percent.
Table 24 Impact of institutional performance on C/FBO that practice group financing schemes
YES NO Total
Count 7 7 METRO
% 100.0% 100.0%
Count 6 6 12 MUNICIPAL
% 50.0% 50.0% 100.0%
Count 6 7 13
LOCATION
DISTRICT % 46.2% 53.8% 100.0%
Count 12 20 32 Total
% 37.5% 62.5% 100.0%
Source: Survey Data
In conclusion, the effect on farmer cultural practices is mixed. Farmer beneficiaries are almost equally divided on the impact of research and extension on their soil conservation practices. The impact on institutional performance on group formation at the farmer/community level to enhance their own financing and marketing arrangements however is rated as poor by the farmers.
36
4.5 Summary of the main institutional bottlenecks
Even though most of the personnel at the district and sub-district levels know or have heard of the decentralization policy (Local Government Act, Act 462), implementation is however a problem. Knowledge and focus of the policy is high among the MoFA Directors, whilst knowledge and focus of the policy decreases as one moves down towards the district level among the frontline staff. Whilst Directors at the district level indicate the transfer of responsibility at the district level is happening, those in the metropolitan and municipal levels think it is partly happening. For AEAs, the transfer is relatively not happening. This empirical result tends to imply that compliance with the policy of decentralisation is less than perfect across directorates. Within the same unit (Director-AEAs) knowledge of the policy declines from the Director to the frontline staff (AEAs). Indeed, the national and regional MoFA administration still dictates the content of job schedules at the district levels. The relationship between the decentralized departments like the Ministry of Food and Agriculture (MoFA) and the Ministry of Local Government and Rural Development (under which the District Assembles fall) with regards to implementing agricultural programmes at the district level is not clear. The district MoFA continues to be answerable to the head office in Accra. Because of this relationship, the decision to recruit and fire staff at the district level is also made in Accra. The District Assemblies generally have not been able to effectively co-ordinate and harmonise the activities of the decentralized MoFA in the districts. At farmer level, beneficiaries see MoFA as weak in the delivery of farm inputs however, the current mandate of MoFA does not involve the distribution of farm input but rather facilitate. This is a case of lack of communication between the farmers who are the beneficiaries and MoFA who are the agents of change at the local level and is to be seen as a decentralised line ministry under the District Assembly. There are also issues of conceptual differences in the interpretation of the policy. While the first is more of de-concentration – that is opening up offices in all the districts, the second takes the form of the establishment of centralized public services parallel to the local government service but whose staffs are essentially in the service of the local governments (District Assemblies). Districts do not have the full complement of staff. Even though almost all the districts have their respective Metropolitan, Municipal and District Directors of Agriculture, this cannot be said of the Agricultural Extension Agents (AEAs). This is confirmed in the institutional rating of outcomes on motivation and incentives for extension agents in MoFA which was rated as bad. AEAs and Directors sampled view agents motivation as, at best, average. Decisions on programmes to be implemented in the districts are usually made at the MoFA head office in Accra with little or no participation from the District Assemblies. This is a typical top down, non-participatory process. This is also to some extent reflected in the relationship between the District Directors of MOFA and the AEAs.
37
Some of the Regional and District Directors of Agriculture and their staff do not have adequate training in extension management even though currently efforts are being made to correct this. The highly qualified and skilled do not want to accept posting to the districts, thus as one move from the MoFA head office in Accra through the metropolis, municipalities and the districts, the number of skilled personnel declines. Generally, research-extension linkage also declines when one moves from the metropolitan to the municipality and then to the district. This is because all metropolitan and municipalities are located in the urban areas and thus tend to attract more qualified staff. Also, most of the research institutions are located in either the metropolis or municipalities. The impact of these institutional bottlenecks on aggregate outcomes (growth rates in the output characteristics) are that there is no systematic growth pattern in crop output characteristics, 2000-2003, for major crops such as maize, rice, roots and tubers. In addition the effect of farmer cultural practices resulting from research and extension is mixed. This may be due to, among others, lack of co-ordination between the decentralised structures. The national MoFA does not link up with the districts to assess their potential and thus no systematic growth in output is observed.
38
5 Remedying key bottlenecks In order to remedy the key bottlenecks that constrain the effectiveness of the agricultural research and extension processes in Ghana, various aspects of the structure need to be reviewed and reorganized. These include:
(i) Co-ordination of Actors and Building Linkages As discussed already, knowledge and focus of the policy is high among the MoFA Directors, whilst knowledge and focus of the policy decreases as one moves down towards the district level among the frontline staff. Also, the national and regional MoFA administration still dictates the content of job schedules at the district levels. These suggest lack of coordination along the command chain, and therefore the need to build linkages among the decentralised units. Many of the aspects of decentralization are the responsibilities of different actors both within and outside the system. For example, the Ministry of Finance and Economic Planning tends to have primary responsibility for decentralization of revenue sources and the development of inter-government transfer systems. Various sector line-ministries such as education, health, etc, tend to be in charge of or have significant influence over the devolution of responsibilities. The Ministry of Local Government and Rural Development has responsibility for developing sub-national institutional structures and managerial procedures. Thus the key dimensions of decentralization which function together are at the mercy of different agencies that may not fully support the decentralization agenda and/or may be competing with such agencies for control of the decentralization agenda and access to government and international donor resources. A similar problem exists locally where it is necessary to coordinate activities of local government councils and their operating expenses. The co-ordination of the actors involved in decentralization is weak and so the linkages among the components of decentralization at the national and local levels are virtually non-existent. Co-ordination of actors and linkages could be improved if the decentralisation process in Ghana is fully completed, that is, administrative, political and fiscal decentralisation. This will occur when the various line ministries are accountable to the District Assemblies and no long to the head office in the capital.
(ii) Manpower Issues There is a shortage of qualified personnel to carry out the numerous functions transferred to the District Assemblies. Some AEAs also indicate that their training is inadequate, and suggest training in computer skills for market report and an upgrade on their knowledge in post harvest technologies and management. One way to address this problem is the introduction of more in-service and on-the-job training for the staff at post to upgrade their skills. In addition, more exposure of the concerned staff to “best practices” by way of attachments to more progressive institutions could be very useful.
39
(iii) Strengthening of Collaboration There is the need to strengthen the collaboration among the various directorates within MoFA and between MoFA and the Regional co-coordinating Council, the District Assemblies, research Institutions and the Universities. In addition, the relationship between MoFA and other sector ministries whose activities directly affect the work of MoFA, such as Roads and Transport and Finance and Economic Planning should be strengthened by way of more frequent dialogue to enhance the coordination of their various activities.
(iv) Research and Extension Linkage
As has already been noted, MoFA officials at the district level (peri-urban) disseminated information on technology mostly through training and visitations (TV) than those in the urban areas (metro and municipal) who rather disseminated information to farmers by organising workshops and farmer field days. With the responsibility for agricultural development now shifting to the districts, there is the need harmonize information dissemination and to have representation of District Directors of Agriculture on the Research Extension Linkage Committees (RELCs). District Agricultural Sub-committees (DASs) need to be formed with District Assemblies to facilitate RELC activities and agricultural development in general.
(v) Incentives and motivations for AEAs
Many difficult problems confront the staff of MoFA at the community level, which negatively affect their work and performance. The key ones include (a) lack of opportunity in the non-urban district centers to enhance income through engagement of spouses and other family members in income generating activities; and (b) lack of good social services, especially schools (to send their children to), health and communication in some local government centers, particularly the non-urban areas. In addition, posting to some remote communities may also imply lack of opportunities for the AEA to upgrade him/herself. More concerted effort should therefore be made to provide extra cash incentives in the form of bonuses to staff in remote areas to compensate for lack of opportunities to make extra income; and scholarships to wards to enable them attend nearby good schools.
40
6 Conclusions Despite the positive growth experienced by the agricultural sector since the mid 1980s, bottlenecks that inhibit agricultural productivity remain. Estimates indicate that average yields of most major crops are less than 50% of achievable yields; and technological change has been very slow and minimal. An analysis of the performance of the sector seems to suggest that the slow growth of agriculture is a combination of several factors that reduce farmers’ incentives to invest and produce. These include inappropriate policies, lack of technological change and poor basic infrastructure, which are also linked to institutional bottlenecks and ineffectiveness of research and extension linkages, as well as the slow pace of the decentralisation policy. Even though most of the personnel at the district and sub-district levels know or have heard of the decentralization policy (Local Government Act, Act 462), implementation is however a problem. Knowledge and focus of the policy is high among the MoFA Directors, whilst knowledge and focus of the policy decreases as one moves down towards the district level among the frontline staff. Whilst Directors at the district level indicate the transfer of responsibility at the district level is happening, those in the metropolitan and municipal levels think it is partly happening. For AEAs, the transfer is relatively not happening. This empirical result tends to imply that compliance with the policy of decentralisation is less than perfect. Indeed, the national and regional MoFA administration still dictates the content of job schedules at the district levels. Decisions on programmes to be implemented in the districts are usually made at the MoFA head office in Accra with little or no participation from the District Assemblies. This is a typical top down, non-participatory process. This is also to some extent reflected in the relationship between the District Directors of MOFA and the AEAs. The impact of these institutional bottlenecks on aggregate outcomes (growth rates in the output characteristics) are that there is no systematic growth pattern in crop output characteristics, 2000-2003, for major crops such as maize, rice, roots and tubers. This may be due to, among others, lack of co-ordination between the decentralised structures. The national MOFA does not seem to link up with the districts to assess their potential and thus no systematic growth in output in observed. In order to remedy the key bottlenecks that constrain the effectiveness of the agricultural research and extension processes in Ghana, various aspects of the structure need to be reviewed and reorganized. These include: (a) co-ordination of actors and building linkages, (b) addressing manpower issues, (c) strengthening the collaboration among the various directorates within and outside the ministry, (d) the existence of a more purposeful research and extension linkages, and (e) the creation of more incentives to reward hard working staff, particularly at the community level.
41
References Asante, F.A. (2003) Economic Analysis of Decentralisation in Rural Ghana. (Germany: Peter Lang). Ayee, J.R.A. (2000). Sub-District Structures and Popular Participation: A Preliminary Assessment. In Thomi, W., Yankson, P.W.K., and Zanu, S.Y. (eds). A Decade of Decentralisation in Ghana: Retrospect and Prospects. Accra: EPAD Research Project/Ministry of Local Government and Rural Development). Ghana, Republic of (1992) Constitution of the Republic of Ghana, 1992 (Tema: Ghana Publishing Corporation). Ghana, Republic of (1993) Local Government Act (Act 462) (Tema: Ghana Publishing Corporation). Hodgson, Geoffrey (1998). The Approach of Institutional Economics, Journal of Economic Literature 36 (March): 166-192. Khalil, Elias L. (1995). Organisations Versus Institutions, Journal of Institutional and Theoretical Economics 151 (3): 445-466. Lin, J. Yifu and Jeffrey B. Nugent (1995). Institutions and Economic Development, Handbook of Development Economics, Vol III: 2303-2370. MOFA (2003). Agricultural Extension Policy. Directorate of Agricultural Extension Services. Ministry of Food and Agriculture. Accra. North, Douglass C. (1990). Institutions, Institutional Change and Economic Performance, Cambridge University Press. Olsson, Ola (1999). A Microeconomic Analysis of Institutions. Working Papers in Economics, No. 25. Department of Economics, Goteborg University. April. Williamson, Oliver (1998). The Institutions of Governance, AEA Papers and Proceedings 88 (2): 75-79.
42
APPENDIX A (SET OF QUESTIONNAIRES)
INSTITUTIONAL BOTTLENECKS FOR AGRICULTURAL SECTOR
DEVELOPMENT: THE CASE OF RESEARCH AND EXTENSION PROVISION IN GHANA
METHODOLOGY: QUESTIONS RAISED AS GUIDE INTO MEASURING THE QUALITY OF INSTITUTIONS (A FRAMEWORK FOR ANALYSIS)
MEASURING THE QUALITY OF INSTITUTIONS (A FRAMEWORK FOR ANALYSIS
QUESTIONNAIRE—DISTRICT DIRECTOR OF MoFA
General Date of Interview……………………………………
1. Questionnaire No. …………… 4. Enumerator Name/No………………………….. 2. District: ……………………… 5. Enumeration Area………………………… 3. Village: ……………………….. 6. Country /Region of Origin……………………… 7. Sex of Director: 8. Name of Director…………………………
1. Male 2. Female
Compliance test
• Do you know of the Local Government Act 462 (Policy)? 1. YES 2. NO • The Policy sought to transfer responsibilities including administration and the
provision of services (extension message, etc) to the District Assemblies. Is this happening? 1. YES 2. NO 3. PARTLY
• If YES, how is it happening? (Give examples) • If NO, why is it not happening? (Give examples) • If PARTLY happening, explain • At the regional and institutional levels, attention of the policy is focused on policy
planning, coordination, technical backstopping, monitoring and evaluation. In your view is this happening? 1. YES 2. NO
• If YES, how is it happening? (Give examples)
• If NO, why is it not happening? (Give examples)
43
• How do you transform research findings to forms in which the farmers understand? Describe the process you go through.
Capacity /Technical ability
• Do you think your current training is enough to transform research findings to forms understood by your clients? 1. YES 2. NO
• If YES, how?
• If NO, what additional training do you require? Explain
Performance Test (III and IV) III Institutional Outcomes (participation, user assessment, motivation and incentives of agents)
• Are beneficiaries involved in the planning of local activities? 1. YES 2. NO • If YES, in what form?
1 Drawing up local farm extension activities and priorities 2 Training programme schedules 3 Needs assessment of users 4 Other (specify)
• If NO, why? How is information disseminated to farmers?
1. T & V 2. Workshop 3. Farmer field school (on farm trials)/Farmer Field Days 4. Radio (FM stations) 5. other (specify)
• How do you assess the farmer’s uptake of information? 1. No. of technologies adopted 2. Change in cultural practices 3. Change in yields 4. Other (specify)
• Has farm information dissemination impacted on farmer yields? 1. Yes 2. No
44
IV Institutional Performance (Outputs of the Research and Extension System) (Structured Guide for Gap Analysis)? What are the institution’s outcomes and how would you rate these? Scale (tick) Comment Outcomes (1) Good (2) Average (3) Bad Crops Animals other 1 Farmer Participation
2 User Assessment 3 Motivation of Agents
4 Incentives of Agents
5 Linking farmers to service providers
6 Other (specify)
How would you rate the delivery of the following “outputs” from your outfit and why? Scale (tick) Comment Outputs (1) Good (2) Average (3) Bad 1 Quarterly reports 2 Number of Training for Field Staff
3 Number of FFS/D 4 Other (specify)
5 Other (specify)
• What technology (crops, animals, mechanization, and other innovations)?
Type of Technology Available
What constraints do these technologies address
Availability and ease of use (extent, scope, usefulness) (1) Good (2) Average (3) Bad
VI Aggregate Outcomes (Secondary data analysis) However get a general perspective on the following
• Output (aggregate) What level of increases in crop/animal outputs? Trend analysis What level of area under cultivation / yield? Trend analysis
• Composition of outputs (type of crops grown/animals reared) (disaggregated)
• Distributional Effects
Increases in income for all groups? All groups of farmers participating? Extent of involvement of community in environmental issues, etc
• Sustainability Impact of C/FBO on environmental issues Involvement of C/FBO and individual farmers in research/extension activities Extent of institutions alleviating constraints in communities Safety nets for vulnerable, etc
47
INSTITUTIONAL BOTTLENECKS FOR AGRICULTURAL SECTOR DEVELOPMENT: THE CASE OF RESEARCH AND EXTENSION PROVISION IN GHANA ===============================================================
METHODOLOGY: QUESTIONS RAISED AS GUIDE INTO MEASURING THE QUALITY OF INSTITUTIONS (A FRAMEWORK FOR ANALYSIS)
MEASURING THE QUALITY OF INSTITUTIONS (A FRAMEWORK FOR ANALYSIS
QUESTIONNAIRE—AGRICULTURAL EXTENSION AGENTS
General Date of Interview……………………………………
1. Questionnaire No. …………… 4. Enumerator Name/No………………………….. 2. District: ……………………… 5. Enumeration Area………………………… 3. Village: ……………………….. 6. Country /Region of Origin……………………… 7. Sex of AEA: 8. Name of Respondent…………………………
3. Male 4. Female
II Institutional Characteristics of Research and Extension: Literature review Compliance test
• Do you know of the Local Government Act 462 (Policy)? 1. YES 2. NO • The Policy sought to transfer responsibilities including administration and the
provision of services (extension message, etc) to the District Assemblies. Is this happening? 1. YES 2. NO 3. PARTLY
• If YES, how is it happening? (Give examples) • If NO, why is it not happening? (Give examples) • If PARTLY happening, explain • At the regional and institutional levels, attention of the policy is focused on policy
planning, coordination, technical backstopping, monitoring and evaluation. In your view is this happening? 1. YES 2. NO
• If YES, how is it happening? (Give examples)
• If NO, why is it not happening? (Give examples)
48
• How do you transform research findings to forms in which the farmers understand? Describe the process you go through.
Capacity /Technical ability
• Do you think your current training is enough to transform research findings to forms understood by your clients? 1. YES 2. NO
• If YES, how?
• If NO, what additional training do you require? Explain
Performance Test (III and IV) III Institutional Outcomes (participation, user assessment, motivation and incentives of agents)
• Are beneficiaries involved in the planning of local activities? 1. YES 2. NO • If YES, in what form?
1 Drawing up local farm extension activities and priorities 2 Training programme schedules 3 Needs assessment of users 4 Other (specify)
• If NO, why? How is information disseminated to farmers?
6. T & V 7. Workshop 8. Farmer field school (on farm trials) 9. other (specify)
• How do you assess the farmer’s uptake of information? 5. No. of technologies adopted 6. Change in cultural practices 7. Change in yields 8. Other (specify)
• Has farm information dissemination impacted on farmer yields?
1. Yes 2. No
49
IV Institutional Performance (Outputs of the Research and Extension System) (Structured Guide for Gap Analysis)? What are the institution’s outcomes and how would you rate these? Scale (tick) Comment Outcomes (1) Good (2) Average (3) Bad Crops Animals other 1 Farmer Participation
2 User Assessment 3 Motivation of Agents
4 Incentives of Agents
5 Linking farmers to service providers
6 Other (specify)
How would you rate the delivery of the following “outputs” from your outfit and why? Scale (tick) Comment Outputs (1) Good (2) Average (3) Bad 1 Quarterly reports 2 Number of Training for Field Staff
3 Number of FFS/D 4 Other (specify)
5 Other (specify)
• What technology (crops, animals, mechanization, and other innovations)?
Type of Technology Available
What constraints do these technologies address
Availability and ease of use (extent, scope, usefulness) (1) Good (2) Average (3) Bad
Outcome Test (V and VI) V Household or Farm Outcomes
• Technology Choice/Adoption 1. What outputs of research/extension is available to the farmer/community? 2. Which technology sets are being used? Tick as many as possible New crop variety with fertilizer application Only new crop varieties Fertilizer and other chemical application New animal breeds Export crop/horticultural crops linkage to External markets Crop/Animal Mix technologies Others (specify) 3. What has influenced the use of these technologies? Specify 4. Changes in practices Are there changes in farmer’s /community’s soil conservation practices, bush burning, cropping along slopes, IPM, etc? 5. Building of knowledge base: C/FBO formation. What activities in these: Group finance schemes, group marketing, etc. VI Aggregate Outcomes (Secondary data analysis) However get a general perspective on the following
• Output (aggregate) What level of increases in crop/animal outputs? Trend analysis What level of area under cultivation / yield? Trend analysis
• Composition of outputs (type of crops grown/animals reared) in district (disaggregated)
• Distributional Effects Increases in income for all groups? All groups of farmers participating? Extent of involvement of community in environmental issues, etc
• Sustainability Impact of C/FBO on environmental issues Involvement of C/FBO and individual farmers in research/extension activities Extent of institutions alleviating constraints in communities Safety nets for vulnerable, etc
52
INSTITUTIONAL BOTTLENECKS FOR AGRICULTURAL SECTOR DEVELOPMENT: THE CASE OF RESEARCH AND EXTENSION PROVISION
IN GHANA ===============================================================
METHODOLOGY: QUESTIONS RAISED AS GUIDE INTO MEASURING THE QUALITY OF INSTITUTIONS (A FRAMEWORK FOR ANALYSIS)
MEASURING THE QUALITY OF INSTITUTIONS (A FRAMEWORK FOR ANALYSIS)
QUESTIONNAIRE--FARMERS
General Date of Interview……………………………………
1. Questionnaire No. …………… 4. Enumerator Name/No………………………….. 2. District: ……………………… 5. Enumeration Area………………………… 3. Village: ……………………….. 6. Country /Region of Origin……………………… 7. Sex of farmer respondent: 8. Name of Respondent…………………………
1 Male 2 Female
IV Institutional Performance (Outputs of the Research and Extension System) (Structured Guide for Gap Analysis)? What are the institution’s (MoFA) outcomes and how would you rate these? Scale (tick) Comment Outcomes (1) Good (2) Average (3) Bad Crop Animal Other 1 Farmer Participation
2 Farmer Assessment
3. Input (agro-chemicals, etc) supply
4 Other (specify)
5 Other (specify)
53
How would you rate the delivery of the following “outputs” from MoFA and why? Scale (tick) Comment Outputs (1) Good (2) Average (3) Bad 1 Number of AEAs in locality
2 Quality of Field Staff
3 Number of FFS/D per year
4 Other (specify)
5 Other (specify)
• What technology (crops, animals, mechanization, and other innovations)?
Type of Technology Available
What constraints do these technologies address
Availability and ease of use (extent, scope, usefulness) (1) Good (2) Average (3) Bad
Outcome Test (V and VI) V Household or Farm Outcomes (Technology Choice/Adoption) 1. What outputs (post-harvest, aquaculture, improved crop varieties, etc) of research/extension is available to you? 2. Which technology sets are being given to you? Tick as many as possible New crop variety with fertilizer application Only new crop varieties Fertilizer and other chemical application New animal breeds Export crop/horticultural crops linkage to External markets Crop/Animal Mix technologies Others (specify) 3. What has influenced your use of these technologies? Specify 4. Changes in practices Are there changes in farmer’s /community’s soil conservation practices, bush burning, cropping along slopes, IPM, etc?
55
5. Building of knowledge base: C/FBO formation. What activities in these: Group finance schemes, group marketing, etc. VI Get a general perspective on the following
• Outputs (aggregate) What level of increases in crop/animal outputs? Trend analysis What level of area cultivated / yields? Trend analysis
• Composition of outputs (disaggregated)
• Distributional Effects Increases in income for all groups? All groups of farmers participating? Extent of involvement of community in environmental issues, etc
• Sustainability Impact of C/FBO on environmental issues Involvement of C/FBO and individual farmers in research/extension activities Extent of institutions alleviating constraints in communities Safety nets for vulnerable, etc
56
APPENDIX B List of Interviewees
LOCATION NAME POSITION
METRO KUMASI Badu Yeboah Director
Cecilia Frempong AEA Peter Acheampong AEA Joseph Kwaisi Adu Asamoah Farmer William Kwarteng Farmer
TAMALE Kwabena Arokorful Director Issifu Zibrila AEA Abukari Ziblim AEA Sulemana Yemyoliya Farmer Abdulai Mahama Farmer MUNICIPAL
SUNYANI Mrs. Opare Director Vincent Ahatsi AEA Richmond Yeboah Farmer Joseph Ansu Farmer
CAPE COAST Dr. Sherry Johnson Director William Haizel AEA Benjamin Johnson AEA Paul Awusi Joseph Arthur
BOLGATANGA Musbawu Alhaji Ahmed Director Richard K. Denteh AEA John Wegaho AEA Apugri Atia Farmer Peter Awuni Farmer DISTRICT
EJURA SEKYEDUMASE A. K. Boamono Director Kwaku Agyepong AEA Tairu Ismaila Farmer
DANGBE WEST Mr. Nii Quaye-Kumah Director Mr. Michael Nortey AEA Eric Ofoe Yikpo Farmer Francis Kotey Farmer
GA Mrs. Kyei Director Isaac Appiah AEA
AKUAPEM SOUTH Emelia Apior Director Okoampah Kwayisi AEA C. M. K. Amengor AEA Asare Oppong Farmer James Dornu Baffloe Farmer
WEST MAMPRUSI Wilfred Anonadaga Director Chimsi Imoro AEA Abukari Bawa AEA Alhassan Azindoo Farmer Adam Wumbila Farmer
57
APPENDIX C
Appendix C1 Level of Beneficiary Involvement in Planning Local Activities Involvement in Planning
Position YES NO
Total
Count 4 0 4 METRO
% 100.0% 0.0 100.0%
Count 4 0 4 MUNICIPAL
100.0% 0.0 100.0%
Count 6 2 8
Location
DISTRICT % 75.0% 25.0% 100.0%
Count 14 2 16
AEA
Total % 87.5% 12.5% 100.0%
Count 2 0 2 METRO
% 100.0% 0.0 100.0%
Count 3 0 3 MUNICIPAL
% 100.0% 0.0 100.0%
Count 5 0 5
Location
DISTRICT % 100.0% 0.0 100.0%
Count 10 0 10
DIRECTOR
Total % 100.0% 0.0 100.0%
Source: Survey Data
Appendix C2 Type of Planning Activities Beneficiaries are involved in
Position Drawing up local farm extension activities and priorities
Training programme schedules
Needs assessment of users
Total
Count 4 0 0 4 METRO
% 100.0% - - 100.0%
Count 3 0 1 4 MUNICIPAL
% 75.0% - 25.0% 100.0%
Count 3 2 1 6
Location
DISTRICT % 50.0% 33.3% 16.7% 100.0%
Count 10 2 2 14
AEA
Total % 71.4% 14.3% 14.3% 100.0%
Count 2 0 0 2 METRO
% 100.0% - - 100.0%
Count 2 0 1 3 MUNICIPAL
% 66.7% - 33.3% 100.0%
Count 3 2 0 5
Location
DISTRICT % 60.0% 40.0% - 100.0%
Count 7 2 1 10
DIRECTOR
Total % 70.0% 20.0% 10.0% 100.0%
Source: Survey Data
58
Appendix C3 Type of Information Dissemination to Beneficiaries
Position T & V WORKSHOPFARMER FEILD SCHOOL/DAY
Total
Count 2 2 4 METRO
% 50.0% 50.0% 100.0%
Count 2 1 1 4 MUNICIPAL
% 50.0% 25.0% 25.0% 100.0%
Count 5 3 8
District
DISTRICT % 62.5% 37.5% 100.0%
Count 9 3 4 16
AEA
Total % 56.3% 18.8% 25.0% 100.0%
Count 1 1 2 METRO
% 50.0% 50.0% 100.0%
Count 3 3 MUNICIPAL
% 100.0% 100.0%
Count 5 5
District
DISTRICT % 100.0% 100.0%
Count 9 1 10
DIRECTOR
Total % 90.0% 10.0% 100.0%
Source: Survey Data
Appendix C4 Type of Technology Promoted by MoFA Directorates
Position POST HARVEST
IMPROVED CROP
VARIETIES
IMPROVED ANIMAL BREEDS
NON TRAD.
ANIMAL REARING
SOIL FERTILITY
IMPROVEMENT
Total
Count 2 2 4 METRO
% 50.0% 50.0% 100.0%
Count 1 1 1 1 4 MUNICIPAL
% 25.0% 25.0% 25.0% 25.0% 100.0%
Count 3 1 4
District
DISTRICT % 75.0% 25.0% 100.0%
Count 1 2 6 2 1 12
AEA
Total % 8.3% 16.7% 50.0% 16.7% 8.3% 100.0%
Count 1 1 2 METRO
% 50.0% 50.0% 100.0%
Count 1 1 2 MUNICIPAL
% 50.0% 50.0% 100.0%
Count 2 2 4
District
DISTRICT % 50.0% 50.0% 100.0%
Count 3 4 1 8
DIRECTOR
Total % 37.5% 50.0% 12.5% 100.0%
Source: Survey Data
59
Appendix C5 Constraints Addressed by Technologies Promoted CONSTRAINTS ADDRESSED