22
Institutional Reform, Resource Reallocation and Dairy Productivity: A Case Study for Australia Yu Sheng ABARES Presentation for the 13 th OECD Farm-level Analysis Meeting November 2014

Institutional Reform, Resource
Reallocation and Dairy Productivity: A Case Study for Australia
Yu Sheng ABARES
Presentation for the 13th OECD Farm-level Analysis Meeting
November 2014
Background
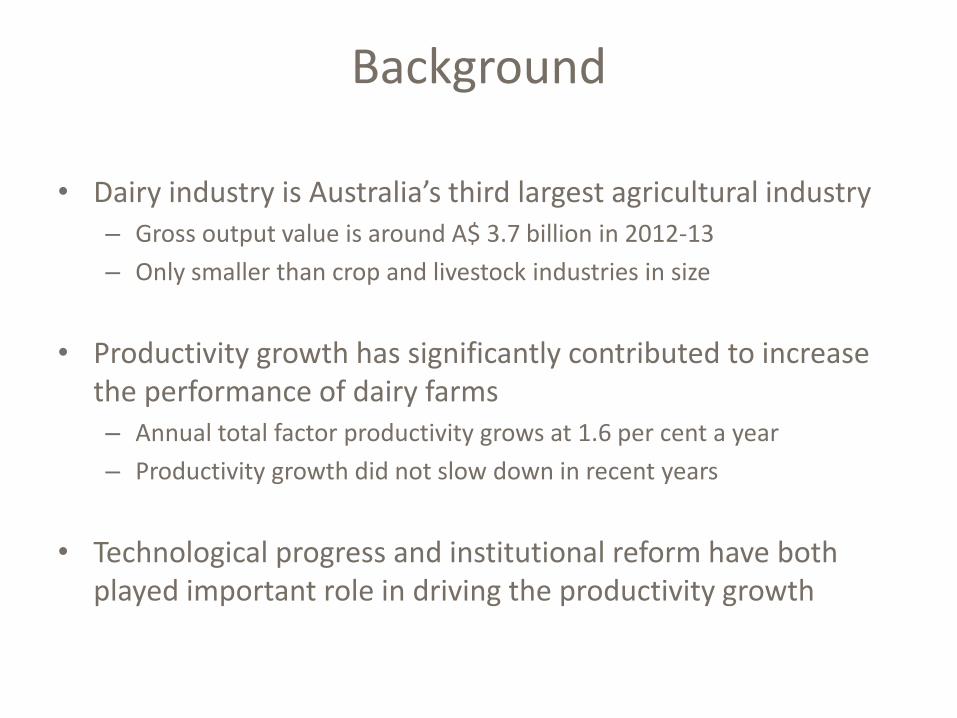
• Dairy industry is Australia’s third largest agricultural industry – Gross output value is around A$ 3.7 billion in 2012-13
– Only smaller than crop and livestock industries in size
• Productivity growth has significantly contributed to increase the performance of dairy farms – Annual total factor productivity grows at 1.6 per cent a year
– Productivity growth did not slow down in recent years
• Technological progress and institutional reform have both played important role in driving the productivity growth
Background
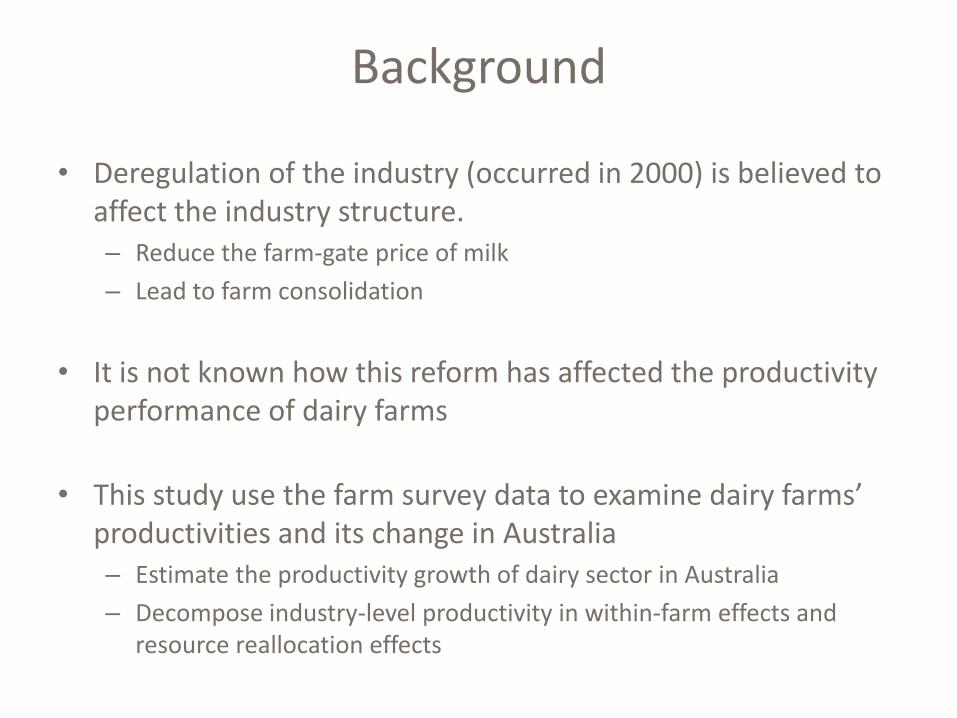
• Deregulation of the industry (occurred in 2000) is believed to affect the industry structure. – Reduce the farm-gate price of milk
– Lead to farm consolidation
• It is not known how this reform has affected the productivity performance of dairy farms
• This study use the farm survey data to examine dairy farms’ productivities and its change in Australia – Estimate the productivity growth of dairy sector in Australia
– Decompose industry-level productivity in within-farm effects and resource reallocation effects

Australian Dairy Industry
• In 2012-13, Australian dairy industry – produced 9 billion litres of milk with 1.6 million cows.
– held around 7,500 farms and employed 43,000 workers.
– More than 40 per cent of products export to the international market.
• The industry is mainly pasture based with diverse milk production systems across regions – 2/3 dairy farms pursue seasonal production (in Tasmania, Victoria and
South Australia) vs. 1/3 pursue year round production.
– climatic conditions, market requirement and the cost of inputs are three most important factors affecting farm practices.
• Owner-operated farms dominate the industry – In 2012-13, there are 18 per cent of share farming and less than 3 per
cent of corporate farms.
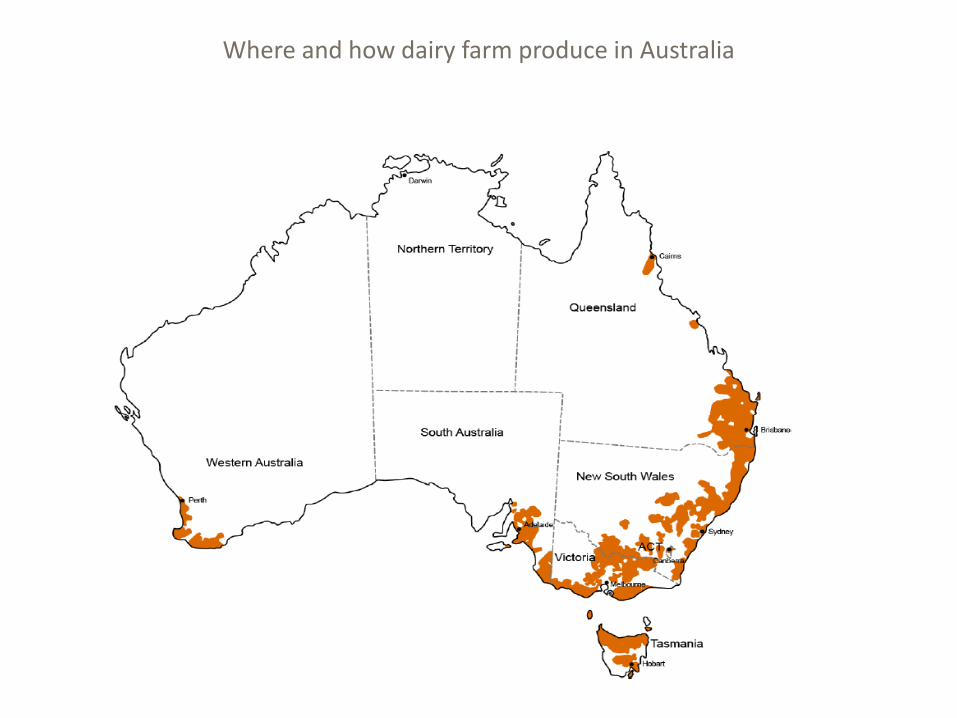
Where and how dairy farm produce in Australia
Deregulation Reforms in Australian Dairy Industry
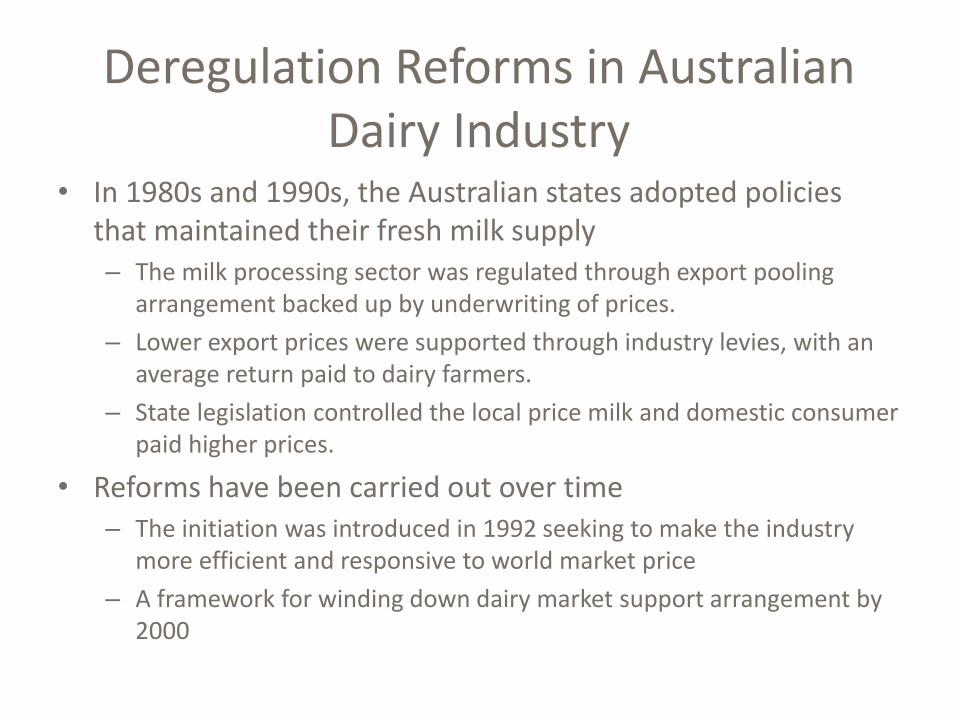
• In 1980s and 1990s, the Australian states adopted policies that maintained their fresh milk supply – The milk processing sector was regulated through export pooling
arrangement backed up by underwriting of prices.
– Lower export prices were supported through industry levies, with an average return paid to dairy farmers.
– State legislation controlled the local price milk and domestic consumer paid higher prices.
• Reforms have been carried out over time – The initiation was introduced in 1992 seeking to make the industry
more efficient and responsive to world market price
– A framework for winding down dairy market support arrangement by 2000
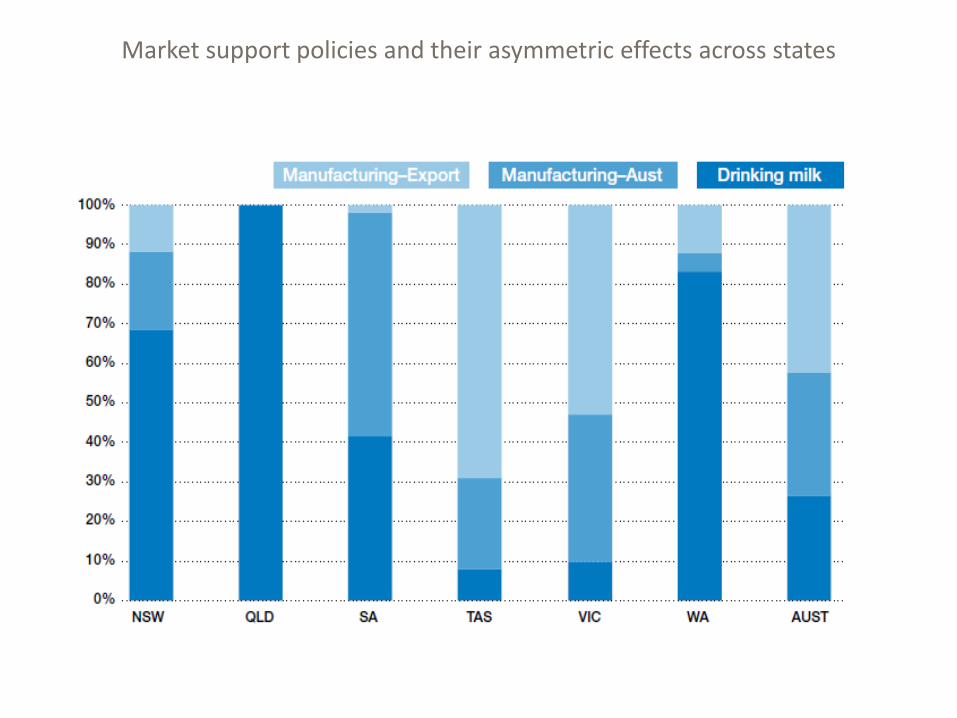
Market support policies and their asymmetric effects across states
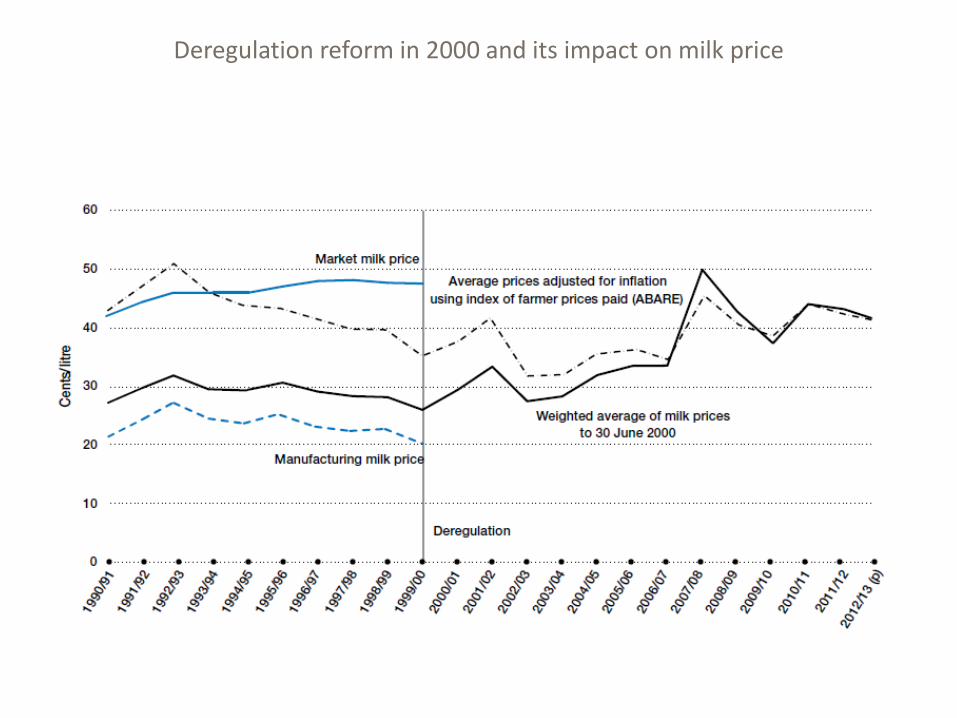
Deregulation reform in 2000 and its impact on milk price
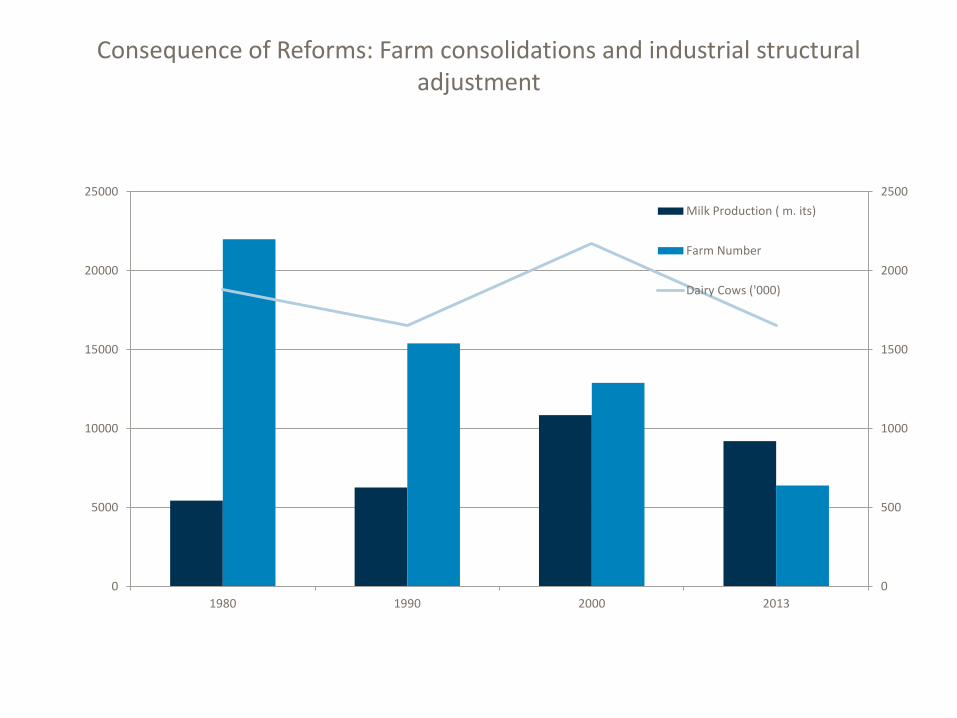
Consequence of Reforms: Farm consolidations and industrial structural adjustment
0
500
1000
1500
2000
2500
0
5000
10000
15000
20000
25000
1980 1990 2000 2013
Milk Production ( m. its)
Farm Number
Dairy Cows ('000)

Methodology and Data
• Fisher index has been used to estimate farm-level and sector-level productivity
• The OP Decomposition (Olley and Pakes 1996)
the productivity growth can thus be written as

Methodology and Data
• The Dynamic OP Decomposition (Melitz and Polanec 2009)

Methodology and Data
• Australian dairy industry survey (ADIS)
– Annual farm survey collecting physical and financial information
– Sample ranged from 300 to 400 observations
– Replacement strategy has been applied to ensure the sample representativeness
• Definition of primary variables
– Farm productivity
– Market share: output value share

Number of farms in Australian dairy industry: 1979-2012
0
5000
10000
15000
20000
25000
0
50
100
150
200
250
300
350
400
450
19
79
19
80
19
81
19
82
19
83
19
84
19
85
19
86
19
87
19
88
19
89
19
90
19
91
19
92
19
93
19
94
19
95
19
96
19
97
19
98
19
99
20
00
20
01
20
02
20
03
20
04
20
05
20
06
20
07
20
08
20
09
20
10
20
11
20
12
Sample
Population
Num
ber
of sa
mple
Num
ber
of popula
tion

TFP estimates in Australian Dairy Industry: 1979-2012
0
20
40
60
80
100
120
140
160
180
19
78
-79
19
79
-80
19
80
-81
19
81
-82
19
82
-83
19
83
-84
19
84
-85
19
85
-86
19
86
-87
19
87
-88
19
88
-89
19
89
-90
19
90
-91
19
91
-92
19
92
-93
19
93
-94
19
94
-95
19
95
-96
19
96
-97
19
97
-98
19
98
-99
19
99
-20
00
20
00
-01
20
01
-02
20
02
-03
20
03
-04
20
04
-05
20
05
-06
20
06
-07
20
07
-08
20
08
-09
20
09
-10
20
10
-11
20
11
-12
Ou
tpu
t, In
pu
t an
d T
FP I
nd
ice
s
Year
input
output
TFP
1.62 %
1.66 %

The static OP decomposition: within-farm innovation vs. covariance effects
-0.005
0.000
0.005
0.010
0.015
0.020
0.025
0.030
1979-2012 1979-2000 2000-2012
Covariance Effects Average TFP
On-farm innovation and within-farm TFP growth
• Within-farm technology progress accounted for more than 90 per cent of productivity growth. – Breakthrough in genetic progress: artificial insemination (AI) is widely
used;
– Improved management skills on pasture production and scientific choice of feeding time
– Improved technology in calf breeding and providing better nutrition of cows in milking period;
• ABARES productivity research also find that – Human capitals and public RD&E
– Climate conditions and farm risk management

Interpretation on the relative small covariance terms
• There might be misallocation of resources between farms, in particular before deregulation in 2000.
• Farms’ enter and exit can also affect within-farm effects

Relative contribution of Continuing, Entering and Exiting Farms to Within-farm Effects
-0.0100
-0.0050
0.0000
0.0050
0.0100
0.0150
0.0200
0.0250
0.0300
1979-2012 1979-2000 2000-2012
Exiting Farms Entering Farms Continuing Farms
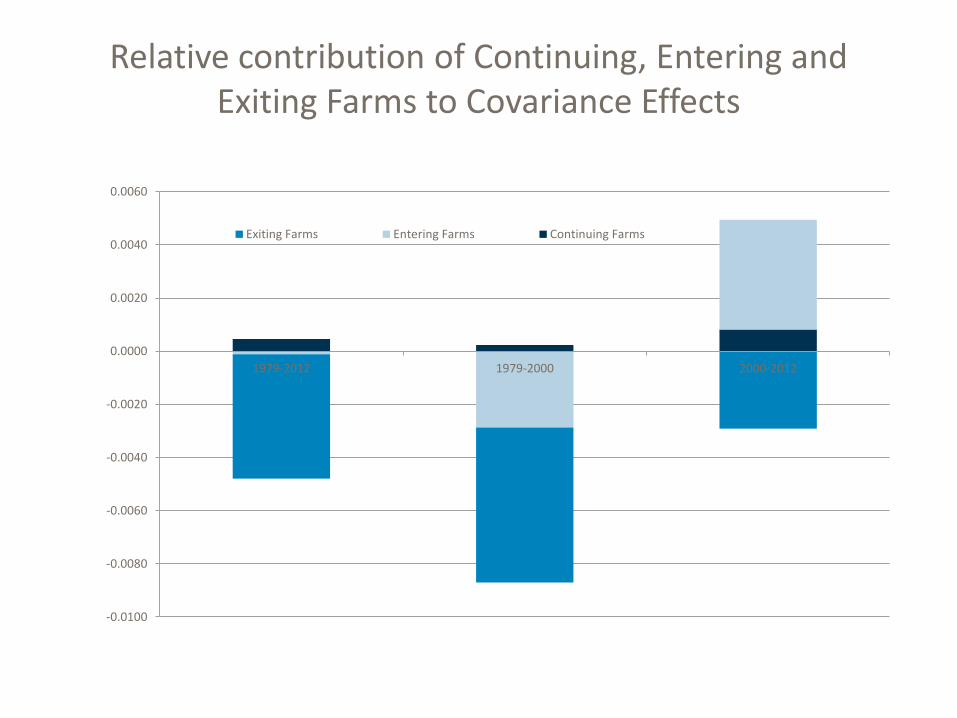
Relative contribution of Continuing, Entering and Exiting Farms to Covariance Effects
-0.0100
-0.0080
-0.0060
-0.0040
-0.0020
0.0000
0.0020
0.0040
0.0060
1979-2012 1979-2000 2000-2012
Exiting Farms Entering Farms Continuing Farms

Concluding Remarks
• Farm productivity measure is a useful tool for monitoring the effects of policy reforms on farm performance – In particular, when combining with decomposition analysis
• In Australian dairy industry, two findings are – Deregulation reform helps to maintain the industry-level productivity
growth
– Resource reallocation primarily come from farms’ enter and exit also contributes to this change.
• Agricultural productivity growth in Australian dairy industry depends more on the on-farm innovation system

OECD FLA Meeting
17 November 2014, Paris

Productivity & policy analysis: Problem identification
Department of Agriculture 22 19-20 June, Brisbane
Meeting of the G20 Agricultural Chief Scientists
Australia’s agricultural productivity growth has slowed...


