37
Practical Guide to Energy Efficient Design IEEE IAS San Francisco May 15, 2009 INTEGRATED DESIGN ASSOCIATES INC

Practical Guide to Energy Efficient Design
IEEE IAS San Francisco May 15, 2009
INTEGRATEDDESIGN
ASSOCIATESINC

Presentation OverviewSustainabilitySustainability FeaturesCase Study – Tahoe Center for Environmental StudiesCase Study – 1084 FoxworthyConclusions

Why Sustainable Design
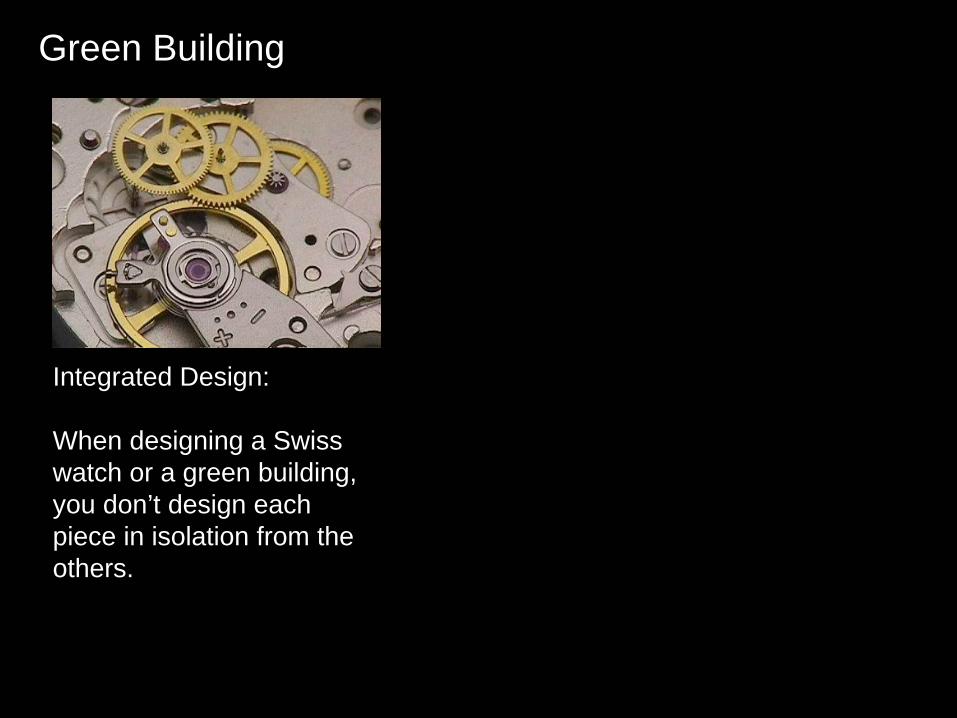
Green Building
Integrated Design:
When designing a Swiss watch or a green building, you don’t design each piece in isolation from the others.

Sustainable Design
Sustainability = No Waste

Sustainable DesignThe Engineering Paradox: Is it our education?
How Engineers are Taught….and design
Accept Givens
Perform Calculations
Create Details
Integrate with Project
A Collaborative Approach
Respond to Project Goals
Integrate Design with Project
Create Details
Perform Calculations
• Linear Solutions• Solves Engineer’s Problems• Textbook Approach• Safe for Engineer
• Solves Project’s Problems• Adds Value• Leads to Innovation• Riskier for Engineer• Requires Technical Expertise

Sustainable Features
Reuse material where possibleUse eco-friendly material Use less materialReduce Energy Usage/Maximize Efficiency

Reuse Materials
Building ReuseReuse electrical systems that have remaining life

Eco-Friendly Materials
Avoid PVCAvoid MercuryMaterials with lots of embedded energy
Courtesy Sylvania/Osram

Use Less Material
Use 480/277 volt where possible to limit wire sizeThink “wireless”Double usage - VOIP

Reduce Energy/Maximize Efficiency
Use Energy Efficient EquipmentControls to Minimize UsageBuilding OrientationThermal Envelope
Courtesy Wattstopper

Case Study – Tahoe Center for Environmental ScienceHigh efficiency light sourcesAstronomic time clocksTask/ambient lightingLight pollution reductionDaylight switching photosensorsDaylight dimming photosensorsPhotovoltaic systemsNatural Gas MicroturbineUpsized wiringHigh efficiency transformersEnergy star equipment Plug load controlsWireless dataVOIP

Case Study – Tahoe Center for Environmental Science
High efficiency light sources

Case Study – Tahoe Center for Environmental ScienceDaylight switching photosensorsDaylight dimming photosensors

Case Study – Tahoe Center for Environmental ScienceUpsized wiring
1. Larger wires = less resistance
2. Less resistance = less energy loss
3. Less energy loss = lower wire temperature
4. Lower wire temperature = less resistance (see #2)
Payback can be as low as 2 years!!
Courtesy: Copper.org
conductor size length resist/lf
resist (ohms) amps
loss (va)
conductor size length resist/lf
resist (ohms) amps
loss (va)
Row 1#12 80 0.00170 0.2720 12.0 39.17 #10 80 0.00105 0.1680 12.0 24.19#12 8 0.00170 0.0272 3.2 0.28 #10 8 0.00105 0.0168 3.2 0.17#12 8 0.00170 0.0272 2.4 0.16 #10 8 0.00105 0.0168 2.4 0.10#12 8 0.00170 0.0272 1.6 0.07 #10 8 0.00105 0.0168 1.6 0.04#12 8 0.00170 0.0272 0.8 0.02 #10 8 0.00105 0.0168 0.8 0.01
Row 2#12 10 0.00170 0.0340 8.0 2.18 #10 10 0.00105 0.0210 8.0 1.34#12 8 0.00170 0.0272 3.2 0.28 #10 8 0.00105 0.0168 3.2 0.17#12 8 0.00170 0.0272 2.4 0.16 #10 8 0.00105 0.0168 2.4 0.10#12 8 0.00170 0.0272 1.6 0.07 #10 8 0.00105 0.0168 1.6 0.04#12 8 0.00170 0.0272 0.8 0.02 #10 8 0.00105 0.0168 0.8 0.01
Row 3#12 10 0.00170 0.0340 4.0 0.54 #10 10 0.00105 0.0210 4.0 0.34#12 8 0.00170 0.0272 3.2 0.28 #10 8 0.00105 0.0168 3.2 0.17#12 8 0.00170 0.0272 2.4 0.16 #10 8 0.00105 0.0168 2.4 0.10#12 8 0.00170 0.0272 1.6 0.07 #10 8 0.00105 0.0168 1.6 0.04#12 8 0.00170 0.0272 0.8 0.02 #10 8 0.00105 0.0168 0.8 0.01
Total: 43.45 26.84
use: 12 hrs/day, 5 days/week Annual Loss 136 kwh Annual Loss 84 kwhcost of electricity: $0.12/kwh Annual Cost $16.31 Annual Cost $10.08light fixture: 3 lamp, 32w/lamp
Difference $6.24Payback 27 months

Case Study – Tahoe Center for Environmental Science
Biodeisel/Natural Gas MicroturbineGrid Tied – ElectricityWaste Heat – Hot WaterBiodeisel avoids releasing new carbon into atmosphere
Courtesy: Capstone

Case Study - 1084 FoxworthyHigh efficiency light sourcesAstronomic time clocksTask/ambient lightingIndividual occupancy sensor task lighting controlsOccupant sensor ambient lighting controlsMesopic lightingLight pollution reductionDaylight switching photosensorsDaylight dimming photosensorsPhotovoltaic systemsUpsized wiringElectro chromic glassHigh efficiency transformers
Energy star equipment Plug load controlsWireless dataVOIP

Case Study - 1084 Foxworthy
Reuse an existing building

Case Study - 1084 Foxworthy
High Efficiency Light Sources

Case Study - 1084 Foxworthy
Control Solar Heat Gain

Case Study - 1084 Foxworthy
17 fc ambient light level90% reflective paint83% reflectance ceiling tiles
Task Ambient Lighting
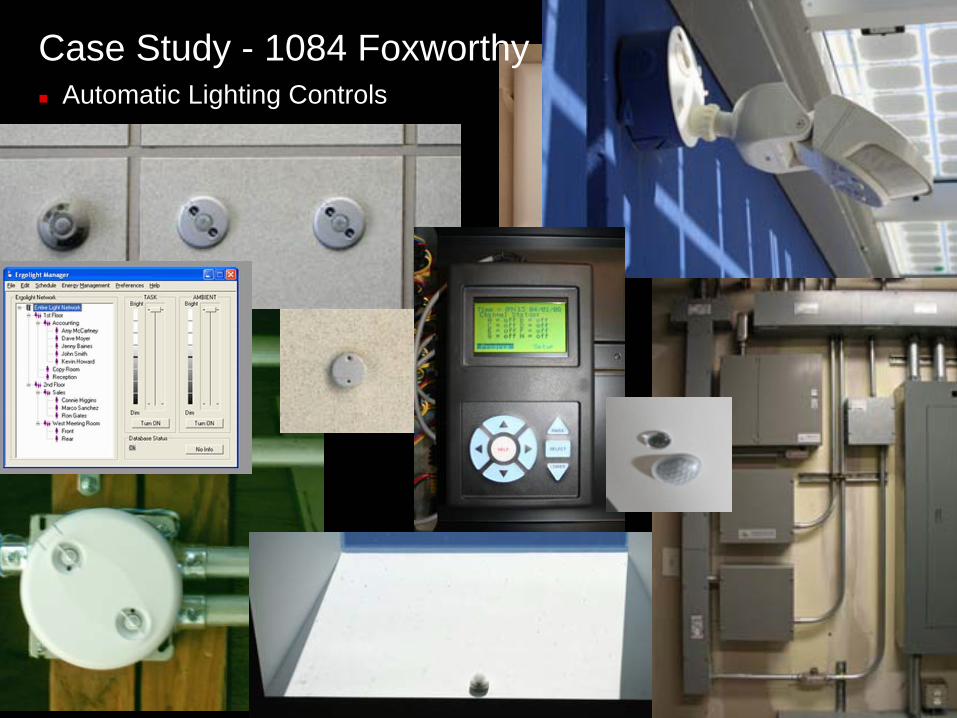
Case Study - 1084 FoxworthyAutomatic Lighting Controls
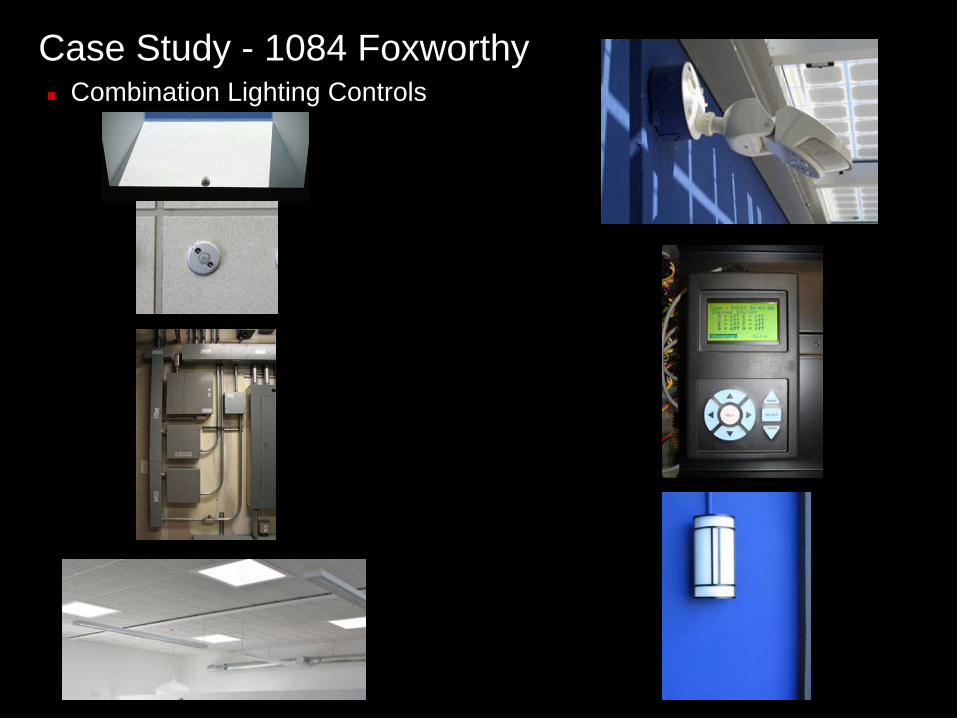
Case Study - 1084 FoxworthyCombination Lighting Controls

Case Study - 1084 FoxworthyMaximize Daylight and Views

Case Study - 1084 Foxworthy
14 16 22 30
65 6677 79 85 86 93 95 97 105 105
175
020406080
100120140160180200
Inca
ndes
cent
Low
Vol
tage
Hal
ogen
Line
Vol
tage
Hal
ogen
LED
Sta
ndar
d M
etal
Hal
ide
Com
pact
fluo
resc
ent
Pul
se S
tart
Met
al H
alid
e
Sta
ndar
d T-
12
Hig
h P
ress
ure
Sod
ium
Sta
ndar
d T-
8
Sta
ndar
d T-
5
T-5
Hig
h O
utpu
t
"Sec
ond
Gen
erat
ion"
T-8
lam
p
Low
Pre
ssur
e S
odiu
m
Sun
light
Sun
light
with
hig
h pe
rform
ance
glaz
ing
lum
ens
/ wat
t
Daylight Harvesting

Case Study - 1084 Foxworthy
High efficiency equipmentSoftware based shut offOccupancy based controls
Minimize Plug Loads

Case Study - 1084 Foxworthy
Security system circuit controls
Night Time Plug Load Shutoff

Case Study - 1084 Foxworthy
All electric buildingNet zero energyZero carbon emissions
Building Integrated Photovoltaics (BIPV)

Case Study - 1084 Foxworthy
Building is all electric - no CO2 is generated from burning natural gas.
Estimated annual energy consumption (DOE 2.1):54,000 kWh per year60% below ASHRAE 90.1 1999 Standards
PV Capacity: 30 kW, 54,756 kWh / year
PV’s sized to generate 100% of the net electrical load.
Analysis: Energy Use

Case Study - 1084 Foxworthy
PV Capacity 30 kW, 54,756 kWh / year
Estimated PV Cost:$255,000 installed cost ($8.50/watt)
-78,000 CEC rebate ($2.60/watt)34,206 tax on CEC rebate (35% fed tax, 8.854% state tax)
-76,500 30% federal tax credit-89,250 accelerated depreciation* (35% federal corp tax)$45,456 cost of system after 5 years
* calculation does not include the time cost of capital
the cost after rebates, tax credits and depreciation is about 20% of the installed cost.Energy savings at $ 0.16 / kWh = $8,760/yearPayback is about 5.2 years
Analysis: PV System Incentives

Case Study - 1084 Foxworthy
$20,000 97,500
38,000 45,500
$201,000241,000
$4,100,0006.2%
cost of upgraded glasscost of radiant mechanical system over
traditional system.cost of concrete for radiant floorcost of PV systems (after rebates and tax
incentives)
totaltotal with soft costs
total cost of buildingpremium to build a net zero energy building
Key differences from a conventional building:
Analysis: Estimated Additional Cost

Case Study - 1084 Foxworthy
Previous gas use - 460 therms @ 12.27 lbs CO2 / therm (1)*
Previous electricity use - 36,424 kWh @ 0.88 lbs CO2 / kWh (2)*
Automobile travel - 43,775 miles / 23 mpg (4) = 1903 gals @ 19.56 lbs CO2 / gal (3)*
Air travel - 35,484 miles @ 0.44 lbs CO2 / mile (5)*Total (lbs)
5,644
35,053
37,228
15,61393,538
(1) Carbon Trust, http://www.carbontrust.co.uk/KnowledgeCentre/conversion_factors/default.htm(2) EPA's eGrid database for calendar year 2000, emissions include adjustment for 9 percent line loss.(3) Energy Information Administration, http://www.eia.doe.gov/oiaf/1605/coefficients.html(4) Weighted average of reported employee vehicle mileage.(5) Carbon Fund, http://carbonfund.org/site/pages/calculator/category/Assumptions/*based on 2005 statistics
Analysis: Estimated CO2 previous (lbs)
Case Study - 1084 Foxworthy
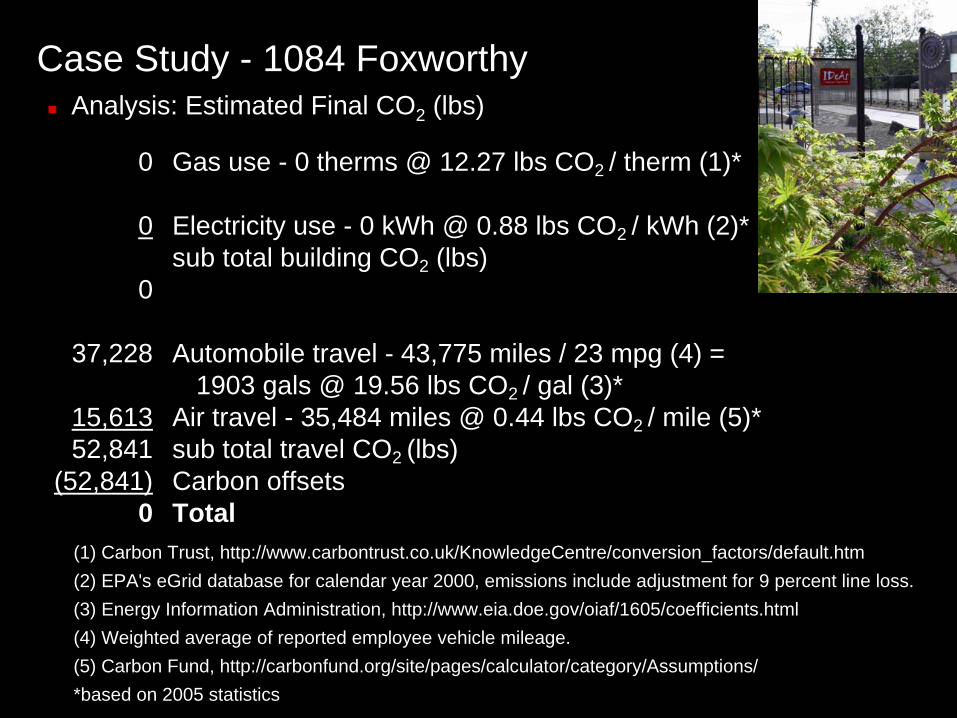
Gas use - 0 therms @ 12.27 lbs CO2 / therm (1)*
Electricity use - 0 kWh @ 0.88 lbs CO2 / kWh (2)*sub total building CO2 (lbs)
Automobile travel - 43,775 miles / 23 mpg (4) = 1903 gals @ 19.56 lbs CO2 / gal (3)*
Air travel - 35,484 miles @ 0.44 lbs CO2 / mile (5)*sub total travel CO2 (lbs)Carbon offsetsTotal
0
0
0
37,228
15,61352,841
(52,841)0
(1) Carbon Trust, http://www.carbontrust.co.uk/KnowledgeCentre/conversion_factors/default.htm(2) EPA's eGrid database for calendar year 2000, emissions include adjustment for 9 percent line loss.(3) Energy Information Administration, http://www.eia.doe.gov/oiaf/1605/coefficients.html(4) Weighted average of reported employee vehicle mileage.(5) Carbon Fund, http://carbonfund.org/site/pages/calculator/category/Assumptions/*based on 2005 statistics
Analysis: Estimated Final CO2 (lbs)

Lessons learned
Use simple user interfaces
Complex controls have complex commissioning
City planning staffs are behind on the green building curve
Using things for two purposes saves money
Using things for two purposes can have unintended results (heat pump as water heater)
drawn by Giselle, age 5.

Conclusions

Successful Green Projects
Minimize energy consumption first, size PV’s second.Look for LEED points after the design is completed. (The building will probably be Gold or Silver.)
Have a client who is committed to sustainability and willing to take risks.
Hire a team who is experienced in sustainable design.
Bring together the entire team during conceptual design.

One final thought:The scientific community has come to a consensus that
Global Warming is a real phenomenon...
Think about it.
America is one of the leaders in development of efficient building standards and technologies...
Buildings contribute nearly 50% of the CO2 generated in the US…
Imagine the impact we would have if all of our buildings were Z Squared.


