Research Collection Doctoral Thesis Integrated liquid cooling with heat reuse A new generation of energy efficient computers and photovoltaics Author(s): Zimmermann, Severin Publication Date: 2013 Permanent Link: https://doi.org/10.3929/ethz-a-009930419 Rights / License: In Copyright - Non-Commercial Use Permitted This page was generated automatically upon download from the ETH Zurich Research Collection . For more information please consult the Terms of use . ETH Library
Transcript
Research Collection
Doctoral Thesis
Integrated liquid cooling with heat reuseA new generation of energy efficient computers andphotovoltaics
born December 31, 1984citizen of Ennetburgen (NW), Switzerland
accepted on the recommendation of
Prof. Dr. Dimos Poulikakos, examinerDr. Bruno Michel, co-examiner
Dr. Manish K. Tiwari, co-examiner
2013
“It doesn’t matter how beautiful your theory is,it doesn’t matter how smart you are.If it doesn’t agree with experiment, it’s wrong.”
Richard Feynman, 1918−1988
iii
Abstract
The topic of this doctoral thesis is energy efficient electronic cooling using hotwater as coolant. The aim of the work is to provide a viable solution to re-duce the energy spent for cooling supercomputers and allow energy reuse forsecondary applications. A transition from air cooling to single phase liquid(water) cooling is proposed to master the challenge of ever increasing heatdissipation densities in electronic components. Due to its superior thermalcharacteristics over the traditional air cooling, single phase liquid cooling ofelectronic components is now a well-recognized and practically unavoidablealternative to address rising heat dissipation densities. The thermal conduc-tivity of water is by a factor of 24 higher and its volumetric heat capacityis by a factor of more than 3000 larger than that of air. Hence, the thermalresistance in water cooled solutions is reduced and the necessary temperaturedifferential for efficient heat removal is drastically lowered. The resulting re-duction in the required temperature difference between the coolant and theelectronics allows the use of hot water for efficient heat removal. The useof hot water enables heat removal by passive heat exchangers towards theambient or a secondary user of the heat. Therefore energy intensive chillerspreviously required to pre-cool the air become obsolete and the overall en-ergy spent for cooling is almost cut in half. A compact thermal model todetermine junction temperatures of microchips is developed and experimen-tally verified. The model is used to demonstrate that the application of aflow-control feedback loop could achieve a further reduction of the energyspent for cooling purposes. A microchannel manifold heat sink is used to ex-perimentally demonstrate the feasibility of hot water cooled electronics. Themicrochannel manifold heat sink under investigation is a realistic, scalabledesign of a water cooled heat sink which is already included in a prototypehot water-cooled IBM BladeCenter QS22 / HS22 cluster named Aquasar.Aquasar represents an important stepping stone toward energy-aware com-puting because it directly repurposes excess heat for the university buildings.It is shown that water temperatures as high as 60C are sufficient to cool mi-croprocessors with over 90% 1st law (energy based) efficiency. However, using
v
0. Abstract
only energy as a measure to identify the benefits of such a system can bemisleading because the quality of different kinds of energy is very different.Therefore, the system analysis has to be performed in terms of thermody-namic exergy which is a better reflection on the potential for energy reuse.An exergy analysis shows that a six fold rise in 2nd law (exergy based) effi-ciency is achieved by switching water inlet temperature from 30C to 60C. Ina second step, energy and exergy efficiencies of the whole Aquasar system areinvestigated to locate the major points of exergy destruction. The prototypealso has an air cooled part to help compare the coolant performances andthereby underscore the benefits of the hot water cooling approach. A heatrecovery efficiency of 80% and an exergetic efficiency of 34% are achievedwith a water temperature of 60C. Heat losses to the ambient and due to thepresence of air cooled components such as power supplies are the limitingfactor for both efficiencies. The resulting high exergy at the system outletis a measure of the potential usefulness of the waste heat of data centers.This waste could be used and help to design data centers with minimal car-bon footprint. A novel concept of economic value of heat was introducedto evaluate different reuse strategies such as space heating or refrigerationusing adsorption chillers. This new concept shows that the economic valueof the heat recovered from data centers can be much higher than its ther-modynamic value. Converting previously air cooled components to becomepart of the liquid cooling loop is the next step to completely eliminate air ascoolant in supercomputers. The feasibility of power supplies fully immersedin dielectric fluids is demonstrated experimentally as a part of this thesis.This allows the elimination of any air flow through the supercomputer anda direct connection to the server cooling loop in order to recover the heatdissipated in the power supplies.In a final step, the concept of hot water cooling is extended to cool photo-voltaic cells. The microfluidic features of manifold microchannel heat sinksused to cool processors are also ideally suited to cool photovoltaic cells. Therequirement of efficient heat removal is very similar in both fields. Therefore,an extension from hot water cooled electronics to hot water cooled photo-voltaics is straightforward. The benefits of advanced thermal packaging aredemonstrated through a receiver package consisting of a monolithic intercon-nected module which is directly attached to a high performance microchannelheat sink. The energy efficiency of the package increases four times when thethermal power is considered in addition to the electric power. An exergyanalysis of the photovoltaic cell underscores advantages of the new coolingapproach and concludes this thesis.
vi
Zusammenfassung
Energieeffiziente Kuehlmethoden auf der Basis von heissem Wasser sind dasThema dieser Doktorarbeit. Ziel dieser Arbeit ist es einen Weg aufzuzeigen,wie man die noetige Pumpenergie fuer Kuehlkreislaeufe reduzieren undgleichzeitig Abwaerme nutzbar machen kann.Ein Wechsel von Luft- auf Wasserkuehlung wird untersucht um die steigendenWaermestroeme in elektronischen Komponenten kontrolliert abzufuehren.Aufgrund der besseren thermischen Eigenschaften von Wasser (Waermeleit-faehigkeit und spezifische Waermekapazitaet) sind Wasserkuehlungen in vie-len industriellen und Technologischen Prozessen eine bereits anerkannte Al-ternative zu Luftkuehlungen. Ein Wechsel zu Wasserkuehlung wird daherauch in der Computerindustrie unvermeidbar werden. Der Waermewidder-stand von Wasserkuehlungen ist bedeutend geringer, so dass grosse Waer-memengen mit einem relativ kleinen Temperaturunterschied zwischen Chipund Kuehlmittel abgefuehrt werden koennen. Der verkleinerte Waermeun-terschied erlaubt den Einsatz von heissem Wasser (60C) als Kuehlmittelfuer eine effiziente Waermeabfuhr. Die Waerme in Heisswasser-Kuehlungenkann mit Hilfe von passiven Waermetauschern an die Umgebung oder aneinen Abwaerme-Nutzer abgegeben werden. Dadurch wird der Einsatz vonenergieintensiven Kaelteanlagen ueberfluessig und der Energieverbrauch desKuehlkreislaufes wird in etwa halbiert.Ein thermisches Modell fuer die Bestimmung von Chiptemperaturen wurdeentwickelt und experimentell verifiziert. Das Modell wird benutzt um zudemonstrieren, dass eine Massenfluss-Koppelung an die Rechnerleistung eineweitere Reduzierung des Energieverbrauchs zur Folge hat. Ein Mikrokanal-kuehler mit integriertem Verteilersystem dient Beispiel fuer die Demonstra-tion der experimentellen Umsetzbarkeit einer Heisswasser-Kuehlung von elek-tronischen Komponenten. Dieser Kuehler benutzt ein skalierbares Design,welches schon im ersten Prototyp eines Heisswasser gekuehlten Rechenzen-trums verwendet wird. Der Prototyp heisst Aquasar und repraesentiert einenwichtigen Entwicklungsschritt zu einer besseren Energiebilanz in Rechenzen-tren durch die Nutzung der Abwaerme fuer die Gebaeudeheizung: Wassertem-
vii
0. Zusammenfassung
peraturen bis 60C genuegen um Prozessoren zu kuehlen und gleichzeitig90% der abgefuehrten Waerme zur Wiederverwendung bereitzustellen. DieBetrachtung der Energieeffizienz alleine ist jedoch irrefuehrend, da die Qual-itaet der Abwaerme stark temperaturabhaengig ist. Die thermodynamischeGroesse Exergie beurteilt die Qualitaet verschiedener Energieformen und istdeshalb ein besseres Mass fuer die Wiederverwendbarkeit der Abwaerme.Eine Exergie-Analyse zeigt eine sechsfache Steigerung der Effizienz durch denWechsel von Wasser bei 30C zu Wasser bei 60C. In einem zweiten Schritterfolgt sowohl eine Energie als auch eine Exergie Analyse des gesamtenAquasar-Systems um Orte moeglicher Exergie-Vernichtung zu identifizieren.Das Aquasar-System hat auch einen luftgekuehlten Teil um einen Vergle-ich der beiden Kuehlsysteme zu erleichtern und so die Vorteile einer Heis-swasserkuehlung zu unterstreichen. Eine Waermerueckgewinnung von 80%und eine Exergie-Effizienz von 34% wurden bei Wassertemperaturen um 60Cerreicht. Waermeverluste an die Umgebung und die Praesenz eines luft-gekuehlten Teils im System waren die limitierenden Faktoren, welche bessereEffizienzen verhinderten. Die erhoehte Exergie ist ein gutes Mass fuer dieNuetzlichkeit der Abwaerme von Rechenzentren. Die Wiederverwendbarkeitder Abwaerme ist ein wichtiger Schritt in Richtung eines Rechenzentrumsmit minimaler CO2 Bilanz. Ein neues Konzept fuer den oekonomischenWert der Abwaerme fuer verschiedene Wiederverwendungsarten (Gebaeude-heizung, Entsalzung oder Adsorptionskuehler) wird eingefuehrt. Das Konzeptzeigt, dass der oekonomische Wert der Abwaerme wesentlich hoeher sein kannals der thermodynamische gegeben durch Exergie.Die Energie-Effizienz von Rechenzentren kann verbessert werden, in demzuvor noch luftgekuehlte Komponenten wie zum Beispiel Netzgeraete umge-wandelt und den Wasserkreislauf angehaengt werden. Die Moeglichkeit eineskomplett in Mineraloel eingetauchten Netzgeraetes wird experimentell demon-striert. Es wird gezeigt, dass dieses ueberarbeitete Netzgeraet einwandfreifunktioniert und seine Abwaerme direkt an den Wasserkreislauf abgebenkann. Dadurch kann der restlichen Luftfluss in Supercomputer reduziertund die Rueckgewinnung der Abwaerme gesteigert werden.In letzten Schritt wir das Konzept von Heisswasserkuehlung von elektron-ischen Komponenten auf die Photovoltaik ausgeweitet. Die Anforderungenvon Mikroprozessoren und Photovoltaik-Zellen sind sehr aehnlich, dadurchlassen sich die gewonnen Einsichten direkt uebertragen. Die Vorteile derVerbindung einer Photovoltaik-Zelle und eines Hochleistungskuehlers wer-den demonstriert. Die Energie-Effizienz einer solchen Verbindung ist viermalhoeher als die Effizienz der Photovoltaik-Zelle alleine. Eine Exergie-Analysedes neuen Systems unterstreicht die Vorteile und bildet den Abschluss dieserDoktorarbeit.
viii
Acknowledgements
This thesis would never have been possible without the support and help ofmany people. Within this project I had the privilege to be a member of twodifferent groups - the Laboratory of Thermodynamics in Emerging Technolo-gies (LTNT) at ETH Zurich and the Advanced Thermal Packaging (ATP)group at IBM Research Laboratory Zurich.
Above all, I would like to thank my advisor Professor Dimos Poulikakos forhis continuous support and his trust in me. His ability in creating such anextraordinary work environment within the LTNT group and the flexibilityto pursue different ideas allowed me to mature personally and scientifically.
I would also like to express my sincere gratitude to my co−examiner Dr.Bruno Michel for giving me the possibility to be a part of the ATP groupat the IBM Research Laboratory Zurich and for his helpful discussions andnumerous ideas.
Many thanks also go to Dr. Manish K. Tiwari for his supervision of theproject. His scientific advice and countless ideas have been a great contribu-tion to the project and the LTNT group in general.
I would like to thank Ingmar Meijer for the same job for the IBM Researchpart of my work. His inputs and ideas were crucial for this project.
At this point I want to thank Andreas Mueller, because he is the one whoencouraged me to apply for a PhD in mechanical engineering with a back-ground in theoretical physics. I never regretted taking this step, which wouldnot have been possible without him. Our epic squash battles once a weekare very much appreciated. Thank you!
Another special thanks goes to my office mates Yassir, Anastasios, Bercan,Ashish and Shyam. Thanks to you guys, I was never unmotivated to come
ix
0. Acknowledgements
to the office (even on weekends from time to time).
Throughout the course of my PhD I have greatly benefited from discussionand assistance of all former and present members of both groups. All of themcontributed to a great working climate which was appreciated a lot.
Further I would like to acknowledge the technical support provided by StephanParedes, Ute Drechsler, Bruno Kramer and Jovo Vidic. Especially StephanParedes was involved in all of my projects and contributed with helpful sug-gestion to all challenges faced during my PhD. I want to thank Sandra Schnei-der, she was the heart and soul of the office, nothing administrative wouldhave functioned properly without her.
I highly appreciate the contribution of my bachelor and master’s students:Florian Ott, Alexander David and Dominic Gschwend.
I would like to thank all my other colleagues who always supported me andcheered me up in difficult times.
I also want to acknowledge the financial support by the ETH Zurich, bythe IBM first-of-a-kind program, and by the Swiss Center of Competence forEnergy and Mobility (CCEM).
Zuletzt moechte ich auch meinen Eltern und meinen Geschwistern danken.Sie haben mich in jedem noch so verrueckten Vorhaben unterstuetzt. OhneIhre Unterstuetzung waere ich nie soweit gekommen, dafuer bin ich Ihnenfuer immer dankbar.
The present thesis depicts a fundamental investigation into energy awarecomputing to address future challenges in data centers. Efficient coolingtechniques and potential energy reuse are critical components to contributeto a solution for global energy problems.
1.1 Context
Production and consumption of energy play a fundamental role in human lifebecause they are essential for survival. The human body depends on chem-ical energy from food to produce the mechanical energy needed for workingmuscles. The creativity of the human mind enabled people to overcome thephysical limits of the human body to produce mechanical energy through theinvention of tools to harness energies outside their own bodies. Most socialstructures such families, clans and villages focused mainly on generating,processing and exchanging organic energy sources. Most people acknowl-edge that energy is the key to the advancement of civilization leading to thesteadfast formula:
energy = progress = civilization[1]. (1.1)
Throughout the history humans tried to control the energy stores and flowsthat are part of nature. The earliest tools to harness energy were axes, picks,plows etc. to hunt animals, harvest edible plants or chop firewood. Besidestheir own muscle power people relied on the power of domesticated animalssuch as horses and oxen to create agricultural fields and transportation net-works. Windmills and waterwheels were the first technologies that allowedpeople to harness power from natural resources. Especially water hydropower
1
1. Introduction
was used extensively for early industrial processes resulting in a gradual re-duction of the dependence on human and animal powers. In the meantimewind power was used to drive sailing ships across the oceans establishing thelink between America and Europe. By the time of the Industrial Revolutionalmost the entire industry was relying on water power. The only problem ofwater power was its geographical inflexibility. The invention of the steam en-gine by Thomas Savery and James Watt overcame this limitation and provedto be more economically efficient. Fossil resources such as wood, coal or oilbecame very important for industrialization because they were used as fu-els for the steam engines. The invention of the steam engine established apermanent connection between power generation and fossil fuels which stillexists today. Waterwheels and steam engines provided power to local facili-ties, however the transmission of power over long distances was not possible.Electrical power generation through electromagnetic induction spearheadedby Thomas Edison and Nicolas Tesla allowed the creation of power networks.Electricity soon began replacing gas as source for indoor and outdoor light-ing, wood and coal in heaters in homes and steam engines in street railways.The invention of electric powered machinery for industrial processes createda major demand for this new method of transmitting energy. Electricity isomnipresent as energy carrier since the twentieth century. The efficiency ofelectrical power generation though hydropower and fossil fuel driven steamengines continuously improved to match the increasing energy demand of thesociety. This kept the cost of electric power low leading to even higher con-sumption of electricity. However, in the middle of the twentieth century theenergy demand exceeded the generation and forced people to look for newfossil fuels to be harnessed. Electrical power generation through controllednuclear fission, as first proposed by Enrico Fermi, showed tremendous po-tential to solve world’s energy problem. However, harnessing nuclear powerproved to be dangerous shown by a disaster in Tschernobyl where failures inthe core cooling system caused an explosion and a release of large quantitiesof radioactive particles into the atmosphere spreading over much of WesternUSSR and Europe. Similar events in Fukushima caused by a tsunami andseveral earthquakes demonstrated that the safety of such a nuclear powerplant is a crucial aspect to be taken care of. The safety aspect in combina-tion with the unsolved problem of the permanent disposal of nuclear wastepushes people to look for other energy sources. Renewable energy sourcessuch as solar, wind and biomass are promising technologies, but their effi-ciency has to be significantly enhanced to meet the energy demand of today’ssociety.Nowadays energy from fossil fuels accounts for over 70% of the world en-ergy usage [2]. Unfortunately, energy generation based on burning of fossil
2
1.1. Context
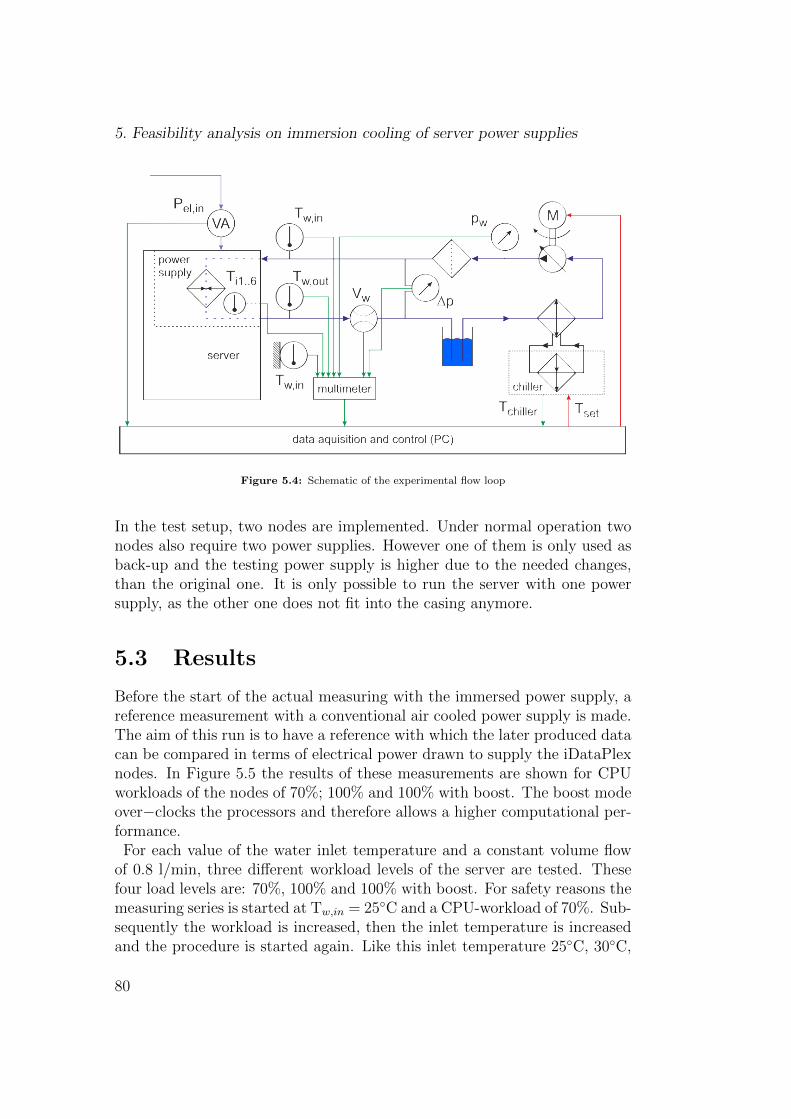
fuels has caused an increase in carbon dioxide (CO2) and other greenhousegases leading to a global warming effect. Additionally fossil fuels as naturalresource are limited; the ever increasing consumption is driving the energyprices severly up. Global efforts for raised energy awareness and the reduc-tion of CO2 emissions are needed. The international panel on climate change[3] and the protocol [4] are the first steps along the way to find a solution forglobal warming.The information and communication technology (ICT) industry will play animportant role in the future reduction in the worldwide energy consumption.The common trend towards virtualization in industry results in more efficientprocesses, but it also generates an enormous amount of data to be handled.This increased demand in combination with our daily life being more andmore dependent on computer applications has resulted in the ICT industryhaving yearly growth rates of more than 7% for the last two decades . This isequivalent to a doubling of this sector every decade. Today the ICT industryis a major energy consumer accounting for 2% of the global energy consump-tion. Data centers in particular experienced a boom with a 15% annualcapacity increase [5]. An effort to reduce CO2 emissions by designing moreefficient data centers is desirable because their electricity consumption is sig-nificant on a global scale. Detailed studies on energy consumption in datacenters showed that almost 50% of the energy is spent for cooling purposes[6]. These data centers use circulated air to cool the electronic components.However, a big temperature difference between the electronics and the air isneeded to remove the heat because of high thermal resistance in air cooleddata centers (see Figure 1.1). The thermal resistance is dominated by the low
Figure 1.1: Deailed energy budget for a typical data center [7].
volumetric heat capacity and thermal conductivity of air. Therefore preciousenergy has to be invested in chillers to cool the air below ambient temper-ature. Cooling technologies based on water instead of air allow a massive
3
1. Introduction
reduction of the thermal resistance because of the better themophysical val-ues of water as coolant. Such a reduction of the thermal resistance allows amuch lower temperature difference between the electronics and the coolant.As a result coolant temperatures can be raised above the free cooling limiti.e. the point at which the coolant does not require any pre-cooling. Hence,expensive chillers become obsolete and running costs for data centers are cutin almost half. The next step to get a major increase in the energy efficiencyof a data center is the idea of a thermal energy reuse.The first law of thermodynamics, based on experiments of James PrescottJoule and others, states that energy is always conserved [8]. Thus, the energyconsumed as electricity by the electronic components of a data center will beavailable as heat that needs to be removed. Depending on the choice betweendifferent cooling techniques three different scenarios become possible:
50% of the overall energy budget is spent for pumps and chillers
No additional energy for chillers is needed because free cooling is pos-sible
A significant part of the otherwise wasted energy can be reused forsecondary applications
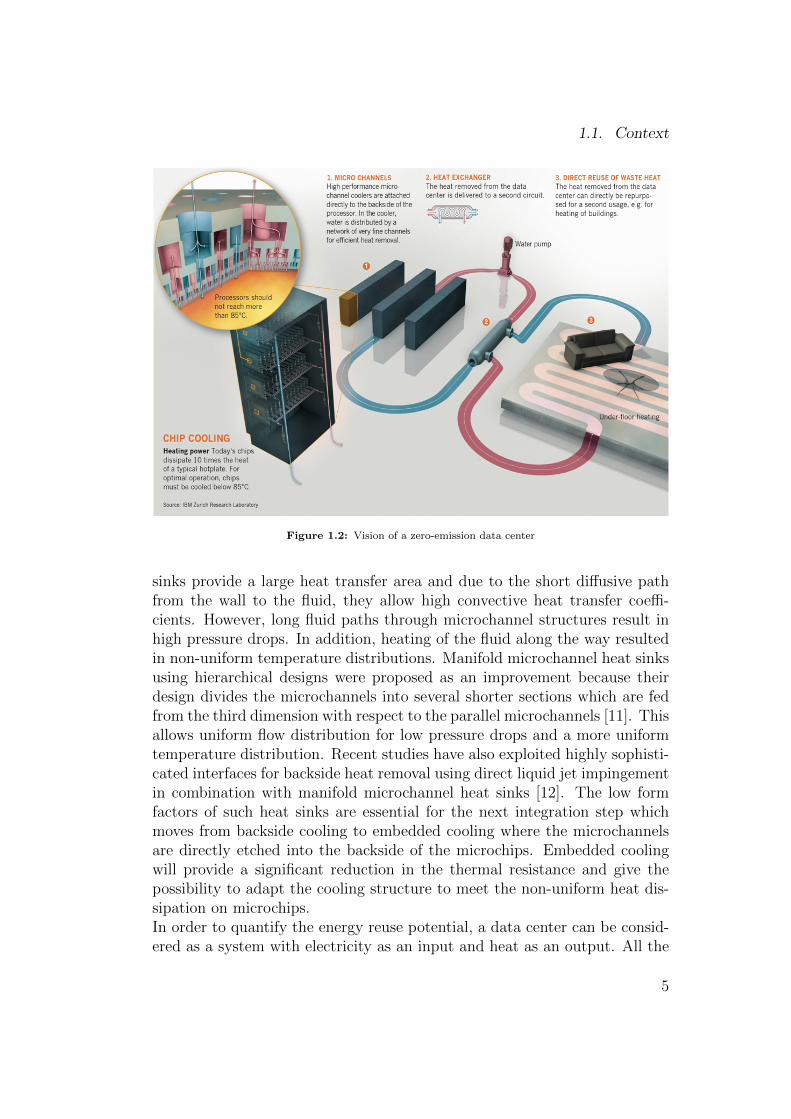
The first two options have already been realized for data centers, whereasfor the third option there are still open questions about possible recoveryefficiency, hardware costs, reliability limitations or type of reuse scheme. Avision of a zero-emission data center is shown in Figure 1.2. From a scientificpoint of view questions about efficient heat removal and the energy reusepotential are the most interesting.Efficient heat removal is crucial especially for microprocessors because theydissipate most of the heat in a data center. Air cooled heat sinks have largeform factors to provide the necessary heat exchange area. For example, thestandard heat sinks in blade server have heights of 30 mm. Air cooling solu-tions are generally inefficient and their large form factors limit the integrationdensity in IT equipment. However, the performance increase of microproces-sors traditionally follows Moore’s law [9] by shrinking the size of transistorsso that an increasing number of transistors could be placed per unit areaon a single chip. Over the last few years the increasing device density ledto an increased power density because the transistor switching voltage couldnot be reduced fast enough. The resulting higher heat dissipation densitiesrequire new cooling approaches such as those based on liquids as coolants.Tuckerman and Pease were the first to introduce the idea of using watercooled microchannels to cool electronic components [10]. Microchannel heat
4
1.1. Context
Figure 1.2: Vision of a zero-emission data center
sinks provide a large heat transfer area and due to the short diffusive pathfrom the wall to the fluid, they allow high convective heat transfer coeffi-cients. However, long fluid paths through microchannel structures result inhigh pressure drops. In addition, heating of the fluid along the way resultedin non-uniform temperature distributions. Manifold microchannel heat sinksusing hierarchical designs were proposed as an improvement because theirdesign divides the microchannels into several shorter sections which are fedfrom the third dimension with respect to the parallel microchannels [11]. Thisallows uniform flow distribution for low pressure drops and a more uniformtemperature distribution. Recent studies have also exploited highly sophisti-cated interfaces for backside heat removal using direct liquid jet impingementin combination with manifold microchannel heat sinks [12]. The low formfactors of such heat sinks are essential for the next integration step whichmoves from backside cooling to embedded cooling where the microchannelsare directly etched into the backside of the microchips. Embedded coolingwill provide a significant reduction in the thermal resistance and give thepossibility to adapt the cooling structure to meet the non-uniform heat dis-sipation on microchips.In order to quantify the energy reuse potential, a data center can be consid-ered as a system with electricity as an input and heat as an output. All the
5
1. Introduction
electricity is converted to heat according to the first law of thermodynam-ics, because energy is a conserved quantity. This conversion from electricityto heat is an irreversible process and it leads to entropy generation. Irre-versibility implies that the process has a predefined direction and the initialstate before the process cannot be restored without investment of additionalenergy. In reality all processes are irreversible, for example, heat can only bespontaneously transferred from a hot body to a cold one. The inversion ofthis process, which is common in refrigerators, needs additional energy. En-tropy is extensive thermodynamic property that is a measure of the degreeof disorder in a system. The process quantity entropy generation was in-troduced to describe the grade of irreversibility of a process. Processes thatgenerate more entropy also require more additional energy to be reversed.The concept of entropy is important for the formulation of the second law ofthermodynamics which states [8]:“It is impossible for any system to operate in a way that entropy is de-stroyed.”The application of the second law to heat engines in general was summarizedin the Kelvin Planck statement [8]:“It is impossible for any system to operate in a thermodynamic cycle anddeliver a net amount of energy as work to its surroundings while receivingenergy by heat transfer from a single thermal reservoir.”In the specific case of a data center this means that not all the heat can beconverted back into electricity or mechanical work. Therefore, the generalterm energy was split into exergy and anergy which respectively describethe usable and unusable part of the total energy. Exergy, like entropy, is anextensive thermodynamic quantity which describes the maximal amount ofwork that can be extracted from a system by bringing it to equilibrium withits environment. Exergy is never negative because the difference (thermal,chemical etc.) between a system and its surroundings is always exploitable toproduce work. The higher the difference between the system and its environ-ment the more work can be extracted. Exergy and entropy play an antipodalrole in thermodynamics with entropy destruction and exergy generation be-ing impossible. High-valued energy such as electricity and mechanical workconsists of pure exergy. However, heat has a lower exergy because it has avery limited conversion potential. The assessment of the exergetic contentof heat is done by performing a thought-experiment with a Carnot heat en-gine operating between two temperature reservoirs. The temperature of thehot reservoir is given by the temperature level of heat whereas the secondtemperature reservoir is the environment. The Carnot heat engine takes theheat from the high temperature reservoir as input and transfers work andheat to the cold temperature reservoir as output. An energy balance of this
6
1.2. Problem statement
cycle yields the following thermal efficiency:
ηth =produced work
heat input=Wcycle
Qin
=Qin −Qout
Qin
= 1− TcoldThot
(1.2)
Hence, the exergetic quality of the heat is only a function of its temper-ature difference to the ambient; the higher the temperature level of the heatthe higher its exergy. If the temperature level of the heat is lower than theambient, one can consider a reversed Carnot heat engine where the role ofthe environment is switched to being the hot temperature reservoir.Exergy analysis for data centers mainly focuses on the identification of sourcesof exergy destruction [13]. Common sources for exergy destruction in a datacenter are the conversion from electricity to heat, heat transfer across a finitetemperature differential and frictional losses. The minimization of exergy de-struction in such systems will result in more environment-friendly computingand will open new possibilities for the reuse of its significant waste heat.However, considering only the exergy content of heat from data centers ismisleading because there may be reuse schemes which do not require a con-version back to mechanical work. The actual value of the heat has to beassessed based on the individual reuse applications selected. Potential reuseavenues include space heating, refrigeration or desalination. Each strategyassigns a different value to the heat based on its own working conditions.
1.2 Problem statement
The scope of this work is to demonstrate a new cooling approach that re-sults in a reduction of the energy spent for cooling in supercomputers andallow energy reuse for secondary applications. A systematic energy and ex-ergy analysis is performed to underscore the benefits which could lead to aneventual zero-emission data center.
1.3 Thesis outline
The main goal of this thesis is to demonstrate a new cooling approach basedon hot water to enhance energy efficiency in data centers. Hot water ascoolant allows multiple reuse strategies to enhance the value of heat comingfrom data centers. This thesis is divided into seven main chapters includingthis introductory chapter (Chapter 1). The bulk of the authors PhD work iscontained in Chapters 2 through 6.Chapter 2 presents a compact thermal model to determine junction temper-atures of a chip cooled by hot water. The model is verified experimentally
7
1. Introduction
and used to demonstrate that the application of a flow-control feedback loopcould achieve a reduction in water flow rate without compromising allowableindustrial specifications of maximum chip temperature.In chapter 3 an experimental study on exergetically efficient electronics cool-ing using hot water as coolant is reported. Water temperatures as high as60C are shown to be sufficient to cool microprocessors with a high first law(energy based) efficiency. An exergy analysis demonstrates that an increasein second law (exergy based) efficiency can be achieved by switching thehigher coolant temperatures. The benefits of hot water cooling are under-scored by the introduction of a new metric for the economic value of therecovered heat.Chapter 4 focuses on the first hot water cooled supercomputer prototypebuilt through a collaboration of ETH Zurich and IBM Research. The pro-totype system is thoroughly investigated for its energy and exergy efficiency.Important data center metrics are evaluated to underline the advantages ofhot water cooling. The system features a reuse strategy based on space heat-ing.Chapter 5 presents the next step to enhance energy efficiency by expandingthe new cooling approach to components that were previously air cooled suchas the power supply. Full immersion of the power supply in a dielectric fluidis tested to allow a connection to the server cooling loop.In chapter 6 the concept of hot water cooling is extended from electroniccooling to thermal management of photovoltaic devices. Hot water coolingallows to harness electricity as well as thermal energy to boost the overallperformance of such devices.Chapter 7 concludes this thesis by summarizing the main achievements andoutcomes of the current work, as well as proposing an outlook for suggestedfuture research.
8
Chapter 2
Compact thermal model for thetransient temperatureprediction of a water cooledmicrochip module in lowcarbon emission computing
This chapter has been published as:A. Kubilay, S. Zimmermann, I. Zinovik, B. Michel, and D. Poulikakos, “Com-pact thermal model for the transient temperature prediction of a water-cooledmicrochip module in carbon emission computing”. Numerical Heat Transfer,Part A, vol. 59, pp. 815−835 (2011).
2.1 Introduction
Recent developments in the high performance computer industry are char-acterized by an ever-increasing computational power, a strong demand forhigher energy consumption and, as a direct result, by the pressing need tore-use the large amounts of thermal energy generated in data centers. Animportant strategy regarding energy reuse is the use of novel heat sink con-cepts at the chip level to make available the thermal energy at as high aspossible temperature (end therefore exergy) levels. To this end, a portion ofthe energy of the hot water removed by the heat sink after chip cooling issubsequently used for another heating application (process industry, districtheating etc). After this, the resulting lower temperature “warm” water isintroduced back to the inlet of the heat sink as the “coolant”. Such heat
9
2. Compact thermal model for the transient temperature prediction of awater cooled microchip module in low carbon emission computing
sinks and the associated electronics operate apparently at elevated tempera-ture levels but still within allowable thresholds. It is important to note thatin this new energy conscious strategy, the elimination of chillers alone (usedtraditionally today to cool the air before entering the heat sink) results insignificant energy savings [14].Nowadays, heat management at the board and system levels is extended fromthe processors to various electronic parts including main memory, integratedcircuits, power converters, and ethernet switches. The growing complexityof energy-aware design requires development of models and software designtools, which enable both the reliable as well as time efficient virtual deter-mination of important performance parameters (such as temperature) at allcomponent, board and system levels.Since the nineties, compact thermal modeling was employed to predict thethermal behavior of electronic components and systems. This modeling ap-proach focuses on the simulation of a limited set of the system parameters,which are of interest within a particular design context, and relies on wellthought out approximations of the related heat transport phenomena. Adetailed review of the large number of compact models reported in litera-ture is beyond the scope of this introduction. Instead, we will mention onlyrepresentative examples reflecting different levels of complexity in the fieldof compact thermal modeling. The system level thermal models utilize theelectro-thermal analogy, where a thermal resistance coefficient is attributedto every board component [15] and the system is considered as a networkof thermal resistors. This approach is essentially zero-dimensional and eachelectronic part is characterized by a single temperature value. The needfor evaluation of spatially non-uniform temperature distributions initiatedthe development of models that solve numerically the steady-state three-dimensional heat conduction equation in every element of the simulated sys-tem. In these models, the speed-up of the solution process compared to thegeneral finite volume and finite difference algorithms is achieved by fine tun-ing the algebraic solvers which take advantage of the simple block geometryof electronic components and their layered structure with constant heat con-ductivity within every layer [16].When the microelectronic packages are part of a server, the heat fluxes gen-erated by the components change over time due to variation of the computa-tional load on the server. In the simulations, the time dependent temperatureprofile of the components is usually obtained from a numerical solution of thetransient heat conduction equation. In the compact model, computationalefficiency is facilitated by reducing the problem complexity by a partial dis-cretization of the heat conduction equation [17, 18]. In this approach, spa-tial derivatives of the equation are approximated using finite differences on
10
2.1. Introduction
a relatively coarse grid representing the geometry of the package while timederivatives are left intact. Thus, the heat conduction problem is reduced toa set of ordinary differential equations (ODE) simulating the temperatureevolution in the grid nodes, which correspond to the rectangular blocks ofthe domain discretization. High computational efficiency of the model is dueto the following factors: 1) the ODE system is a sparse matrix and 2) sinceheat conductivity coefficients are assumed to be constants, the equations arelinear. The accuracy of the ODE thermal modeling of electronic componentsystems is analyzed in reference [19]. This investigation concludes that de-pending on the problem under study, the limited accuracy of the model maystill be sufficient for the thermal analysis of the system in question. It is alsoshown that finer discretization of the computational domain approaches theresults of finite difference and the finite element models.Increasing attention to energy re-use and to minimization of the overall sys-tem level carbon footprint led to approaches which combine the resistor net-work model for solid elements with detailed simulations of heat convectionand fluid flow in the heat sinks. While this multi-domain modeling proved tobe a successful method for steady state analysis [20, 21], the solution of tran-sient Navier-Stokes equations as a part of a package thermal model remainsprohibitively time consuming to be used as an efficient method for designpurposes. A hybrid approach combining the ODE thermal model with anapproximate treatment of the fluid dynamics problem is suggested in refer-ence [22] for three dimensional stacked integrated circuits. In this hybridmodel, hydrodynamic and thermal layers in a set of parallel channels of theheat sink are assumed to be laminar, fully developed and can be describedwith the corresponding correlations for the Nusselt number and the frictioncoefficient. The suggested simplifications allowed for a reduction of the heatconvection partial differential equations to a set of ODEs similar to the equa-tions use in the thermal ODE model. In the simulations [22], the computedjunction temperature compared very well with the results of a commercialCFD finite volume solver for the corresponding conjugate heat transfer prob-lem.Miniaturization of electronic components leads to ever increasing heat fluxeswhich will soon render already energy inefficient traditional cooling methodsfor data centers such as those based on forced air convection [23]. Switchingto liquid cooling addresses both challenges by rendering most of the addi-tional components for air cooling such as computer room air conditionersobsolete and reducing the thermal resistance by at least a factor 5 [24]. Theconcept of liquid cooling is now well established in literature starting from thework of Tuckerman and Pease [10] with steady progress accomplished sincethen in the thermal performance of the heat sinks. Manifold micro-channel
11
2. Compact thermal model for the transient temperature prediction of awater cooled microchip module in low carbon emission computing
heat sinks using a hierarchical design to supply and collect the coolant frommicro-channel structures are proposed as an improvement in Escher et al.[12, 25] who optimized the manifold and the micro-channel design for anultra-thin heat sink.Liquid cooling with high coolant temperature improves the exergetic effi-ciency and enables energy re-use as mentioned earlier. Such an energy re-usestrategy can minimize the overall system level carbon footprint by reducingthe power consumption of a data center and eliminating the requirement offossil fuels for building heating [26]. In reference [27], this concept was ex-plored experimentally by demonstrating the feasibility of hot water cooledelectronics as a strategy to reduce the carbon footprint of data centers andalso enhance the exergetic efficiency of the cooling unit. CFD simulations[28] showed that the complicated hierarchical structure of a microchannel(MMC) heat sink induces a flow field with high turbulent intensity accom-panied by an increased pressure drop.A high pressure drop across the heat sink requires adequate increase of waterpumping power. Therefore, a promising measure to further reduce the energyconsumption of water cooled servers is to tailor the water pumping powerto time dependent heat generation in the chips which are running softwareapplications. The prediction of the performance of such new generation heatsinks, demands efficient compact thermal models that are able to simulatethe temporal evolution of the packages during relatively long time spans typ-ical for running server software. The goal of the present study is to developand experimentally validate such compact model of the heat transfer in anMMC heat sink for time efficient simulations of the transient temperatureduring run-time of typical software applications.. The model is also appliedfor simulations of a flow rate controller with chip power traces typical forruns of a compiler and a session of an internet browser.
2.2 Model Development
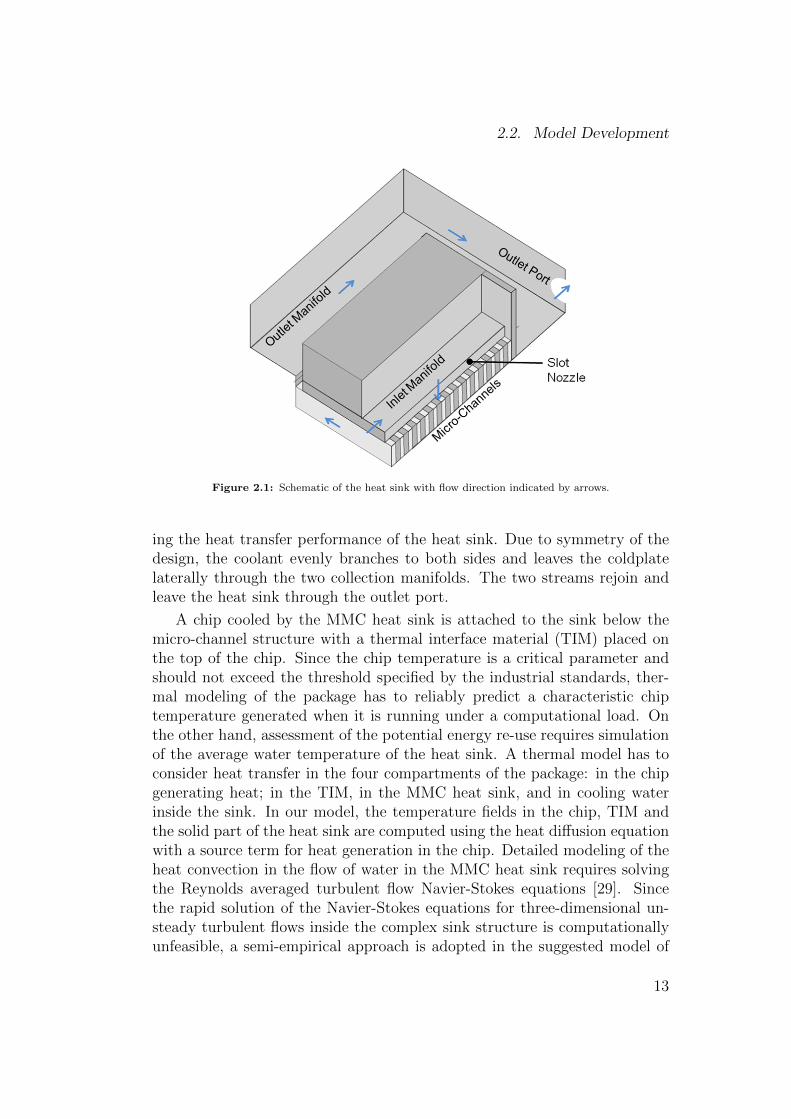
The specific heat sink modeled herein was manufactured for IBM by Wolver-ine Tube Inc., Huntsville, USA. The heat sink is described in detail elsewhere[27, 28] and consists of a micro-channel coldplate connected to a manifoldlayer, which is oriented perpendicular to the micro-channels in the coldplate.The MMC heat sink is shown schematically in Fig. 2.1 where the blue arrowsdepict the direction of the coolant water flow: the coolant water is fed cen-trally into the inlet manifold, from which it is directed to the micro-channelstructure through a slot nozzle at the bottom wall of inlet manifold. The slotnozzle induces jet impingement of the coolant on the micro-channel enhanc-
12
2.2. Model Development
Figure 2.1: Schematic of the heat sink with flow direction indicated by arrows.
ing the heat transfer performance of the heat sink. Due to symmetry of thedesign, the coolant evenly branches to both sides and leaves the coldplatelaterally through the two collection manifolds. The two streams rejoin andleave the heat sink through the outlet port.
A chip cooled by the MMC heat sink is attached to the sink below themicro-channel structure with a thermal interface material (TIM) placed onthe top of the chip. Since the chip temperature is a critical parameter andshould not exceed the threshold specified by the industrial standards, ther-mal modeling of the package has to reliably predict a characteristic chiptemperature generated when it is running under a computational load. Onthe other hand, assessment of the potential energy re-use requires simulationof the average water temperature of the heat sink. A thermal model has toconsider heat transfer in the four compartments of the package: in the chipgenerating heat; in the TIM, in the MMC heat sink, and in cooling waterinside the sink. In our model, the temperature fields in the chip, TIM andthe solid part of the heat sink are computed using the heat diffusion equationwith a source term for heat generation in the chip. Detailed modeling of theheat convection in the flow of water in the MMC heat sink requires solvingthe Reynolds averaged turbulent flow Navier-Stokes equations [29]. Sincethe rapid solution of the Navier-Stokes equations for three-dimensional un-steady turbulent flows inside the complex sink structure is computationallyunfeasible, a semi-empirical approach is adopted in the suggested model of
13
2. Compact thermal model for the transient temperature prediction of awater cooled microchip module in low carbon emission computing
the package. In the model, we compute the heat dissipated to the water andthe corresponding average temperature of flow at the sink outlet based onthe given inlet water temperature, flow rate, and a heat transfer coefficientspecified at the internal walls of the MMC heat sink. The latter is an areaaveraged heat transfer coefficient at the fluid-solid interface and is a fittingparameter, which has to be obtained via calibration of the model. The secondsimilar fitting parameter of the model is an average heat transfer coefficientwhich defines the heat transfer at the external boundaries of the package.The two fitting parameters serve as an input to the boundary conditions ofthe heat diffusion equation for the solid parts of the package.In order to obtain a fast and robust solution, the unsteady heat diffusionproblem was reduced to a system of ordinary differential equations for anequivalent thermal resistance network following the approach which is em-ployed in the ODE thermal compact modeling concept [17, 18]. A simplifiedheat sink geometry composed of seven compartments is utilized in the model.Four compartments (numbered 1-4 in Fig. 2.2a) represent the water flowpath consisting of the three main channels (1 to 3) and the micro-channelarray below them (4) . The remaining three compartments (5-7 in Fig. 2.2a)correspond to the solid parts of the package: the chip, the TIM, and thesolid material of the sink. The heat conduction problem is solved in the solidparts of the package excluding the micro-channel array and the water path.The governing equation for the temperature field T inside the computationaldomain is written as follows:
C∂T
∂t= ∇k∇T +Q (2.1)
where C, k, and Q are the volumetric specific heat of the material, thethermal conductivity, and a heat source term, respectively. The thermalconductivity and heat capacity used in the simulations for the chip, TIM,and solid material part of the heat sink are shown in Table 2.1 together withthe geometrical parameters of the computational domain.
Every solid part of the geometry (compartments 5-7 in Fig. 2.2a) is sub-divided into a set of horizontal layers, which are discretized with rectangularcells. The partial differential equation of heat conduction (1) is then reducedto a system of ordinary differential equations by applying the finite volumeformulation for the spatial variables. Due to the well-known analogy betweenheat and electrical conduction, the system of ordinary differential equationsis identical to the governing equations for an electrical circuit where voltageand electric current represent temperature and heat flux respectively. Anexample of a discretized layer with the rectangular cells and the equivalenttwo-dimensional thermal resistance network is shown in Fig. 2.2b. If the
14
2.2. Model Development
Figure 2.2: (a) Model geometry of package with MMC heat sink. 1−3: water flow path manifolds, 4:micro-channels, 5: TIM, 6: Chip; and 7: MMC cooper compartment. (b). Example of discretized layerwith equivalent thermal resistance network.
Chip Width 18.37 mm
Length 12.57 mm
Thickness 16 mm
Thermal conductivity 130 W/m K
Heat capacity 1.75 · 106 J/m3 K
TIM Width 18.37 mm
Length 12.57 mm
Thickness 16 µm
Thermal conductivity 3.73 W/m K
Heat capacity 4.0 · 106 J/m3 K
Heat sink Width 47.5 mm
Length 47.5 mm
Thickness: Base 1.2 mm
Thickness: Micro channels 1.7 mm
Thickness: Manifold 4 mm
Thickness: Upper Cap 2 mm
Thermal conductivity 380 W/m K
Heat capacity 3.55 · 106 J/m3 K
Table 2.1: Model geometry and material parameters
node temperature in the example grid is denoted as Tmn, the equation forthis node can be written as follows:
15
2. Compact thermal model for the transient temperature prediction of awater cooled microchip module in low carbon emission computing
CDxDyDzdTmndt
= kDyDzTm−1 − Tmn
Dx+ kDyDz
Tm+1n − TmnDx
+kDxDzTmn−1 − Tmn
Dy+ kDxDz
Tm−1n − TmnDy
(2.2)
+qDxDyDz
where Dx, Dy, and Dz denote the dimensions of the cell. The system ofequations (2.2) for every node describes a thermal resistance network withthe following node thermal resistance.
R =L
k · A(2.3)
where k is the thermal conductivity of the cell material, L is the thicknessof the rectangular cell, and A is the contact area between neighboring cells. Inthis model, the node l resistance defined in Eq. (2.3) represents the thermalresistance to the heat flow at the position of the node in one of the sixdirections parallel to the axis coordinates. Depending on the direction, thethickness of the cell L equals Dx, Dy, or Dz, respectively. The discretizedgeometry of the package results in a set of N rectangular elements with a gridat the centers of the elements for which all equations are written in vectorform as follows.
CT = KT + S (2.4)
where T is the N-dimensional vector representing the temperature in theN grid nodes, and C and S are the vectors specifying the thermal capacitancesand the heat sources for the discretized cells, respectively. The entries of thematrix K are the inverse resistance coefficients 1/R, where the resistances Rare defined in Eq. (2.3). Since every cell is connected to six neighbors withmutual contact interfaces, the matrix K is a Laplacian matrix with only sixentries in each row (column). In the source term, the vector elements repre-sent either the heat generated in the chip or the heat flux at the boundariesof the domain. The local heat flux at the external boundary of node i withtemperature Ti is calculated as follows.
qext = hextA(Ta − Ti) (2.5)
where hext is the external heat transfer coefficient, and Ta is the ambienttemperature. The convective heat flux at the fluid-solid interface in theMMC heat sink is defined in the same way.
qint = hintA(Ti − Tinlet) (2.6)
16
2.3. Model validation
where hint is the heat transfer coefficient for the internal boundaries, and Tinletis the inlet water temperature. The resulting ODE system is numericallyintegrated to obtain the time dependent temperature at all nodes of a gridwhich represents a discretization of the geometry of the MMC heat sink andthe attached chip including TIM. The solution is obtained using subroutineode45 (MATLAB 2009b), which employs an explicit Runge-Kutta algorithm.
2.3 Model validation
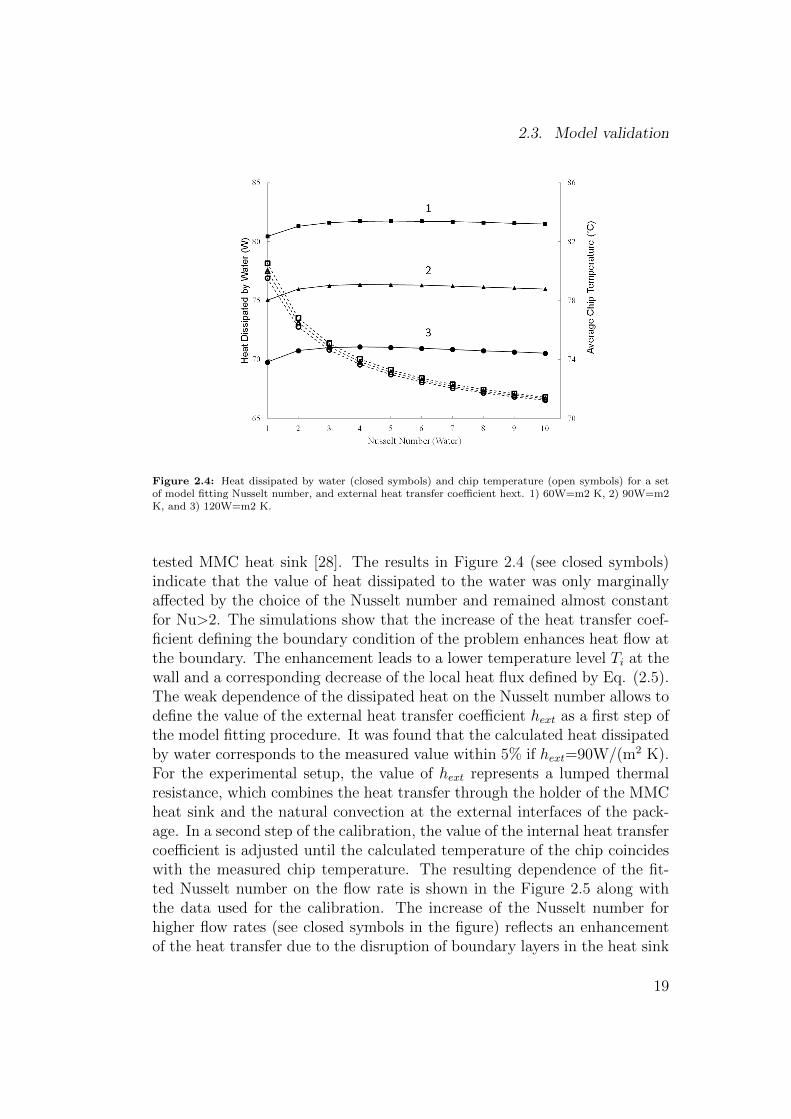
The estimation of the two unknown heat transfer coefficients is carried outiteratively based on the results of a series of the experimental tests reportedin reference [27]. Schematics of the flow loop and the actual test sectiondesigned to evaluate theMMC heat sink performance are shown in Figures2.3a and 2.3b. The fluid inlet temperature Tf,in was controlled using a heatexchanger, which is connected to a separate flow loop where the temperatureis regulated with accuracy of 0.1C using a heater/ chiller (Proline RP 855,Lauda, Germany). The flow was measured with an accuracy of 0.2% for en-tire range (0.1−1.8 l/min) of operation using a Coriolis flow meter (Emerson,Switzerland). A differential pressure sensor (Honeywell, USA) and two ther-mocouples (Omega Engineering Inc., USA) were used to measure the pressuredrop with a precision of 0.001 bar, and inlet and outlet temperatures witha cross calibrated accuracy of 0.1C. This precise calibration was needed forthe evaluation of the heat sink efficiency because the relative errors increasedsignificantly due to relatively low water temperature rise at high water flowrates. For example, an error of 0.1C already corresponds to a 7W heat fluxerror at a water flow rate of 1 l/min, which is significant given the 130Wmaximum thermal load associated with the chip (IBM BladeCenter1 Server,HS22). A 7 µm pore filter (Swagelok, Solon, USA) was used to keep thecoolant free of large particles. Additionally, 14 integrated resistance tem-perature detectors (RTDs) in the heating test chip (2.31 cm2) were used todetermine the temperature field of the chip. Two different types of thermalgreases were applied as thermal interface material (TIM) between the chipand the heat sink, which were attached together using spring loaded screws.The spring loading maintained a constant force of 98±10N on to the chip.The thermal grease improved the heat spreading and helped make a goodthermal connection. The average thickness of the TIM layer was measuredwith an accuracy of ±1.5 mm using the average value of four inductive lengthprobes (P2001, Mahr, Goettingen, Germany). These probes, located at thefour edges, were a fixed part of the holder. In the tests, the temporal dynam-ics of the chip and water temperature exhibit three different phases. In the
17
2. Compact thermal model for the transient temperature prediction of awater cooled microchip module in low carbon emission computing
Figure 2.3: a) Test section for MMC heat sink performance evaluation b) Schematic of the designed flowloop
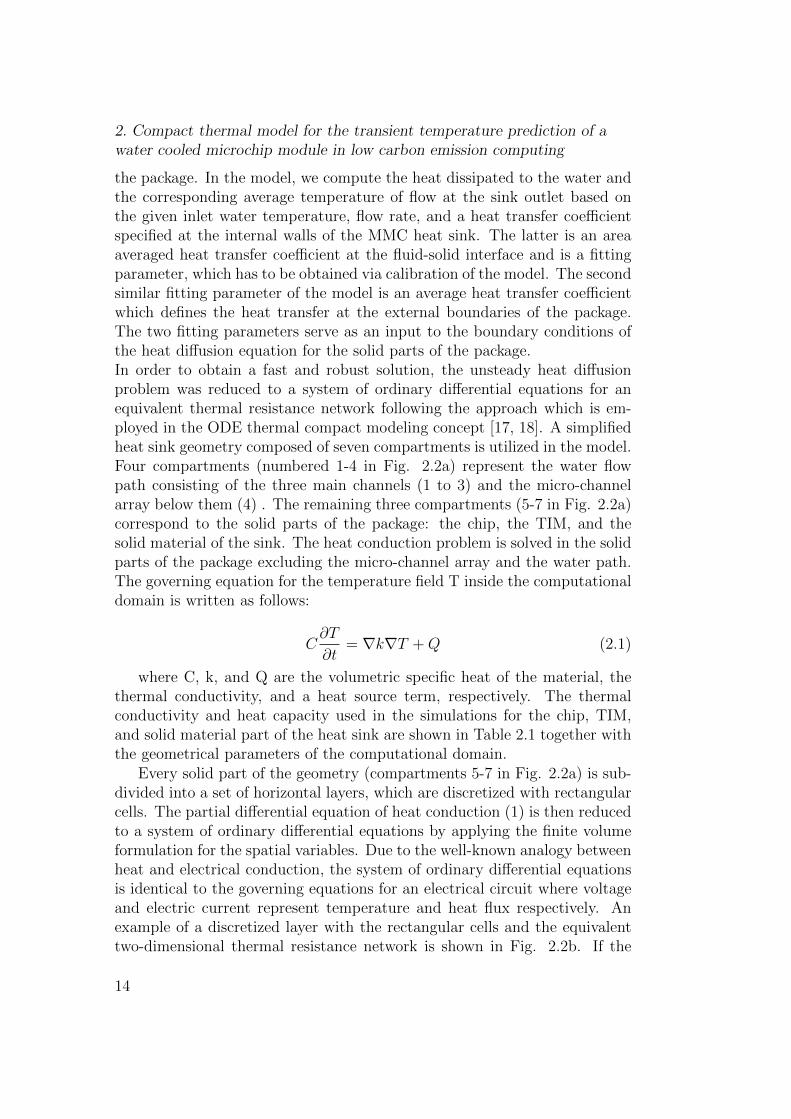
beginning of a test, the chip load is increased gradually causing an increaseof the chip temperature, and the fluid temperature in the water loop. Whenthe heat load reaches its maximum and the heat transfer in the package isat equilibrium, the system attains a steady-state with the chip and watertemperature remaining constant. In the final phase, the heat load is turnedoff abruptly leading to a sharp drop of the chip temperature. The results ofthe temperature measurements in the steady-state phase of the tests serveas calibration data to determine the two model heat transfer coefficients atthe boundaries. After the calibration, the model is applied for predicting thetransient behavior of the system, which is observed at the beginning and atthe end of the test.The model calibration is carried out in two steps. In the first step, the heatdissipated to water and the average temperature of the chip surface are cal-culated for a set of values of the two fitting parameters. In the second step,the parameters are adjusted for every flow rate to reproduce the chip tem-perature and the dissipated heat measured in the tests.An example calculation for the chip heat load of 90W is shown in Figure 2.4.It is assumed that the values of the Nusselt number in the main channelsand in the micro-channels of the manifold are the same and the heat transfercoefficient hint at the solid-water interface is calculated by hint = Nu · k/D,where k is the heat conductivity of water and D is the hydraulic diameterof the channels. In the calculations, the change in Nusselt number was setto span over the range that was determined in the CFD simulations of the
18
2.3. Model validation
Figure 2.4: Heat dissipated by water (closed symbols) and chip temperature (open symbols) for a setof model fitting Nusselt number, and external heat transfer coefficient hext. 1) 60W=m2 K, 2) 90W=m2K, and 3) 120W=m2 K.
tested MMC heat sink [28]. The results in Figure 2.4 (see closed symbols)indicate that the value of heat dissipated to the water was only marginallyaffected by the choice of the Nusselt number and remained almost constantfor Nu>2. The simulations show that the increase of the heat transfer coef-ficient defining the boundary condition of the problem enhances heat flow atthe boundary. The enhancement leads to a lower temperature level Ti at thewall and a corresponding decrease of the local heat flux defined by Eq. (2.5).The weak dependence of the dissipated heat on the Nusselt number allows todefine the value of the external heat transfer coefficient hext as a first step ofthe model fitting procedure. It was found that the calculated heat dissipatedby water corresponds to the measured value within 5% if hext=90W/(m2 K).For the experimental setup, the value of hext represents a lumped thermalresistance, which combines the heat transfer through the holder of the MMCheat sink and the natural convection at the external interfaces of the pack-age. In a second step of the calibration, the value of the internal heat transfercoefficient is adjusted until the calculated temperature of the chip coincideswith the measured chip temperature. The resulting dependence of the fit-ted Nusselt number on the flow rate is shown in the Figure 2.5 along withthe data used for the calibration. The increase of the Nusselt number forhigher flow rates (see closed symbols in the figure) reflects an enhancementof the heat transfer due to the disruption of boundary layers in the heat sink
19
2. Compact thermal model for the transient temperature prediction of awater cooled microchip module in low carbon emission computing
Figure 2.5: Fitted Nusselt number (closed symbols) and measured chip temperature (open symbols)used for the fitting for different flow rates in MMC heat sink with hext=90 W/(m2 K)
channels and intensification of the flow turbulence that was also observed inthe CFD simulations of the MMC heat sink [28]. The calibrated model wasapplied to predict the outlet water temperature in the tests with flow ratesin the range from 0.5 l/min to 1 l/min and an inlet water temperature of60C. In these tests, the water temperature measured at the outlet variedfrom 61.1C to 62.2C and the predicted values deviated from the data byless than 0.1C corresponding to the accuracy of calibration of the sensorsin the setup. The sensitivity of the model to discretization of the domainwas checked by computing the maximum temperature of the chip for gridswith the number of nodes increasing from 2,000 to 60,000. In these runs, themaximum of the chip temperature was decreasing from 74.15C to 73.85Cwith a change less than 0.1C after the node number exceeded 4,000. Sincethe suggested compact model is not focused on reproducing smooth spatialtemperature distribution in the package, but is intended to provide time ef-ficient estimates of transient dynamics of the characteristic parameters ofthe system, most of the simulations are carried out with a 8,000 node grid.An additional series of simulations was performed to assess the impact of thediscretization used in the model on calculations of the average and maximumtemperature of the chip. In this series, the heat load was locally adjustedin the individual nodes until the chip temperature computed at the 14 loca-tions of the RTDs matched the measurements obtained in the experiment.The iterative procedure of the adjustments resulted in a reversed engineeringpower map that was composed of a hot spot 51.95W=cm2 located slightly
20
2.3. Model validation
Figure 2.6: Temperature contours with heat load turned off at t=0 s. The two lower layers correspondingto the chip and TIM are not in scale (extended in the vertical direction).
off center of the chip, four adjacent zones with heat load 41.56W=cm2 andthe load of 33.57W=cm2 for the rest of chip. The maximum temperatureand the average temperature measured in the test were 74.91C and 72.48Cwith the computed temperatures being only slightly higher: 1.6C for themaximal temperature and 0.2C for the average temperature, respectively.The validation of the model in transient conditions was carried out using theunsteady phases of the experimental testing. The simulations span a 200 sinterval, which is the typical run-time of a C-compiler and internet browserexecuting a set of standardized software tests [29]. Calculated temperaturecontours in a cross-section of the package after the heat load was turned offare shown in Figure 6. The contour plots show that the temperature on thechip and TIM drops rapidly by 10C within 0.1 s. In the simulations, theaverage chip temperature was predicted within 0.5C during both gradualincrease of the heat load and its abrupt turnoff (see Figure 7). The heatdissipated to the water was calculated with accuracy better than 5% duringboth gradual increase and abrupt turnoff of the heat load (see Figure 8). Inthe latter case, the simulations accurately reproduced a negative heat fluxwhen the rapidly cooled heat sink was effectively heated by still warm waterpumped through the heat sink. The model was sensitive enough to capture
the change of water temperature when the actual flow rate in the test waschanged from 0.5 to 0.7 l=min (see slight decrease of the dissipated heat att=125 s). The validation shows that the compact model presented in thiswork can rely on steady-state calibration to successfully predict transient be-havior of water and average chip temperature of the package with the MMCheat sink. It is also important to notice that the ratio of the model run timeon a desktop PC divided by the simulated phenomenon time does not exceed20:1, i.e., 1 s of the real time interval requires less than 20 s of computation
21
2. Compact thermal model for the transient temperature prediction of awater cooled microchip module in low carbon emission computing
Figure 2.7: Average chip temperature when heat load 90W is turned on (experimental data: closedsymbols, simulation: thick solid line; right axis) and off (data: open symbols, simulation: thin solid line;left axis).
Figure 2.8: Heat dissipated by water when heat load 90W is turned on (data: closed symbols, simulation:thick solid line; right axis) and off (data: open symbols, simulation: thin solid line; left axis).
22
2.4. Oscillating heat load
time on a desktop PC. This ratio of physical to simulation time is severalorders of magnitude better than the ratio in transient CFD runs or transientcompact thermal modeling [22], which focus on detailed simulation of spatialtemperature fields in all package components.
2.4 Oscillating heat load
The measurements of power traces of various software packages running stan-dard benchmarks show that most of the time the heat load of the computerCPU oscillates between 50 and 70% of its maximum value with the frequencyof oscillations remaining in the range from 1 to 10 Hz [30]. In microelectronicpackages cooled by water, the oscillations of the heat load will cause a tran-sient response of the chip temperature, water temperature and correspondingoscillations of the heat removed by water in the heat sink. To exemplify thedynamic response of the MMC package to an oscillating heat load, a series ofsimulations was carried out for a set of model heat loads. In the simulations,the model heat load was specified as a sequence of rectangular pulses with agiven frequency and amplitude. The induced response of chip temperatureand dissipated heat reached quasi-periodic oscillations within 20 sec. An ex-ample of the heat load oscillating between 40 and 90W is shown in Fig. 2.9.The frequencies of three consecutive sections of the load are 0.4 Hz, 1 Hz, 4Hz with the periods of the pulses 2500 ms, 1000 ms, and 250 ms, respectively.The results of simulations indicate that due to the high thermal conductivityof the heat sink material and the efficient heat transfer between heat sinkand cooling water, the response time of the package is relatively small andthe chip temperature oscillates with the same frequency as the heat load (seeFig. 2.10). The maximum of the oscillating chip temperature reaches thesame level as in the steady-state case with the corresponding maximum heatload if the load frequency is low. When the frequency increases to 4 Hz,the maximum chip temperature is about 1C lower than in the steady-statesimulations (see dashed lines in Fig. 2.10) and this difference (marked by δin Fig. 2.10) rises with the frequency. The heat dissipated to water exhibitssimilar qualitative behavior as is observed for the chip temperature (see Fig.2.11). In both cases, there is a frequency threshold above which the maxi-mum of the chip temperature as well as the water temperature at the outletare below the corresponding levels for steady-state conditions.The results show that the relative deviation of the dissipated heat is greaterthan the deviation of maximum chip temperature. The limiting factor re-sponsible for the damped response of the removed heat to oscillating loads isthe intensity of heat transfer between the sink material and water. The av-
23
2. Compact thermal model for the transient temperature prediction of awater cooled microchip module in low carbon emission computing
Figure 2.9: Model heat load for simulations of transient response of the package with MMC heat sink.
Figure 2.10: Maximum chip temperature for oscillating heat load with inlet water 60 C and flow rate0.5 l/min. Dashed lines depict maximum temperature for corresponding steady-state heat loads.
24
2.4. Oscillating heat load
Figure 2.11: Heat dissipated by water for oscillating heat load with inlet water 60C and flow rate 0.5l/min. Dashed lines depict dissipated heat for corresponding steady-state heat loads.
erage heat flux to water is not as sensitive to the heat load oscillations as theflux at the TIM-heat sink interface since the heat sink has a large fluid-solidinterface which leads to relatively small amplitudes of temperature oscilla-tions at the wall surface. The impact of frequency of the oscillations on thedeviation δ of the maximum chip temperature from the steady-state case isillustrated in Fig. 2.12. For frequencies lower than 2 Hz, the chip temper-ature always reaches its steady-state level while at 10 Hz, the maximum ofoscillating temperature is 1.4C lower than this for the steady-state run.The variation of flow rate in the range from 0.5 l/min to 1.0 l/min affects onlymarginally (less than 0.5C) the value of deviation for all specified frequenciesup to 10 Hz (see Fig. 2.12). The chip temperature with the steady-state heatloads is also not very sensitive to the flow rate change: in the experiments, anincrease of the flow rate by a factor of two caused only a two degree drop ofthe average chip temperature from 72.5C to 70.5C (See Fig. 2.5). On theother hand, the pumping power that is required to sustain a given flow ratescales faster than the flow rate. Thus, one possible strategy to minimize theoverall energy consumption needed for operating a computer server cooledby water is to keep a minimal flow rate which is adjusted on-the-fly trackingspikes of the chip heat load. The following examples present applications ofthe compact model to the simulation of the MMC package assuming thatthe inlet water temperature or the water flow rate is controlled via a simple
25
2. Compact thermal model for the transient temperature prediction of awater cooled microchip module in low carbon emission computing
Figure 2.12: Deviation δ of maximum chip temperature from corresponding steady-state case withconstant heat load; 1) 0.5 l/min, 2) 0.7 l/min, 3) 1.0 l/min
feedback loop which aims at minimizing the energy consumption.
2.5 ON/OFF Controller for inlet water tem-
perature
The simplest feedback loop in control systems is modeled as an on/off con-troller with two states and one corresponding adjustable parameter. Thecontroller states and the value of the parameter are changed every time whenthe controlled variable passes one of two given thresholds. Such controllers, inwhich continuous dynamics of the controlled variable interacts with the dis-creet dynamics of the system states, are studied extensively in the context ofhybrid control systems [31, 32]. A schematic of the on/off controller adaptedto the studied package with the MMC heat sink is shown in Fig. 2.13. Thecontroller works as a thermostat, which can switch the inlet temperature ofthe water from a low to a high level and vice versa as soon as the maximumchip temperature is passing a lower or upper threshold, respectively. In themodel equations, a corresponding step function was implemented to modelthe switching of the inlet temperature depending on the maximum temper-ature calculated in the chip.In systems with an on/off thermostat, the frequency of temperature oscil-lations depends on the choice of the system thresholds as well as the levelsof the adjustable parameters. In the case of a constant heat load, the sim-ulations of the package with the MMC heat sink show that the frequency
26
2.5. ON/OFF Controller for inlet water temperature
Figure 2.13: Schematic representation of the states of on/off controller
is proportional to the difference between the thresholds and inversely pro-portional to the difference between the parameter levels. An example ofthe transient chip temperature in the package equipped with the on/off con-troller and constant heat load 90W is shown in the left plot of Fig. 2.14. Themaximal chip temperature oscillates periodically with the frequency 3.3Hzbetween the specified controller thresholds 75C and 80C. In the case of anoscillating heat load, the resulting profile of the chip temperature is a su-perposition of the oscillations defined by the characteristic frequency of thecontroller, the heat load frequency and the phase shift between the two. Theright plot in Fig. 14 shows the oscillating temperature of the chip for theheat load specified as a sequence of rectangular pulses with the frequency of1 Hz and amplitudes from 0 to 90 W. In this simulation, the superpositionof the heat and controller oscillations induces periodic changes of the chiptemperature with a double peak profile. Since the maximum of the oscillat-ing heat load is the same as in the case of the constant heat load, the chiptemperature does not exceed the upper threshold. In contrast, cooling theheat sink during the idle phase of the heat load leads to a decrease in thechip temperature below the lower threshold of the controller. The simula-tions demonstrate that the adjustment of the water temperature to a lowerlevel during decrease of computational load of the chip could be a method toimprove the energy savings performance of the system due to a lower overallconsumption of hot water. The used implementation of an on/off controller
27
2. Compact thermal model for the transient temperature prediction of awater cooled microchip module in low carbon emission computing
Figure 2.14: Chip temperature in package with on/off controller for constant heat load 90 W (left) andheat load oscillating from 0 to 90 W with frequency 1 HZ (right). Inlet water temperature switches from60C to 70C.
is based on the assumption that the changes of the inlet temperature affectthe entire fluid-solid interface in the heat sink immediately. The assumptionis valid for the controllers which have a negligibly small hydraulic residencetime, i.e. the time required to fill the system with water with the adjustedtemperature is relatively small compared to the characteristic time of theproblem. If the residence time has to be taken into account, a delay pa-rameter should be added into the model of the controller. Engineering thehardware manipulating the water flow rates is much easier than adjustmentof the water temperature thus another attractive possibility to reduce pump-ing power and consequently the overall energy consumption of the system.In order to illustrate the possible impact of flow rate controllers on the pack-age chip temperature, a flow rate feedback loop was incorporated into thedeveloped model of the package.
2.6 Proportional controller for water flow rate:
simulation of thermal response with C-
compiler and internet browser real time
power traces
In the MMC heat sink, a change in flow rate affects the formation of thethermal boundary layers and the corresponding heat transfer efficiency atthe inner walls of the sink (see Fig. 2.5). Since the heat transfer coefficient
28
2.6. Proportional controller for water flow rate: simulation of thermalresponse with C-compiler and internet browser real time power traces
at the walls is proportional to the water flow rate, the flow rate controllerof the package should increase the flow rate according to the increase of thecomputational load on the chip. The results in Fig. 2.10 and Fig. 2.12 showthat the chip temperature for transient heat loads does not exceed the tem-perature in steady-state cases, whereas the maximum for both cases was setto the same power level. Consequently, in a conservative controller, the in-stant flow rate corresponding to a specific value of transient heat load shouldbe at the level which is sufficient to keep the chip temperature below thesafety threshold in the steady-state conditions with the same heat load. Aseries of simulations of the package with steady-state heat loads was carriedout to determine the flow rates which guarantee the maximum chip temper-ature to remain at a safe operational level. The results show that if the flowrate increases with the constant slope 1 l/min per 40W of the heat load, themaximum chip temperature remains at the level 72C up to the heat load100 W.Based on the simulations, the following feedback loop was implemented inthe package model: If the transient chip heat load remains below 65 W, theflow rate is kept at a base level of 0.5 l/min otherwise the flow rate is in-creased linearly above 0.5 l/min proportionally to the increase of the heatload above 65 W. The slope of the proportional increase is set to be 1 l/minper 40W as it was determined in the steady-state simulations. In the model,the implementation defines the internal heat transfer coefficients hint at thesource terms of the equations for temperature in the nodes of the internalwalls. At every node, the time-dependent value of the coefficient is calcu-lated as a function of the instant flow rate accordingly to the calibrationcurve shown in Fig. 2.5.In order to investigate the thermal behavior of the MMC package for realisticpower traces, the model heat load of the chip is imitating the heat loads inCPUs during typical software applications. The model heat load for simu-lations with the controller is constructed based on the plots of power tracesmeasured in reference [29] in an Intel P4 chip running open source browserMozilla and C-compiler GCC. The power traces used in the simulations areshown in Fig. 2.15. In the model equations, the heat load profiles definethe source terms in the equations for the grid nodes representing the chipof MMC package. The peak load of the power trace reaches 80 W for therunning compiler and 100 W for the running browser. If the MMC packageworks without the controller, the corresponding steady-state flow rates thatare required to keep the chip temperature at 72C will be 0.6 l/min and 1.0l/min, respectively. On the other hand, the controller enforces a proportionalincrease of flow rate above 0.5 l/min only when the load exceeds 65 W. Sub-sequently, the time-averaged flow rate of the package with the controller is
29
2. Compact thermal model for the transient temperature prediction of awater cooled microchip module in low carbon emission computing
Figure 2.15: Chip heat loads corresponding to power traces of Mozilla (solid line) and C compiler GCC(dashed line).
Figure 2.16: Chip temperature (a) and water temperature at outlet (b) for power traces of compilerwith proportional controller (solid lines 1 ) and with constant flow rate 1 l/min (dashed lines 2).
30
2.7. Conclusion
lower and the average flow rates are 0.52 l/min and 0.51 l/min for the com-piler and browser respectively.The results of the simulations of chip temperature and water temperature atthe outlet for the browser power trace are shown in Fig. 2.16. In both caseswith and without the controller, the maximum chip temperature is below thechosen safety threshold of 72C. The mean values of the chip and water tem-perature with controller exceed only marginally (≤ 0.6C) the temperaturewith the steady-state flow rate. Similar results are obtained for the powertrace of the compiler. The maximum chip temperature for two controllerswith a different base level flow rate is compared to the chip temperaturewithout controller in Fig. 2.17. The simulations show that even if the baselevel of the controller is decreased from 0.5 l/min to 0.3 l/min, the mean valueof the chip temperature rises less than 0.4C and remains below the safetythreshold. At the same time, the average flow rate of the second controller isas low as 0.33 l/min compared with 1.0 l/min in the steady-state case. Whilethe simulations include an idealized model of the flow controller, the resultsdemonstrate that the significant (more than 50%) decrease of the requiredflow rate can be explored as a possibility to minimize power consumption ofthe pumping system and thus to reduce the overall carbon footprint of datacenters cooled by warm reused water.
2.7 Conclusion
The goal of this study was to evaluate the feasibility and performance of acompact heat transfer model approach for a warm water heat sink, utilizedto explore a new strategy to reduce the carbon footprint of data centers ex-plained herein. A compact model for an example package with a MMC heatsink was developed and experimentally validated using transient temperaturemeasurements the same real package. It is shown that a MATLAB desctopimplementation of the model allows for time-efficient simulations with a ratioof real thermal phenomenon time to needed computer simulation time of thesane less than 1: 20. The model is applied to simulate the thermal responseof the package to heat loads which are typical for standard software runs withduration up to 200 s. The simulations indicate that the application of a flow-control feedback loop can lead to a more than 50% reduction in water flowrate and thus to the corresponding saving of pumping power without com-promising allowable industrial specifications for maximum chip temperature.The rapid simulation run-time proves that the developed model can be usedas a time-efficient simulation tool for aggressive dynamic power managementof microelectronic packages designed to cool the processors of state-of-the-art
31
2. Compact thermal model for the transient temperature prediction of awater cooled microchip module in low carbon emission computing
Figure 2.17: Chip temperature for power traces of Mozilla 1) controller with min flow rate 0.3 l/min, 2)controller with min flow rate 0.5 l/min; 3) constant flow rate 1 l/min.
computer servers.
32
Chapter 3
Hot Water Cooled Electronics:Exergy Analysis and WasteHeat Reuse Feasibility
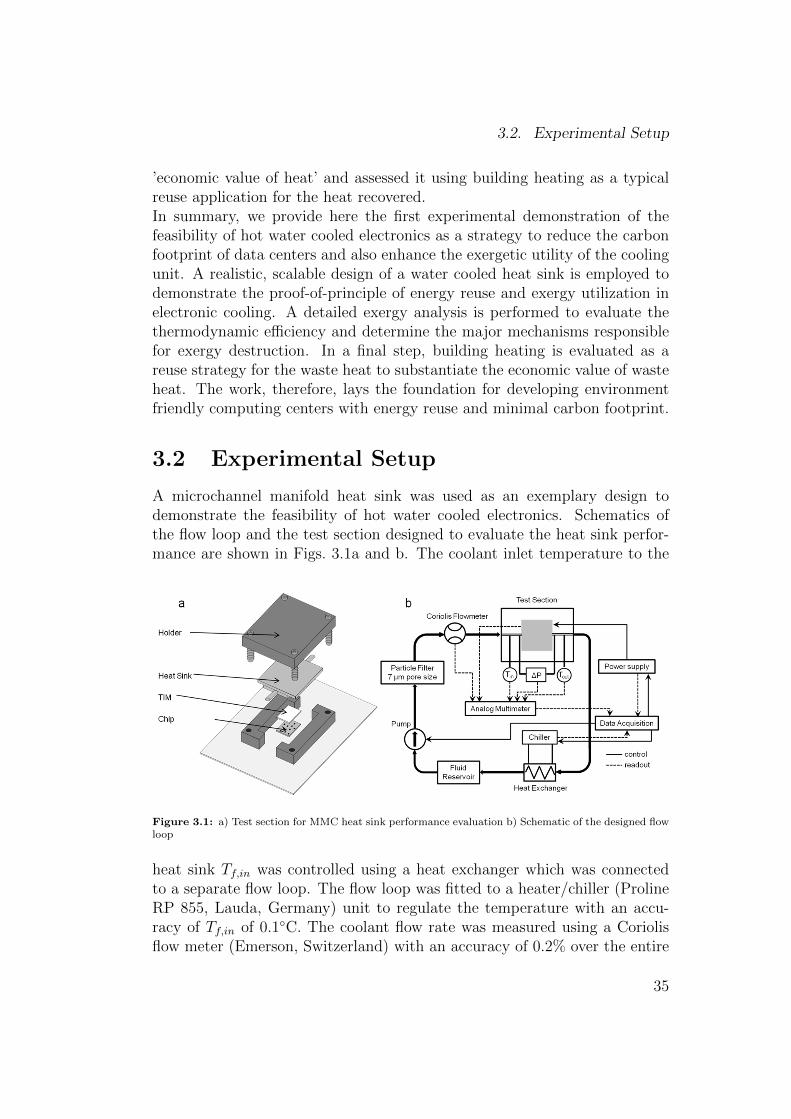
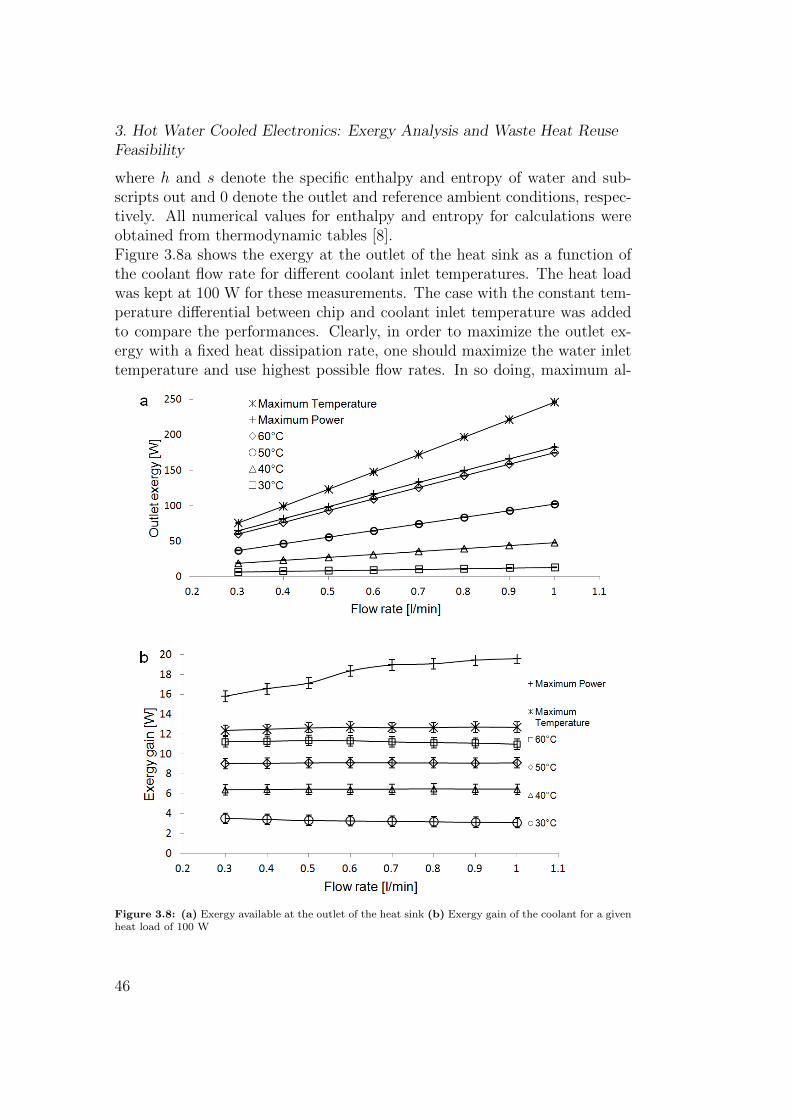
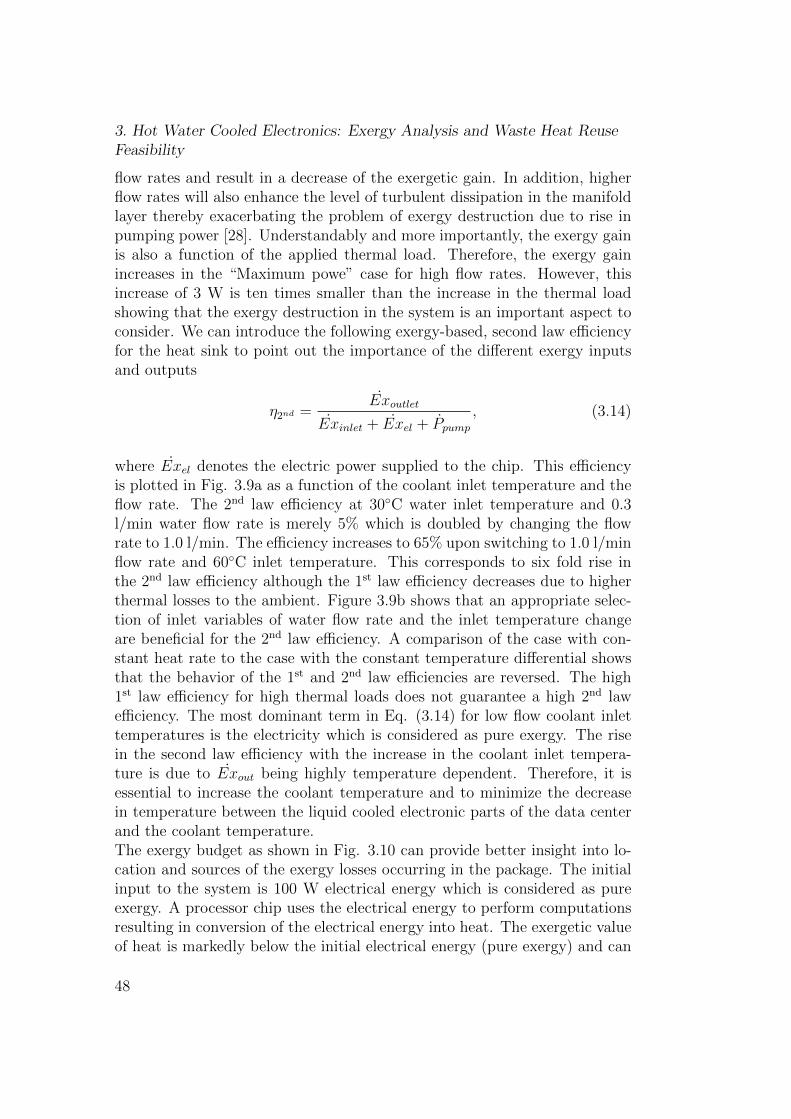
This chapter has been published as:S. Zimmermann, M. K. Tiwari, I. Meijer, S. Paredes, B. Michel, and D.Poulikakos, “Hot water cooled electronics: Exergy analysis and waste heatreuse feasibility”. International Journal of Heat and Mass Transfer, vol. 55,pp. 6391−6399 (2012).
3.1 Introduction
Continuous miniaturization of electronic components has led to dense andenergy intensive microprocessors. The associated higher power consumptionand increasing heat fluxes will soon render traditional forced air convec-tion cooling of data centers insufficient [23]. The cooling demands of nextgeneration 3D integrated chip designs also make switching to liquid coolinginevitable [33, 34, 35]. Switching to liquid cooling addresses these challengesby reducing the thermal resistance at least by a factor of 5 [24]. Startingfrom the classic work of Tuckerman and Pease [10], liquid cooling of chipsis well established in the literature. Several studies focused on the ther-mal performance of microchannel based heat sinks [24, 36]. Recent studieshave also exploited highly sophisticated interface designs for backside heatremoval using direct liquid jet impingement in combination with manifoldmicrochannel heat sinks [37]. The trend has been continued by focusing onthe simultaneous reduction in pressure drop alongside catering to the coolingrequirement. To this end, especially noteworthy are the works using manifold
33
3. Hot Water Cooled Electronics: Exergy Analysis and Waste Heat ReuseFeasibility
microchannel heat sinks with hierarchical designs, which were introduced toachieve uniform flow distribution at minimal pressure drop [12, 25].The trend of increasing demand for computational processing speed is alsopresent in data centers. For example, the rapidly growing demand for dataprocessing in communication, education, finance and healthcare calls not onlyfor improved electronic components, but has also resulted in ever increasingenergy consumption by data centers [5]. There are two ways to run the datacenters more efficiently. Firstly, one can optimize the energy usage of a datacenter. Secondly, one can utilize the otherwise wasted heat from data centers[38].A detailed investigation on energy consumption in data centers showed thatthe components necessary for cooling and distributing the air consume a sig-nificant amount of the total power in a data center [26]. In warm climates,the air needs to be precooled using chillers, which require additional energy.All these deficiencies of air and increasing energy costs demand novel coolingsolutions. Using water cooling, the input coolant temperature can be raisedabove the free cooling limit because the temperature difference needed forheat removal is significantly reduced. The need for coolant chillers in allclimates and seasons, even on the hottest days, is thereby eliminated.A high coolant temperature is particularly helpful to facilitate reuse of theotherwise wasted heat. For example, the hot water coming out of a data cen-ter can be used for building heating. Waste heat recovery and its potentialreuse [39] is becoming more and more important because it presents an op-tion to significantly improve the overall energy efficiency of the data center asa whole. The energy reuse strategy can also help minimize the overall systemcarbon footprint because the recovered heat can replace significant amountsof fossil fuels used in secondary applications such as building heating.Solely analyzing the amount of energy recovered from such a system limitsour ability to judge the quality of the energy recovered. The thermodynamicexergy analysis can provide the information on the energy quality [40]. Ex-ergy provides the crucial information about the usefulness of a green system[41]. The minimization of exergy destruction in the system [13] will resultin more environment friendly computing and will open up new possibilitiesfor the energy reuse. The choice of reuse strategy for the recovered heatdepends strongly on the temperature at which the heat is available and canalso be location specific. For example, at typical water outlet temperaturesfrom the heat sink tested here (∼60C), building heating is a good secondaryapplication in cold climates, whereas a reuse via adsorption chillers may bemore suitable in warm climates. A more systematic analysis requires defin-ing a suitable location specific economic value of the heat available at theoutlet of the chip cooler. In this work, we have introduced a metric termed
34
3.2. Experimental Setup
’economic value of heat’ and assessed it using building heating as a typicalreuse application for the heat recovered.In summary, we provide here the first experimental demonstration of thefeasibility of hot water cooled electronics as a strategy to reduce the carbonfootprint of data centers and also enhance the exergetic utility of the coolingunit. A realistic, scalable design of a water cooled heat sink is employed todemonstrate the proof-of-principle of energy reuse and exergy utilization inelectronic cooling. A detailed exergy analysis is performed to evaluate thethermodynamic efficiency and determine the major mechanisms responsiblefor exergy destruction. In a final step, building heating is evaluated as areuse strategy for the waste heat to substantiate the economic value of wasteheat. The work, therefore, lays the foundation for developing environmentfriendly computing centers with energy reuse and minimal carbon footprint.
3.2 Experimental Setup
A microchannel manifold heat sink was used as an exemplary design todemonstrate the feasibility of hot water cooled electronics. Schematics ofthe flow loop and the test section designed to evaluate the heat sink perfor-mance are shown in Figs. 3.1a and b. The coolant inlet temperature to the
Figure 3.1: a) Test section for MMC heat sink performance evaluation b) Schematic of the designed flowloop
heat sink Tf,in was controlled using a heat exchanger which was connectedto a separate flow loop. The flow loop was fitted to a heater/chiller (ProlineRP 855, Lauda, Germany) unit to regulate the temperature with an accu-racy of Tf,in of 0.1C. The coolant flow rate was measured using a Coriolisflow meter (Emerson, Switzerland) with an accuracy of 0.2% over the entire
35
3. Hot Water Cooled Electronics: Exergy Analysis and Waste Heat ReuseFeasibility
range (0.1 - 1.8 l/min) of operation. A differential pressure sensor (Hon-eywell, USA) and two thermocouples (Omega Engineering Inc., USA) wereused to measure the pressure drop, and inlet and outlet temperatures. Themanufacturer specified precision of the differential pressure sensor is 0.001bar. The two thermocouples were cross calibrated in a temperature bathto make relative measurements with an accuracy of 0.1C. This precise cali-bration was needed for the evaluation of the heat sink efficiency, because anerror of 0.1C already corresponds to a 7W heat flux error at a flow rate of1 l/min. A 7 µm pore filter (Swagelok, USA) was used to keep the coolantfree of large particles. The thin film heater emulating microprocessors hada electrical resistance of about 10 mΩ resulting in electrical currents as highas 135 A to impose a heat flux of 170 W. Therefore, as needed two powersources (Agilent N5741A) were employed in parallel.Fourteen Resistance Temperature Detectors (RTDs) integrated in the heat-ing test chip (2.31 cm2) were used to determine the temperature field ofthe chip surface. Thermal grease was applied as thermal interface material(TIM) between the chip and the heat sink. In order to ensure proper andreproducible thermal contact, spring loaded screws were used to mount thechip/TIM/heat sink assembly onto a holder (see Fig. 3.1a). The spring load-ing maintained a constant force of 98 ± 10 N on to the chip. The thermalgrease improved the heat spreading and helped make a good thermal connec-tion. The average thickness of the TIM layer was measured with an accuracyof ± 1.5 µm using the average value of four inductive length probes (P2001,Mahr, Goettingen, Germany). These probes, located at the four edges, werea fixed part of the holder.The heat sink (Wolverine Tube Inc., Huntsville, USA) under investigation isalso currently being tested on the prototype hot water-cooled IBM BladeCen-ter QS22 / HS22 Cluster Aquasar at the ETH Zurich [42]. The tested man-ifold microchannel heat sink consists of a microchannel coldplate connectedto a manifold layer, which was oriented perpendicular to the microchannelsin the coldplate (Fig. 3.2). The coolant water was fed centrally into the inletmanifold from which it was directed to the microchannel structure througha slot nozzle at the bottom wall of the inlet manifold. Through the slot noz-zle, the coolant emerged as a jet and impinged on the microchannels below,thereby enhancing the heat transfer performance of the heat sink. Due tothe symmetry of the design, the coolant branched evenly to both sides andexited the coldplate through the two collection manifolds. The two streamsrejoined and left the heat sink through the outlet port. Inlet and outlet man-ifold were separated by an air gap to avoid thermal leakage from the outletto the inlet. The heat sink was attached with a copper cap, which protectedthe microprocessor chips.
36
3.3. Energy and Exergy Analyses
Figure 3.2: Schematic of the water cooled manifold microchannel heat sink. The manifold and coldplate layers are diffusion bonded together to form the heat sink.
3.3 Energy and Exergy Analyses
In order to demonstrate the feasibility of hot water cooled electronics, the wa-ter inlet temperature was varied between 30C and 60C. Figure 3.3 comparesboth hydrodynamic and thermal performance of the heat sink for various wa-ter flow rates at two different water inlet temperatures. The flow rate wasvaried between 0.3 l/min and 1.0 l/min, while the power dissipated by thechip was kept constant at Pin = 100 W. Due to variable length scales in theheat sink, the flow structure is likely to be very different in different partsdepending on the local Reynolds number. As a first measure, the Reynoldsnumber at the manifold inlet can be defined as
Rein =4ρVtotµπdM,in
. (3.1)
The Rein ranges between 4800 to 16000, reflecting turbulent flow conditionsin the manifold for the flow rates tested herein. In Eq. (3.1) the symbolsρ, µ and Vtot, respectively denote the water density, the viscosity and thevolumetric flow rate, and dM,in denotes the diameter of the port feeding waterto the inlet manifold. The local Reynolds number in the microchannels ofthe coldplate (see Fig. 3.2)
Rech =ρVtot
N(wch + hch)µ(3.2)
ranges between 90 to 303 indicating laminar flow in the microchannels. Thedensity and viscosity values in Eq. (3.1) are evaluated at the inlet tempera-ture. This is justified due to the small variation in water temperature across
37
3. Hot Water Cooled Electronics: Exergy Analysis and Waste Heat ReuseFeasibility
the heat sink as we will see below. The rise in pressure drop with flow rate isdue to higher viscous drag at higher Reynolds numbers. In addition, in themanifold layer where the flow is turbulent at higher Rein [28], the eddy lossesalso account for pressure drop increases with flow rate. The thermal resis-tance, however, decreases with flow rate due to an enhancement in convectiveheat transfer with a rise in the Reynolds number. The thermal resistancewas calculated as
Rth =Tchip,max − Tf,in
Q(3.3)
where Q, Tf,in and Tchip,max respectively denote the chip heat flux, water inletand maximum chip temperatures.Figure 3.3 shows that both pressure drop and thermal resistance change fa-vorably with the increase in the water inlet temperature. The pressure dropacross the heat sink is lowered by increasing the water inlet temperature from30C to 60C. This is due to the temperature dependent decrease in water
Figure 3.3: Overall performance of investigated heat sink
viscosity reducing the pumping power required to drive the coolant throughthe heat sink. It is known that with rise in temperature, the viscosity of waterreduces much faster than its density. Therefore, for the same volumetric flowrate, we expect a higher Reynolds number and better convective heat trans-port through enhancement of the Nusselt number in the microchannels athigher water inlet temperatures. The overall thermal resistance value of un-der 0.12 K/W (0.28 Kcm2/W) for the entire package, including the resistanceof thermal interface materials and the heat sink, induces a low temperaturedifference between the chip and the water. This value is well below 0.39 K/Wreported by Shah et al. [40] for an air cooled heat sink package. A robustdesign facilitating high water throughput is at the heart of high performance
38
3.3. Energy and Exergy Analyses
heat sinks. In fact, Escher et al. [12] have already demonstrated that throughoptimal heat sink design and use of silicon based microfabrication even lowerthermal resistances can be obtained. The fundamental principle of hot watercooling, however, remains unchanged.A closer inspection of the thermal resistance in the test setup may offer fur-ther opportunities to increase the thermal performance of the heat sink. Aone dimensional thermal resistance model as introduced by Kasten et al. [28]can be used to calculate the total thermal resistance of the heat sink (perunit heat transfer area) as follows
Rtotal = RTIM +Rbase +Rconv +Rbulk, (3.4)
where R denotes thermal resistance of different components specified in thesubscripts. The conduction heat transfer through the TIM can be expressedas
RTIM =dTIMkTIM
, (3.5)
where dTIM and kTIM denote the thickness and thermal conductivity of theTIM. Rbase, i.e. the resistance to the conduction heat transfer through theheat sink base plate can be similarly expressed as
Rbase =dbasekcopper
, (3.6)
where dbase denotes the base thickness and kcopper the thermal conductivityof copper. The thermal resistance of the convective heat transfer from thecopper fins (i.e. the microchannel sidewalls) in the heat sink structure to thecoolant can be written as
Rconv =wch + wfin
wchhD + 2hDηfinhfin, (3.7)
where wfin, hfin and ηfin respectively denote the fin width, the fin heightand the fin efficiency. The symbols wch and hD stand for channel width andthe heat transfer coefficient for fully developed flow in rectangular ducts [28].Finally, the thermal resistance associated with the heat transfer to the bulkflow can be expressed as
Rbulk =Lch (wch + wfin)
ρcpVtot2N
, (3.8)
where Lch, cp and N denote the channel length, the specific heat capacityof water and the number of microchannels on the coldplate. This resistance
39
3. Hot Water Cooled Electronics: Exergy Analysis and Waste Heat ReuseFeasibility
accounts for the rise in temperature of the coolant along the microchannelslimiting the heat transfer. Figure 3.4 shows a comparison of the predictedcontributions from the different resistances to the overall thermal resistanceand the measured overall thermal resistance. The last three resistances inEq. (3.4) depend on the geometry of the heat sink, while the first resistanceis decided by the choice of appropriate TIM and its thickness. The choiceof the TIM material is important for the goal of a low thermal resistance ofthe entire package, because its contribution is significant and even plays adominating role for high flow rates. A trade-off between high thermal con-ductivity and small bond-line (TIM thickness) has to be found in order tolower this resistance. A switch to liquid metal as TIM would decrease RTIMfurther due to its high thermal conductivity and potentially very thin bondline. However, in this study we used a silicone based thermal grease in order
Figure 3.4: Contribution of the different thermal resistances in the package to the overall thermalresistance and variation in thermal resistance with flow rate
to emulate the thermal contact in state-of-the-art data center chips.The variations in the thermal resistances as a function of the flow rate fordifferent chip power dissipation levels are plotted in Fig. 5a. The water inlettemperature was held constant at 60C. The measured outlet water temper-ature varied from 64 to 61.2C for the range of flow rates considered. It isclear from Fig. 3.5a that thermal resistance varies mainly with flow rate,and for a given flow rate, resistance values for different chip heat fluxes over-lap with each other within the measurement error. The independence of thethermal resistance from the applied thermal load offers the opportunity topredict the maximal heat removal capability of the heat sink as a functionof the flow rate. Of course the temperature differential (between the chip
40
3.3. Energy and Exergy Analyses
Figure 3.5: (a) Variation of thermal resistance with the flow rate at different thermal loads. (b)Calculated and measured maximum heat removal. The calculation was performed assuming the thermalresistance to be independent of the thermal load.
41
3. Hot Water Cooled Electronics: Exergy Analysis and Waste Heat ReuseFeasibility
and the coolant) must be assumed to be known or design specified for sucha prediction. This concept becomes important because the idea of hot watercooling allows to push microchips to their upper thermal limit which is com-monly specified as 85C. Therefore, using a maximum allowed temperaturedifferential between the chip and the water inlet in Eq. (3.1), we can deter-mine the heat removal capability. Figure 3.5b shows the predicted thermalperformance and the experimental validation for a given coolant inlet tem-perature of 60C and a 20C temperature difference between the maximumchip and the water inlet temperatures i.e. (Tchip,max − Tf,in). The resultsshow that using the current heat sink, at a flow rate of 1.0 l/min and a fixeddifference in temperature of 20C between the chip and the coolant inlettemperatures, thermal loads up to 170 W (73.6 W/cm2) can be removed.The measured temperatures of the chip, the coolant inlet and the coolantoutlet are plotted in Fig. 3.6 as a function of the flow rate for three differentcases. Figure 6a shows the temperatures for a constant heat rate and coolantinlet temperature. Figure 3.6b shows varying coolant inlet and outlet tem-peratures for a constant imposed heat flux and a constant chip temperature.This case will be referred as Maximum temperature case in the later anal-ysis. The chip temperature is also referred as junction temperature in thiswork. Essentially the measurements presented in Fig. 3.6b were performedto determine the maximum coolant outlet temperature achievable at a spe-cific thermal load (heat flux) and the junction temperature. Maximizing theoutlet temperature also maximizes the outlet exergy. Figure 6c depicts thecase for a constant temperature differential between chip and coolant, andthe resulting maximum removable heat flux. This case will be referred to as“Maximum power” in the later analysis. The choice of the TIM in combina-tion with the heat sink design allows the removal of typical thermal loads formicroprocessors (100 W) with temperature differentials below 12C betweenthe chip and the hot water. Therefore, keeping the thermal load constantand pushing the chip temperature to an upper limit of 80C led to a maxi-mum allowable coolant outlet temperatures of 71C. The last two cases areespecially interesting for the first and second law analyses to be presentedbelow.Figure 3.7 shows the power removed as a function of the flow rate for differentchip powers. The water inlet temperature is maintained at 60C. For a giventhermal load, the power removed by water remains nearly unchanged at dif-ferent coolant flow rates. This indicates that any heat loss to the ambientor through the test stand supporting the heat sink remains nearly constantat different flow rates employed. The increasing trend for the errors bars inthe removed power is due to the accuracy of the used thermocouples. Theefficiency of the heat sink can be expressed as the ratio of the calorically
42
3.3. Energy and Exergy Analyses
Figure 3.6: Measured temperatures at the coolant inlet/outlet and the junction temperature for: (a)Constant coolant inlet temperature and constant thermal load. (b) “Maximum temperatur” case withconstant junction temperature and constant thermal load. (c) “Maximum power” case with variousthermal loads for a constant difference between coolant inlet and junction temperature.
43
3. Hot Water Cooled Electronics: Exergy Analysis and Waste Heat ReuseFeasibility
Figure 3.7: Removed heat for various applied thermal loads at a coolant inlet temperature of 60C
computed power removed by water to the invested electrical power, i.e.
η1st =mcp (Tf,out − Tf,in)
Q(3.9)
From the thermodynamic point of view, Eq. (3.9) is essentially an expressionfor the first law efficiency of a heat sink used in electronics cooling. Table3.1 shows the measured values of the applied power, the removed power andthe removal efficiency. The water inlet temperature was kept at 60C forcalculating these efficiencies. The first law efficiencies vary between 91% and96% for the chip heat flux change from 100 W to 150 W. This can be under-stood in terms of heat loss from the heat sink to the ambient. The differencebetween the heat sink and ambient air temperatures for all the cases wasnearly constant. Therefore, the total power loss, due to natural convectionand conduction through the test board, remains nearly unchanged between6 and 10 Watts. The loss can be conveniently calculated as the differencebetween the electrical applied power and the calorically computed energychange in the coolant. In fact, the measured change in the heat sink tem-perature with change in thermal loads, from lowest and to the highest valuetested, was smaller than 3 K, which should result in a nearly constant rateof power loss to the ambient due to natural convection. Power losses dueto conduction through the test board were very low due to the low thermalconductivity of the printed circuit board of about 0.4 W/(mK) [43] acting
44
3.3. Energy and Exergy Analyses
as a thermal insulator. The constant power loss in combination with the
Power applied[W] Power removed[W] Efficiency[%]
100 91±8 91±8
110 101±8 92±7
120 110±8 92±7
130 120±8 92±6
140 131±8 94±6
150 144±8 96±5
Table 3.1: Energy efficiency for various applied powers
increasing thermal loads is responsible for the enhanced efficiencies at higherthermal loads.Table 3.2 shows change in the heat removal efficiencies for coolant inlet tem-peratures varying from 30C to 60C. As expected, the efficiency decreaseswith increase in water inlet temperature and could be improved by usingfoam thermal insulation (HT Armaflex, Armacell Engineered Foams), whichminimized the thermal losses. With adequate insulation, the highest lossrecorded at 60C coolant inlet temperature could be limited to below 10%.The high 1st law efficiencies even at high coolant inlet temperatures makeenergy reuse a natural and profitable opportunity. One can imagine reusing
Inlet temperature [C] Power applied [W] Power removed [W] Efficiency [%]
30 100 98.7±8 99±8
40 100 95.9±8 96±8
50 100 93.6±8 94±8
60 100 90.9±8 91±8
Table 3.2: Energy efficiency for various coolant inlet temperatures
the hot water, used to cool processor chips in a data center, for space heat-ing. This strategy would minimize the need for fossil fuels in space heatingand, thereby, serve as an effective means to reduce the carbon footprint ofdata centers. This principle is currently employed for a small scale prototypedata center named Aquasar [44], which produces hot water an ETH Zurichbuilding. The potential for energy reuse, however, can be understood andquantified by carrying out an exergetic analysis on a single heat sink. Sincethe heat sink is a steady flow device, the exergy available at the outlet of theheat sink can be computed as [8]
Exout = m [hout − h0 − T0 (sout − s0)] (3.10)
45
3. Hot Water Cooled Electronics: Exergy Analysis and Waste Heat ReuseFeasibility
where h and s denote the specific enthalpy and entropy of water and sub-scripts out and 0 denote the outlet and reference ambient conditions, respec-tively. All numerical values for enthalpy and entropy for calculations wereobtained from thermodynamic tables [8].Figure 3.8a shows the exergy at the outlet of the heat sink as a function ofthe coolant flow rate for different coolant inlet temperatures. The heat loadwas kept at 100 W for these measurements. The case with the constant tem-perature differential between chip and coolant inlet temperature was addedto compare the performances. Clearly, in order to maximize the outlet ex-ergy with a fixed heat dissipation rate, one should maximize the water inlettemperature and use highest possible flow rates. In so doing, maximum al-
Figure 3.8: (a) Exergy available at the outlet of the heat sink (b) Exergy gain of the coolant for a givenheat load of 100 W
46
3.3. Energy and Exergy Analyses
lowed chip temperature must not be exceeded and care must be taken toavoid exceeding the pressure limit of the heat sink. The latter is directlyrelated to the bonding and fabrication techniques used to manufacture theheat sink. The combination of Eq. (3.3) and the expression for the removedpower, which is the numerator of the right hand side in Eq. (3.9), yields
Tout = Tchip − Q(Rth −
1
mcp
). (3.11)
This equation shows the influence of the applied power, thermal resistanceand mass flux on the coolant outlet temperature, which in turn is relatedto the outlet exergy. Using the definitions of the thermal resistances in Eq.(3.4) and (3.8), one obtains
Tout = Tchip − QRbase +RTIM +Rconv
A. (3.12)
Clearly, the fluid temperature at the outlet will be reduced with increasingthermal loads if the chip temperature is kept constant. Therefore, counterintuitively increasing the thermal load has an adverse effect on the outletexergy resulting from the lower coolant outlet temperature. Note that Eq.(3.12) is derived by eliminating the coolant inlet temperature. As pointedout earlier, the outlet temperature (and exergy) is directly related to thecoolant inlet temperature, therefore, increasing the coolant inlet temperatureremains a valid approach to improve the outlet exergy. Increasing the inlettemperature, however, leads to an increase in the exergy at the inlet of theheat sink. Therefore, it is more appropriate to calculate the exergy gain ofthe coolant as it flows across the heat sink, which can be expressed as
Exgain =(Exoutlet − Exinlet
)− Ppump, (3.13)
where Ppump is the power needed to pump water through the heat sink.The pumping power required for 1 l/min water flowing at 60C water inlettemperature is 0.24 W, which is negligible compared to the applied heat loadof 100 W.Figure 3.8b shows the variation in the exergy gain as function of the flowrate for the same cases. As the figure shows, the exergy gain triples byswitching the coolant inlet temperature from 30C to 60C. The gain, withinthe measurement error, is not influenced by the change in flow rate for aconstant thermal load and therefore only a function of the inlet temperaturefor the range of flow rates considered in the current work. Note that thepumping power term in Eq. (3.11) will naturally become significant for higher
47
3. Hot Water Cooled Electronics: Exergy Analysis and Waste Heat ReuseFeasibility
flow rates and result in a decrease of the exergetic gain. In addition, higherflow rates will also enhance the level of turbulent dissipation in the manifoldlayer thereby exacerbating the problem of exergy destruction due to rise inpumping power [28]. Understandably and more importantly, the exergy gainis also a function of the applied thermal load. Therefore, the exergy gainincreases in the “Maximum powe” case for high flow rates. However, thisincrease of 3 W is ten times smaller than the increase in the thermal loadshowing that the exergy destruction in the system is an important aspect toconsider. We can introduce the following exergy-based, second law efficiencyfor the heat sink to point out the importance of the different exergy inputsand outputs
η2nd =Exoutlet
Exinlet + Exel + Ppump, (3.14)
where Exel denotes the electric power supplied to the chip. This efficiencyis plotted in Fig. 3.9a as a function of the coolant inlet temperature and theflow rate. The 2nd law efficiency at 30C water inlet temperature and 0.3l/min water flow rate is merely 5% which is doubled by changing the flowrate to 1.0 l/min. The efficiency increases to 65% upon switching to 1.0 l/minflow rate and 60C inlet temperature. This corresponds to six fold rise inthe 2nd law efficiency although the 1st law efficiency decreases due to higherthermal losses to the ambient. Figure 3.9b shows that an appropriate selec-tion of inlet variables of water flow rate and the inlet temperature changeare beneficial for the 2nd law efficiency. A comparison of the case with con-stant heat rate to the case with the constant temperature differential showsthat the behavior of the 1st and 2nd law efficiencies are reversed. The high1st law efficiency for high thermal loads does not guarantee a high 2nd lawefficiency. The most dominant term in Eq. (3.14) for low flow coolant inlettemperatures is the electricity which is considered as pure exergy. The risein the second law efficiency with the increase in the coolant inlet tempera-ture is due to Exout being highly temperature dependent. Therefore, it isessential to increase the coolant temperature and to minimize the decreasein temperature between the liquid cooled electronic parts of the data centerand the coolant temperature.The exergy budget as shown in Fig. 3.10 can provide better insight into lo-cation and sources of the exergy losses occurring in the package. The initialinput to the system is 100 W electrical energy which is considered as pureexergy. A processor chip uses the electrical energy to perform computationsresulting in conversion of the electrical energy into heat. The exergetic valueof heat is markedly below the initial electrical energy (pure exergy) and can
48
3.3. Energy and Exergy Analyses
Figure 3.9: (a) 2nd law efficiency of the heat sink for various constant coolant inlet temperatures. (b)2nd law efficiency of the heat sink for constant chip temperatures at the upper thermal limit.
49
3. Hot Water Cooled Electronics: Exergy Analysis and Waste Heat ReuseFeasibility
be obtained as
ExQ = Q
(1− T0
T
)(3.15)
This value increases substantially by operating the chip at its upper thermallimit, which is normally about 85C. The conversion from electrical energy
Figure 3.10: Exergetic budget for the package
to heat already accounts for an exergy loss. This loss accounts for 82% of theinitial exergy for a water inlet temperature of 60C and 92% of the initialexergy for a water inlet temperature of 30C even though more than 98%of the energy is conserved (see Tab. 3.2). Further processes that result inexergy destruction are heat transport across a finite temperature differentialbetween the chip and the heat sink, between the microchannel walls and thecoolant, power losses to the ambient, and friction between the coolant andthe heat sink channel walls. One way to minimize the exergy losses is toreduce the temperature differential of heat transport, which is achieved byincreasing the temperature of cooling water. The measurements underscorethe thermodynamic importance of switching from air to water as coolant,which makes the chip cooling at high coolant temperature (hot water) feasi-ble.
50
3.4. Economic value of heat
3.4 Economic value of heat
Our measurements and analysis demonstrate the potential for energy reuse inelectronic cooling systems. The actual value of the heat, however, has to beassessed based on the individual reuse applications selected. Potential reuseavenues include space heating, refrigeration or desalination. Each strategyassigns a different value to the heat based on its own working conditions. Thisstudy will focus on the economic value of heat for space heating applications.General factors which have to be taken into consideration are the temperatureof the waste heat, available technologies to use the waste heat and pricesfor electric power and fossil fuels such as domestic fuel oil or natural gas.Therefore, we introduce a new metric called economic value of heat (VH) inorder to quantify the benefits of the heat recovered from hot water cooleddata centers as
VH =Cost of 1 kWh heat produced through combustion of fossil fuels (Cff )
Cost of 1 kWh heat from data centers(3.16)
The cost of the heat recovered from data centers is, in turn, related to the costfor electricity consumed by the data centers and the heat recovery efficiencyas
Cost of 1 kWh heat from data centers =Cost of 1kWh electricity (Cel)
Heat recovery efficiency (η1st)(3.17)
Therefore, the value of heat is also a function of the data center operationtemperature through its dependence on the heat recovery efficiency. The ap-plication specific economic value of the recovered heat was determined usingcountry specific information regarding the cost for electricity and fossil fuels[45]. Figure 3.11 shows the VH values for different countries to underscorethe importance of the data center location. However, a thermal energy reusestrategy also requires the definition of a certain minimal temperature thresh-old, in order for the hot water coming from the data center to be useful insecondary applications. For example, space heating based on standard wallradiators needs a higher temperature than that based on floor-installed heatexchangers. Therefore, at a sufficiently high temperature, both these applica-tions are feasible avenues for heat reuse, thereby improving the utility of heat.Clearly, a parameter is needed to account for this temperature-specific vari-ation in the utility of heat for any given reuse application and the economicvalue of heat introduced above should be modified to reflect this temperaturedependence. We account for this important aspect by introducing an appli-cation specific utility function (U) in the above definition of the economicvalue of heat. For every reuse application, the value of the utility functionshould vary from zero to one over a specific range of temperature and there-after remain constant. Clearly, such a utility function is system-specific and
51
3. Hot Water Cooled Electronics: Exergy Analysis and Waste Heat ReuseFeasibility
Figure 3.11: (a) Economic value of heat for space heating based on the costs for 1 kWh of electricity andfuel oil for different European countries. (b) Economic value of heat for space heating based on electricityand natural gas for different European countries
52
3.4. Economic value of heat
will also depend on the preferences of the designer. To illustrate the under-lying concept, in the current work we used sigmoid functions to obtain theapplication specific utility functions. The tem-perature range over which theutility function went from zero to one was 40C−70C. With inclusion of theutility function, the economic value of heat can be redefined as
VH = U × CffCel
η1st
(3.18)
Figure 3.12 shows the economic value of heat averaged over the Europeancountries shown in Fig. 3.11 as an illustrative example. The recovery effi-ciency (η1st) was taken from the measurements listed in Tab. 3.2. The valueof heat increases with temperature. However, this effect competes againstthe decreasing recovery efficiency which becomes significant at higher tem-peratures resulting in a decrease of VH for temperatures higher than 70C. Asa result, the optimal working range of a data center may not be at the high-est possible temperature. The Carnot efficiency factor, (1− T0/Tel), fromEq.(3.4) is also plotted in the figures as a measure of the normalized exer-getic content per unit heat output. The graph can be used to illustrate that
Figure 3.12: Value of heat for different reuse strategies. In the legend, fo and ng, respectively, denotefuel oil and natural gas.
the economic value of the recovered heat can be higher than its thermody-namic value. The reason for this is the possibility of a direct use of the heatwithout the need of a conversion back to mechanical work.In order to put things in context, one must also analyze the potential benefits
53
3. Hot Water Cooled Electronics: Exergy Analysis and Waste Heat ReuseFeasibility
of direct electricity generation using the heat extracted from the data centers.Therefore, the possible electricity generation based on a Rankine cycle [46](with 50% efficiency) was added to show that such a strategy is not economi-cally favorable relative to other alternatives for secondary usage. Other reusestrategies such as refrigeration based on adsorption chillers and desalinationcould become economically interesting if the coolant temperatures could beincreased even more. However, such strategies will work only if we succeedin reducing the temperature differential between electrical components andcoolant to less than 5C (i.e. through a better heat sink design). Althoughsuch designs with low temperature differentials have already been demon-strated in laboratory investigations [12], their scalability for data centers isyet to be realized. Alternately, we could also raise the coolant temperaturesby additional means such as by combining solar thermal systems with datacenters in hot and sunny climates. In a nutshell, plenty of opportunitiesremain to exploit the different reuse strategies, which will be location andapplication specific. To this end, the current work lays a foundation for aconsistent evaluation of their efficacy and economic value.
3.5 Conclusion
In conclusion, we have demonstrated that the cooling requirements of state-of-the-art electronic microprocessors can be efficiently addressed by simulta-neously achieving high exergetic efficiencies and reuse of the recovered heat.This was achieved by using hot water as coolant and well designed heat sinks.Using measurements on a microchannel manifold heat sink we showed thateven with water temperatures above 60C, the maximum chip temperaturedoes not exceed maximum allowable industrial specifications. Heat removal(1st law) efficiencies well above 90% were obtained through use of adequateinsulation. The high water outlet temperature opens up the possibility ofreuse the otherwise wasted heat. In addition, the use of hot water coolantled to a six fold rise in the 2nd law efficiency of the heat sink, showing theclear benefits of increasing the coolant temperature. The hot water coolingapproach opens up novel possibilities of data centers with minimal carbonfootprint, due to elimination of chillers required by current air cooled datacenters. The introduction of a new metric for the economic value of the recov-ered heat showed that the economic potential of the heat from data centersis much higher than its thermodynamic value. The metric was used to showthat secondary heat reuse strategies such as space heating could allow a di-rect use of the heat without any need for a conversion back to mechanicalwork.
54
Chapter 4
Aquasar: A Hot Water CooledData Center with DirectEnergy Reuse
This chapter has been published as:S. Zimmermann, I. Meijer, M. K. Tiwari, S. Paredes, B. Michel, D. Poulikakos,“Aquasar: A hot water cooled data center with direct energy reuse”, Energy,vol 43, pp. 237−245 (2012).
4.1 Introduction
The rapidly growing demand for data processing in communication, educa-tion, finance and medicine calls for improved electronic components and ithas resulted in ever increasing energy consumption by data centers [5]. Upto 50% of the consumed energy is spent to power the cooling infrastructure[23], thus making it a very important component in minimizing the energyconsumption of a data center. A detailed study on a real air cooled data cen-ter performed by Mitchell-Jackson et al. [47] clarifies the fact of high powerconsumption by the cooling equipment. With steeply rising need for energy[48], it is predicted that the operation costs for power and cooling will soonexceed the acquisition cost [49].The performance increase of microprocessors traditionally follows Moore’slaw [9] by shrinking the size of transistors so that an increasing number oftransistors could be placed per unit area on a single chip. Over the last fewyears the increasing device density has also led to an increased power densitybecause the transistor switching voltage could not be reduced fast enough.The resulting higher heat dissipation densities require new cooling solutions.
55
4. Aquasar: A Hot Water Cooled Data Center with Direct Energy Reuse
Due to its superior thermal characteristics over the traditional air cooling,single phase liquid cooling of electronic components is now a well-recognizedand practically unavoidable alternative to address rising heat dissipation den-sities. The cooling demand in electronic chips is expected to rise continuously.For example, it is now clear that the power densities of the next generation3D integrated chip designs make switching to water cooling inevitable [33]and will also require specific attention to both hydrodynamic and thermalaspects simultaneously [35]. Starting from the work of Tuckerman and Pease[10], who established the concept of high-performance forced liquid cooling,several studies focused on the thermal performance of micro channel basedheat sinks [24, 36]. Recent studies have also exploited highly sophisticatedinterfaces for backside heat removal using direct liquid jet impingement incombination with manifold micro channel heat sinks [37, 25]. The reducedthermal resistance of these interfaces decreases the temperature difference be-tween the processors and the coolant, enabling coolant temperatures abovethe free cooling limit. Free cooling has no need for any active pre-coolingequipment rendering energy intensive chillers unnecessary. This reduces theenergy and capital costs associated with running a data center and results ina more energy-efficient data center. Moreover, elevated coolant temperaturesopen up possibilities of energy reuse [39]. For example, the hot water from adata center can be used for building heating in moderate climates [38]. Suchan energy reuse strategy can minimize the overall system carbon footprint[26]. Global actions to reduce carbon footprints are crucial because energyfrom fossil fuels accounts for over 70% of the world energy usage [50]. Thereduction of the CO2 emissions achieved through energy reuse provides a vi-able path to reduce emissions in accordance with the international panel onclimate change [3], the Stern report [51] and the effort is also aligned withthe Kyoto protocol [4].However, using only energy [52] as a measure to identify the benefits of sucha system can be misleading because the quality of different kinds of energy isvery different. Therefore, the system analysis has to be performed in termsof thermodynamic exergy [53], which specifies the quality of an energy inaddition to its available quantity [8]. Shah et al. [40] introduced an ex-ergy based figure of merit for the evaluation of computational performanceat chip level. Analyzing exergy destruction at the system level in air cooleddata centers [13] provided crucial information about the usefulness of a greensystem. The minimization of exergy destruction in such a system will resultin more environment-friendly computing and will open new possibilities forthe reuse of its significant waste heat.In this paper, we report an experimental investigation, and the correspond-ing energy and exergy analyses based on Aquasar, the first hot water cooled
56
4.2. The AQUASAR System
supercomputer prototype. The prototype also has an air cooled part, whichfacilitated a direct comparison of water and air cooling options for data cen-ters. The system allows a direct comparison of the new hot water coolingconcept with traditional air cooling. The value of heat from Aquasar is de-termined for different reuse strategies. The work lays the foundation fordeveloping environmental-friendly computing data centers with energy reuseand minimal carbon footprint.
4.2 The AQUASAR System
Aquasar is a hot water cooled data center prototype with waste heat reuse.The system consists of 33 IBM BladeCenter QS22 PowerXCell and 9 IBMBladeCenter HS22 Intel Nehalem equally distributed in 3 IBM BladeCenterH Chassis with 14 BladeCenters in each chassis (see Fig. 4.1a). To comparethe performances of liquid and air cooled electronic components, two of thethree BladeCenter Chassis were retrofitted to enable liquid cooling while thethird one remained air cooled. On the BladeCenter level, the copper andaluminum heat spreaders were replaced by a copper cooling loop as shownin Fig. 4.1b. Every component dissipating more than 3 Watts of power wasdirectly connected to the cooling loop. Special attention was paid to thecooling of the processors. These were cooled by a manifold micro channel(MMC) heat sink specifically developed to address the cooling requirementsof these processors. A more detailed description of the heat sink performanceand design can be found elsewhere [28]. Additional temperature sensors weremounted on some BladeCenters to gather information about the temperaturedistribution and ensure reliable operation. The water as coolant was suppliedvia a manifold in the back plane of the chassis ensuring that each BladeCen-ter received the same amount of coolant. Figure 2 shows the coolant supplynetwork enabling heat transfer to the building heating grid. The coolantnetwork consisted of three separate closed cycles. The different cycles werenecessary to address the different purity requirements and to consistentlyprevent overheating of the system. The first cooling loop (referred as pri-mary loop) consisted of the cooling structure in the BladeCenters, two filters(5m and 50 m), sensors for measuring temperatures, pressure drops and thecoolant flow rate, a heat exchanger and two gear pumps driving the flow whileensuring redundancy. The temperatures were measured using duct temper-ature sensors (TF 050 NI1000, sensortec GmbH, Switzerland) which werecross calibrated to make relative measurements with an accuracy of 0.1C.Two differential pressure sensors (PDW-2,5U, sensortec GmbH, Switzerland)were used to measure the pressure drop over the filters and the BladeCenters
57
4. Aquasar: A Hot Water Cooled Data Center with Direct Energy Reuse
Figure 4.1: (a) Hot water cooled first of a kind data center Aquasar. (b) Water-cooled IBM BladeCenterQS22.
58
4.2. The AQUASAR System
with an accuracy of 0.5%. The coolant flow rate was measured using a tur-bine flow meter (Kobold, Germany) with an accuracy of 2.5%. The coolantin this loop was de-ionized water containing 0.1% of benzotriazole (BTA) asa corrosion inhibitor. The water purity requirements were stringent becauseof the copper MMC heat sink that is why two filters were used in the loop.The pressure drop across the filters and the BladeCenters was monitored tocheck for clogging that would result in an insufficient supply of coolant. Thedata gathered from the flow meter and the two temperature sensors, placedbefore and after the heat exchanger, were used to determine the heat ratepassed from the primary loop to the intermediate loop.The intermediate loop, with no special requirements for the purity of thewater, was introduced to supply the system with cold water in case of over-heating in the primary loop. The intermediate loop received the heat throughthe primary heat exchanger (referred to as PHE in Fig. 4.2) and passed itthrough the second heat exchanger (referred to as SHE in Fig. 4.2) to theETH heating grid. A three-way valve was installed before the secondaryheat exchanger to vary the hot water flow across it. Controlling the hot
Figure 4.2: Schematics of the cooling loop.
water flow through the secondary heat exchanger helped to control the heatflow and to maintain a constant inlet temperature to the cold side of the pri-mary heat exchanger. This arrangement helped to remove any temperaturefluctuations on the building side from affecting the data center operation. Asecond three-way valve including drain was installed after the secondary heat
59
4. Aquasar: A Hot Water Cooled Data Center with Direct Energy Reuse
exchanger to supply the system with cold water to prevent any accidentaloverheating of the system. To determine the heat flow, temperature sensorswere placed before and after both heat exchangers and the liquid flow ratewas measured using a flow meter. Moreover, the firmware of the electroniccomponents gave direct access to the electric power consumption allowingthe computation of the heat recovery efficiency. The power consumption,the reported temperatures from the BladeCenters as well as the flow, tem-perature, and pressure data from the primary cooling loop were stored in amySQL database for subsequent analysis. The air cooled part of the systemused chilled air with an inlet temperature of 23C and a constant volumetricflow rate of 820 l/s. The exhaust air in the back passed a plate heat ex-changer where 16C water was used to cool down the air before it re-enteredthe BladeCenter Chassis again. The cold water was supplied by mechanicalchillers operating with refrigerants at temperatures around 12C. The me-chanical chiller system subsequently lifted the temperature to 40C using avapor compression cycle to reject it to the ambient via a dry cooler.The fact that air cooling was needed for the air cooled blades and the powersupplies of the liquid cooled part of the Aquasar system resulted in additionalchallenges. If not properly controlled, the chilled air could leak to the hotwater cooled portions and result in additional convective losses, thereby low-ering the overall heat recovery efficiency. The air temperature could not beraised to minimize this effect because air is a much worse coolant than water.Water has an approximately 3500 times higher volumetric heat capacity anda 25 times higher thermal conductivity than air. The air cooled BladeCen-ters, the power supplies and the storage server imposed cooling constraintson the temperature and the amount of cold air that was circulating in thesystem. In addition, we must note that the entire electronic hardware wasoptimized for air cooling and the water cooling elements were retrofitted forthe prototype demonstrator. First, this meant that the air had multiple en-try points to the BladeServer to maximize the flow through the BladeServer.Secondly, there was an overpressure in the front due the fans of the chillerpre-cooling the air and there was a second aspirating fan in the rear respon-sible for a high airflow. To minimize air leaks, all air slots in the front andon the side of the two liquid cooled BladeCenter H Chassis were closed usingfoam thermal insulation (HT Armaflex, Armacell Engineered Foams) andKapton tape (Scotch 92, 3M). In addition, all the piping and the entire sup-plying structure of the liquid cooling loop were encased in Armaflex thermalinsulation to reduce convection losses.
60
4.3. Characterization
4.3 Characterization
4.3.1 Energy efficiency
The most relevant metric for secondary, heat reuse is the heat recovery ef-ficiency and its variation with the coolant temperature. The heat recoveryefficiency is the ratio of the rate of heat removal by the coolant and theconsumed electrical power. The heat removal rate was calculated as
Q = m · c · (Tout − Tin) . (4.1)
The Q was a function of the mass flow rate m and the specific heat c andthe change in temperature.The energy efficiency for data centers is assessed using standard metrics suchas the power usage effectiveness (PUE) [54] and the energy reuse effectiveness(ERE) [52]. These metrics were introduced by the green grid [55], a reputablenon-profit organization addressing power and cooling requirements of futuredata centers. The PUE value, defined as
PUE =PDataCenter + PCooling
PIT, (4.2)
is a measure of how efficiently a data center is using power. The symbolsPDataCenter, PCooling and PIT respectively denote the total power consumptionof a data center, the power spent on cooling devices and the power spent onthe IT equipment i.e. for computing, storage and network equipment. Thelower the value of the PUE metric, the better the data center because a lowPUE value implies that most of the energy consumed in a data center isactually used for computing. The PUE value does not take into account thepossibilty of heat reuse. Therefore, the metric ERE, defined as
ERE =PDataCenter + PCooling − Preuse
PIT, (4.3)
was used. ERE properly accounts for the new idea of benefits achievedby introducing waste heat reuse from a data center. The parameter Preusedenotes the power supplied to a secondary application, which is space heatingfor Aquasar.
4.3.2 Exergy analysis
To evaluate the usefulness of the energy recovered from the data center, anexergy analysis needs to be performed. Exergy is a thermodynamic property,
61
4. Aquasar: A Hot Water Cooled Data Center with Direct Energy Reuse
which helps assess the differences in the quality of different kinds of energy.Following standard thermodynamic practise, the electric power supplied tothe data center is considered pure exergy whereas only a part of the heatrecovered can be converted to useful work, which limits the exergy contentof heat. The exergy content of the heat dissipated by the processors is givenby
ExQ = Qel
(1− T0
Tel
). (4.4)
Qel, Tel and T0 denote the amount of the dissipated heat, the surface temper-ature of the processors and the ambient reference temperature, respectively.The exergy gained by the coolant through the heat it recovers in course offlowing across the Aquasar system can be expressed as the difference in theflow exergies as
Exout − Exin = m [hout − hin − T0 (sout − sin)] . (4.5)
The symbols h and s denote the enthalpy and the entropy of the coolant.Equation 4.5 is also used to characterize the exergy gain of the intermediatecoolant as it flows across the primary heat exchanger. The difference in theexergy gains of the primary and the intermediate coolants is essentially theexergy loss across the heat exchanger.The exergy analysis of the air cooled part in the system needs to be performedseparately because the temperature levels of the chilled air and the coldwater (see Fig. 4.2) remain below the ambient temperature. Therefore, theevaluation of the change in the flow exergy would yield negative values forboth inlet and outlet states of the air. In addition, the rise in temperaturedue to the heat transfer results in an outlet state closer to the ambient thanthe inlet state. To overcome the inconvenience of negative exergy, the exergyof such media can be evaluated using a reverse Carnot cycle. Under variablesurface temperature, the resulting exergy transferred through a differentialamount of heat transfer can be expressed as [56]
dEx =
(T0 − TT0
)dQ =
(T0 − TT0
)m cp dT. (4.6)
The differential exergy in Eq. (4.6) can be integrated to produce an expres-sion for the exergy gain as function of the initial and the final temperatures
Ex = m cp
[(Tout − Tin)− T 2
out − T 2in
2T0
](4.7)
62
4.3. Characterization
The exergy analysis is completed by a calculation of the 2nd law efficiency forthe primary and the intermediate liquid cooling cycle (see Fig. 4.2) given as
η2nd =Exout
Exin + Exel + Ppump. (4.8)
The symbols Exel and Ppump denote the electric input and the pumping powerneeded to drive the coolant through the cooling structure.
4.3.3 Application specific economic value of recoveredheat
Typically, heat is not considered a valuable energy form due to its low ex-ergetic content. However, the economic value of heat can be significantlydifferent because the otherwise wasted heat can be used in secondary ap-plications, which conventionally use combustion of fossil fuels to obtain therequired heat. Therefore, we introduce a new metric called economic value ofheat (VH) in order to quantify the benefits of heat recovered from hot watercooled data centers as
VH =Cost of 1 kWh heat produced through combustion of fossil fuels(Cff )
Cost of 1 kWh heat from data centers(4.9)
The cost of heat recovered from data centers is, in turn, related to the costfor electricity consumed by the data centers and the heat recovery efficiencyas
Cost of 1 kWh heat from data centers =Cost of 1kWh electricity (Cel)
Heat recovery efficiency (η1st)(4.10)
The application specific economic value of the recovered heat was deter-mined using country specific information on cost for electricity and fossilfuels for reuse strategies such as space heating, refrigeration based on ad-sorption chillers and desalination. However, a thermal energy reuse strategyrequires the definition of a certain minimal temperature threshold, in orderfor the hot water coming from the data center to be energetically useful. Thehigher the water temperature above this threshold, the easier it is to utilizeheat through multiple means. For example, space heating based on standardwall radiators needs a higher temperature than that based on floor-installedheat exchangers. Therefore, at a sufficiently high temperature, both theseapplications are feasible avenues for heat reuse, thereby improving the util-ity of heat. Clearly, a parameter is needed to account for this temperature-specific variation in the utility of heat for any given reuse application and theeconomic value of heat introduced above should be modified to reflect this
63
4. Aquasar: A Hot Water Cooled Data Center with Direct Energy Reuse
temperature dependence. We account for this important aspect by introduc-ing an application specific utility function (U) in the above definition of theeconomic value of heat. For every reuse application, the value of the utilityfunction should vary from zero to one over a specific range of temperatureand thereafter remain constant. Clearly, such a utility function is system-specific and will also depend on the preferences of the designer. To illustratethe underlying concept, in the current work we used sigmoid functions to ob-tain the application specific utility functions. The employed utility functionsare plotted in Fig. 3. The temperature range over which the utility functionwent from zero to one was 40C - 70C for space heating, 65C to 90C forrefrigeration, and 55C to 80C for desalination. With inclusion of the utility
Figure 4.3: Utility functions for different reuse strategies.
function, the economic value of heat can be redefined as
VH = U × CffCel
η1st
(4.11)
4.3.4 Uncertainty analysis
The uncertainties in the physical measurements of temperature, pressure,flow and consumed power were mentioned above in the system description.These parameters were measured separately and therefore considered to beindependent of each other. The experimental uncertainty of the measured
64
4.4. Results
heat rate was calculated using propagation of error [57] as follows:
∆Q =
√√√√(∂Q∂m
∆m
)2
+
(∂Q
∂ (Tout − Tin)∆T
)2
(4.12)
The uncertainties for the exergy values were also calculated in a similarmanner.
4.4 Results
4.4.1 Energy
The parameters of a data center relevant for secondary, heat reuse applica-tions were analyzed first. Figures 4.4 and 4.5 show the results. To this end,the two most important parameters are the heat recovery efficiency and thetemperature level at which the heat is available. The recovered heat was
Figure 4.4: Energy budget in the water cooled data center. (a) Power consumed and recovered and (b)recovery efficiency as a function of the coolant temperature.
evaluated as a function of the coolant inlet temperature under three differentworking conditions which cover the entire working range of the system (i.e.the data center). The condition labeled “Full load” describes the systemoperating at full computational capacity. This is achieved by running a fullload exerciser. The second working condition labeled “Idle” describes the sys-tem powered on and operating without any additional computational load.
65
4. Aquasar: A Hot Water Cooled Data Center with Direct Energy Reuse
These two working conditions represent the boundaries of the normal work-ing condition of a real data center. The last working state labeled “Powerof” describes the system with no electrical power applied to the servers. Thismode was tested to determine a lower reference for the power (heat) loss tothe ambient since the system runs at a temperature well above the ambient.Figure 4.4a displays the electric power delivered to (and consumed by) the
Figure 4.5: Absolute power loss as a function of the coolant temperature.
system and the heat recovered from it as a function of the water inlet tem-perature. The power consumption of the electronic components increases by7±1% as the coolant temperature rises from 30C to 60C. This effect is dueto the increase in the electric resistances in the communication wires andthe leakage currents in the microprocessors. Figure 4.4a also shows a simul-taneous decrease in the amount of heat recovered because with an increasein water inlet temperature the system operates at an overall higher temper-ature. The resulting higher temperature difference to the ambient leads toincreasing losses due to natural convection. All the careful measures to min-imize air leaking to the liquid cooled components resulted in a heat recoveryefficiency of 80% for the “Full load” operating system at an inlet temperatureof 60C. Figure 4.4b shows the recovery efficiencies for the working modes“Full load” and “Idle”. As expected the recovery efficiency decreases as afunction of temperature, however, the decrease of the recovery efficiency forthe idle working mode is significantly steeper. This indicates that the higherthe computational load, the better the thermal performance of the system.Figure 4.5 shows the variation of lost power with water inlet temperature.Within the measurement error, clearly the different load conditions coincide
66
4.4. Results
and the power loss from the system appears only to be a function of thecoolant temperature. The similarity of the measured absolute power lossesfor all working modes implies that the heat generated on BladeServer level isvery well captured by the coolant. Thus the cooling structure is very efficientin capturing the heat of all attached electronic components and the losses tothe ambient are not affected by the applied computational load in the sys-tem. The losses to the ambient are dictated by the conduction of heat fromthe BladeServers to the chassis, the losses in the pumping module and thelosses in the piping necessary to transfer the heat to the heating grid. Thisshows the need for an effective insulation for such thermal energy recoverysystems.The next step was the evaluation of the general energy efficiency of datacenters using the PUE and ERE values. The PUE value as a function of thecoolant temperature can be seen in Fig. 4.6. The PUE for Aquasar staysconstant at a value of 1.15, within the experimental error, for the entireworking range. For comparison, an industry average air cooled data centerhas a PUE around 2.5 [49]. The value of PDataCenter is difficult to determine
Figure 4.6: Data center metrics describing energy efficiency with (ERE) and without (PUE) energyreuse.
[58] because the energy spent on support, security and emergency must alsobe included and is not known accurately a priori. This sometimes resultsin implausible PUE claims. The lowest claimed PUE values are all basedon the principle of free cooling discussed in the introduction section. Thereduction in PUE for Aquasar compared to a traditional data center is dueto the reduced energy spent for the cooling loop. The ERE values were also
67
4. Aquasar: A Hot Water Cooled Data Center with Direct Energy Reuse
plotted in Fig. 4.6 as a function of the coolant temperature. The ERE valueincreased for elevated coolant temperatures because of the decreasing recov-ery efficiency. This value is highly dependent on the effectiveness of the datacenter insulation and the temperature difference between the system and itsimmediate surroundings.
4.4.2 Exergy Analysis
An exergy analysis was performed to identify the major sources for exergydestruction in Aquasar. T0 = 30C was chosen as ambient temperature be-cause it coresponded to the laboratory temperature which was not activelyregulated. Figure 4.7 depicts the control volumes used to evaluate the rel-evant exergy contents in different parts of the data center. In all instancesshown we include both the coolant and the server in our control volumedefinitions. The exergy at chip level is the first quantity of interest and itis evaluated by analyzing the control volumes marked by green rectanglesin Fig. 4.7a. The control volumes consist of electronic components suchas the microprocessors because their temperature determines the quality ofthe dissipated heat. The exergy gain of the primary coolant on the hot sideof the primary heat exchanger is the second quantity of interest. The flowexergy gain is computed as the difference in flow exergy between inlet andoutlet ports to the components within the control volume marked by greenrectangles in Fig. 4.7b. The exergy computed in this way is a measure of theexergy available from the electronic components after taking in to accountthe irreversibilities associates with the pumping losses for coolant circulation,heat loss from the main system and heat transfer across a finite temperaturedifferential. Equation 4.5 is also used to characterize the exergy gain of thesecond coolant, i.e. at the cold side of the primary heat exchanger, to de-termine the exergy loss across the heat exchanger. The results for the threedifferent positions are plotted in Fig. 4.8a for the data center operating atfull load. This becomes even clearer if we notice that the electric power con-sumption plotted in Fig. 4.4a is nearly 7 kW or higher, whereas maximumexergy gains (recovered) plotted in Fig. 4.8a remain under 1000 W. Clearly,the highest loss of exergy is due to the conversion of electricity to heat duringthe operating time of the electronic components. This can be better under-stood by considering two numerical examples. According to Eq. (4.4), usingwater at 30C as coolant with a resulting chip temperature of 45C andassuming an ambient temperature of 30C, this conversion accounts for aloss of 95% of the initial available exergy. The loss can be reduced to 87%by switching to hot water at a temperature of 60C as coolant and therebyraising the operating temperatures of the processors to an average of 75C. A
68
4.4. Results
Figure 4.7: Important locations for the exergy analysis. (a) Heat generated by the electronic componentsduring operation (b) primary cooling cycle (c) intermediate cooling cycle. The control volumes analyzedare marked within green rectangles.
69
4. Aquasar: A Hot Water Cooled Data Center with Direct Energy Reuse
similar tendency is seen for the exergy gain of the primary coolant shown inFig. 4.8a. The available exergy at the heat exchanger is increased althoughthe energy passing through the heat exchanger is decreased due to higherthermal losses to the ambient at elevated temperatures. The main reasonfor the exergy destruction between the chip and the primary coolant is theheat transfer across a finite temperature difference. Reducing this differenceresults in a lower exergy destruction. The last exergy change of interest is theexergy gain of the intermediate coolant as it flows through the primary heatexchanger. The control volumes (green rectangles) in Fig. 4.7c can be usedto evaluate this exergy gain. The result is plotted in Fig. 4.8a and it showsthat the exergy destruction across the heat exchanger is negligible comparedto the exergy loss due the conversion from electricity to heat. However, thisis a source of exergy destruction that can be reduced through a better de-sign of the exchangers. The smaller the temperature difference between thecoolant in the primary and in the intermediate loop, the smaller the exergydestruction across this heat exchanger.The exergetic output from the air and the liquid cooling approaches need tobe critically analyzed in order to underscore the benefits of hot water cool-ing. Within measurement error, the coolant flow rates (on both water andair cooled sides) were kept constant in this study. As a result, for the dif-ferent coolant temperatures tested, the temperature difference between chipand coolant was over 35C for air cooling and 15C for water cooling. Thedetailed temperature measurements are not shown for brevity. In order toobtain a fair comparison, the exergy gains in the air and liquid cooled casesshould be compared at the same chip temperature. Therefore, in Fig 4.8b theexergy gains at 23C for the air cooled case should be compared with that of45C for the liquid cooled case. Clearly, with water we have a much highergain in exergy due to lower temperature difference between the chip and thecoolant. In this context, it is important to mention that with air cooling anadditional exergy penalty is always present due to the use of chillers whichare needed to reduce the air temperature. In addition, no reuse of the wasteheat is possible because of the low coolant outlet temperature.The second law efficiencies computed from measured temperatures, flow ratesand pressure drops are plotted in Fig. 4.9 as a function of the coolant in-let temperatures. The most dominant term in Eq. (4.8) is the electricitywhich is considered as pure exergy. The rise in the second law efficiency withthe increase in the coolant inlet temperature is due to Exout being highlytemperature dependent. Therefore, it is essential to increase the coolanttemperature and to minimize the decrease in temperature between the liq-uid cooled electronic parts of the data center and the heat reuse application.The influence of the introduction of an intermediate loop to prevent over-
70
4.4. Results
Figure 4.8: (a) Exergy at different positions in the water cooled part of the Aquasar system. (b) Directcomparison of the available exergy for air and water cooling.
71
4. Aquasar: A Hot Water Cooled Data Center with Direct Energy Reuse
heating in the Aquasar system results in the different exergetic efficienciesfrom the primary and the intermediate cooling cycles. The decrease in tem-
Figure 4.9: Second law efficiencies of the primary and intermediate liquid cooling cycle.
perature between the primary and the intermediate cooling cycles accountsfor a reduction of the exergetic efficiency of up to 40%. The highest mea-sured efficiency was 34% for the internal loop at the highest coolant inlettemperature.
4.4.3 Application specific economic value of recoveredheat
The economic value of heat is very distinct for the different secondary reuseapplications. In addition, costs for electricity and fossil fuels are country spe-cific [45] making the location of the data center an important decision. Figure10 shows the results for Switzerland (CH) [59] as an illustrative example. Therecovery efficiency (η1st) was taken from the measurements plotted in Fig.4.4b. The value of heat increases as a function of the temperature. However,this effect competes against the decreasing recovery efficiency which is domi-nant at higher temperatures. As a result the optimal working range of a datacenter may not be at the highest possible temperature. One can consider the
Carnot efficiency factor,(
1− T0Tel
), from Eq.(4.4) as the normalized exergetic
content per unit heat output. This temperature dependent exergetic contentof the heat was added to Fig. 4.10 in order to show that the economic value
72
4.4. Results
of heat can be higher than its exergetic content. The reason for this is thepossibility of a direct use of the heat without the need of a conversion backto mechanical work. The value of heat for refrigeration based on adsorption
Figure 4.10: Value of heat for different applications.
chiller was assessed using mechanical chillers as a reference. The low coeffi-cient of performance for current commercial adsorption chillers is responsiblefor the low value of heat in the refrigeration reuse strategy in countries likeSwitzerland. However, this is in contrast with countries such as Saudi Ara-bia (SA) where for domestic consumers the price for 1 kWh electricity riseswith increase in their consumption [60]. Such a scenario could significantlyincrease the value of heat for refrigeration.In order to put things in context, one must also analyze the potential benefitsof direct electricity generation using the heat extracted from the data centers.Therefore, the possible electricity generation based on a Rankine cycle [46](with 50% efficiency) was added to show that such a strategy is not econom-ically favorable relative to other secondary usage alternatives. Overall, bycomparing the different VH trends in Fig. 4.10 we can see that for coolanttemperatures in the working range of the Aquasar system (30C-65C), spaceheating is the most promising reuse strategy. Other re-use strategies couldonly become economically interesting if the coolant temperatures could beincreased by smaller (<5C) gradients between electrical components andcoolant or when coolant temperatures can be lifted by combining solar ther-mal systems with data centers in hot and sunny climates.
73
4. Aquasar: A Hot Water Cooled Data Center with Direct Energy Reuse
4.5 Conclusions
Using measurements and analyses on a data center prototype called Aquasar,we have demonstrated that the cooling requirements in data centers canbe efficiently addressed by using hot water as coolant. The lower thermalresistance of liquid cooled heat sinks enabled the coolant temperature to beraised to 60C. With chilled air at 23C the processors in the air cooled sideof the data center could be cooled with a temperature differential of 35C.Clearly, considerable exergy is also expended to pre-cool the air. On the otherhand, the hot water at 60C could be effectively used to cool the processorson the water cooled side with a temperature differential of only 15C. Thebenefits of the liquid cooled solution were the higher exergetic output and thepossibility of a direct use of up to 80% of the recovered heat for space heating.The energy efficiency metrics PUE and ERE of this hot water cooled datacenter were significantly better than in industry averaged air cooled datacenters because no additional coolant chillers were required which normallyuse as much energy as all the electronic components together. Switchingto hot water as coolant increases the exergetic efficiency up to 34% for thehighest operation temperatures. Reuse strategies such as space heating andrefrigeration using adsorption chillers were tested as potential means to usewaste heat from data centers. It was shown that an application specificanalysis of the economic value of the recovered heat can provide additionalinformation about the best reuse strategy. Direct use of data center heatfor space heating provided the highest economic value of heat for the systemunder investigation.
74
Chapter 5
Feasibility analysis onimmersion cooling of serverpower supplies
5.1 Introduction
Information technology industry can contribute in two different ways to thereduction of green house gas emissions, first by reducing its energy consump-tion and second by reducing the need for transportation of persons and mate-rials. The second approach will increase the demand for IT infrastructure andthus emphasizes the importance of measures taken to decrease their energydemand. The vision of a zero emission data center [26] includes the reuse ofthe heat dissipated from data centers. Depending on the temperature levelof the otherwise wasted heat, different reuse option become possible. Fortemperatures exceeding 60C, space heating, district heating or driving anadsorption chiller are plausible applications. Energy efficient cooling solu-tions including heat reuse have been shown in the previous chapters. Studieson Aquasar [44], the first hot water cooled supercomputer prototype havedemonstrated that hot water cooling solutions provide a viable path to re-duce the energy spent for cooling supercomputers and allow energy reuse forsecondary applications. However up to now, the storage server, the networkswitches and the power supplies are still air cooled. To further proceed on theway to the vision of the zero emission data center, the heat recovery fractionshould be further increased. Converting previously air cooled componentsto become part of the liquid cooling loop is the next step to eliminate airas coolant in supercomputers. Immersion cooling of the power supply is apossible way to attach the power supplies to the hot water cooling loop. This
75
5. Feasibility analysis on immersion cooling of server power supplies
allows the elimination of any air flow through the supercomputer and a directrecovery of the heat dissipated in the power supplies.Two phase cooling systems are found more widespread in literature [61, 62].Compared to single phase systems they have a much higher maximal heattransfer. However when compared to other cooling systems, single and twophase systems have a lot in common. Tuma et al. [63] discuss the motivationand the requirements for the immersion cooling of electronic equipment. Itis shown that the power density in two phase systems is limited by the elec-tronic design rather than the thermal conditions. For cooling a 1kW moduleonly roughly 100 cm3 of fluid is needed. The same authors presented a com-parison to water or glycol based system which revealed the advantages ofpassive cooling systems [64]. They are relatively light−weight, do not needany auxiliaries and there is no danger of short circuits in case of leakage.This is beneficial in terms of price, reliability, simplicity, weight, safety andsize. Commercially available dual-side soldered modules are well suited forimmersed two phase cooling systems. Tantolin et al. [65] investigated thedifferent influence parameters of a passive, closed two phase system. Thetop plate of the tank was finned on the inside to increase heat transfer. Theparameters investigated were: fin geometry, liquid level inside the tank, po-sitioning of the heat source, amount of non-condensable gas trapped in thetank, external heat removal rate and the positioning of other componentswithin the tank. The most important variables were the external heat re-moval rate, the stack position and the amount of trapped non-condensablegas. The position of the heat source should be at the lowest position possi-ble, as a higher liquid level above the source allows for a higher heat transferrate. The aim of this chapter is to prove the feasibility of this concept andto characterize the performance of such a power supply compared to an aircooled version.
5.2 Experimental Setup
5.2.1 Fluid
In free (or natural) convection the fluid flow is not externally driven, but ispart of the heat transfer phenomena. A density gradient and a body forceproportional to the density must be present to generate a flow in the fluid.This results in a buoyancy force driven flow field where the body force iscaused by the gravitational field and the density gradient is linked to a ther-mal gradient. However the mere presence of a density gradient and a bodyforce is not enough for free convection to occur. The densities of gases and
76
5.2. Experimental Setup
liquids depend on temperature, most often the density decreases with in-creasing temperature. In this case the fluid gets heated up at the bottomand thus becomes lighter and rises to the top where it gets cooler and heav-ier and starts sinking again. For the opposite case, where the temperaturedecreases from top to bottom, there will not be any flow and thus heat willonly be transferred by means of conduction. The ratio of the buoyancy toviscous force acting on a fluid is approximated by the Grashof number (Gr):
Gr =gβ (Ts − Tinf)L
3
ν2(5.1)
Where g, β and ν denote the acceleration due to Earth’s gravity, the volu-metric thermal expansion coefficient and the kinematic viscosity, respectively.(Ts-Tinf ) represents the temperature difference between the heat source andthe bulk of the fluid surrounding it. L denotes a characteristic length scale.Another important dimensionless quantity to quantify natural convection isthe Rayleigh number (Ra), which is the product of the Grashof and thePrandtl (Pr)number given as:
Pr =cp · µλfluid
(5.2)
cp, µ and λ respectively denote the specific heat capacity, the dynamic vis-cosity and the thermal conductivity. The Rayleigh number is used as anindicator if a buoyancy force driven flow will establish and to calculate theNusselt number (Nu) which is relevant to calculate the convective heat trans-fer coefficient. The immersion fluid should have a low viscosity and a highthermal conductivity in order to achieve a high convective heat transfer co-efficient. Furthermore the selection range for the fluid is reduced by thecritical need of electrical insulation. The fluid has to be environmentallyfriendly and readily biodegradable. For this reason classic refrigerants suchas fluorocarbons or hydro-fluorocarbons cannot be used.
5.2.2 Reworked power supply
A common air cooled Emerson 7001606-J000 power supply which is already inuse in general purpose datacenters was the starting point to test the feasibilityof a full immersion cooling technique. The first important step was to designa new casing for the power supply which is completely sealed as shown inFigure 5.1. The basic casing of the air cooled power supply was kept, howevera new front and back cover were machined to seal the compartment. Thetop of the power supply was replaced by a copper plate to guarantee efficient
77
5. Feasibility analysis on immersion cooling of server power supplies
Figure 5.1: Scheme of the new casing for the immersed power supply.
heat removal from the top side. The top side was water cooled by a U-shaped pipe which was soldered to the top plate for efficient heat removal.All gaps were filled with clear, silicone based glue (Dow Corning 3145 RTV).The power supply was connected to an extension vessel placed half a meterabove the test stand. The extension vessel was necessary to compensate forthe thermal expansion of the fluid thereby controlling the pressure inside thepower supply. The vessel was also used to create the hydrostatic pressureneeded for the filling procedure as shown in Figure 5.2. The filling had to
Figure 5.2: Filling of the power supply
be slow because any air trapped beneath the electronic components would
78
5.2. Experimental Setup
eventually rise to the top and generate a thermally insulating gas film. Due tothe slow process in combination with periodic agitation of the power supplyany air trapped was released before the final sealing of the power supply.Additional temperature sensors were included to draw a temperature mapinside the power supply thereby pointing out components in need of a betterattachment to the cooling loop (see Figure 5.3).
Figure 5.3: Placement of the thermocouples
5.2.3 Flow loop
The aim of the measurement and control system is on the one hand to collectand save all the relevant data of the experiment and on the other hand tomaintain stable measuring conditions. A scheme of the experimental flowloop is shown in Figure 5.4. The core element of this system is a LabViewprogram, which gathers all the data and sets the control variables. Withthe exception of the power measurement at the input of the power supply,all sensor data is collected by a Keithley 3706 multimeter. The coolantinlet temperature to the top plate was controlled using a heat exchangerwhich was connected to a separate flow loop. The flow loop was fitted to aheater/chiller (Proline RP 855, Lauda, Germany) unit to regulate the tem-perature with an accuracy of 0.1C. The coolant flow rate was measuredusing a Coriolis flow meter (Emerson, Switzerland) with an accuracy of 0.2%over the entire range (0.1 - 1.8 l/min) of operation. A differential pressuresensor (Honeywell, USA) and two thermocouples (Omega Engineering Inc.,USA) were used to measure the pressure drop, and inlet and outlet tempera-tures. The manufacturer specified precision of the differential pressure sensoris 0.001 bar. The two thermocouples were cross calibrated in a temperaturebath to make relative measurements with an accuracy of 0.1C. The serverunder investigation is an iDataPlex server which is already in use in IBMSuperMUC system [66], a hot water cooled system with 90% heat recovery.
79
5. Feasibility analysis on immersion cooling of server power supplies
Figure 5.4: Schematic of the experimental flow loop
In the test setup, two nodes are implemented. Under normal operation twonodes also require two power supplies. However one of them is only used asback-up and the testing power supply is higher due to the needed changes,than the original one. It is only possible to run the server with one powersupply, as the other one does not fit into the casing anymore.
5.3 Results
Before the start of the actual measuring with the immersed power supply, areference measurement with a conventional air cooled power supply is made.The aim of this run is to have a reference with which the later produced datacan be compared in terms of electrical power drawn to supply the iDataPlexnodes. In Figure 5.5 the results of these measurements are shown for CPUworkloads of the nodes of 70%; 100% and 100% with boost. The boost modeover−clocks the processors and therefore allows a higher computational per-formance.For each value of the water inlet temperature and a constant volume flow
of 0.8 l/min, three different workload levels of the server are tested. Thesefour load levels are: 70%, 100% and 100% with boost. For safety reasons themeasuring series is started at Tw,in = 25C and a CPU-workload of 70%. Sub-sequently the workload is increased, then the inlet temperature is increasedand the procedure is started again. Like this inlet temperature 25C, 30C,
80
5.3. Results
Figure 5.5: Power reference for the air cooled case
40C, 50C and 60C are measured. All the properties with exception of theCPU-workload are controlled and/or monitored by this system; the measureddata is saved as soon as a steady state is reached. The CPU-workload hasto be manually controlled over the console of the server itself. The measuredproperties are the electric input power Pel,in the temperatures inside thepower supply Ti,16 and the water inlet and outlet temperature from whichthe dissipated heat through the top can be calculated as
Q = mcp (Tf,out − Tf,in) (5.3)
Heat is also dissipated through the bottom and the sides of the power sup-ply because the casing that includes the nodes and the power supply actsas a heat spreader. One part of this heat is captured by the cooling loop ofthe nodes, while the other one is lost to the ambient. Figure 5.6 shows thechange in electric power drawn as a function of the water inlet temperature.The relative increase in power consumption compared to the reference caseis up to 2% which correspond to 14 Watts for 100% computational load andboost. However, the actual power consumption of the power supply is lower,because a fan was connected to the power supply during all measurements.This fan was necessary because the firmware of the power supply needed afeedback signal of the fan in order to work properly. The power consumption
81
5. Feasibility analysis on immersion cooling of server power supplies
Figure 5.6: Power consumption of the full immersed power supply
of the fan is approximately 5-6 Watts which accounts for almost half of theincreased power consumption.The data gathered with the thermocouples in the power supply is plotted inFigure 5.7. The plot shows that different computational loads on the iDat-aPlex nodes do not have the same impact on all components under investi-gation. Therefore, the temperature map changes significantly as a functionof the workload. The thermocouples Ti,1 and Ti,2 were attached to alu-
Figure 5.7: Component temperatures as function of the workload for different water temperatures
82
5.4. Conclusion
minum heat spreaders for the air cooled case, their increase in temperatureas a function of the workload on the nodes was by far the highest. Thus,a direct connection through thermal paste would be favorable to keep thesetemperatures under control and enhance the heat transfer through the top.Figure 5.8 show the heat recovery for the different computational load forwater inlet temperature of 25C.The heat recovered from the power supplycontributes significantly the overall heat recovery efficiency as the recoveredheat from the nodes is approximately 300 Watts. The inclusion of the power
Figure 5.8: Heat captured for potential reuse
supply allows increasing the overall heat recovery by 13%. In addition, thereduced air flow through the nodes will also have an impact which will raisethe efficiency even higher.
5.4 Conclusion
The feasibility of immersion cooled power supplies has been demonstrated. Itwas shown that power consumption of the immersed power supplies increasesby 1-2%. However, the recovered heat and the elimination of the air flow inthe servers has a bigger influence on heat recovery efficiency. Consequently,any additional cost due to the increased power consumption can be justified
83
5. Feasibility analysis on immersion cooling of server power supplies
by the increased potential for heat reuse. Furthermore it has been shown thatthe power supply is able to work at inside temperatures above 80C allowingfor water inlet temperatures of 60C or even higher. Therefore, this conceptis compatible with hot water cooling and could be the next step towards azero-emission data center.The current state of the placement of the components is optimized for aircooling which corresponds to a horizontal flow, however natural convection isconnected to a vertical flow regime. Thus, if the placement of the componentsis adjusted, large improvements are possible with little effort. A possible wayto increase the heat transfer could be to connect certain components directlyto the lid. A further improvement can be achieved by adding fins to the lid,thereby increasing the active heat transfer area.
84
Chapter 6
HCPVT Receiver PackageUsing Advanced Liquid Coolingfor High Energy Efficiencies
6.1 Introduction
The worldwide energy demand continues to rise due to ever increasing globalpopulation and industrialization. High concentration photovoltaic systems(HCPV) are a promising technology for renewable power generation. HCPVis based on the use of optical devices that increase the light intensity on asolar cell surface with a concentration factor greater than 300 suns [67]. Themain idea is the reduction in cost per kilowatt-hour produced by substitu-tion of expensive solar cell area with lower-cost optics [68, 69]. In HCPV dishsystems, a special design for the solar cell module and an active cooling ofthe receiver are necessary in order to handle the intense irradiation of up to500 kWm−2 corresponding to an optical concentration ratio of 500. As thesolar cell module is divided into individual solar cells the area that is usedfor the interconnection is inevitably exposed as well and therefore representsa loss of active PV area. The assembly of an efficient dense array of photo-voltaic cells becomes very difficult and at same time very important in CPVsystems. The module efficiency is increased by reducing the interconnectingarea between the adjacent photovoltaic cells. Any area spent for intercon-nects and in particular the metallic front electrode grid is lost for the solarpower generation. By using monolithic interconnected modules (MIMs) avery small interconnection area can be achieved [70]. The MIM concept wasintroduced in 1980 [71]. MIMs consist of several photovoltaic cell segments,which are series-connected during the cell fabrication process. In that way
85
6. HCPVT Receiver Package Using Advanced Liquid Cooling for HighEnergy Efficiencies
the active area is divided in several series-connected segments that renderthe MIM to be a high voltage and low current device. Because of the lowcurrents, power losses due to series resistance can be kept small.The thermal management of HCPV systems has become a crucial factorto further increase power generation efficiency, because despite high photo-voltaic conversion efficiencies more than 70% of the irradiance is reflectedor dissipated as heat. The use of an active liquid cooled receiver becomes anecessity due to the intense irradiation densities but it also allows the addi-tional utilization of this thermal energy. The goal of such a CPVT systemis to achieve maximal generation of electricity and harnessing the thermalenergy output while the operating temperature of the PV cells is kept lowenough to optimize the overall module efficiency. Similar approaches forreuse of waste heat have been demonstrated in supercomputers [38], in par-ticular in the large number of systems that are combined in datacenters [26].Recent high-performance processor designs have power densities that exceedthe capabilities of air cooling requiring either chip attached or direct chipbackside water cooling solutions. Due to this, the computer industry hasdriven the development of packaging and cooling solutions for high powerdensity for processor chips. These packages are very similar to packages thatcan be used in actively cooled concentrated photovoltaic systems. To achieveincreased outlet temperatures of the coolant while keeping the PV cell tem-perature in a moderate range, an extremely low thermal resistance from thePV cell to the coolant needs to be established. This low thermal resistanceis best achieved by minimizing the number of interfaces between the proces-sor or photovoltaic cell and by minimized the convective heat transfer usingchip integrated micro-channel liquid cooling [10]. Concepts to subdivide themicrochannels into smaller sections using hierarchical manifolds were pro-posed to reduce pressure drop and the heating of the fluid [11]. Recentstudies have exploited these highly sophisticated interfaces for backside heatremoval using direct liquid jet impingement in combination with manifoldmicro channel heat sinks [12, 25]. Although all these heat sink design aregreat at cooling, they are designed for the specific needs in electronic cool-ing. The similarities to photovoltaic cells allow a good knowledge transfer todesign high performance heat sink adapted to the new field of photovoltaics.The reduced thermal resistance of these interfaces decreases the temperaturedifference between the PV cell and the coolant, enabling high coolant outlettemperatures.Advanced cooling solutions enlarge system costs, but if the dissipated heatis collected at a high temperature level (between 50-70C) it adds value asit can be used as process heat for applications, such as adsorption cooling,thermal seawater desalination or district heating to name but a few. Conse-
86
6.2. Test Setup
quently, the additional system cost for the advanced cooling solution can bejustified and amortized by heat reuse.
6.2 Test Setup
The photovoltaic cell used in the HCPV system described below iss a square4.4 cm2 MIM cell provided by the Fraunhofer-Institut fur Solare Energiesys-teme (ISE). The MIM cell is bonded to a manifold microchannel heat sinkwhose design is based on the previously mentioned solutions for backside heatremoval [25]. The whole carrier assembly can be seen in Figure 6.1. The en-
Figure 6.1: Carrier package consisting of MIM cell and micro channel heat sink glued to a polycarbonatemanifold.
ergy from solar irradiation which is not converted to electricity is dissipatedas heat and has to be removed by water cooling. The microchannel heat sinkconsists of a manifold layer that feed a heat transfer structure of hundreds ofparallel microchannel. The liquid enters the manifold system laterally andbranches into the tapered inlet channels. Through the slit nozzles, locatedat the bottom surface of the manifold inlet channel, the liquid reaches theunderlying microchannels. While the liquid travels along the microchannels,which are orthogonally orientated with respect to the manifold, it removes
87
6. HCPVT Receiver Package Using Advanced Liquid Cooling for HighEnergy Efficiencies
the heat from the photovoltaic cell. Then the liquid leaves the microchan-nel structure upwards through the neighboring slit nozzles and merges inthe outlet manifold channel. There the liquid is guided to a lateral outlet.Four RTD sensors are placed between the photovoltaic cell and the heat sinkto have a good estimate of the MIM cell temperature and to evaluate thethermal resistance of the package consisting of MIM cell and heat sink. Tofacilitate the measurements, the heat sink is glued to a carrier made of trans-parent polycarbonate using an epoxy to obtain a watertight bonding. Thecarrier acts as interconnection device between the large liquid tubing of theexternal pump connection and the fluid ports in the heat sink. In order toavoid any shading and to protect the tubing, the inlet and outlet ports of thecooling liquid are located to the side opposite to irradiation. The front of thecarrier is protected by an aluminum shield which only leaves the active areaof the photovoltaic cell exposed (see Figure 6.2). The carrier was mounted on
Figure 6.2: shield for the protection of the wiring on the front side of the photovoltaic cell.
an outdoor active-tracking system shown in Figure 6.3. The solar irradiationwas concentrated onto the carrier with the help of a parabolic dish con-centrator achieving an intensification factor of approximately 500. A beamhomogenizer was installed before the photovoltaic cell to smooth out irregu-larities and create a more uniform concentration. The carrier was connectedto a fluid loop similar to the one used for characterization of heat sinks. The
88
6.3. Measurements
flow was driven by a magnetic gear pump. A Coriolis flow meter determinedthe volumetric flow rate with an error of ±10 ml/min. Two cross calibratedT-type thermocouples measured the fluid inlet and outlet temperatures ofthe heat sink (error ±0.1 K). Another thermocouple was used to measurethe ambient temperature. A heat exchanger connected to a chiller was usedto control the fluid inlet temperature. A 7 µm pore filter (Swagelok, USA)was used to keep the coolant free of large particles and prevent a cloggingof the microchannels in the heat sink. The direct irradiation intensity wasrecorded by a pyrheliometer mounted on the solar tracker while the globalirradiation intensity was recorded by a piranometer. A programmable DCelectronic load was used for I-V characterization of the photovoltaic cell.The sensor data acquisition was performed by a digital multimeter and relayswitching card. LabVIEW was used to operate the system and to record themeasurement data.
6.3 Measurements
Knowing the exact intensity of the solar irradiation on the photovoltaic cell iscrucial in order to evaluate the energy efficiency. The intensity is a multipleof the direct normal irradiance (DNI) and the multiplication factor given bythe parabolic dish. The first can be measured directly with the help of apyrheliometer, whereas the second may vary based on imperfections of theparabolic dish such imperfect curvature or scratches. The concentration filedwas measured using a smaller solar flux sensor with a circular active area of12 mm2 and a 3D stage see Figure 6.4. The 3D stage was used to move theflux sensor in order to create grid of data points. The grid points were spacedat intervals of 5 mm in width and height. All values between the individualgrid points are acquired through linear interpolation. The concentration fieldfor the 35 mm x 35 mm opening of the outdoor tracking setup is plotted inFigure 6.5. Variations in concentration ranging from 200 to 550 are observedwith two clear hotspots towards the middle and zones with low concentrationto the right and the left. The active area of the photovoltaic cell is 21mmx 21 mm located in the middle of the measured concentration field. Thevariation in this area is considerably lower, ranging between 400 and 550in concentration. However, the recorded Current-voltage (I-V) curves inFigure 6.6 illustrate that the variation in concentration does have an effecton the performance of the MIM cell. The I-V curve is recorded by theprogrammable DC electronic load which measures the generated voltage fromthe photovoltaic cell as a function of the drawn current. The overall generatedvoltage in the MIM cell is a superposition of the voltages generated by each
89
6. HCPVT Receiver Package Using Advanced Liquid Cooling for HighEnergy Efficiencies
Figure 6.3: Parabolic dish concentrator of the outdoor test setup with mounted carrier.
90
6.3. Measurements
Figure 6.4: Separate flux sensor mounted on 3D stage to collect data of the concentration field.
Figure 6.5: Concentration field generated by the parabolic dish concentrator.
91
6. HCPVT Receiver Package Using Advanced Liquid Cooling for HighEnergy Efficiencies
individual segment. However, not every segment provides the same voltagedue to the inhomogeneous illumination resulting in the kinks that are visiblein Figure 6.6. The resulting voltage drops for higher currents affect themaximal available electrical power being the product of current and voltage.One corresponding electric power drawn by the I-V curves in Figure 6.6ais shown in Figure 6.6b. The two maxima between 20 and 25 Ampere area result of sudden voltage drops at higher currents. These two maximaare lower than a single maximum between the two in the ideal case of nokinks in the I-V curve. The higher of the two maxima is considered themaximal electric power Pmax which is used to determine the maximal electricefficiency of the photovoltaic cell as follows:
ηel =Pmax
C ·DNI · A(6.1)
where C, DNI and A respectively denote the concentration factor of theparabolic dish, the direct normal irradiance and the area of the MIM cell.The concentration factor was calculated as an area average of the active zonein the measured concentration field to be 524. The electric efficiency of theMIM cell was determined as a function of the coolant inlet temperature andplotted in Figure 6.7. The increased cell temperature results in a minor dropof the electric efficiency within the operation range. The observed effectis within the measurement error due to additional sources for uncertaintiessuch as the stepwise motion of the tracker and the fast changing weatherconditions. However, similar tendencies of reduced sensitivity to increasedtemperatures for concentrated photovoltaics have been reported by Helmerset al. [72].Figure 6.8 shows the energy efficiency for three different cases. The electric
efficiency depicts the case where only the generated electric power of thephotovoltaic cell is used. The thermal efficiency describes the case wherethe photovoltaic cell is used as a solar thermal collector which means thatonly the thermal power in the coolant is considered. The combined efficiencyconsiders the photovoltaic cell operating at the maximum power point. Thecombined efficiency is the sum of the electric and the thermal efficiency forthis operation mode. The thermal efficiency has a stronger dependency onthe cell temperature as can be seen in Figure 6.8. The higher temperaturedifference between carrier and environment automatically results in higherlosses due to natural convection. The two thermocouples are placed veryclose to the cell to estimate the maximal available thermal power in thewater. Figure 6.8 shows a drop in thermal efficiency of about 5% withinthe measured range of coolant inlet temperature. Thermal insulation of allthe piping becomes even more crucial for the transport of the heat from
92
6.3. Measurements
Figure 6.6: (a) I-V curves of the module for a coolant inlet temperature of 35C. (b) Generated electricalpower as function of voltage.
93
6. HCPVT Receiver Package Using Advanced Liquid Cooling for HighEnergy Efficiencies
Figure 6.7: Electric efficiency of the MIM cell as a function of the coolant temperature.
Figure 6.8: Energy efficiencies for the three different operation modes as a function of the coolanttemperature.
94
6.3. Measurements
the concentrator system to a secondary application. The consideration ofthermal instead of electrical power for the 1st law efficiency results in a fourtimes rise of cell efficiency. The same rise in the 1st law efficiency is achievedfor the combined case. The thermal losses to the ambient small for lowcoolant temperatures because the temperature difference between MIM celland ambient was small. Therefore, the thermal and the combined energyefficiency are mainly limited by the reflectance of the material used for thephotovoltaic cell. The operation of the concentrator system at higher coolanttemperatures is not beneficial with respect to the first law of thermodynamicsbecause of the increased losses to the environment. However, to evaluate theusefulness of the energy recovered from the carrier, an exergy analysis needsto be performed. Exergy is a thermodynamic property, which helps assessthe differences in the quality of different kinds of energy. The electric energygenerated by the photovoltaic cell is considered pure exergy whereas theexergy content of the thermal energy at the outlet of the heat sink is definedas the stream exergy within the coolant [8]:
Exout = m [hout − ho − To (sout − so)] . (6.2)
where h and s denote the specific enthalpy and entropy of water and sub-scripts ’out’ and ’0’ denote the outlet and reference ambient conditions, re-spectively. The exergy at the inlet of the microchannel heat sink is definedaccordingly and the exergy gain of the coolant is defined as the difference be-tween outlet and inlet. Figure 6.9 shows that all these exergy terms are highlytemperature dependent, thereby underscoring the main benefit of switchingto hot coolants. We can introduce the following exergy-based, second law ef-ficiency for the heat sink to point out the importance of the different exergyinputs and outputs
η2nd =Exout + Exel
Exin + Exsol + Ppump. (6.3)
where Exel denotes the electric power generated by the photovoltaic cell.Ppump denotes the pumping power needed to drive the coolant through themicrochannel heat sink. Pumping power is negligible compared to the otherterms. ExSol describes the exergy imparted by the solar irradiation whichcan be calculated following the Petela expression as [73]:
Exsol = DNI · A
[1− 4
3
(TATsun
)+
1
3
(TATsun
)4]
(6.4)
where Tsun is the temperature of the sun (6000 K) and TA the ambient tem-perature (293 K). The Petela expression which is widely used to calculate
95
6. HCPVT Receiver Package Using Advanced Liquid Cooling for HighEnergy Efficiencies
Figure 6.9: Temperature dependant behavior of the stream exergies in the coolant.
the exergy of solar radiation acts as an optical efficiency for the conversionof radiation into work. The second law efficiency is plotted in Fig. 6.10 asa function of the coolant inlet temperature. The exergy efficiency increases
Figure 6.10: 2nd law efficiency of the photovoltaic cell as a function of the coolant temperature.
up to 60% with increasing the water inlet temperature because the streamexergies of the coolant are extremely temperature dependent. From this be-havior, it is clear that in order to maximize the exergy efficiency; the water
96
6.4. Conclusion
inlet temperature should be maximized for a photovoltaic cell temperaturethat does not significantly affect the photovoltaic performance of the MIMcell. The tendencies of the 1st and 2nd law efficiencies are reversed. Thehigher 1st law efficiency for low coolant temperatures does not guarantee ahigh 2nd law efficiency and vice versa. Energy losses to the ambient anda lower electric efficiency for even higher coolant temperatures will becomesignificant, thereby also limiting the 2nd law efficiency.A systematic exergy analysis of any system helps to identify sites whereexergy destructions and losses occur, and rank them according to their sig-nificance so as to provide a guideline for better system design. After reachingthe photovoltaic cell one part of the irradiation is converted into heat andelectricity and the other gets reflected denoting the first important sourcefor exergy destruction. The conversion from radiation to heat is the secondmajor source for exergy destruction because radiation has a high exergy po-tential whereas heat is considered to be of low quality. Due to an inevitabletemperature differential, further exergy destruction occurs during the heattransfer into the water flowing through the heat sink. Enhancing the electricefficiency of the photovoltaic cell is beneficial because the conversion fromradiation to electricity has a very low exergy destruction rate. The measure-ments underscore the thermodynamic importance to consider electric andthermal power and the benefit of increased coolant temperatures.
6.4 Conclusion
In conclusion, the benefits of advanced thermal packaging are demonstratedthrough a receiver package consisting of a monolithic interconnected modulewhich is directly attached to a high performance micro channel heat sink.It is shown that the cooling requirements of photovoltaic cells can be effi-ciently addressed by liquid cooling at high temperature while simultaneouslyachieving high exergetic efficiencies and enabling reuse of the recovered heat.This was achieved by determining that the electric efficiency of the MIMcell under investigation was only marginally affected by increased coolanttemperatures. The inclusion of thermal power into the energy efficiency ofthe cell resulted in four times increase. The high coolant outlet temperatureopens up the possibility of reuse the otherwise wasted heat. In addition, theuse of hot water coolant led to a fourfold rise in the 2nd law efficiency ofthe photovoltaic cell, underlining the clear benefits of increasing the coolanttemperature. An exergy analysis of the package highlighted that the biggestexergy destruction occurs in the photovoltaic cell. The two major sources arethe reflection of irradiation by the receiver and the other one is the conver-
97
6. HCPVT Receiver Package Using Advanced Liquid Cooling for HighEnergy Efficiencies
sion from radiation to heat. Overall, the current investigation shows that itis important to choose the operation mode of the photovoltaic cell such thatits electric efficiency is optimal while allowing reuse of the recovered heat.
98
Chapter 7
Conclusion
7.1 Summary
The present thesis demonstrated the feasibility and the benefits of hot watercooled electronics. The concept of direct energy reuse in supercomputers isa substantial contribution to more energy aware computing and reduction ofthe carbon footprint of the ICT industry.The switch from air cooling to single phase liquid (water) cooling becomesexistential to overcome the ever increasing heat dissipation densities in elec-tronic components. The higher thermal conductivity and volumetric heatcapacity allow more efficient heat removal resulting in lower temperaturedifferences between coolant and electronic equipment. The coolant temper-ature is consequentially increased while all electronic components are keptwell below their allowable industrial specifications for maximum tempera-ture. Raising the coolant temperatures above the free cooling limit enablesheat removal by passive heat exchangers towards the ambient or a secondaryuser of the heat. Therefore energy and cost intensive chillers are renderedobsolete cutting the energy spent for cooling almost in half.A compact computational model for the rapid determination of the junctiontemperature of a chip assembly cooled with a heat sink is presented to ex-plore the concept of warm water cooled electronics as a strategy to the reducethe carbon footprint of data centers. The model is validated by experimentaltests with a water-cooled manifold microchannel (MMC) heat sink. The sim-ulations indicate that the application of a flow-control feedback loop couldachieve more than 50% reduction in water flow rate, without compromisingallowable industrial specifications of maximum chip temperature.An experimental study on exergetically efficient electronics cooling is re-ported. It is shown that water temperatures as high as 60C are sufficient
99
7. Conclusion
to cool microprocessors with over 90% 1st law (energy based) efficiency. En-ergy alone is a misleading measure to identify the benefits of such a systembecause the reuse potential depends on the quality of energy given by thethermodynamic potential exergy. Exergy and energy show reversed tenden-cies as functions of coolant temperature. The increase in quality outweighsthe additional losses to the ambient. An exergy analysis shows that a six foldrise in 2nd law (exergy based) efficiency is achieved by switching water inlettemperature from 30C to 60C. Additionally, a new metric for the economicvalue of the recovered heat, based on costs for electricity and fossil fuels, heatrecovery efficiency and an application specific utility function, is introducedto underscore the benefits of hot water cooling. This new concept showsthat the economic value of the heat recovered from data centers can be muchhigher than its thermodynamic value.Aquasar, a hot water cooled data center prototype, is built as a collabo-ration of IBM Research Zurich and ETH Zurich. Aquasar represents aneffort to achieve energy-aware computing through building a first-of-a-kindwater-cooled supercomputer that will directly repurpose excess heat for theuniversity buildings. It is demonstrated that the cooling requirements indata centers can be efficiently addressed by using hot water as coolant. Thebenefits of the hot water cooled solution are the higher exergetic outputand the possibility of a direct use of up to 80% of the recovered heat forspace heating. The energy efficiency metrics PUE and ERE of this hot wa-ter cooled data center are significantly better than in industry averaged aircooled data centers because no additional coolant chillers are required whichnormally use as much energy as all the electronic components together. Asystematic exergy analysis of the Aquasar system is done to identify sourcesof exergy destruction and rank them according to their significance so asto provide a guideline for better system design. Switching to hot water ascoolant increases the exergetic efficiency up to 34% for the highest operationtemperatures. Reuse strategies such as space heating and refrigeration us-ing adsorption chillers are tested as potential means to use waste heat fromdata centers. It is shown that an application specific analysis of the economicvalue of the recovered heat can provide additional information about the bestreuse strategy. Direct use of data center heat for space heating provides thehighest economic value of heat for the system under investigation.Immersion cooling of power supply is investigated to further proceed on theway to the vision of the zero emission data centers. Converting previouslyair cooled components to become part of the liquid cooling loop is the nextstep to eliminate the presence of air as coolant in supercomputers and in-crease the heat recovery efficiency. The feasibility of immersion cooled powersupplies as part of a hot water cooled system is demonstrated. It was shown
100
7.2. Outlook
that power consumption of the immersed power supplies increases by 1-2%.However, the recovered heat and the elimination of the air flow in the servershas a bigger influence on heat recovery efficiency. Consequently, any addi-tional cost due to the increased power consumption can be justified by theincreased potential for heat reuse.The similar need for cooling of photovoltaic cells and micro processors allowa good knowledge transfer to design high performance heat sinks adapted tothe new field of photovoltaics. The benefits of advanced thermal packagingare demonstrated through a receiver package consisting of a monolithic in-terconnected module which is directly attached to a high performance microchannel heat sink. It is shown that the cooling requirements of photovoltaiccells can be efficiently addressed by liquid cooling at high temperature whilesimultaneously achieving high exergetic efficiencies and enabling reuse of therecovered heat. The inclusion of thermal power into the energy efficiency ofthe cell resulted in four times increase. An exergy analysis of the packagehighlighted that the biggest exergy destruction occurs in the photovoltaiccell. The two major sources are the reflection of irradiation by the receiverand the other one is the conversion from radiation to heat. Overall, the cur-rent investigation shows that it is important to chose the operation mode ofthe photovoltaic cell such that its electric efficiency is optimal while allowingreuse of the recovered heat.
7.2 Outlook
Paving the way for future generations of highly energy efficient and low car-bon emission computers and data centers, Aquasar was built to demonstratethe feasibility of this new cooling approach. A scaled up system (SuperMUC)based on Aquasar has already been built by IBM in Munich, Germany. Su-perMUC is the first general available Hot Water Cooled iDataPlex clusterthat reaches a heat recovery efficiency above 90%. The concept of the fullimmersed power supply is developed to increase the heat recovery efficiencyeven further by eliminating any air flow left in the computer racks and cap-turing the heat from the power supplies as well. The location of the datacenter is another very important aspect. Moderate climates such as Mu-nich, Germany allow a direct reuse of the energy to heat buildings. However,the heat reuse aspect should also be feasible in arid climates such as SaudiArabia. Therefore, other reuse strategies such as desalination or adsorptionbased cooling should be expedited as well. These strategies need heat inputon temperature levels between 70C and 90C which can be reached through
101
7. Conclusion
further reduction of the thermal resistance. In addition, the insulation ofsuch a system becomes more important because thermal losses to the ambi-ent increase as temperature levels increase. Especially transport of the heatfrom the data center to the user of the heat becomes critically because it isan optimization problem of cost for insulation against losses of the heat.The similarities between electronic cooling and cooling needed for photo-voltaic cells allow a good knowledge transfer to design high performanceheat sinks adapted to the new field of photovoltaics. An integrated frame-work for harnessing energy from concentrated photovoltaic cells is proposed,which aims at improving the yield of solar energy harvesting by enhancedcell efficiency and secondary usage of typically wasted thermal energy. TheMIM cell under investigation has a rather high package ratio of active areato total area, but the incident solar spectrum is not as efficiently used asin multijunction solar cells consisting of several stacked p-n junctions withdecreasing band gap energies from top to bottom. These photovoltaic cellsshould be considered as well in order to find the best design for high tem-perature HCPV systems.
102
Bibliography
Bibliography
[1] G. Basalla, “Energy and Civilization,” Science, Technology and the Hu-man Prospect, pp. 39–52, 1980.
[2] U.S. Energy Information Administration, “AEO2013 Early ReleaseOverview,” http://www.eia.gov/forecasts/aeo/er/index.cfm, 2013.
[3] Intergovernmental Panel on Climate Change, “Managing the Risks ofExtreme Events and Disasters to Advance Climate Change Adaptation,”http://www.ipcc.ch/pdf/special−reports/srex/SREX Full Report.pdf,2012.
[4] The United Nations Framework Convention on Climate Change, “Ky-oto Treaty,” 1997.
[5] J. G. Koomey, “Growth in Data Center Electricity Use 2005 to 2010,”Analytics Press, completed at the request of The New York Times, 2011.
[6] IDC #203598, “Worldwide Server Power and Cooling Expense2006−2010 Forecast,” 2006.
[7] T. Brouillard, APC, 2006.
[8] M. J. Moran and H. N. Shapiro, Fundamentals of Engineering Thermo-dynamics, 6th ed. Hoboken: John Wiley & Sons, 2008.
[9] G. E. Moore, “Cramming more Components onto Integrated Circuits,”Electronics, pp. 114–207, 1965.
[10] D. B. Tuckerman and R. F. W. Pease, “High-Performance Heat Sinkingfor VLSI,” Electron Device Letters, vol. 2, no. 5, pp. 126–129, 1981.
[11] D. Copeland, M. Behnia, and W. Nakayama, “Manifold MicrochannelHeat Sinks: Isothermal Analysis,” IEEE Transactions on Components,Packaging, and Manufacturing Technology Part A, vol. 20, no. 2, pp. 96–102, 1997.
103
Bibliography
[12] W. Escher, T. Brunschwiler, B. Michel, and D. Poulikakos, “Experimen-tal Investigation of an Ultra−Thin Manifold Microchannel Heat Sink forLiquid−Cooled Chips,” ASME Journal of Heat Transfer, vol. 132, no. 8,p. 081402, 2010.
[13] A. J. Shah, V. P. Carey, C. E. Bash, and C. D. Patel, “Exergy Analysis ofData Center Thermal Management Systems,” Journal of Heat Transfer-Transactions of the ASME, vol. 130, no. 2, p. 021401, 2008.
[14] IDC # 201722, “The Impact of Power and Cooling on the DatacenterInfrastructure,” 2006.
[15] C. Lasance, “Ten Years of Boundary−Condition−Independent CompactThermal Modeling of Electronic Parts: A Review,” Heat Transfer En-gineering, vol. 29, pp. 149–168, 2008.
[16] P. Li, L. T. Pileggi, M. Asheghi, R. Chandra, and IEEE, Efficient Full-Chip Thermal Modeling and Analysis. IEEE, 2004.
[17] W. Huang, S. Ghosh, S. Velusamy, K. Sankaranarayanan, K. Skadron,and M. Stan, “Hotspot: A Compact Thermal Modeling Methodologyfor Early-Stage VLSI Design,” IEEE Transactions on Very Large ScaleIntegration (VLSI) Systems, vol. 14, p. 501, 2006.
[18] W. Huang, K. Sankaranarayanan, K. Skadron, R. Ribando, and M. Stan,“Accurate, Pre−RTL Temperature−Aware Design Using a Parameter-ized, Geometric Thermal Model,” IEEE Transactions on Computers,vol. 57, pp. 1277–1288, 2008.
[19] D. Fetis and P. Michaud, “An Evaluation of Hotspot−3.0 Block−BasedTemperature Model,” 5th annual Workshop on Duplicating, Decon-structing, and Debunking, 2005.
[20] R. Gupta and V. Eswaran, “Integrating Compact Thermal Models inCFD Simulations of Electronic Packages,” Journal of Electronic Pack-aging, vol. 130, pp. 021 002–1–9, 2008.
[21] R. Waelchli, T. Brunschwiler, B. Michel, and D. Poulikakos, “CombinedLocal Microchannel-Scale CFD Modeling and Global Chip Scale Net-work Modeling for Electronics Cooling Design,” International Journalof Heat and Mass Transfer, vol. 53, no. 5-6, pp. 1004–1014, 2010.
[22] A. Sridhar, A. Vincenzi, M. Ruggiero, T. Brunschwiler, and D. Atienza,“3D−ICE: Fast Compact Transient Thermal Modeling for 3D ICs with
104
Bibliography
Inter-tier Liquid Cooling,” Proceedings of the International Conferenceon Computer-Aided Design, vol. 1, pp. 463–470, 2010.
[23] G. I. Meijer, “Cooling Energy-Hungry Data Centers,” Science, vol. 328,pp. 318–319, 2010.
[24] E. G. Colgan, B. Furman, M. Gaynes, W. S. Graham, N. C. LaBi-anca, J. H. Magerlein, R. J. Polastre, M. B. Rothwell, R. J. Bezama,R. Choudhary, K. C. Marston, H. Toy, J. Wakil, J. A. Zitz, and R. R.Schmidt, “A Practical Implementation of Silicon Microchannel Coolersfor High Power Chips,” IEEE Transactions on Components and Pack-aging Technologies, vol. 30, no. 2, pp. 218–225, 2007.
[25] W. Escher, B. Michel, and D. Poulikakos, “A Novel High Performance,Ultra Thin Heat Sink for Electronics,” International Journal of Heatand Fluid Flow, vol. 31, no. 4, pp. 586–598, 2010.
[26] T. Brunschwiler, B. Smith, E. Ruetsche, and B. Michel, “Toward Zero-Emission Data Centers through Direct Reuse of Thermal Energy,” IBMJournal of Research & Devlopement, vol. 53, no. 3, p. Paper 11, 2009.
[27] S. Zimmermann, M. K. Tiwari, F. Ott, B. Michel, G. Meijer, andD. Paredes, S. & Poulikakos, “Experimental Investigation of a HotWater-Cooled Heat Sink for Efficient Data Center Cooling: TowardsElectronic Cooling with High Exergetic Utility,” Proceedings of the 2ndEuropean Conference on Microfluidics, 2010.
[28] P. Kasten, S. Zimmermann, M. K. Tiwari, B. Michel, and D. Poulikakos,“Hot Water Cooled Heat Sinks for Efficient Data Center Cooling: To-wards Electronic Cooling with High Exergetic Utility,” Frontiers in Heatand Mass Transfer, vol. 1, no. 2, p. 023006, 2010.
[29] C. Isci and M. Martonosi, “Runtime Power Monitoring in High-EndProcessors: Methodology and Empirical Data,” Proceedings of the 36thInt. Symp. Microarchitecture, 2003.
[30] F. J. Mesa-Martinez, E. K. Ardestani, and J. Renau, “CharacterizingProcessor Thermal Behavior,” ACM SIGPLAN Notices, vol. 45, pp.193–204, 2010.
[31] R. Alur, C. Courcoubetis, T. A. Henzinger, and P. Ho, “Hybrid Au-tomata: An Algorithmic Approach to the Specification and Verificationof Hybrid Systems,” Lecture Notes in Computer Science, vol. 736, pp.209–229, 1993.
105
Bibliography
[32] J. Lygeros, “An Overview of Hybrid System Control,” Handbook of Net-worked and Embedded Control Systems, pp. 519–538, 2005.
[33] F. Alfieri, M. K. Tiwari, I. Zinovik, D. Poulikakos, T. Brunschwiler, andB. Michel, “3D Integrated Water Cooling of a Composite MultilayerStack of Chips,” Journal of heat transfer-transactions of the ASME,vol. 132, no. 12, p. 121402, 2010.
[34] T. Brunschwiler and B. Michel, “Thermal Management of VerticallyIntegrated Packages,” in Handbook of 3D Integration, P. Garrou,C. Bower;, and P. Ramm, Eds. KGaA, Weinheim: Wiley-VCH VerlagGmbH & Co, 2008.
[35] A. Renfer, M. K. Tiwari, T. Brunschwiler, B. Michel, and D. Poulikakos,“Experimental Investigation into Vortex Structure and Pressure Dropacross Microcavities in 3D Integrated Electronics,” Experiments in Flu-ids, vol. 51, no. 3, pp. 731–741, 2011.
[36] P. S. Lee, S. V. Garimella, and D. Liu, “Investigation of Heat Transferin Rectangular Microchannels,” International Journal of Heat and MassTransfer, vol. 48, no. 9, pp. 1688–1704, 2005.
[37] T. Brunschwiler, H. Rothuizen, M. Fabbri, U. Kloter, B. Michel, R. J.Bezama, and G. Natarajan, “Direct Liquid Jet-Impingement Coolingwith Micron-Sized Nozzle Array and Distributed Return Architecture,”in IEEE Proceedings 10th Intersociety Conference on Thermal and Ther-momechanical Phenomena in Electronics Systems, vol. 1 and 2, 2006, pp.196–203.
[38] T. Brunschwiler, G. I. Meijer, S. Paredes, W. Escher, and B. Michel,“Direct Waste Heat Utilization from Liquid-Cooled Supercomputers,” inProceedings of the 14th International Heat Transfer Conference, Wash-ington, 2010, p. 23352.
[39] M. Z. Stijepovic and P. Linke, “Optimal Waste Heat Recovery and Reusein Industrial Zones,” Energy, vol. 36, no. 7, pp. 4019–4031, 2011.
[40] A. J. Shah, V. P. Carey, C. E. Bash, and C. D. Patel, “An Exergy-Based Figure-of-Merit for Electronic Packages,” Journal of ElectronicPackaging, vol. 128, no. 4, pp. 360–369, 2006.
[41] M. A. Rosen, I. Dincer, and M. Kanoglu, “Role of Exergy in Increas-ing Efficiency and Sustainability and Reducing Environmental Impact,”Energy Policy, vol. 36, no. 1, pp. 128–137, 2008.
106
Bibliography
[42] Data Center Knowledge, “IBMs Hot-Water Supercomputer Goes Live,”2010.
[43] T. F. Lemczyk, B. Mack, J. R. Culham, and M. M. Yovanovich, “PCBTrace Thermal Analysis and Effective Conductivity,” 1991 Proceedings,Seventh Annual IEEE Semiconductor Thermal Measurement and Man-agement Symposium, 1991.
[44] S. Zimmermann, M. K. Tiwari, G. I. Meijer, B. Michel, andD. Poulikakos, “Aquasar: A Hot Water Cooled Data Center with DirectEnergy Reuse,” Energy, vol. 43, no. 1, pp. 237–245, 2012.
[45] Europe’s energy portal, 2011, http://www.energy.eu/.
[46] T. C. Hung, T. Y. Shai, and S. K. Wang, “A Review of Organic RankineCycles (ORCs) for the Recovery of Low-Grade Waste Heat,” Energy,vol. 22, no. 7, pp. 661–667, 1997.
[47] J. Mitchell-Jackson, J. G. Koomey, B. Nordman, and A. Blazek, “DataCenter Power Requirements: Measurements from Silicon Valley,” En-ergy, vol. 28, no. 8, pp. 837–850, 2003.
[48] A. S. Rattner and S. Garimella, “Energy Harvesting, Reuse and Upgradeto Reduce Primary Energy Usage in the USA,” Energy, vol. 36, no. 10,pp. 6172–6183, 2011.
[49] J. Scaramella, “Worldwide Server Energy Expense 2009-2013 Forecast,”2009.
[50] International Energy Agency, “Key world energy statistics 2012,” 2012.
[51] N. Stern, “Stern Review on the Economics of Climate Change,” 2007.
[52] M. Patterson, B. Tschudi, O. Vangeet, J. Cooley, and D. Azevedo, “AMetric for Measuring the Benefit of Reuse Energy from a Data Center,”the green grid, Tech. Rep., 2010.
[53] H. M. Groscurth, R. Kummel, and W. Vangool, “Thermodynamic Lim-its to Energy Optimization,” Energy, vol. 14, no. 5, pp. 241–258, 1989.
[54] J. Haas, J. Froedge, J. Pflueger, and D. Azevedo, “Usage and Pub-lic Reporting Guidelines for the Green Grid’s Infrastructure MetricsPUE/DCiE,” the green grid, Tech. Rep., 2009.
[55] The green grid, 2012, http://www.thegreengrid.org/.
107
Bibliography
[56] M. T. Balta, Y. Kalinci, and A. Hepbasli, “Evaluating a Low ExergyHeating System from the Power Plant through the Heat Pump to theBuilding Envelope,” Energy and Buildings, vol. 40, no. 10, pp. 1799–1804, 2008.
[57] J. R. Taylor, An Introduction to Error Analysis: The Study of Uncer-tainties in Physical Measurements, 2nd ed. New Jersey, USA: Univer-sity Science Books, 1997.
[58] J. Neudorfer, “Top 10 Things Data Centers Forget About PUE,” 2011.
[60] Saudi Electricity Company, “Kingdom of Saudi Arabia Electricity Tar-iffs,” 2011.
[61] E. Baker, “Liquid Immersion Cooling of Small Electronic Devices,” Mi-croelectronics and Reliability, vol. 12, pp. 163–173, 1973.
[62] A. Bar-Cohen, “Thermal Design of Immersion Cooling Modules for Elec-tronic Components,” Heat Transfer Engineering, vol. 4, pp. 35–50, 1983.
[63] P. Tuma, “The Merits of Open Bath Immersion Cooling of DatacomEquipment,” 26th Annual IEEE Semiconductor Thermal Measurementand Management Symposium, pp. 123–131, 2010.
[64] P. E. Tuma, “Design Considerations Relating to Non-Thermal Aspectsof Passive 2-Phase Immersion Cooling,” 2011 27th Annual Ieee Semicon-ductor Thermal Measurement and Management Symposium,, pp. 1–9,2011.
[65] C. Tantolin, M. Lallemand, and U. Eckes, “Experimental Study of Im-mersion Cooling for Power Components,” International Conference onControl 94, Vols 1 and 2, 1994.
[67] V. Luque Lopez, A. Andreev, Ed., Concentrator Photovoltaics.Springer, USA, 2007.
[68] D. Faiman, S. Biryukov, and K. Pearlmutter, “PETAL: A ResearchPathway to Fossil-Competitive Solar Electricity,” Conference Record ofthe Twenty-Ninth Ieee Photovoltaic Specialists Conference 2002, 2002.
108
Bibliography
[69] P. Verlinden, A. Lewandowski, C. Bingham, G. Kinsey, R. Sherif, andJ. Lasich, “Performance and Reliability of Multijunction III-V Modulesfor Concentrator Dish and Central Receiver Applications,” ConferenceRecord of the 2006 IEEE 4th World Conference on Photovoltaic EnergyConversion, Vols 1 and 2, 2006.
[70] H. Helmers, E. Oliva, W. Bronner, F. Dimroth, and B. A.W., “Process-ing Techniques for Monolithic Interconnection of Solar Cells at WaferLevel,” IEEE Transactions on Electron Devices, vol. 57, pp. 3355–3360,2010.
[72] H. Helmers, A. Bett, J. Parisi, and C. Agert, “Modeling of Concen-trating Photovoltaic and Thermal Systems,” Progress in Photovoltaics:Research and Applications, 2012.
[73] R. Petela, “Exergy of Undiluted Thermal Radiation,” Solar Energy,vol. 74, pp. 469–488, 2003.
109
List of Publications
Journal Articles
P. Kasten, S. Zimmermann, M. K. Tiwari, B. Michel, D. Poulikakos. Hotwater cooled heat sinks for efficient data center cooling: towards electroniccooling with high exergetic utility. Frontiers in Heat and Mass Transfer. vol.1, 023006 (2010).
A. Kubilay, S. Zimmermann, I. Zinovik, B. Michel, D. Poulikakos. Compactthermal model for the transient temperature prediction of a water-cooledmicrochip module in carbon emission computing. Numerical Heat Transfer,Part A. vol. 59, pp. 815−835 (2011).
S. Zimmermann, M. K. Tiwari, I. Meijer, S. Paredes, B. Michel, D. Poulikakos,Hot water cooled electronics: Exergy analysis and waste heat reuse feasibility.International Journal of Heat and Mass Transfer. vol. 55, pp. 6391−6399(2012)
C. S. Sharma, S. Zimmermann, M. K. Tiwari, Bruno Michel, D. Poulikakos.Optimal thermal operation of liquid-cooled electronic chips. InternationalJournal of Heat and Mass Transfer. vol. 55, pp. 1957−1969 (2012).
S. Zimmermann, I. Meijer, M. K. Tiwari, S. Paredes, B. Michel, D. Poulikakos.Aquasar: A hot water cooled data center with direct energy reuse. Energy.vol. 43, pp. 237−245 (2012)
Conference Papers
S. Zimmermann, M. K. Tiwari, F. Ott, B. Michel, I. Meijer, S. Paredes, D.Poulikakos. Experimental Investigation of a Hot Water Cooled Heat Sink forEfficient Data Center Cooling: Towards Electronic Cooling with High Exer-
111
7. List of Publications
getic Utility. 2nd European Conference on Microfluidics, Toulouse, December2010.
Y. Madhour, S. Zimmermann, J. Olivier, J. Thome, B. Michel, D. Poulikakos.Cooling of next generation computer chips: parametric study for single- andtwo-phase cooling. Therminic, Paris, September 2011.
M. K. Tiwari, S. Zimmermann, C. S. Sharma, F. Alfieri, A. Renfer, T.Brunschwiler, I. Meijer, B. Michel, D. Poulikakos. Waste Heat Recoveryin Supercomputers and 3D Integrated Liquid Cooled Electronics. 13th IEEEIntersociety Conference on Thermal and Thermomechanical Phenomena inElectronic Systems (ITherm), San Diego, May 2012.
S. Zimmermann, I. Meijer, M. K. Tiwari, B. Michel, D. Poulikakos. HotWater Cooled Electronics for High Exergetic Utility. ASME 2012 SummerHeat Transfer Conference, Puerto Rico, July 2012.
112
Curriculum Vitae
Curriculum Vitae
Personal Data
Name Severin Michael ZimmermannDate of Birth December 31th, 1984Nationality Swiss
Education
08/2009 - 02/2013 Doctoral Student, Laboratory of Thermodynamics in EmergingTechnologies, Department of Mechanical and Process Engineering,ETH Zurich, Switzerland.Heat transfer, cooling solutions in data centers
10/2007 - 02/2009 Master of Science in Physics, ETH Zurich, SwitzerlandMajored in Experimental Particle Physics
10/2004 - 10/2007 Bachelor of Science in Physics, ETH Zurich, Switzerland
01/2011 - 02/2013 Head Assistant for the lectures Thermodynamik I + II, ETH ZurichConstruction of weekly tutorials and assignment problems withvarious underlying physical principlesConstruction of exams for over 400 studentsSubstitute for professor in lecture
113
Curriculum Vitae
10/2009 - 01/2011 Assistant at D-MAVT ETH ZurichTeaching exercises with various physical principles to 80students
10/2004 - 06/2009 Private Tutor in Mathematics and Physics