INTEGRATED TAX-SUBSIDY POLICY AND THE CELLULOSIC BIOFUEL INDUSTRY IN THE PACIFIC NORTHWEST By Gregmar I. Galinato, Associate Professor, School of Economic Sciences, Washington State University, Pullman. Tristan Skolrud, Assistant Professor, Department of Agricultural and Resource Economics, University of Saskatchewan TB37 TB37 | Page 1 | ext.wsu.edu
Transcript
INTEGRATED TAX-SUBSIDY POLICY AND THE CELLULOSIC BIOFUEL INDUSTRY IN THE PACIFIC NORTHWEST
ByGregmar I. Galinato, Associate Professor, School of Economic Sciences, Washington State University, Pullman. Tristan Skolrud, Assistant Professor, Department of Agricultural and Resource Economics, University of Saskatchewan TB37
TB37 | Page 1 | ext.wsu.edu
Integrated Tax-Subsidy Policy and the Cellulosic Biofuel Industry in the Pacific Northwest
Abstract
With emissions standards and renewable fuel mandates set to increase annually, economic policy will need to shift to accommodate these changes. Under current Renewable Fuel Standards (RFS), we derived an optimal policy for Washington, Oregon, and Idaho that integrates both taxes and subsidies. This publication synthesizes the results of market simulations that implement what we call the integrated tax-subsidy policy. It also briefly outlines the policy’s impacts on state economies and social welfare.
For the complete 2016 study, refer to “Welfare Implications of the Renewable Fuel Standard with an Integrated Tax-Subsidy Policy” by Skolrud and Galinato, which provides a detailed description of the model, simulation description, and specific assumptions used to derive the results presented here.
Background on US Energy Mandates
In 2007, the US enacted the Energy Independence and Security Act (EISA) as an attempt to reduce both fossil fuel dependence and greenhouse gas (GHG) emissions. To accomplish this, the EISA mandated the use of renewable energy sources such as feedstocks which pollute less than non-renewable energy sources like crude oil. The law incentivizes biofuel production from conventional feedstocks (sugar or starch) and cellulosic feedstocks (woody biomass or agricultural crop residue). The mandate for cellulosic biofuel, in particular, is set to increase such that by 2022, 16 billion gallons will be required—a billion gallons more than the conventional biofuel mandate (GPO 2011).
Biofuel Production in the PNW
Previous biofuel efforts in the region focused on conventional biofuels such as corn, canola, and sugar beet, but the Pacific Northwest (PNW) did not have a comparative production advantage. However, cellulosic biofuels, such as woody biomass and agricultural crop residue, position the Pacific Northwest states with a comparative advantage (Yoder et al. 2010).
Cellulosic Biofuel Production
Despite growing emphasis on cellulosic biofuels relative to conventional biofuels, the production of cellulosic biofuels has been slow. Only 20,069 gallons of cellulosic biofuel were
produced in 2012 despite an original mandate of 0.5 billion gallons (EPA 2013). By 2014, production increased to 33 million gallons, but the industry is still far behind its original EISA goal (RSFP 2015). There are two relevant Renewable Fuel Standard (RFS) policies relating to the production of cellulosic biofuel: (1) the input ratio requirement which imposes a limit on the amount of cellulosic fuel used and (2) the waiver credits which can be used to circumvent the input requirement (Galinato et al. 2016; GPO 2011).
Policies that Affect Cellulosic Biofuel Production
Input Ratio Requirement
To implement the input ratio requirement, the EPA created the Renewable Identification Number (RIN) as a mechanism for RFS compliance accounting. An RIN is a unique, 38-character number assigned to each gallon of renewable fuel produced in the US or imported. When renewable fuel is blended into motor vehicle fuel, the RIN attached to the renewable fuel can be separated, and then the RIN can be sold or used for current or future compliance. The obligated parties (refiners and importers of gasoline and diesel) must comply with the RFS mandate by accumulating enough RINs to meet their renewable volume obligations (RVOs). Obligated parties can either purchase and blend their required volume of biofuel and report the separated RINs to the EPA, or they can buy RINs in a secondary market without having to use biofuel at all (McPhail et al. 2011; Yacobucci 2013).
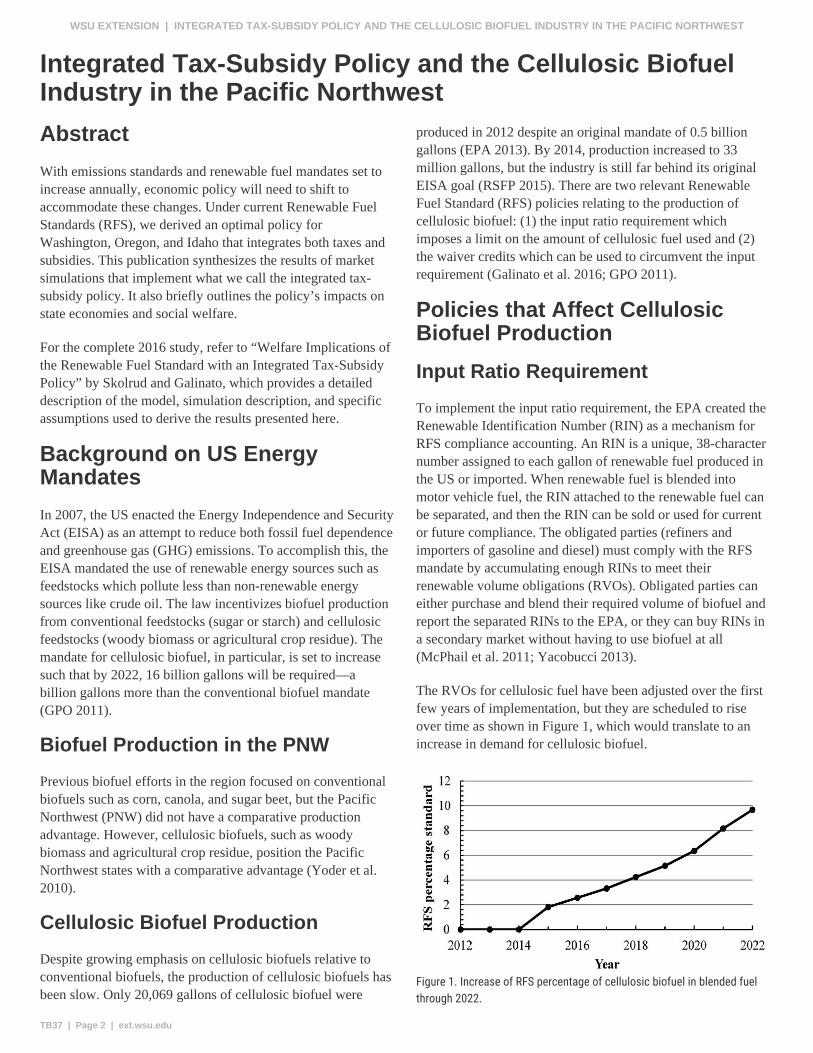
The RVOs for cellulosic fuel have been adjusted over the first few years of implementation, but they are scheduled to rise over time as shown in Figure 1, which would translate to an increase in demand for cellulosic biofuel.
Figure 1. Increase of RFS percentage of cellulosic biofuel in blended fuel through 2022.
TB37 | Page 2 | ext.wsu.edu
WSU EXTENSION | INTEGRATED TAX-SUBSIDY POLICY AND THE CELLULOSIC BIOFUEL INDUSTRY IN THE PACIFIC NORTHWEST
Waiver Credits
Unlike conventional biofuels, the EPA also allows the purchase of waiver credits to substitute for actual production, import, or consumption of cellulosic biofuels. One waiver credit is equivalent to one gallon of an obligated party’s cellulosic biofuel RVO. Waiver credits can only be used to meet the obligated party’s end-of-year compliance. The waiver credit price is determined by the EPA, and it is dependent on the average annual wholesale gas price (GPO 2011). The price for cellulosic biofuel waiver credits were $1.13 per credit in 2011, $0.78 per credit in 2012, and $0.42 per credit in 2013 (EPA 2010, 2012, 2013). If the price of cellulosic biofuel per gallon is higher than the waiver credits, fuel producers and importers would be able to save money by purchasing the waiver credits instead of using biofuel.
Skolrud et al. (2014) point to an incorrect market price for waiver credits as an important reason why demand for cellulosic biofuel is very low. When cellulosic biofuel production is insufficient, fuel producers can buy waiver credits to satisfy their cellulosic obligation (GPO 2011). This purchase of waiver credits led to low cellulosic biofuel production even when the input ratio requirement was raised. Because firms have the option of purchasing low-cost waivers instead of switching to cellulosic biofuel, demand is low and no incentives exist for technological development in the sector (Skolrud et al. 2014). For instance, simulated cellulosic ethanol production in Washington, Oregon, and Idaho remain the same even if the input ratio requirement rises, but it steadily increases as the waiver price rises in all three states (Galinato et al. 2016).
Pollution Pricing/Market Value
Pollution is considered an externality—a by-product during the production process—and its value is not correctly reflected in the market price of the good being produced. This distorts the market price of goods produced, leading to too much or too little of a good produced relative to the welfare maximizing level. If the market experiences such a distortion, a regulatory instrument such as a tax or a subsidy may be needed to correctly value the good. A carbon tax is one of the many programs that have been considered and developed to reduce GHG emissions and account for social welfare.
Several countries have implemented national carbon taxes including Denmark (IEA 2002), Sweden (Hammar and Jagers 2007), Finland (Vourc’h and Jimenez 2000), and parts of Canada (British Columbia Ministry of Small Business and Revenue 2008). Carbon taxes are touted by economists as an effective instrument in addressing climate change (Tol 2005). However, political concerns have hindered any significant traction at the federal level in the US (Metcalf 2009).
Taxes and Subsidies
When the revenue from a carbon tax is used to subsidize cleaner technology, public support for carbon taxes across political groups increases dramatically (Amdur et al. 2014). Fee-bates are an example of a pollution tax where the revenue is used to subsidize the use of less pollution-emitting goods. In the energy market in Gainesville, Florida, a surcharge on consumption of electricity is collected and the resulting revenue is used to fund the purchase of electricity generated by solar panels (New York Times 2009). In the automotive market, taxes are imposed on cars with poor gas mileage and a tax rebate is offered on cars with good gas mileage (Greene et al. 2005). Such policies that tax high-pollution goods and subsidize low-pollution goods shift consumption toward goods that are relatively less polluting (Johnson 2006).
In our case, cellulosic ethanol is less polluting because for every unit used, the emission level is only 13% from a comparable amount of crude oil used in the production of gasoline (Wang et al. 2007). The subsidy for low-polluting cellulosic biofuel does distort production in the market leading to some market inefficiency, but the tax on high-polluting fossil fuels increases market efficiency.
The Integrated Tax-Subsidy Policy
We developed a policy that subsidizes low carbon-emitting energy inputs such as cellulosic biofuel that are funded solely by taxes on high carbon-emitting sources such as crude oil. This model alleviates concerns regarding the implementation of a tax-only or subsidy-only approach because the policy can be revenue-neutral, meaning the government budget balance is unaffected. The taxes and subsidies in the integrated tax-subsidy policy are designed to completely offset one another.
We investigate whether the integrated tax-subsidy policy can boost cellulosic biofuel production. We construct our model by incorporating pre-existing RFS policies to account for producer behavior. The model is calibrated for Washington State, Idaho, and Oregon—states with varying abundance of cellulosic feedstock in the form of woody biomass (Yoder et al. 2010)—to illustrate the social welfare impacts of the policy.
The model is calibrated and simulated using data from different sources. We obtain quantity and price data for Washington, Oregon, and Idaho in various sectors (see Table 2 in Skolrud and Galinato 2016). Differences in state-level quantities demonstrate Washington State’s emphasis on agriculture over forestry, whereas in Oregon it is the opposite. Idaho’s forestry and agricultural sectors are both smaller than
TB37 | Page 3 | ext.wsu.edu
WSU EXTENSION | INTEGRATED TAX-SUBSIDY POLICY AND THE CELLULOSIC BIOFUEL INDUSTRY IN THE PACIFIC NORTHWEST
Washington’s or Oregon’s. Washington State employs more labor and capital in agriculture and less labor and capital in forestry than Oregon. Washington State has a higher wage rate and land rental rate than Oregon or Idaho. The remainder of the prices in the model do not vary by state.
One important parameter needed in the simulation is the initial level of cellulosic ethanol production. In 2014, the EPA reported national production of cellulosic ethanol equal to 33 million gallons (RFSP 2015). As state-level production is not provided, we assume that Washington State, Oregon, and Idaho accounted for a share of national cellulosic ethanol production equal to their respective shares of national petroleum consumption. In 2012, Washington’s share of national petroleum consumption was 2% (EIA 2013a), Oregon’s share was 0.9% (EIA 2013b), and Idaho’s share was 0.4% (EIA 2013c), accounting for cellulosic ethanol production of 660,000 gallons, 297,000 gallons, and 132,000 gallons, respectively.
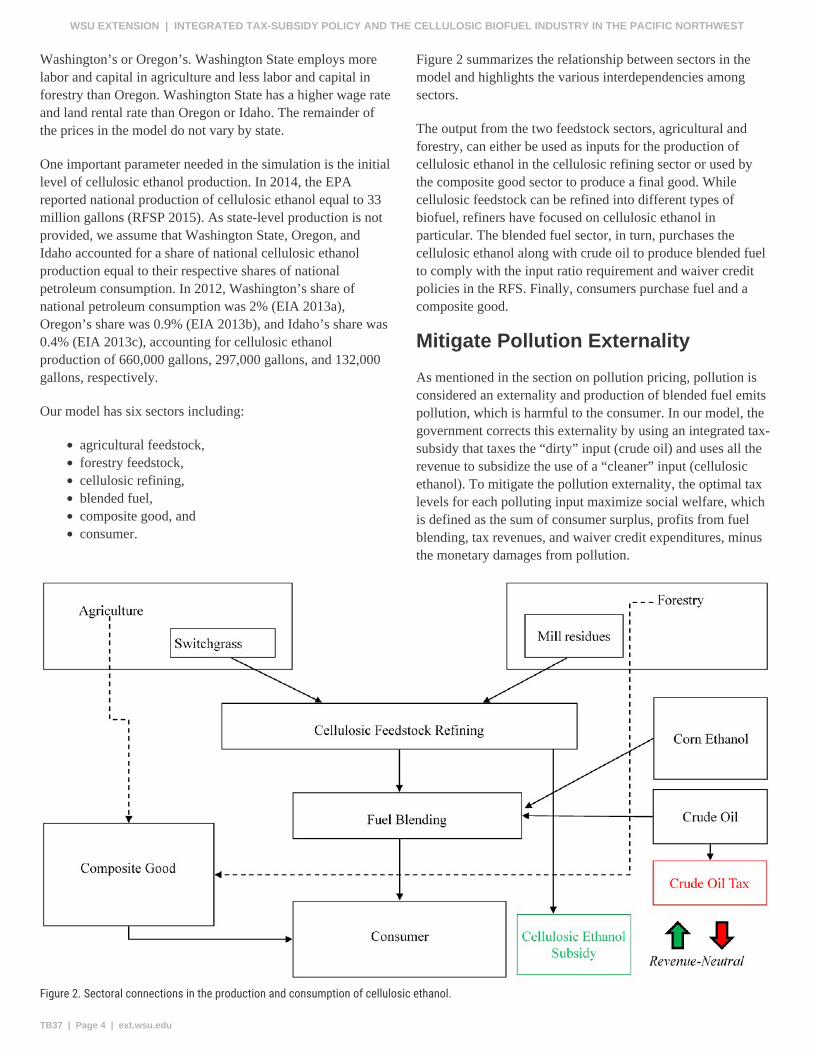
Figure 2 summarizes the relationship between sectors in the model and highlights the various interdependencies among sectors.
The output from the two feedstock sectors, agricultural and forestry, can either be used as inputs for the production of cellulosic ethanol in the cellulosic refining sector or used by the composite good sector to produce a final good. While cellulosic feedstock can be refined into different types of biofuel, refiners have focused on cellulosic ethanol in particular. The blended fuel sector, in turn, purchases the cellulosic ethanol along with crude oil to produce blended fuel to comply with the input ratio requirement and waiver credit policies in the RFS. Finally, consumers purchase fuel and a composite good.
Mitigate Pollution Externality
As mentioned in the section on pollution pricing, pollution is considered an externality and production of blended fuel emits pollution, which is harmful to the consumer. In our model, the government corrects this externality by using an integrated tax-subsidy that taxes the “dirty” input (crude oil) and uses all the revenue to subsidize the use of a “cleaner” input (cellulosic ethanol). To mitigate the pollution externality, the optimal tax levels for each polluting input maximize social welfare, which is defined as the sum of consumer surplus, profits from fuel blending, tax revenues, and waiver credit expenditures, minus the monetary damages from pollution.
Figure 2. Sectoral connections in the production and consumption of cellulosic ethanol.
TB37 | Page 4 | ext.wsu.edu
WSU EXTENSION | INTEGRATED TAX-SUBSIDY POLICY AND THE CELLULOSIC BIOFUEL INDUSTRY IN THE PACIFIC NORTHWEST
Unconstrained vs. Constrained Tax Revenue
We consider two tax scenarios. The first is a revenue-unconstrained case where tax revenue is allowed to be a positive level, and the second is a revenue-constrained case where the tax revenue target is zero. The second scenario allows us to analyze the effect of a revenue-neutral tax system.
Revenue-Unconstrained Tax
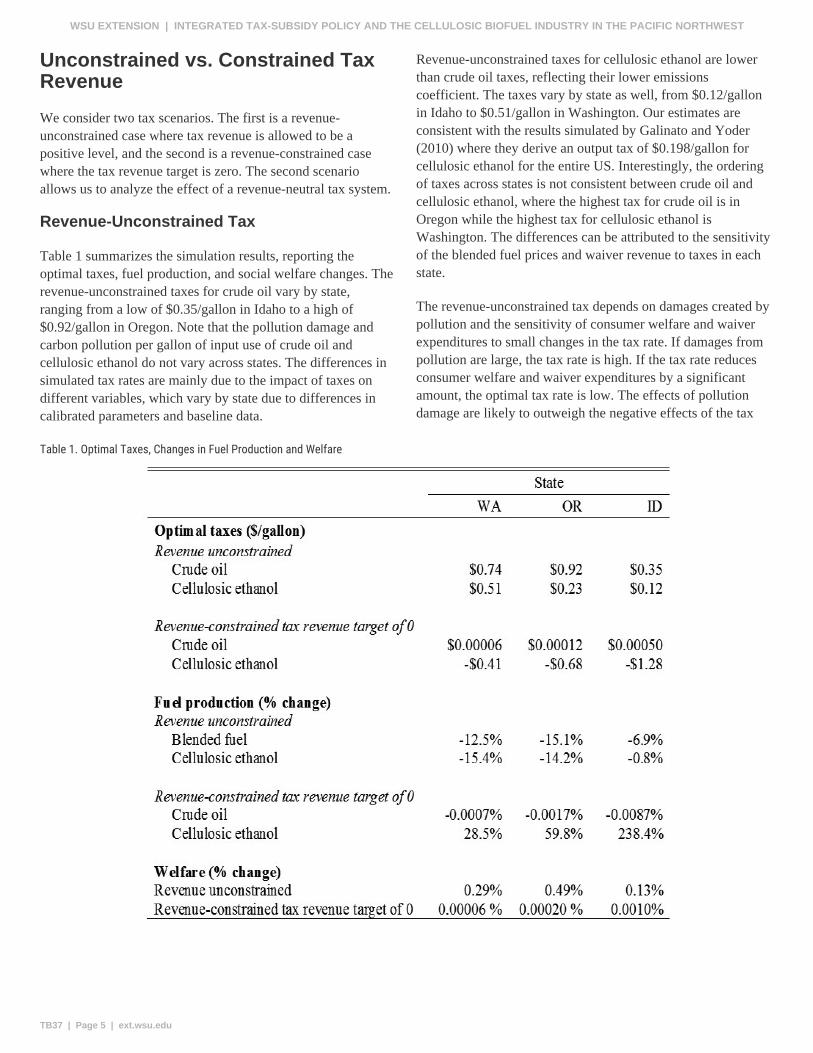
Table 1 summarizes the simulation results, reporting the optimal taxes, fuel production, and social welfare changes. The revenue-unconstrained taxes for crude oil vary by state, ranging from a low of $0.35/gallon in Idaho to a high of $0.92/gallon in Oregon. Note that the pollution damage and carbon pollution per gallon of input use of crude oil and cellulosic ethanol do not vary across states. The differences in simulated tax rates are mainly due to the impact of taxes on different variables, which vary by state due to differences in calibrated parameters and baseline data.
Revenue-unconstrained taxes for cellulosic ethanol are lower than crude oil taxes, reflecting their lower emissions coefficient. The taxes vary by state as well, from $0.12/gallon in Idaho to $0.51/gallon in Washington. Our estimates are consistent with the results simulated by Galinato and Yoder (2010) where they derive an output tax of $0.198/gallon for cellulosic ethanol for the entire US. Interestingly, the ordering of taxes across states is not consistent between crude oil and cellulosic ethanol, where the highest tax for crude oil is in Oregon while the highest tax for cellulosic ethanol is Washington. The differences can be attributed to the sensitivity of the blended fuel prices and waiver revenue to taxes in each state.
The revenue-unconstrained tax depends on damages created by pollution and the sensitivity of consumer welfare and waiver expenditures to small changes in the tax rate. If damages from pollution are large, the tax rate is high. If the tax rate reduces consumer welfare and waiver expenditures by a significant amount, the optimal tax rate is low. The effects of pollution damage are likely to outweigh the negative effects of the tax
Table 1. Optimal Taxes, Changes in Fuel Production and Welfare
TB37 | Page 5 | ext.wsu.edu
WSU EXTENSION | INTEGRATED TAX-SUBSIDY POLICY AND THE CELLULOSIC BIOFUEL INDUSTRY IN THE PACIFIC NORTHWEST
on consumer welfare and waiver expenditures. This implies that if we have two polluting inputs, the tax rate on the more pollution-intensive input will be higher than the tax rate of the less pollution-intensive input.
Revenue-Constrained Tax
Revenue-constrained taxes for crude oil are low, ranging from $0.00006/gallon to $0.0005/gallon. Meanwhile, cellulosic ethanol receives a subsidy. In Washington, the subsidy is $0.41/gallon, in Oregon $0.68/gallon, and in Idaho $1.28/gallon. The large difference in magnitude between crude oil and cellulosic ethanol taxes and subsidies is due to the low input ratio between cellulosic ethanol and crude oil. In other words, there is very little cellulosic ethanol used relative to crude oil in the production of gasoline. Only a small tax on crude oil is needed to subsidize cellulosic ethanol production. Aggregated to the state level, this equates to a total tax bill of $340,200 for Washington, $306,000 for Oregon, and $565,000 for Idaho. The reason why pollution tax revenue is not large is because cellulosic ethanol itself has a positive emission coefficient that is 13% of the crude oil coefficient (Wang et al. 2007).
When the government sets a revenue-neutral integrated tax-subsidy policy, the more pollution-intensive good is taxed while the less pollution-intensive good is subsidized to allow for revenue neutrality (i.e., total additional tax revenue equals zero). As the net tax revenue increases from zero to some positive value, the positive tax rate increases while the subsidy decreases.
Economic and Social Welfare Impacts
Effects on PNW Cellulosic Biofuel Production
Blended fuel and cellulosic ethanol production are affected when taxes are imposed. In the revenue-unconstrained case, blended fuel and cellulosic ethanol both decrease from about 7% to 15% and from 1% to 15%, respectively. In the revenue-constrained case, crude oil use drops a negligible amount, but cellulosic ethanol increases significantly, ranging from 28.5% to 238.4%.
Impacts on Social Welfare
In either tax scenario, total change to social welfare is minor. The maximum welfare change in the revenue-unconstrained case is just 0.49%, while the change in the revenue-constrained case is practically zero. The results are similar to those derived by Galinato and Yoder (2010) and show that imposing a
revenue-neutral tax only increases welfare by 1% of the total increase in welfare relative to the revenue-unconstrained case.
Conclusion
The RFS policy variables perfectly substitute for the taxes. An increase in the cellulosic ethanol subsidy has the same effect as an increase in the cellulosic waiver credit price, and an increase in the crude oil tax has a similar effect to increasing the waiver price multiplied by the cellulosic input ratio requirement. Therefore, as the input ratio requirement increases based on the RFS schedule, the optimal crude oil tax would actually decline. If the tax revenue target is fixed at zero, the optimal cellulosic ethanol subsidy will also decrease accordingly. On the other hand, if the waiver price increases, the optimal cellulosic ethanol subsidy will fall, as will the crude oil tax, to ensure revenue neutrality. In this case, the rising waiver price acts exactly like a tax on crude oil.
The welfare effects of a revenue-neutral tax-subsidy scheme are small compared to a revenue-neutral pollution tax that reduces an existing distortionary tax such as a sales tax or income tax. Skolrud and Galinato (2015) show that increasing a tax on blended fuel and reducing a sales tax in Washington or income tax in Oregon increases social welfare by 19% to 20% while the integrated tax-subsidy scheme yields less than a 1% increase in welfare. However, cellulosic fuel production only increases by about 1% in a revenue-neutral pollution tax while the integrated tax-subsidy policy increases cellulosic fuel production by 28% to 238%. The results make intuitive sense since the integrated tax-subsidy framework only affects the energy sector while a revenue-neutral pollution tax would affect a more significant share of the economy. Thus, if a policymaker is more concerned about growing a cellulosic fuel industry, they would opt to impose an integrated tax-subsidy policy within the energy industry as opposed to a revenue-neutral pollution tax affecting multiple sectors in the economy.
References
Amdur, D., B. Rabe, and C. Borick. 2014. Public Views on a Carbon Tax Depend on the Proposed Use of Revenue. Issues in Energy and Environmental Policy (13).
British Columbia Ministry of Small Business and Revenue. 2008. British Columbia Carbon Tax Update. British Columbia Government.
EIA (US Energy Information Administration). 2013a. Washington State Profile and Energy Estimates: Profile Analysis.
TB37 | Page 6 | ext.wsu.edu
WSU EXTENSION | INTEGRATED TAX-SUBSIDY POLICY AND THE CELLULOSIC BIOFUEL INDUSTRY IN THE PACIFIC NORTHWEST
——. 2013b. Oregon Profile and Energy Estimates: Profile Analysis.
——. 2013c. Idaho Profile and Energy Estimates: Profile Analysis.
EPA (US Environmental Protection Agency). 2010. Regulation of fuels and fuel additives: 2011 Renewable Fuel Standards. Federal Register 75 (236): 76790–76830.
——. 2012. Regulation of fuels and fuel additives: 2012 Renewable Fuel Standards. Federal Register 77 (5): 1320–1358.
——. 2013. Regulation of fuels and fuel additives: 2013 Renewable Fuel Standards. Federal Register 78 (158): 49794–49830.
Galinato, G.I., and J.K. Yoder. 2010. An Integrated Tax-Subsidy Policy for Carbon Emission Reduction. Resource and Energy Economics 32: 310–326.
Galinato, S., G. Galinato, T. Skolrud, C.R. Shumway, and J. Yoder. 2016. Impacts of Federal Biofuel Policy and Market Structure on Development of a Pacific Northwest Cellulosic Ethanol Industry. Washington State University Extension Publication TB25E. Washington State University.
GPO (Government Printing Office). 2011. Code of Federal Regulations, Title 40, Part 80.1456.
Greene, D.L., P.D. Patterson, M. Singh, and J. Li. 2005. Feebates, Rebates, and Gas-Guzzler Taxes: A Study of Incentives for Increased Fuel Economy. Energy Policy 33: 757–775.
Hammar, H., and S. Jagers. 2007. What is a Fair CO2 Tax Increase? On Fair Emission Reductions in the Transport Sector. Ecological Economics 6: 377–387.
IEA (International Energy Agency). 2002. Energy Policies of IEA Countries: Denmark Review (PDF). Head of Publications Service, OECD/IEA 2, rue André-Pascal, 75775 Paris Cedex 16, France.
Johnson, K.C. 2006. Feebates: An Effective Regulatory Instrument for Cost-Constrained Environmental Policy. Energy Policy 34: 3965–3976.
McPhail, L., P. Westcott, and H. Lutman. 2011. The Renewable Identification Number System and US Biofuel Mandate. USDA BIO-03 November 2011. A Report from the Economic Research Service.
Metcalf, G.E. 2009. Designing a Carbon Tax to Reduce U.S. Greenhouse Gas Emissions. Review of Environmental Economics and Policy 3: 63–83.
New York Times. 2009. Europe’s Way of Encouraging Solar Power Arrives in the U.S.
RFSP (Renewable Fuel Standard Program). 2015 Standards for 2014, 2015, and 2016 and Biomass-Based Diesel Volume for 2017, 80 Fed. Reg. No. 111 (Jun. 10, 2015) (amending 40 CFR pt. 80).
Skolrud, T., G. Galinato, S. Galinato, C.R. Shumway, and J. Yoder. 2014. The Role of Market Structure and Federal Renewable Fuel Standards in the Growth of the Cellulosic Biofuel Sector. Working Paper 2014-2.
Skolrud, T., and G. Galinato. 2015. Welfare Implications of the Renewable Fuel Standards with a Revenue-Neutral Tax.Working Paper 2015-18.
Skolrud, T., and G.I. Galinato. 2016. Welfare Implications of the Renewable Fuel Standard with an Integrated Tax Subsidy Policy. Working Paper 2016-6.
Tol, R. S. J. 2005. The Marginal Damage Costs of Carbon Dioxide Emissions: An Assessment of the Uncertainties. Energy Policy 33: 2064–2074.
Vourc’h, A., and M. Jimenez. 2000. Enhancing Environmentally Sustainable Growth in Finland. Economics Department Working Papers No. 229.
Wang, M., M. Wu, and H. Huo. 2007. Life-Cycle Energy and Greenhouse Gas Emission Impacts of Different Corn Ethanol Plant Types. Environmental Research Letters 2: 1–13.
Yacobucci, B.D. 2013. Analysis of Renewable Identification Numbers (RINs) in the Renewable Fuel Standard (RFS). CRS Report R42824. Library of Congress, Congressional Research Service, Washington, D.C.
Yoder, J., C.R. Shumway, P. Wandschneider, D. Young, H. Chouinard, A. Espinola-Arredondo, S. Galinato, C. Frear, D. Holland, E. Jessup, J. LaFrance, K. Lyons, M. McCullough, K. Painter, and L. Stodick. 2010. Biofuel Economics and Policy for Washington State. Washington State University Agricultural Research Center Research Bulletin XB1047E.
TB37 | Page 7 | ext.wsu.edu
WSU EXTENSION | INTEGRATED TAX-SUBSIDY POLICY AND THE CELLULOSIC BIOFUEL INDUSTRY IN THE PACIFIC NORTHWEST
WSU Extension bulletins contain material written and produced for public distribution. Alternate formats of our educational materials are available upon request for persons with disabilities. Please contact Washington State University Extension for more information.
Issued by Washington State University Extension and the U.S. Department of Agriculture in furtherance of the Acts of May 8 and June 30, 1914. Extension programs and policies are consistent with federal and state laws and regulations on nondiscrimination regarding race, sex, religion, age, color, creed, and national or ethnic origin; physical, mental, or sensory disability; marital status or sexual orientation; and status as a Vietnam-era or disabled veteran. Evidence of noncompliance may be reported through your local WSU Extension office. Trade names have been used to simplify information; no endorsement is intended. Published November 2016.
TB37 | Page 8 | ext.wsu.edu
WSU EXTENSION | INTEGRATED TAX-SUBSIDY POLICY AND THE CELLULOSIC BIOFUEL INDUSTRY IN THE PACIFIC NORTHWEST