1 Integrated Tire Analysis and Simulation By T. Yamanishi K. Matsuda The Ohtsu Tire & Rubber Co. Ltd., Osaka, Japan Abstract An effective way of improving the efficiency of product development is integrating analysis and simulation into design, testing and manufacturing processes. To allow designers and engineers to carry out analysis and simulation as an integrated part of the tire development process, thus greatly reducing prototypes and physical testing, Ohtsu Tire Co. Ltd is teaming with MSC to develop automated analysis and simulation tools using MSC.Acumen. These tools are to be integrated together, also with testing and feedback from the field to allow efficient tire optimization. This paper describes the ongoing process of analysis automation, data management and integration. MSC.Acumen based Examples of automated analysis are presented together with performance data and comparisons with experimental results.
Transcript
1
Integrated Tire Analysis and Simulation By
T. Yamanishi K. Matsuda The Ohtsu Tire & Rubber Co. Ltd., Osaka, Japan
Abstract
An effective way of improving the efficiency of product development is integrating analysis and simulation into design, testing and manufacturing processes. To allow designers and engineers to carry out analysis and simulation as an integrated part of the tire development process, thus greatly reducing prototypes and physical testing, Ohtsu Tire Co. Ltd is teaming with MSC to develop automated analysis and simulation tools using MSC.Acumen. These tools are to be integrated together, also with testing and feedback from the field to allow efficient tire optimization. This paper describes the ongoing process of analysis automation, data management and integration. MSC.Acumen based Examples of automated analysis are presented together with performance data and comparisons with experimental results.
2
I. Introduction Ohtsu Tire and Rubber Co. Ltd. is established in 1944 as an airplane tire manufacturer. Today it is better known for its High Performance automotive tires “Falken”. Ohtsu takes pride in Its High Performance tires, also in its Energy Saving tires, for which it received many awards. Ohtsu also produces tires for agricultural and industrial equipment, tire related products, and non-tire products. Ohtsu tires are used in more than 80 countries including Japan, Germany and USA. Sales have been steadily growing over the past years and are now slightly over US$ 1 Billion a year. Ohtsu immediate objectives include improving the profitability of tire operations by reducing cost and securing higher tire market share through enhancing service capabilities and prompt development of new tires that accurately anticipate market needs. To this objective, Ohtsu aims to enhance tire development process. Safety comfort and maneuverability are the targets of the tire engineering technology that Ohtsu has developed for passenger cars tires and has improved over the years. Ohtsu also developed Technology for truck and buss tires to maximize safety, economy and comfort. A next generation technology benefits from an automated analysis and simulation system that integrates analysis and simulation into design, testing and manufacturing processes, in contrast to performing simulation and analysis as an independent function that supports design. To allow designers and engineers to carry out analysis and simulation as an integrated part of the tire development process, Ohtsu is teaming with MSC to develop automated analysis and simulation tools using MSC.Acumen, a modeling, analysis and post processing automation package. These tools are to be integrated together, also with testing and feedback from the field to allow efficient tire optimization. The anticipated outcome is an improved design quality and a shorter tire development cycle. This paper describes the ongoing process of analysis automation, data management and integration. An MSC.Acumen based example of automated analysis is presented together with performance data and comparisons with experimental results. II. Tire development Process In this section, the current tire development process at Ohtsu tire is outlined. Modifications to the process and the introduction of automated analysis and simulation tools are also outlined. Planned time frame and expected benefits are discussed. II.1. Tire development process at Ohtsu Tire The tire development process so far at Ohtsu of a new tire from design concept to manufacturing is shown in Fig.1. The process starts by a study of customer needs from which a
3
Fig. 1. Current tire development process
Design Concept
Competition Research
Pattern Design
Evaluation Design Chart
Construction Design
NP Plain Mold
A
Mold Drawing
Construction Design
Mold Production
FMEA
Experimental Production
Evaluation Mass Production
B
C D
Pattern Cutting
4
Fig. 2. a. Iterative process in new tire development before and after integration
Design Evaluation Design Chart
Test tire production
Target Performance
Mold Drawing
Integrated Design, Simulation and Analysis
Performance Confirmation
Design Chart
Test Tire production
Target Performance
Mold Drawing
Process before integration
Process after integration
5
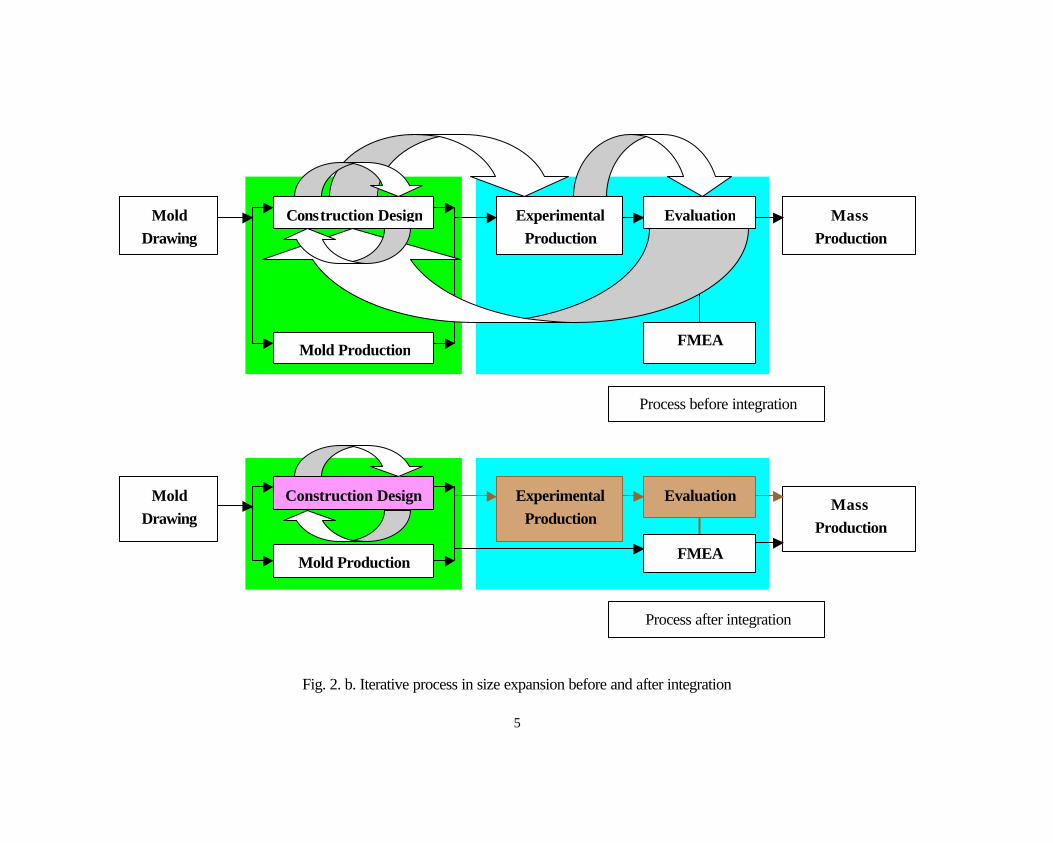
Fig. 2. b. Iterative process in size expansion before and after integration
Mold Drawing
Construction Design
Mold Production FMEA
Experimental Production
Evaluation Mass Production
Mold Drawing
Construction Design
Mold Production FMEA
Experimental Production
Evaluation Mass Production
Process before integration
Process after integration
6
design concept is developed. Competition research then follows and tire target performance is defined. Several Pattern designs and construction designs are then carried out in parallel for each of a number of selected sizes. Several candidate designs of each size are selected and test tires are then molded in a no-pattern plain mold. Pattern is manually cut on each tire to produce test tires. Each of these candidates is evaluated through an extensive laboratory test program. Road tests are then carried out on a selected successful design of each size. A Design Chart that defines sizes to be produced of this series is then prepared and submitted for further evaluation, then production. Based on this chart, mold drawings are prepared. Construction design is carried out for each size in the design chart. In parallel to construction design, molds are manufactured. Once the molds are ready, experimental tires are produced and evaluation is carried out of selected sizes in laboratory and road tests. The FMEA (Failure mode effective analysis) is carried out to ensure compliance to specifications and requirements. After evaluation and FMEA, mass production starts. The processes in Blocks “A” and “C / D” in Fig 1 are iterative in nature as shown in Figs. 2.a and 2.b. Figure 2.a shows the iterative process in a new tire development (block A in Fig. 1) before and after integration of analysis and simulation in the design process. Before integration, and within the design phase, repeated cycles of design modification by designers, then simulation by analysts are carried out to come up with candidates for testing. These candidates are manufactured and tested. Most promising candidates are then returned to design for improvements, then manufactured and tested again, until a satisfactory design is obtained. After integration, as simulation is much faster and carried out by designers, more extensive simulation is carried out to ensure that only one candidate is selected and optimized, then manufactured and tested for confirmation of performance predicted by simulation. Iteration is limited to design modification, simulation and optimization, all carried out by the designer before physical testing. Figure 2.b shows the iterative process in size expansion development (blocks C and D in Fig. 1) before and after integration. As with new tire development, before integration, and within the construction design phase, repeated cycles of design modification by designers, then simulations by analysts are carried out to come up with candidates of selected sizes for testing. These candidates are manufactured in the production mold, now available, and tested. These candidates are then returned to design for improvements, now limited to tire construction, then manufactured and tested again, until satisfactory designs are obtained. After integration, with more extensive simulation, satisfactory designs are obtained and optimized without the need for design modifications after physical testing. Iteration is limited to design modification, simulation and optimization, all carried out by the designer in the construction design stage before physical testing. As calibration and confidence in extensive simulation takes root, experimental confirmation of performance of selected sizes may be much reduced, or completely eliminated. II.2. Design using automated analysis and simulation tools As outlined above, the purpose of the ongoing work is to automate analysis and simulation tools and let designers carry out analysis and simulation by themselves to accelerate the iterative
7
processes using virtual tires and computers rather than physical testing. In this way, iteration is limited to design modification and simulation before physical testing. Simulation acts as virtual testing that replaces much of the physical testing. Designers would have easy and quick access to modern analysis and simulation results that help them in creating better designs and further reduce the necessary iteration in design modification and virtual testing. Physical testing would be reduced to only confirming the performance of final designs. Figure 3 outlines the concept of tire design using automated analysis and simulation tools as applied to a new tire. Once target performances are decided, design of each of a selected number of sizes goes into two parallel branches, pattern design and construction design. In pattern design, proposed patterns are defined in a 2-D CAD system for engineering evaluation purposes, and also in a 3-D CAD system for visualization and later, when the final design is achieved, for mold production. Proposed patterns undergo various evaluation processes based on experience. Several candidates are selected for eva luation by virtual testing together with the rest of the tire. Most promising candidates are modified and reevaluated, still by virtual testing, until a satisfactory pattern is selected. In the other branch, Construction design, several tire layouts are defined in 2-D CAD, then evaluated through virtual testing using a temporary pattern, then with selected pattern candidates once these are available. Design iteration continues until a satisfactory tire is obtained. This satisfactory tire goes into optimization cycles to further improve performance and reduce production cost. The final design is then submitted for physical testing to confirm performance. In size Expansion, tread is already fixed. Only construction design is necessary and only the second branch of the above process is carried out. A key factor in this concept is that extensive virtual evaluation is carried out by designers as they develop the design. This is in contrast to carrying out analysis and simulation by analysts. In order to allow designers to carry out such an extensive virtual evaluation, it is necessary to have automated analysis and simulation tools. Further, for designers to have easy access to these automated analysis and simulation tools, ease of use is an uncompromising must. The analysis automation package MSC.Acumen offers this ease of use while providing high quality automated analysis and simulation. - Designers do not need to know the theories of numerical analysis and the Finite Element
Method, - Designers do not need to study and memorize how to use general purpose solvers and
pre/post processors, - MSC.Acumen guides designers through the analysis definition process using designer’s
terminology - MSC.Acumen incorporates tire analysis and simulation expert knowledge that allows high
quality analysis and simulation to be carried out by designers. - All modeling, analysis, simulation and post processing are automatic, fast and reliable.
8
Fig. 3. Outline of tire design (new tire development) using automated analysis and simulation tools
MSC.Acumen
Mold Drawing
Performance Confirmation
Design Chart
Test Tire Production
Target Perfor-mance
Construction Design
Pattern Design
Dimensions
Pitch
arrangement 2-D CAD
Modeling Material properties Boundary conditions Loads Simulation Results visualization
Stresses and strains Tire spring constant
Contact patch shape and pressure
Cornering characteristics Tread pattern stiffness
Contour (dimensions) Rolling resistance
Eigen values
Wet traction Hydroplaning
Wear prediction
Mass and cost 2-D CAD
Dimensions
Gauge
Materials
Satisfactory
Yes
No
3-D CAD
Optimization
9
In this way, Designers can quickly carry out analysis or simulation, and get high quality results any time such an analysis or simulation is needed. The resulting final design is extensively virtually tested and ensured to have the required performance. Physical testing is reduced to tire performance confirmation with no iteration carried out in this stage. The range of work covered by MSC.Acumen is shown in Fig. 3. II.3. Benefits and implementation Benefits of this design procedure using automated analysis and simulation tools may be summarized as follows. - Reduction of designers and analysts time spent in each design, - Reduction of mold costs, - Reduction of experimental production costs, - Reduction of physical testing costs, - Much faster product development cycle, - Better design quality. Further, it provides virtual visual images for management and customer consideration. These automated tools are incrementally introduced at Ohtsu. Types of analysis and simulation are incrementally increased to cover those listed in Fig. 3 over three years. Figure 4 shows the reduction in product development cycle of a typical passenger tire after one year, and planned reduction in years 2 and 3 due to this incremental introduction of analysis and simulation types.
Fig.4. Development cycle time reduction of a typical passenger tire
10
Further, these tools are incrementally applied to more new designs and size expansions. Figure 5 shows the percentage at Ohtsu of new tire designs, size expansions for domestic use and export, and size expansions of tires with special features for export. Tires in the last two categories are the vast majority. As they need less analysis and simulation types than new tire designs, they are targeted for early application o f automated tools. Therefore, a design in these two categories will benefit from the automated tools earlier than a new tire design. Further, more designs in these two categories are expected to benefit from these tools earlier than new tire designs. In this way early benefits are maximized. Ultimately, all tire design at Ohtsu will be carried out using these tools.
Fig. 5. Percentage of size expansions, size expansions for export and new tire designs III. Automated tools development MSC.Acumen is an automation package that is used to develop specific automated analysis and simulation applications. The development process has two steps. The first is the development of best analysis and/or simulation practice that is best suited to its purpose. The second is incorporating this best practice into Acumen to come up with the required automated tool. In the following these two steps are discussed and an example is presented. III. 1. Development of best practice When analysis or simulation is carried out by dedicated analysts, an analyst, based on his
1- New designs 2- Size expansion, domestic and export 3- Size expansion, especial for export
11
knowledge and experience, would define approach, model and analysis conditions to suit the particular task he is performing and his purpose of this task. Also he would check validity of analysis as he views a wide range of output, then extracts needed results and submit them to the designer. An analyst can afford to have an ill-conditioned analysis that he can improve in a second run. Each analyst develops his own implicit style and rules to carry out valid analyses and simulations without an urging need to explicitly spell his style and rules out. On the other hand, in an automated analysis carried out by a designer, approach, modeling and analysis conditions must be well defined to ensure that when they are automatically created, they will give highest possible reliability and suitability of the analysis to its purpose. There must be no need for the designer to check the validity. Also required analysis results should be predefined and readily obtained once the analysis is complete. Best practice is this predefined set of approach, modeling rules, analysis and simulation conditions, validity checks and selected results. These must be predefined for each type of analysis and are indispensable for a successful automated procedure. Best practice development criteria Best practice of an analysis or a simulation task is judged based on two main criteria: Accuracy and, Time and resources required to complete the task. These are two contradicting criteria and a correct balance between them differs according to the purpose of the task. In design, a design engineer may be willing to accept less accuracy in favor of having quick results. On the other hand in research, researchers may be willing to wait for longer times to get better accuracy. Management will always be interested in less resource spent on each task to minimize investment. In analysis and simulation, deviation of predicted performance from actual performance is unavoidable. Reasons can be summarized as follows 1) Difference between the modeled design and the actual tire, 2) Simplifications during modeling, 3) Ability of the theories used in solvers to reproduce actual behavior, 4) FEM discretization error. In best practice development, the first is reduced by reducing such differences based on knowledge of fabrication and curing processes. These knowledge are incorporated in MSC.Acumen to modify a modeled design to get closer to an actual tire produced to this design. For example, corrections to belt cord angles can be incorporated in the model. The second may be reduced by incorporating design standards in MSC.Acumen. These can provide much of the details without having to define them one by one each time a model is created. Unnecessary details may be overlooked based on numerical studies. A step forward would be parametric modeling based on standard configurations (Templates). The third difference is reduced through correct selection of the simulation tool from commercially available tools as well as in-house tools. Further, software development may be carried out to enhance such tools to suit the analysis or simulation task. Here also efficiency of simulation tools is considered. The last reason can be
12
controlled by creating coarse or fine meshes as required. However, here, better accuracy directly means more computer resources: time, memory and disc space. Best practice development for mounting/inflation, stiffness and footprint analysis. 1) Purpose of analysis This analysis is carried out to predict one or more of the following: a) Inflated dimensions, b) Stresses in the inflated tire, c) Vertical tire stiffness, d) Footprint configuration under a specified load, e) Pressure distribution in footprint under a specified load. The analysis is intended for design as
well as for research 2) Modeling a) Tire model Numerical tests are carried out with several finite element mesh densities. Figure 6 shows one of the considered mesh densities in cross section. The number of elements along the circumference is also varied. Meshes are graded in the circumference with dense mesh in the part in contact with road surface and coarser mesh elsewhere. Finally three meshes are selected for three levels of analysis: Easy, standard and accurate. A designer assigns a mesh to an analysis based on the purpose of the analysis. Two material models are considered: elastic and hyper-elastic (rubber). A designer also assigns a material model to an analysis depending on the purpose. b) Rim model Fig. 6. Tire model cross-section
13
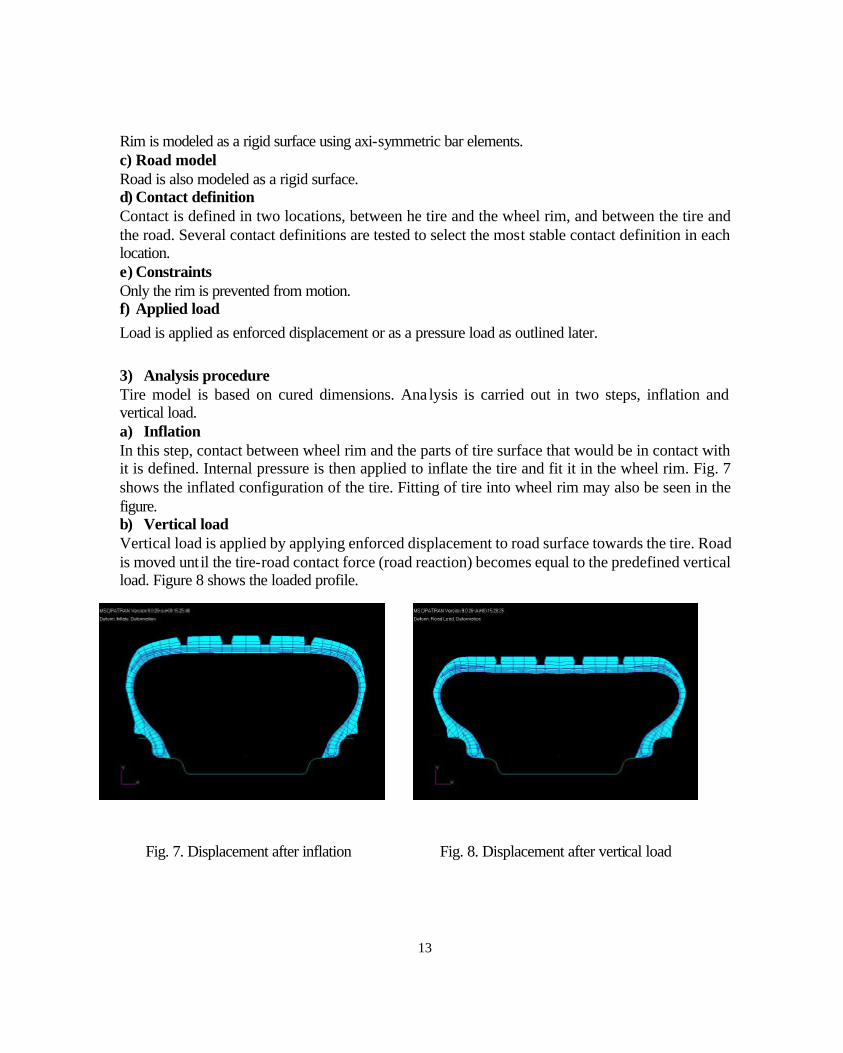
Rim is modeled as a rigid surface using axi-symmetric bar elements. c) Road model Road is also modeled as a rigid surface. d) Contact definition Contact is defined in two locations, between he tire and the wheel rim, and between the tire and the road. Several contact definitions are tested to select the most stable contact definition in each location. e) Constraints Only the rim is prevented from motion. f) Applied load Load is applied as enforced displacement or as a pressure load as outlined later. 3) Analysis procedure Tire model is based on cured dimensions. Ana lysis is carried out in two steps, inflation and vertical load. a) Inflation In this step, contact between wheel rim and the parts of tire surface that would be in contact with it is defined. Internal pressure is then applied to inflate the tire and fit it in the wheel rim. Fig. 7 shows the inflated configuration of the tire. Fitting of tire into wheel rim may also be seen in the figure. b) Vertical load Vertical load is applied by applying enforced displacement to road surface towards the tire. Road is moved unt il the tire-road contact force (road reaction) becomes equal to the predefined vertical load. Figure 8 shows the loaded profile. 4)
Fig. 7. Displacement after inflation Fig. 8. Displacement after vertical load
14
4)Results Results obtained from the analysis may be listed as follows
a) Inflation profile b) Spring constant as defined by vertical load / vertical deflection c) Loaded profile d) Contact patch e) Cost and weight
5) Comparison with Experimental measurements Accuracy of analysis results depends on the model and analysis level selected: easy, standard or accurate. The following are typical differences found between analysis results and experimentally measured values. Cost and weight < 5% Inflated dimensions < 1% Displacement due to inflation < 10% Loaded profile dimensions < 2% Displacement due to vertical load < 10% Spring constant < 10% It is considered that these differences are small and that the accuracy of analysis is satisfactory to design purposes. III.2. MSC.Acumen application As pointed out before, the purpose of developing MSC.Acumen applications is three-fold. Firstly, to automate analysis and simulation in a fashion tailored to the specific process at Ohtsu. Secondly, to encapsulate the knowledge of expert analysts in this MSC.Acumen application to allow a non-expert user to do analysis and simulation at the same level of proficiency as an expert analyst. This allows a large community of tire designers to swiftly do credible analysis and simulation as they develop tire designs. Thirdly, to free the expert analysts to carry out further challenging analyses and simulations. MSC.Acumen applications act as drivers to the underlying MSC.Patran. It takes advantage of all MSC.Patran capabilities and advanced algorithms. All development is done in PCL (Patran Command Language). This ensures that maintenance effort is minimized as new versions of MSC.Acumen and MSC.Patran are released. PC with Windows NT operating system is selected as the main analysis and simulation platform for several reasons. 1. Designers are already familiar with PCs and Windows operating systems. A PC Windows NT
platform is much easier for designers to use than UNIX platforms. 2. PC performance has drastically improved over the past few years and now competes with
fastest Engineering Workstations, while the cost remains much less. 3. Many Software companies are adopting this platform as their main software development
platform. Adopting this platform improves Ohtsu’s access to the latest software technology
15
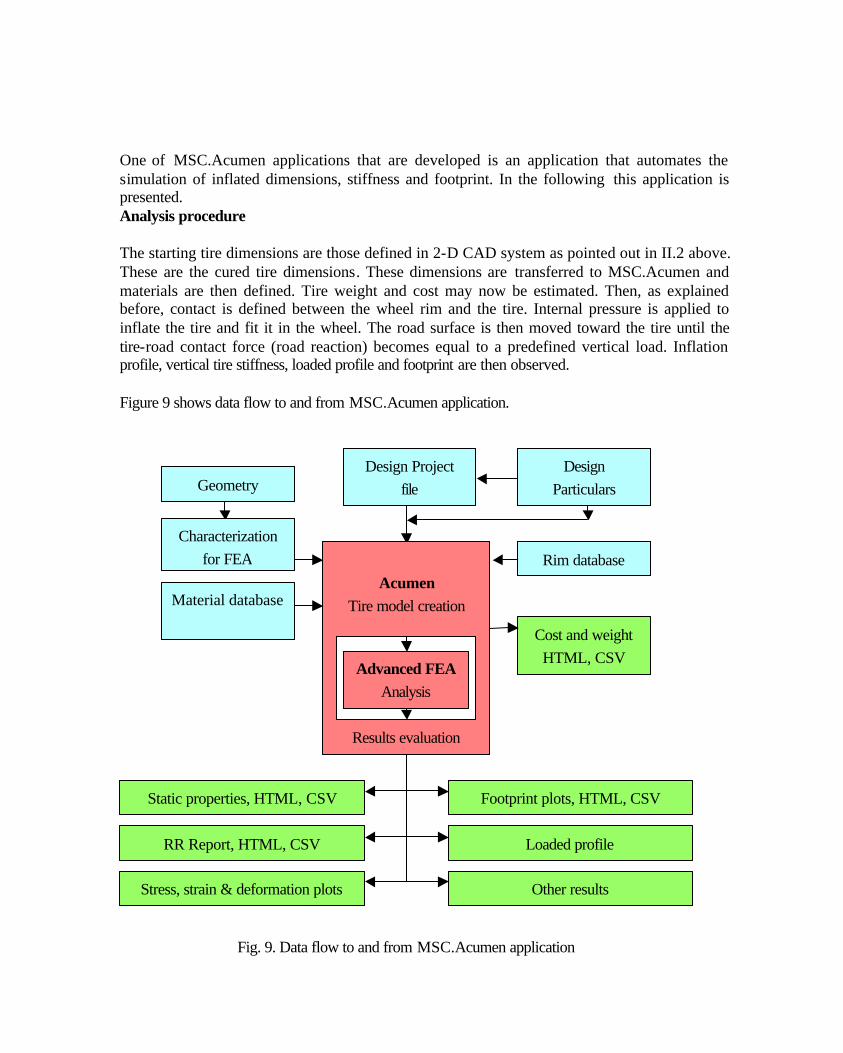
One of MSC.Acumen applications that are developed is an application that automates the simulation of inflated dimensions, stiffness and footprint. In the following this application is presented. Analysis procedure The starting tire dimensions are those defined in 2-D CAD system as pointed out in II.2 above. These are the cured tire dimensions. These dimensions are transferred to MSC.Acumen and materials are then defined. Tire weight and cost may now be estimated. Then, as explained before, contact is defined between the wheel rim and the tire. Internal pressure is applied to inflate the tire and fit it in the wheel. The road surface is then moved toward the tire until the tire-road contact force (road reaction) becomes equal to a predefined vertical load. Inflation profile, vertical tire stiffness, loaded profile and footprint are then observed. Figure 9 shows data flow to and from MSC.Acumen application.
Geometry
Characterization for FEA Rim database
Material database
Design Project file
Design Particulars
Acumen
Tire model creation
Results evaluation
Advanced FEA Analysis
Footprint plots, HTML, CSV
Loaded profile
Other results
Static properties, HTML, CSV
RR Report, HTML, CSV
Stress, strain & deformation plots
Cost and weight HTML, CSV
Fig. 9. Data flow to and from MSC.Acumen application
16
GUI and imbedded expert Knowledge Once the MSC.Acumen application is started, the MSC.Acumen drive form shown in Fig. 10 is displayed. The form requests the designer to open an analysis file. The Designer assigns a file
name and clicks on the apply button. Analysis steps are then displayed in the “Workflow Manager” of the drive form as shown in Fig. 11.
Fig. 10 Starting MSC.Acumen Drive Form
Fig. 11 Workflow steps
Workflow Manager
Dialog Area
17
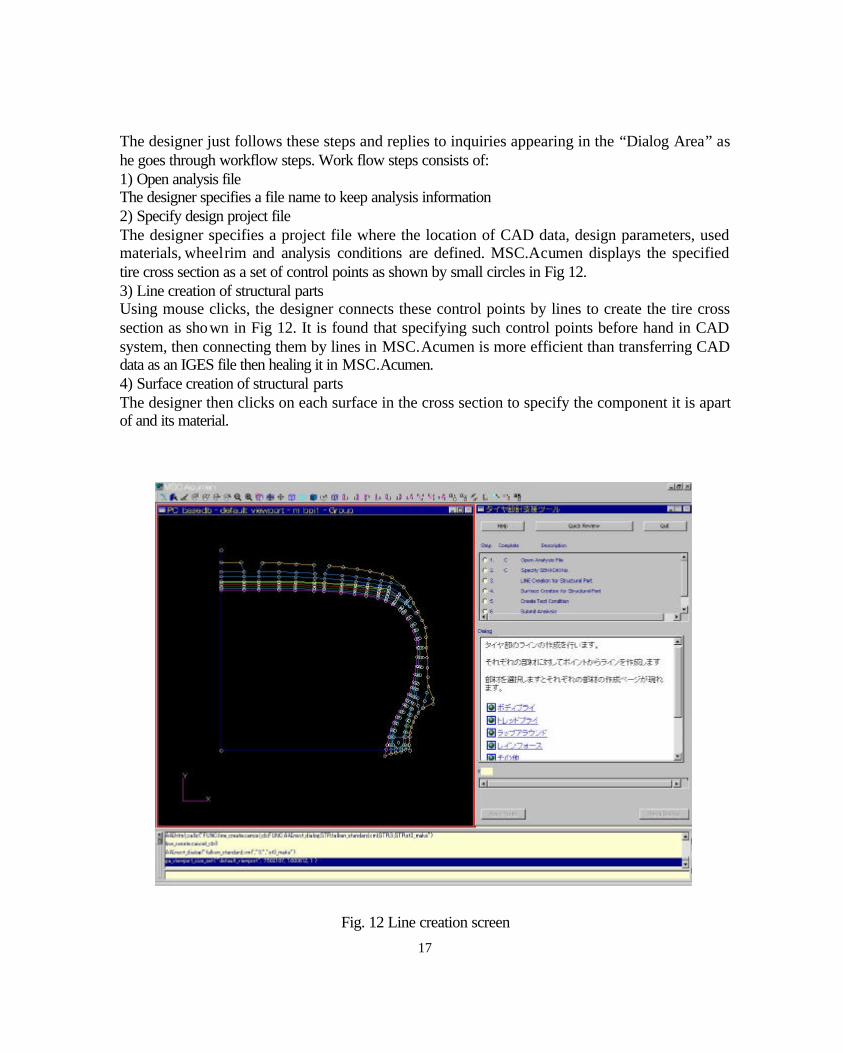
The designer just follows these steps and replies to inquiries appearing in the “Dialog Area” as he goes through workflow steps. Work flow steps consists of: 1) Open analysis file The designer specifies a file name to keep analysis information 2) Specify design project file The designer specifies a project file where the location of CAD data, design parameters, used
materials, wheel rim and analysis conditions are defined. MSC.Acumen displays the specified tire cross section as a set of control points as shown by small circles in Fig 12. 3) Line creation of structural parts Using mouse clicks, the designer connects these control points by lines to create the tire cross section as shown in Fig 12. It is found that specifying such control points before hand in CAD system, then connecting them by lines in MSC.Acumen is more efficient than transferring CAD data as an IGES file then healing it in MSC.Acumen. 4) Surface creation of structural parts The designer then clicks on each surface in the cross section to specify the component it is apart of and its material.
Fig. 12 Line creation screen
18
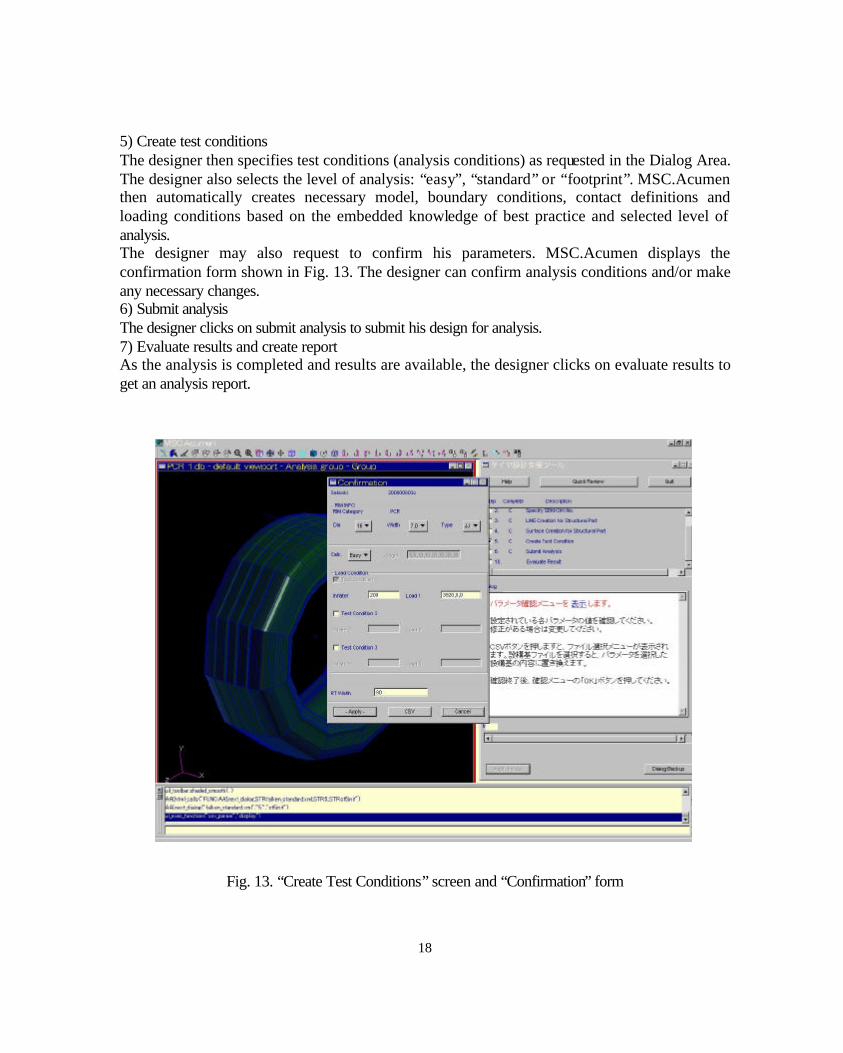
5) Create test conditions The designer then specifies test conditions (analysis conditions) as requested in the Dialog Area. The designer also selects the level of analysis: “easy”, “standard” or “footprint”. MSC.Acumen then automatically creates necessary model, boundary conditions, contact definitions and loading conditions based on the embedded knowledge of best practice and selected level of analysis. The designer may also request to confirm his parameters. MSC.Acumen displays the confirmation form shown in Fig. 13. The designer can confirm analysis conditions and/or make any necessary changes. 6) Submit analysis The designer clicks on submit analysis to submit his design for analysis. 7) Evaluate results and create report As the analysis is completed and results are available, the designer clicks on evaluate results to get an analysis report.
Fig. 13. “Create Test Conditions” screen and “Confirmation” form
19
Performance Designers are using this MSC.Acumen application at present to complete in 15 minutes what an analyst needed 4 hours to complete. IV. Conclusions In the above, tire development process so far at Ohtsu Tire and rubber Co. is outlined. Modifications to this process to reduce iteration cycles and physical testing are also outlined. These modifications pivot on automated analysis and simulation tools that will allow designers to carry out analysis and simulation by themselves. The concept of design using automated analysis and simulation tools is also pointed out. Benefits expected by Ohtsu are mentioned together with a time frame to collect these benefits. An MSC.Acumen based example of automated analysis is presented together with comparisons with experimental results and performance data. These comparisons and performance data confirm the benefits that Ohtsu is expecting from the integrated tire development process and automation tools.


![Tire Price List [TireOutfitters Toronto Tire Specialist]](https://static.documents.pub/doc/80x56/542ceaed219acd4e4b8b4d6e/tire-price-list-tireoutfitters-toronto-tire-specialist.jpg)


