Integrating Effluent from Recirculating Aquaculture Systems with Greenhouse Cucumber and Tomato Production by Jeremy Martin Pickens A dissertation submitted to the Graduate Faculty of Auburn University in partial fulfillment of the requirements for the Degree of Doctor of Philosophy Auburn, Alabama August 1, 2015 Keywords: aquaponics, integrated, horticulture, tilapia, hydroponics, economics Copyright 2015 by Jeremy Martin Pickens Approved by Terrill R. Hanson, Co-chair Professor of Fisheries, Aquaculture and Aquatic Sciences Jesse A. Chappell, Co-chair, Associate Professor of Fisheries, Aquaculture and Aquatic Sciences Claude E. Boyd, Professor of Fisheries, Aquaculture and Aquatic Sciences Jeff L. Sibley, Professor of Horticulture
Transcript
Integrating Effluent from Recirculating Aquaculture Systems with Greenhouse Cucumber and Tomato Production
by
Jeremy Martin Pickens
A dissertation submitted to the Graduate Faculty of Auburn University
in partial fulfillment of the requirements for the Degree of
II. Integrating Beit Alpha Cucumber Production with Biofloc Tilapia Production ....................................................................................................................19
III. Integrating Greenhouse Cherry Tomato Production with Biofloc Tilapia Production ..............................................................................................................43
IV. Economics and Input Efficiencies Associated with Integrating Biofloc Tilapia Production with Cherry Tomato Production .........................................................72
Literature Cited ................................................................................................................98
vii
List of Tables
II. Table 1. Yield of Beit Alpha cucumber ‘Manar’ grown with aquaculture effluent or conventional fertilizer .................................................................................37
Table 2. Greenhouse cucumber yields found in literature ..........................................38
Table 3. Shoot nutrient analysis of Beit Alpha cucumber ‘Manar’ grown with aquaculture effluent or commercial fertilizer ..............................................39
Table 4. Fruit nutrient analysis of Beit Alpha cucumber ‘Manar’ grown with aquaculture effluent or commercial fertilizer ..............................................40
Table 5. Nutrient concentrations of commercial fertilizer and aquaculture effluent applied to Beit Alpha cucumber ‘Manar’ ...................................................41
Table 6. Fish culture system and effluent water quality ............................................42
III. Table 1. Fertilization schedule for greenhouse tomato production ............................60
Table 2. Inputs and outputs of a 149 day tilapia crop in a 100 m3 production system ...........................................................................................................61
Table 3. Water quality parameters as relates to fish health during 149 day production
cycle in a minimum water exchange biofloc production system. .................62
Table 4. Dailey water quality parameters as relates to fish health during 149 day production cycle in a minimum water exchange biofloc production system. ..........................................................................................................63
Table 5. Yield of cherry tomato cultivars ‘Goldita’ and ‘Favorita’ grown with
conventional fertilizer or aquaculture effluent ............................................64
Table 6. Yield of cherry tomato cultivars ‘Goldita’ and ‘Favorita’ grown with conventional fertilizer or aquaculture effluent at time of fish harvest and crop termination ...........................................................................................65
Table 7. Water quality parameters taken weekly as relates to plant health during 149
viii
production cycle in a minimum water exchange biofloc production system ..........................................................................................................66
Table 8. Nutrient concentration of cherry tomato ‘Favorita’ fruit tissue grown with conventional fertilizer or aquaculture effluent ..............................................67
Table 9. Nutrient concentration of cherry tomato ‘Goldita’ fruit tissue grown with
conventional fertilizer or aquaculture effluent ..............................................68
Table 10. Nutrient concentration of cherry tomato ‘Favorita’ leaf tissue grown with conventional fertilizer or aquaculture effluent ..............................................69
Table 11. Nutrient concentration of cherry tomato ‘Goldita’ leaf tissue grown with conventional fertilizer or aquaculture effluent ..............................................70
Table 12. Optimum levels of nutrient elements in greenhouse tomato leaf tissue .....71
IV. Table 1. Production parameters for tilapia crop integrated with cherry tomato production in greenhouses in Auburn, AL ...................................................85
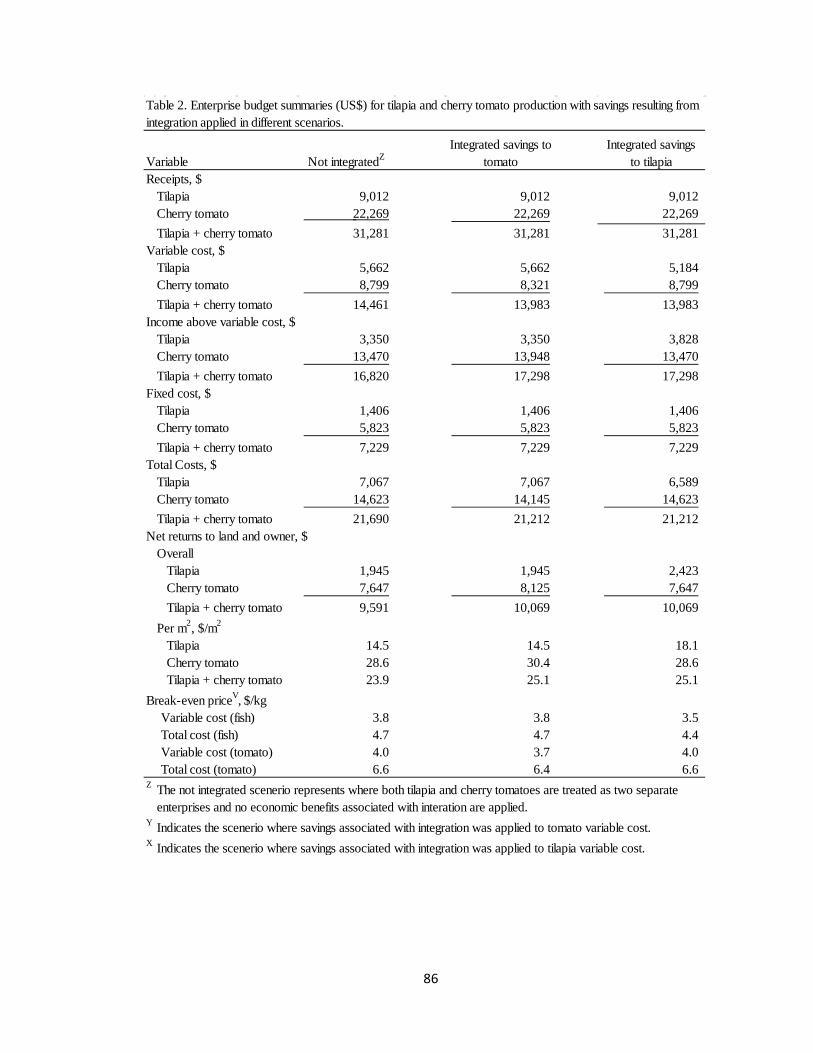
Table 2. Enterprise budget summaries (US$) for tilapia and cherry tomato production with savings resulting from integration applied in different scenarios .........86
Table 3. Investment cost/development cost for one greenhouse in tilapia production (267m3 production area) .............................................................................87
Table 4. Initial investment cost for one 267.5 m2 greenhouse in cherry tomato production ...................................................................................................88
Table 5. Enterprise budget comparing integrated and nonintegrated tilapia and greenhouse cherry tomato production for one crop each .............................90
Table 6. Fertilization schedule for greenhouse tomato production ............................93
Table 7. Comparison of input conversions for greenhouse cherry tomato production and their integration .....................................................................................94
1
Chapter I
Literature Review
Aquaculture Current Status and Outlook.
Seafood is a major staple for a large percentage of the world’s population. On a
global scale the Food and Agriculture Organization of the United Nations (FAO) has
reported fish provide 3.0 billion people with approximately 20% of their animal protein
and 4.3 billion with about 15 % of their total protein (FAO, 2012). Fish production has
continued to grow globally with demand with improved cultural techniques and
advancements in distribution, fish production has grown at an average rate of 3.2%
annually from 1960’s to 2009 (FAO, 2012). As of 2010, growth increased beyond the
increase in global population (1.5%), indicating more fish products are being consumed
per capita (FAO, 2012). Per capital fish supply has nearly doubled from 9.9 kg to 18.4
kg per person in that same amount of time (FAO, 2012).
The increase in fish products sold may be largely attributed to increased affluence
in the populations financially able to afford fish, primarily populations in China and India
(Kharas, 2010; Jenson 2006). By 2020 the middle class in Asia is expected to double
(Kharas 2010) creating anticipation that fish consumption will increase rapidly as a direct
result of increased wealth. Reliance on aquaculture products as an important protein
2
source is predicted to increase as the global population increases (Naylor et al., 2000).
Increases in aquacultures contribution to fish products sold has taken place rapidly since
the mid-1990’s, due to the percent of captured fisheries leveling off (Naylor et al., 2000).
In 1995, aquaculture accounted for 20% of produced fish but had increased to 47% in
2010 (FAO, 2012). Forecasting the growth of aquaculture production is difficult and can
be affected by numerous factors.
Fish production is very efficient in feed conversion compared to other livestock
animals but there is still a large amount of waste produced. Fish waste containing
nutrients can have negative environmental impacts to encompassing or nearby water
bodies (Cao et al., 2007; Herbeck et al., 2014; Farmaki et al., 2014). Feed can account for
over 50% of production cost in aquaculture production (FAO 2009), so it is desirable to
convert as much of that feed into a sellable product as possible. Improving the nutrient
use efficiency (NUE) can increase both the economic and environmental sustainability of
an aquaculture system.
Improving efficiency and reducing waste
Fish waste has been extensively studied in a variety of production systems and
species in an effort to determine methods to improve NUE and reduce environmental
impact. Shrimp are able to assimilate 25 to 30% of the nitrogen and phosphorus applied
within the feed into harvestable biomass (Boyd and Tucker, 1998). Schneider et al.,
(2004b) in an evaluation of fishmeal alternatives, observed 33 to 40% of fed phosphorus
was lost to fecal waste, 60 to 70% was assimilated into tilapia biomass and a very small
3
percent was lost as non-fecal waste (branchial-urinary waste). 43 to 48% of fed nitrogen
was assimilated into biomass leaving 52 to 57% of fed nitrogen lost to fish waste. Unlike
phosphorus, the majority of nitrogen lost was attributed to non-fecal losses (Schneider et
al., 2004). Van Weerd et al., (1999) also reported similar low amounts of P loss to
bronchial-urinary pathways (3 to 6%) in soy and fish meal based diets. Gross et al.,
(2000) in catfish pond production reported 31.5% of nitrogen was assimilated into fish
biomass. Understanding what proportion of a nutrient is lost to fecal or branchial-urinary
waste can aid in the improvement of NUE of a given nutrient.
Indicators can be used to compare agriculture systems in terms of different
efficiencies. The most common efficiency measured in aquaculture is feed conversion
Boyd (2005) has suggested using a water index that would allow systems to be evaluated based on water use, where:
4
𝑊𝑊𝑅𝑅𝑅𝑅𝐹𝐹𝐶𝐶 𝑈𝑈𝐶𝐶𝐹𝐹 𝐼𝐼𝐶𝐶𝐹𝐹𝐹𝐹𝑥𝑥 𝑏𝑏3/𝑅𝑅 =Total water used in production (m3)
𝐵𝐵𝐶𝐶𝐶𝐶𝑏𝑏𝑅𝑅𝐶𝐶 𝑃𝑃𝐶𝐶𝐶𝐶𝐹𝐹𝑁𝑁𝑠𝑠𝑅𝑅𝐶𝐶𝐶𝐶𝐶𝐶 (𝑅𝑅)
(Adopted from water use indices proposed by Boyd, 2005.)
Recirculating Aquaculture Systems
In order improve efficiencies in space, water, and feed utilization, recirculating
aquaculture systems (RAS) have been extensively researched and developed. RAS
utilize specialized equipment engineered to enhance filtration to treat and mechanically
remove waste (Timmons and Ebeling, 2013). Filtration allows water to be recirculated
back to the fish production resulting in considerable water savings. Most RAS operate
with only 5 to 10% daily water exchange (Masser et al.,1999) Recirculating aquaculture
systems (RAS) are input intensive and require high fish production densities to account
for cost associated with development and operation (Lasordo et al., 1998). In order for
RAS to be ecomomical they need to operate at maximum capacity (Masser et al., 1999).
Densities of 0.5 pounds per gallon or greater may be required for RAS to be cost
effective compared to the 0.005 to 0.007 lbs. per gallon densities associated with
traditional aerated aquaculture pond (Masser et al., 1999; Losordo et al., 1998).
Most RAS rely heavily on nitrification; the bacteria based biological oxidation of
ammonium to nitrate (Sharma and Ahlert, 1977). Nitrification is a two-step process, with
he first step involving the bacteria Nitrosomonas sp. oxidizing ammonium into nitrite.
Nitrite is still a toxic compound to fish and must be converted to nitrate after further
oxidation by Nitrobacter sp. (Sharma and Ahlert, 1977). Nitrification can be enhanced in
a system by increasing available surface area for bacterial growth. This is accomplished
5
through the use of media with a high surface area, such as plastic beads or pvc shavings.
The substrate and its housing is referred to as a biofilter.
Nitrification has a significant impact on water quality in RAS and without it total
ammonia nitrogen would quickly build up to toxic levels. Nitrification is significantly
affected by pH, with the process favoring alkaline conditions (Sharma and Ahlert, 1977).
Nitrification is most efficient in aquaculture systems at pH 7.0-8.5 (Masser et al., 1999;
Boyd and Tucker, 1998). The process of nitrification creates conditions that work against
its own optimum water quality conditions needed for the process to continue.
Nitrification is an acid forming process. For every one gram of total ammonia nitrate
(TAN) converted to nitrate, 7 grams of alkalinity will be consumed and 4.5 to 5.85 grams
of CO2 will be produced leading to acid forming conditions (Ebeling et al., 2006; Boyd
2000).
In minimum or zero exchange systems, nitrate can build up to high
concentrations. A cost effective method of removing nitrate is a major problem facing
aquaculture filtration technology (Lee et al., 2000). Nitrate has historically been thought
to have low toxicity (Masser et al., 1999; Losordo et al., 1998), but recent research has
shown that fish species and maturity may be more sensitive than once thought (Davidson
et al., 2014, Lee et al., 2000; Colt 2006). In an investigation of acute toxicity of nitrate to
five marine species, toxicity ranging from 573 Nitrate mg/l (129 mg/l NO3--N) to 3000
(688 NO3--N) were reported (Pierce et al., 1993). Given acute toxicity exists, chronic
exposure to elevated nitrate concentrations likely have negative impacts on yield.
In traditional RAS, nitrate concentrations can cost effectively be reduced by two
methods; water exchange (dilution) or through denitrification. Denitrification involves
6
treating culture water by recirculation in an anaerobic vessel where bacteria are able to
use nitrate or nitrite in anaerobic respiration (Van Rijn et al., 2006). The end result of
denitrification is the conversion of nitrate and/or nitrite into nitrogen gas that is
subsequently lost through volatilization (Van Rijn et al., 2006; Lee et al., 2000). Both
dilution and denitrification result in lowering NUE as nitrogen is lost from the system and
recovered into sellable products.
While RAS systems are traditionally very efficient in water conservation, the
same mass of waste is still being produced. In a RAS comparing two trout feed, Heinen
et al., (1996) reported 57 to 66% Nitrogen lost to waste and 35 to 45% of P lost to waste.
Rafiee and Saad (2005) reported only 32.5% of fed N and 16% of fed P being captured
by tilapia in a RAS. Traditional RAS allow for easier handling of waste, but outside of
increased management abilities (improved FCR) traditional RAS technology does little to
improve the NUE of a system.
Biofloc Technology (BFT) is a form of RAS but lacks a formal biofilter and has
different management techniques. BFT involves the retention and mixing of settable
solids within the system. Retention of solids allows for the following: re-release of
nutrients from solid waste, surface area for bacteria, and a food source for fish species
with filter feeding abilities (De Schryver et al., 2008; Avnimelech 2006).
BFT utilizes heterotrophic bacteria to convert ammonia into microbial proteins by
increasing the C:N ratio. Increasing C:N ratio can be accomplished by adding highly
available carbon sources or lowering the percent protein in feed (Avenemilich 1999;
Azim et al., 2008). Certain species can graze on this microbial protein allowing for
improved feed conversions. BFT systems may also utilize photoassimilation by
7
converting nitrogen into algae biomass. BFT systems also involve some degree of
nitrification. BFT has been shown to improve FCR over clear water systems (Azim and
Little, 2008).
BFT can significantly improve NUE compared with traditional RAS systems by
using fish to consume the protein rich waste. Not all waste is utilized by fish, and a
degree of solid removal may be necessary (Azim et al., 2008). BFT systems are
inexpensive, can greatly decrease water usage and can improve NUE. BFT is limited to
only certain fish species that can filter feed and handle the associated water quality
conditions.
Nutrient waste such can be also be handled through uptake and assimilation into
plant biomass. This concept has been successfully employed in constructed wetlands
using aquaculture effluent. Constructed wetlands mimic natural wetlands and associated
nutrient cycles, including plant assimilation, denitrification, and microbial degradation
(Summerfelt et al., 1999) Constructed wetlands require large amounts of space, efficiency
and can be seasonally influenced. Constructed wetlands do not lend well to incorporation
within a RAS but can have important applications for RAS effluent treatment. In a study
by Alder et al., (1996) constructed wetlands using various grass species were able to
capture 40 % and 90% of effluent N and P, respectively. The biweekly harvest of grass
clippings captured removed 50% of effluent N and 80% of effluent P (Alder et al., 1996).
Constructed wetlands typically do not involve a sellable product and is a control
technique involving a net loss of nitrogen and thus improves NUE, but not nutrient
conversion into sellable products.
8
Utilizing plant biomass to assimilate nitrogen into sellable plant products can
dramatically improve the NUE of fed N into a system. This can be accomplished with
food, ornamental crops or biofuel crops. Research has shown the solid fraction in BFT is
similar to other manures and could be used to an extent for land application or as a
substrate amendment (Naylor et al., 1999; Salazar and Saldana, 2007; Castro et al., 2006;
Danaher et al., 2013). Naylor et al., (1999) observed that salmonid waste from cage
culture was similar to livestock manures in regards to N, P, Ca, and Mg but fish manure
was lower in potassium. Dewatered aquaculture effluent has been shown to be a nutrient
source and a suitable substrate amendment in the production of floriculture crops and
vegetable transplants (Danaher et al., 2013, Danaher et al, 2014, Sleeper et al., 2009).
Integrating fish production with greenhouse vegetable production
Hydroponic vegetable production has been shown to lend itself well with
integration into RAS, improving NUE. The integration of intensive aquaculture with
hydroponic vegetable production is commonly referred to as aquaponics (Rakocy et al.,
2006). Aquaponics utilizes plant production to remove dissolved nutrients directly from
fish culture water by assimilating nutrients into plant biomass. The decrease in dissolved
nutrients improves water quality for fish. Fish replenish nutrients in the water as they are
fed and release more waste. The synergistic benefits of integrating RAS with
hydroponics has been well documented.
The most notable and popular aquaponic research and system design can be traced
to the work of James E. Rakocy at the University of the Virgin Islands (UVI) (Rakocy
9
2006). This system incorporates raft culture into RAS technology. UVI has validated
and provided much of the information that is used today in regards to system sizing,
nutrient supplementation and general management strategies (Rakocy, 1988, Rakocy et
al., 2004, Rakocy et al., 2007).
Aquaponic systems have been shown to improve NUE and nutrient conversion,
decrease water consumption, and improve water quality over conventional RAS systems
(Rakocy, 1988; Al-Hafedh et al., 2008; Clarkson and Lane, 1991; Takeda et al., 1997).
The impact integration has on water quality and NUE varies depending on plant and fish
species and stocking densities, along with and RAS design. Quiller et al., (1995) reported
that 60 % of applied N was recovered with 28% assimilated into plant biomass and 31%
being assimilated into fish biomass when fish production was integrated with hydroponic
tomato production. Chaves et al., (2000) compared an integrated system to both
monoculture fish system and monoculture plant system and observed 13 to 14%
reduction in nitrates and 14 to 19% reduction in PO4 when compared to an identical fish
production system without an integrated plant component. Mariscal-Largarda et al.,
(2012) reported a 97-98% reduction in water usage per kg of shrimp when comparing
with traditional monoculture systems in Mexico and a 93 to 96% reduction in water used
for tomato production.
Research with BFT or RAS indicate that some essential plant nutrients require
supplementation. Nutrient deficiency can depend on nutrient concentration in fish feed,
nutrient availability as relates to pH, and interactions with other ions in a systems. Iron
(Fe) deficiency has been attributed to high pH levels associated with RAS (Lewis et al.,
1978). McMurty et al. (1993) reported both potassium to be limiting and calcium to be
10
low in fish feed. These deficiencies are now commonly handled by managing pH with
calcium hydroxide and potassium hydroxide (Rakocy et al., 2006). Fe chelates are also
commonly used to handle Fe deficiency in plants. Managing pH below 6.8 can reduce
the need for Fe chelates as more Fe is available in solution (personal experience).
Amount of fish feed to plant area ratios are commonly used as a tool to help with
system sizing. This is usually expressed in terms of g of feed/m2/day, the area referring
to plant production area. The UVI system recommends a ratio of 100 grams of feed per
m2 of plant production. Al-Hafedh et al., (2008) reported that 56 g of fish feed/m2 was
sufficient for lettuce growth. In a system that predates the modern UVI system Rakocy
(1988) observed that 56 g of fish feed per m2 (calculated from reported 3.2 g/m3/m2.) was
sufficient for lettuce growth. In one of the earliest of aquaponics systems 84 to 91 g/m2
was calculated from Zweig’s (1986) descriptions of his system. The ratio calculated from
Zweig (1986) is similar to what Rakocy et al., (2004) reported for basil (99.6 g/m2) in the
UVI system.
Improving nutrient and water use efficiencies is also desirable for the vegetable
producer. Greater NUE in all agriculture production is advantageous as the cost of
nutrients can be influenced by availability and fuel cost. (Cordell et al., 2009: Huang,
2007; Huang 2009). Environmental concerns have also been directed toward the low
NUE of some field grown vegetable crop systems (McNeal et al., 1995; Stanley et al.,
1995). Sato et al., (2010) reported N losses of 35 to 43% but phosphorus losses were 0 to
2%. The NUE for P was calculated to be 10 to 14% efficient indicating a likely large
percentage of P became unavailable for plant uptake depending on soil type (Sato et al.,
2010).
11
Greenhouse production of vegetables utilizing hydroponic and soilless culture
techniques improves nutrient and water use efficiency over conventional open field
production. (Grewal, et al., 20011) 2005, El-Behairy 2003). Jovicich et al., (2007)
demonstrated a 33% reduction in water and a 28% reduction in N per kg of cucumber
fruit when comparing greenhouse grown to conventional field grown cucumbers.
Greenhouse vegetable growers using soilless culture commonly discharge irrigation
without recycling that nutrient laden water. This is commonly referred to as “drip to
waste”. This leachate solution is not recycled for biosecurity reasons and difficulty
related to managing nutrient concentrations in recycled solutions. Drip to waste soilless
systems may allow a 20 to 25% leaching fraction to prevent the buildup of fertilizer salts
in the media that would otherwise cause damage to the crop (Resh, 2013).
Aquaponic research has primarily revolved around the following 2 major crops:
leafy greens (Rakocy et al., 2004, Rakocy 1988; Clarkson and Lane, 1991; Chaves, et al.,
2007; Sikawa and Yakupitiyague 2010; Al-Hafedh et al., 2008) tomatoes (Lewis et al
1978; Watten and Busch 1984; McMurty et al., 1993; Mariscal-Lagarda et al., 2012)
Savidov et al., (2007) evaluated 24 different plant species grown in aquaponic system,
demonstrating the variety of crops that can be gown aquaponically.
Most aquaponic systems research has focused on system designs that cater to fish
production. In many cases this could be considered “reinventing the wheel” and ignores
the principles of greenhouse production such as: maximizing space utilization,
maximizing yield per area, and produce crops where the net profit justifies growing the
crop. The greenhouse vegetable industry has already developed a system for vine crop
culture that maximizes plant densities and yields.
12
There are several synergistic advantages formed when fish and plant systems are
integrated. One of the most popular claims is a reduction in the cost of fertilizer, but
however limited work demonstrating whether this reduction has any economic
significance has not been conducted. Most aquaponic systems and related research
involves the production of leafy greens. This purpose of this research is to utilize and
integrate already existing and proven horticulture technology to grow vine crops with
existing RAS systems and to evaluate economic impact associated with the proposed
integration.
13
References Alder, P.R., S.T. Summerfelt, D.M. Glenn, and F. Takeda, F. 1996. Evaluation of
wetland system designed to meet stringent phosphorus discharge requirements. Water Environmental Research 68: 836-840.
Al-Hafedh, Y.S., A. Alam, and M.S. Beltagi. 2008. Food production and water conservation in a recirculating aquaponic system in Saudi Arabia at different ratios and fish feed and plants. J. World Aquaculture Soc. 39: 510-520.
Avnimelech, Y. 2006. Bio-filters: the need for a new comprehensive approach. Aquac.
Eng. 34 (3), 172-178. Azim, M.E., and D.C. Little. 2008. The Biofloc technology (BFT) in indoor tanks: Water
quality, biolfoc composition and growth and welfare of Nile tilapia (Oreochromis niloticus). Aquaculture 283: 29-35.
Boyd, C.E., 2003. Guidelines for aquaculture effluent management at the farm level. Aquaculture 226:101-112.
Boyd, C.E., 2005. Water use in aquaculture. World Aquaculture 70: 12-15. Boyd, C.E., and C.S. Tucker. 1998. Pond Aquaculture Water Quality Management.
Kluwer Academic Publishers, Boston MA. 700. Boyd, C.E., C. Tucker, A. McNevin, K. Bostick, and J. Clay. 2007. Indicators of resource
use efficiency and environmental performance in fish and crustacean aquaculture. Reviews in Fisheries Science 15: 327-360
Environmental impact of aquaculture and countermeasures to aquaculture pollution in China. Env Sci Pollut-Res 14: 452-462.
Castro, R.S., C.M.S.B Azevedo, and F. Bezerra-Neto. 2006. Increasing cherry tomato
yield using fish effluent as irrigation water in Northeast Brazil. Scientia Horticulturae 110: 44-50.
Chaves, P.A., J. Beltrao, L.M. Laird and R. Sutherland. 2000. Lettuce (Lactuca sativa
sp.) response to fish culture effluent. Acta Hort. 537: 705-708.
Clarkson, R. and S.D. Lane. 1991. Use of a small-scale nutrient-film hydroponic technique to reduce mineral accumulation in aquarium water. Aquaculture and Fisheries Management 22: 37-45.
Colt, J. 2006. Water quality requirements for reuse systems. Aquaculture Engineering 34:
143-156.
14
Cordell, D., J. Drangert, and S. White. 2009. The story of phosphorus: Global food
security and food for thought. Global Environment Change 19: 292-305. Danaher, J.J., J.M. Pickens, J.L. Sibley, J.A. Chappell, T.R. Hanson, and C.E. Boyd.
2013. Petunia growth response to container substrate amended with dewatered aquaculture effluent. HortTechnology 23: 57-63.
Danaher, J.J., J.M. Pickens, J.L. Sibley, J.A. Chappell, T.R. Hanson, and C.E. Boyd.
2014. Growth of Tomato Seedlings in commercial substrate amended with dewatered aquaculture effluent. International J. of Veg. Sci.20: 340-353.
Davidson, J., C. Good, C. Welsh, and S.T. Summerfelt. 2014. Comparing the effects of
high vs low nitrate on the health performance, and welfare of juvenile rainbow trout Onchorhynchus mykiss within water recirculating aquaculture systems. Aquaculture Engineering 59: 30-40.
De Schryver, P., R. Crab, T. Defoirdt, N. Boon, and W. Verstraete. 2008. The basics of
bio-flocs technology: The added value for aquaculture. Aquaculture 277, 125-137. Ebeling, J.M., M.B. Timmons, and J.J. Bisogni. 2006. Engineering analysis of the
stoichiometry of photoautotrophic, autotrophic, and heterotrophic removal of ammonia-nitrogen in aquaculture systems. Aquaculture 257: 346-358.
El-Behairy, U.A. 2003. The effect of heating air or nutrient solution on productivity and
fruit quality of cantaloupe grown in winter by using nutrient film technique (NFT) in comparison with soil cultivation. Acta Hort. 614: 655-661.
Farmaki, E.G., N.S. Thomaidis, I.N. Pasias, C. Baulard, L. Papaharisis, and C.E.
Efstathiou. 2014. Environmental impact of intensive aquaculture: Investigation on the accumulation of metals and nutrients in marine sediments of Greece. Science of the Total Environment 486: 554-562.
FAO. 2009. Impact of rising feed ingredient prices on aquafeeds and aquaculture
production. FAO Fisheries Department, Food and Agriculture Organization of the United Nations, Publishing Management Services, Rome, Italy.
FAO. 2012. The State of the world fisheries and aquaculture. FAO Fisheries
Department, Food and Agriculture Organization of the United Nations, Publishing Management Services, Rome, Italy
Grewal, H.S., B. Maheshwari, and S.E. Parks. 2011. Water and nutrient use efficiency of
low-cost hydroponic greenhouse for a cucumber crop: An Australian case study. Agricultural Water Management 98: 841-846.
Gross, A., C.E. Boyd, and C.W. Wood. 2000. Nitrogen transformations and balance in
15
channel catfish ponds. Aquaculture Engineering 24: 1-14. Heinen, J.M., J.A. Hankins, and P.R. Adler. 1996. Water quality and waste production in
a recirculating trout-culture system with feeding of a higher-energy or a lower-energy diet. Aquaculture Research 27: 699-710.
Herbeck, L.S., M. Sollich, D. Unger, M. Homer, and T.C. Jennerjahn. 2014. Impact of pond aquaculture effluents on seagrass performance in Hainan, tropical China. Marine Pollution Bulletin 85: 190-203. Huang, W. 2007. Impact of rising natural gas prices on U.S. ammonia supply. USDA
WRS-0720. Retrieved 14 June 2013. http://www.ers.usda.gov/media/198815/wrs0702_1_.pdf
Huang, W. 2009. Factors contributing to the recent increase in U.S. fertilizer prices, 2002-08. USDA AR- 33. Retrieved 14 June 2013. http://www.ers.usda.gov/publications/ar-agricultural-resources-situation-and-outlook/ar-33.aspx
Jensen, H.H. 2006. Changes in seafood consumer preferences patterns and associated
changes in risk exposure. Marine Pollution Bulletin 53: 591-598. Jovicich, E., and D.J. Cantliffe, E.H. Simmonne, and P.J. Stoffella. 2007. Comparative
water and fertilizer use efficiencies of two production systems for cucumbers. Acta Hort. 731: 235-241.
Kharas, H., 2010. The emerging middle class in developing countries. OECD
Development Centre No. 285. Lee, P.G., R.N. Lea, E. dohmann, W. Prebilsky, P.E. Turk, H. Ying, and J.L. Whitson.
2000. Denitrification in aquaculture systems: an example of a fuzzy logic control problem. Aquacultural Engineering 23: 37-59.
Lasordo, T.M., M.P. Masser, and J. Rakocy. 1998.Recirculating aquaculture tank
production systems, An overview of critical considerations, SRAC Publication NO. 451
Lewis, W.M., J.H. Yopp, H.L. Schramm, A.M. Brandenburg. 1978. Use of hydroponics
to maintain quality recirculated water in a fish culture system. Transactions of the American Fisheries Society 107: 92-99.
Mariscal-Lagarda, M.M., F. Paez-Osuna, J.L. Esquer-Mendez, I. Guerrero-Monroy,
A. Roma del Vivar, and R. Felix-Gastelum. 2012. Integrated culture of white shrimp (Litopenaeus vannamei) and tomato (Lycopersicon esculentum Mill) with low salinity groundwater: Management and production. Aquaculture 366-367: 76-84.
Masser, M.P., J. Rakocy, and T.M. Lasordo. 1999. Recirculating aquaculture tank
production systems, management of recirculating systems. SRAC Pub No. 452. McMurty, M.R., D.C. Sanders, P.V. Nelson, and A. Nash. 1993. Mineral nutrient
concentration and uptake by tomato irrigated with recirculating aquaculture water influenced by quantity of fish waste products supplied. Journal of Plant Nutrition 16: 407-419.
McNeal, B.L., C.D. Stanley, W.D. Graham, P.R. Gilreath, D. Downey, and J.F.
Creighton. 1995. Nutrient-Loss Trends for Vegetable and Citrus Fields in West-Central Florida: I. Nitrate. J. Environ. Qual. 24:95-100
Naylor, S.J., R.D. Moccia, and G.M. Durant. 1999. The chemical composition of
settleable solid fish waste (manure) from commercial rainbow trout farms in Ontario, Canada. North American J. of Aquaculture 61: 21-26.
Naylor, R.L., R.J. Goldburg, J.H. Primavera, N. Kautsky, M.C.M.Beveridge, J. Clay,
C. Folke, J. Lubcheno, H. Mooney, and M. Troell. 2000. Effect of aquaculture on world fish supplies. Nature 405: 1017-1024.
Pierce, R.H., J.M. Weeks, and J.M. 1993. Nitrate toxicity to five species of marine
fish. J. of the World Aquaculture Society 24: 105-107. Quillere, I., L. Roux, D. Marie, Y. Roux, F. Gosse, and J.F. Morot-Gaudry. 1995. An
artificial productive ecosystem based on a fish/bacteria/plant association. 2. Performance. Agriculture, Ecosystems, and Environment 53: 19-30.
Rakocy J. E. 1988. Hydroponic lettuce production in a recirculating fish culture system.
Island Perspectives. UVI. AES 5-10. Rakocy, J.E., R.C. Shultz, D.S. Bailey, and E.S. Thoman. 2004. Aquaponic production
of tilapia and basil: Comparing a batch and staggered cropping system. Acta Hort 2004: 63-69.
Rakocy, J.E., M.P. Masser, and T.M. Lasordo. 2006. Recirculating Aquaculture Tank
Production Systems: Aquaponics-Integrating Fish and Plant Culture. Southern Regional Aquaculture Center. Publication No. 454.
Rakocy, J.E., and D.S. Bailey, R.C. Shultz, and J.J. Danaher. 2007. Preliminary
evaluation of organic waste from two aquaculture systems as a source of inorganic nutrients for hydroponics. Acta Hort 742: 201-207.
Rafiee, G. and C.R. Saad, 2005. Nutrient cycle and sludge production during different
stages of red tilapia (Oreochromis sp.) growth in a recirculating aquaculture system. Aquaculture 244, 109-118.
Salazar, F.J., and R.C. Saldana. 2007. Characterization of manures from fish cage
farming in Chile. Bioresource Technology 98: 3322-3327. Sato, S., K.T. Morgan, M. Ozores-Hampton, K. Mahmoud, and E.H. Simonne. 2010.
Nutrient balance and use efficiency in ssandy soils cropped with tomato under seepage irrigation. Soil Sci. Soc. Am. J. 76: 1867-1876.
Savidov, N.A., E. Hutchings, and J.E. Rakocy, J.E. 2007. Fish and plant production in a
recirculating aquaponic system: a new approach to sustainable agriculture in Canada. Acta Hort 742: 209-221.
Schneider, O., A.K. Amirkolaie, J. Vera-Cartas, E.H. Eding, J.W. Schrama, and J.A.J.
Verreth. 2004. Digestibility, faeces recovery, and related carbon, nitrogen and phosphorus balances of five feed ingredients evaluated as fishmeal alternatives in Nile tilapia, Oreochromis niloticus L. Aquaculture Research 35: 1370-1379.
Sharma, B., and R.C. Ahlert. 1977. Nitrification and nitrogen removal. Water Research
11: 897-925. Sleeper, A.M., J.A.Chappell, J.M. Pickens, W.G. Foshee, III, and J.L. Sibley. 2009.
Integration of intensive aquaculture and greenhouse crop production. Proc. SNA Res. Conf. 54:106-110.
Stanley, C.D., B.L. McNeal, P.R. Gilreath, J.F. Creighton, W.D. Graham, and G. Alverio.
1995. J. Environ. Qual. 24: 101-106. Summerfelt, S.T. P.R. Adler, D.M. Glenn, and R.N. Kretschmann. 1999. Aquaculture
sludge removal and stabilization within created wetlands. Aquacultural Engineering 19: 81-92.
Takeda F., P.R. Adler, and D.M. Glenn. 1997. Strawberry production linked to
Publishing Company LLC, Ithaca, NY. 788. Van Rijn, J., T. Tal, and H.J. Schreier, 2006. Denitrification in recirculating systems:
Theory and applications. Aquaculture Engineering. 34: 364-376 Van Weerd, J.H., Khalaf, K.A., Aartesen, F.J., Tijssen, P.A.T., 1999. Balance trials with
Watten, B.J., and R.L. Busch. 1984. Tropical production of Tilapia (Saratherodon aurea) and Tomatoes (Lycopersicon esculentum) in a small-scale recirculating water system. Aquaculture 41: 271-283.
Zweig, R.D., 1986. An integrated fish culture hydroponic vegetable production system. Aquaculture Magazine 34-39.
19
Chapter II
Integrating Beit Alpha Cucumber Production with Biofloc Tilapia Production
Abstract
In the summer of 2012, cucumbers grown with effluent from a 100 m3 biofloc systems
and compared to cucumbers grown with a commercial hydroponic fertilizer. Plants were
grown conventionally in a soilless hydroponic system utilizing standard drip irrigation
equipment for 44 days. Plants receiving effluent yielded 28% less fruit than those
receiving the commercial fertilizer. Tissue analysis of shoot and fruit tissue suggested
phosphorus as being a deficient nutrient in plants receiving AE. Results from this study
indicate that despite the high concentrations of solids suspended in the water column,
integration with conventional soilless hydroponic systems with biofloc tilapia production
is feasible.
1.0 Introduction
Feed cost can account for over 50% of production cost in an aquaculture system
(FAO 2009), consequently it is important to recover as much cost as possible through
feed conversion into sellable products. Fish are among the most efficient cultured
animals in regards to feed conversion but there is still a considerable amount of wasted
nutrients associated with fish production (Heinen et al., 1996; Rhaphie and Saad, 2005).
Recirculating aquaculture systems (RAS) are highly efficient in improving water and
20
space use efficiency but traditional RAS systems do little to improve the nutrient use
efficiency of the system (NUE).
Biofloc Technology (BFT), is a form of RAS that does not use a traditional
biofilters. BFT relies on the constant mixing of suspended solids in the water column.
Solids in suspension in BFT culture water provide surface area for both heterotrophic and
autotrophic bacteria growth. Most BFT are operated where nitrogenous waste is
primarily handled through mineralization utilizing heterotrophic bacteria. Nitrogenous
waste (primarily Ammonia) is assimilated into microbial protein, converting the N into a
non-toxic form (Schryver et al., 2008; Avnimelech 2006). This management technique
can be enhanced by increasing the C:N ratio by supplamenting highly available carbon
sources or by lowering the percent protein in feed (Avenemilich, 1999; Azim and Little,
2008). BFT has been shown to improve feed conversion ratio (FCR) over clear water
systems thereby improving the nutrient use efficiency of the system (Azim and Little
2008). BFT systems contain high degrees of settable solids that include microbial flocs,
uneaten feed and fecal waste.
Hydroponic vegetable production has been shown to lend itself well with
integration into RAS improving NUE. The integration of RAS with hydroponic
vegetable production is commonly referred to as aquaponics (Rakocy 2006). Aquaponic
systems have been shown to improve NUE, decrease water consumption and improve
water quality over conventional RAS systems (Rakocy 1988; Al-Hafedh et al., 2008;
Clarkson and Lane 1991; Takeda et al., 1997)). Quillere et al (1995) reported that 60 %
of applied nitrogen was recovered with 28% being assimilated into plant biomass and
21
31% being assimilated into fish biomass when fish production was integrated with
hydroponic tomato production.
Aquaponic research has primarily revolved around the following 2 major crops:
leafy greens (Rakocy et al, 2004, Rakocy 1988; Clarkson and Lane 1991; Chavez, et al.,
2007; Al-Hafedh et al., 2008) and tomatoes (Lewis et al 1978; Watten and Busch 1984;
McMurty et al., 1993; Mariscal-Largardah et al 2012; Castro et al., 2006). Savidov et al.,
(2007) evaluated 24 different plant species grown in an aquaponic system, demonstrating
the variety of crops that can be gown aquaponically.
Little research has focused on integrating soilless plant production systems that
utilize conventional soilless growing systems common in the greenhouse vegetable
industy. Soilless systems utilize growing substrates that are highly porous and have a low
water holding capacity. This allows growers to manipulate the nutrients in the root zone
with frequent irrigation with drip irrigation. Little research has been conducted on
integrating soiless hydroponic systems with fish production. Which has often been
attributed to problems with drip irrigation and substrate clogging from solid fish waste.
High concentrations of settable solids associated with BFT have also limited integrated
research on BFT systems. The purpose of this research is to investigate the integration of
BFT aquaculture effluent (AE) with greenhouse cucumber production using soilless plant
production using soilless hydroponic systems.
2.0 Materials and Methods
2.1 Facility
22
The facilities used in this study consisted of two commercial size greenhouses, located at
the E.W. Shell Fisheries Center, North Auburn Unit, approximately 10 km north of
Auburn, Alabama, USA. The fish culture system was housed in a 267.6 m2 double
polyethylene covered greenhouse (9.1 m x 29.2 m) with an east to west orientation
consisting of two rectangular tanks (1.2 m x 3.7m x 26.8 m) each with a volume capacity
of 125 m3 and an average volume of 100 m3. These systems were operated as a BFT
system but without supplemental carbon (Avnimelech 2006). A 1.9 m3 cone bottomed
clarifier (30% slope) adjacent to the greenhouse was used to reduce the concentration of
suspended solids from the system. Water flowed through the clarifier at an approximate
flow rate of 18.9 l/min. and then entered a 1.1 m3 cone bottomed sump used for irrigation
(irrigation sump) before re-entering the fish production tank. Both vessels had an
uninterrupted and constant flow of water driven by air lift pumps. Both the clarifier and
irrigation sump were flushed of collected solids twice daily.
The plant greenhouse was also a covered, double layered polyethylene sheeting
and was a 267.6 m2 greenhouse (9.1 m x 29.2 m) with a north to south orientation. The
plant greenhouse was outfitted for soilless vine crop production with a cable trellis
system running the length of the greenhouse. This trellis consisted of steel cables
suspended approximately 2.1 meters above the greenhouse floor. Two cables were
suspended above each row approximately 0.1 meters from the row center. Each row was
1.5 meters apart and plant growing containers were spaced 40.6 cm apart within the row.
Both greenhouses were equipped with environmental controls for year round production.
23
2.2 Fish production
For the purpose of this experiment only one tank in the fish greenhouse was utilized. The
tank was stocked with 4000 Nile tilapia (Oreochromis niloticus) (138 grams/fish) at a
stocking density of 40 fish/m3. The fish were fed a 36% protein floating feed at 1-3%
body weight/day. Tilapia were fed ad libitum with a 36% protein extruded diet (Cargill®
, Franklinton, LA) twice daily (0830 and 1600 hr.) for approximately twenty minutes.
Calcium-hydroxide [Ca(OH)2] was applied after each feeding to maintain a targeted pH
of 6.8 to 7.0 (Rakocy et al., 2006). This experiment was initiated on June 19 when fish
biomass was estimated to be 16.14 kg/m3 and average daily feed input was approximately
18 kg per day. Dissolved oxygen and temperature of fish culturing water were recorded
twice daily (YSI 550A, YSI Inc., Yellow Springs, OH.
2.3 Plant Production and Experiment Design
Two evaluate yields of cucumbers grown with AE, a conventional hydroponic
fertilizer was used as a control. On June 19, 2012 two week old cucumbers plants, Beit
Alpha cucumber type, were transplanted into 11 liter, Bato Pots (Bato Plastics B.V.
Zevenbergon, The Netherlands) filled with commercial grade perlite. The variety
‘Manar’ was selected based on the varieties powdery mildew resistance (Hochmuth et al.,
2004) Beit Alpha cucumbers are a relatively new greenhouse crop in the U.S. Because it
is parthenocarpic, no supplemental pollination was required. The planting density was
calculated to be 1.6 plants/m3. There were two treatments, AE and a commercially
available hydroponic fertilizer. Plants receiving the fertilizer treatment were grown with
30 mg/l N Total Grow 3-13-29, (STD Industries Inc. Winnsboro, Louisiana) and 150
24
mg/l N calcium nitrate 15.5-0-0 providing a total nitrogen concentration of 180 mg/l N
(Shaw and Cantliffe 2009). Both fertilizers were injected separately using fertilizer
injectors (Model DM11 Dosatron USA. Clearwater Florida). The fish effluent was
pumped from the irrigation sump adjacent to the fish greenhouse. Both treatments were
delivered through drip irrigation and pressure compensated emitters at a flow rate of
3.785 l/hour. The plants were arranged in a completely randomized design with 75
replications per treatment. Plants were grown for 43 days. Harvest began on 22 days
after transplanting (DAT) and continued daily until termination of the study.
2.4 Irrigation
This experiment consisted of two treatments, AE and a commercially available
hydroponic fertilizer. The irrigation sump was used to access clarified water for drip
irrigation system for soilless culture of cucumbers in the adjacent greenhouse. A 1.5
horse power irrigation pump was used to deliver the pressurized water at 30 psi. Pressure
was regulated by bleeding excess pressure back into the irrigation sump. Both treatments,
AE and conventional fertilizer, were delivered to appropriate plants through standard drip
irrigation equipment used in soilless production of greenhouse vegetable crops. Both
treatments were delivered to plants using a clog resistant pressure compensated emitter
(Bowsmith Non-Stop Emitter, Bowsmith Inc. Exeter California.) at a flow rate of 3.785
l/hour. Plants grown with AE received water directly from the irrigation sump. Fertilizer
was delivered to plants grown conventionally through two fertilizer injectors that allowed
separate but simultaneous injection of the hydroponic fertilizer blend and calcium nitrate.
The solenoid valves responsible for delivering the respective treatments were wired in
25
tangent so both treatments were applied at the same time. Previous studies had shown
potassium to be limiting (data not shown) and potassium supplementation has been found
to be necessary in aquaponic systems (McMurty et al., 1993; Rakocy et al., 2006).
Potassium was supplemented once at 110 mg/L using potassium chloride. This also
provided 100 mg/l of chloride for nitrate management, concerning fish.
3.0 Data collected and Analysis
Cucumber fruit was harvested daily at a target weight of 90 to 110 grams. Tissue
samples were taken weekly. Five replications were randomly selected for each treatment
and pruning’s, fruit and tissue samples were collected weekly from these plants for dry
weight and tissue elemental analysis. Entire plant samples were also collected at crop
termination.
3.1 Nutrient Analysis and Water Quality
Nutrient analysis was performed twice weekly where total ammonia nitrogen
(TAN), nitrate, nitrite, potassium and orthophosphate were determined. A three-liter
composite sample of the fish culture water and AE from the irrigation sump was collected
twice weekly to characterize the nutrient concentration of water being used to irrigate
cucumber plants receiving AE (Table 1). Prior to analyses each sample was filtered
through a 40-micron Whatman™ glass fiber filter (VWR International, Radnor, PA).
Standard curves were made for TAN, nitrate-nitrogen (NO3-N) , potassium (K) and
orthophosphate on a GENESYS 20 visible spectrophotometer (Spectronic Unicam,
Rochester, NY). TAN was determined with the Nessler Method 8038 (Hach Company,
26
Loveland, CO). Orthophosphate was determined using the ascorbic acid method 8048
(Hach Company, Loveland, CO). Nitrate-nitrogen and was analyzed using the ferrous
sulfate method 8153 (Hach Company, Loveland CO). Potassium was determined using
the tretraphenylborate method 8049 (Hach Company, Loveland CO). Calcium and
magnesium were determined with titration method 8329 using ethylenediaminetetraacetic
acid (Hach Company, Loveland, CO). Total Phosphorus and Total Nitrogen were
determined through persulfate digestion (Rice et al., 2012). Digestates of nitrate and
orthophosphate were determined using spectrophotometric screening and ascorbic acid
method (Prapaiwang and Boyd 2012; Rice et al 2012; Gross and Boyd 1998)
Settable Solids were determined for water contained in the fish tank and water
returning to the tank from the irrigation sump using an adopted procedure of Standard
Method 2540 F (Rice et al, 2012). Aveliminech (2007), reported floc particles become
reanimated if left undisturbed for the 1 hour recommended in the procedure described in
Standard Method 2450, due to gas bubbles forming. For the purposes of this study, a 30
minute period was used for settling. Suspended solids were measured as according to
Standard Method 2540 D (Rice et al, 2012) using glass fiber filtration followed
gravimetric analysis. The pH of AE was taken twice daily.
3.2 Statistical Analysis
Means were analyzed using Proc Means (SAS version 9.2 SAS Institute, Cary, NC.)
Means comparisons were analyzed using Proc Ttest (SAS version 9.2 SAS Institute,
Cary, NC.) If variances were found to be equal the pooled method was used to determine
27
significance. If variances were unequal Satterthwaite method was used to determine
significance.
4.0 Results
The study was terminated on August 1, 2012 (43 DAT) due to a fish kill resulting from a
disease. Conventional crops could last over 100 days from transplanting (Jovicich et al.,
2007).
4.1 Yield
Plants receiving fish effluent yield was 3.2 kg/plant (5.1 kg/m2), and was 28% lower than
plants that received commercial fertilizer 4.5 kg/plant (7.2 kg/m2)(Table 1, Table2). The
number of fruit harvested from fish effluent grown plants (28 fruit/plant) was 28% less
than plants grown with the commercial fertilizer (39 fruit/plant) (Table 1.) Little
information is available on commercial yields of greenhouse cucumbers. Yields and
crop duration found in the literature are presented in Table 2. It is important to note that
some of these studies did not report yield as kg/plant and some in kg/area and it was
necessary to calculate yield based on given information. Yields for cucumber plants
grown with commercial fertilizer in this study were calculated to be 164 g/m2/day when
yield per area was averaged over the crop length and was comparable to other studies
when calculated in the same manner (126 to 257 g/m2/day) (Table 2).
4.2 Elemental Tissue Analysis
Elemental tissue analysis was conducted on leaves and pruned shoots at each
pruning date with the exception of 44 DAT, where the entire above ground portion of the
28
plant was harvested for elemental tissue analysis (Table 3). Nutrient analysis of shoot
and fruit tissue indicated that plants fertilized with fish effluent were significantly lower
in phosphorus throughout the study (Table 3, Table 4). Elemental tissue analysis of fruit
revealed no significance in nitrogen, potassium, calcium and magnesium but phosphorus
was 63% lower in AE grown cucumbers when compared to CF grown cucumber plants
(Table 4). Calcium concentrations in plant tissue were different at 30, 37 and 44 DAT.
At 44 DAT, calcium concentration in leaf and stem tissue for AE grown plants were 17%
higher than what was found in the control. This is likely due to high concentrations of
free calcium found in the fish effluent (418 mg/l) (Table 5). High calcium concentrations
in AE were a direct result from daily additions of calcium hydroxide to the fish culture
tanks for pH management.
Calcium, magnesium, and potassium are known to have an antagonistic
relationship in regards to plant uptake (Epstein and Bloom 2005). High calcium and
magnesium concentrations in the fish effluent could have inhibited optimum uptake of
potassium. Potassium concentrations were significantly lower in AE plants compared to
CF plants throughout the study with the exception of 30 DAT. Potassium concentrations
in the fish effluent were 31 % lower than concentrations in the hydroponic fertilizer at 43
DAT (Table 4.) High calcium concentrations and a higher than optimum pH may have
influenced the percentage of phosphorus available to the plant. Phosphorus
concentrations in plant shoot tissue were significant throughout the study. At 44 DAT
phosphorus levels were 60% lower in AE than CF grown plants. Nitrogen levels in shoot
tissue of CF grown cumbers were significantly lower when compared to AE at 37 and 44
DAT. AE nitrate nitrogen concentration averaged 400 ± 62 mg/l NO3-N and were 56%
analysis of fruit from both plants grown with AE and CF revealed no significance in
nitrogen, potassium, calcium and magnesium but phosphorus was 63% lower in AE
grown cucumbers when compared to CF grown cucumber plants (Table 5).
The clarifier was effective in reducing both total suspended solids and settable
solids (Table 6). Solids were seen accumulating in perlite receiving AE but little
problems with irrigation and media clogging were observed.
5.0 Discussion
This experiment revolved around the use of a BioFloc production system that was
managed with minimum water exchange. Concentrations of nutrient levels were
significantly more than would be allowed in conventional production systems. Total
phosphorus in AE was 33 mg/l and available phosphorus concentrations in AE was 3.3
mg/l P2O4 (Table 6). A greater percentage of phosphorus has been shown to be lost to
solid waste rather than Bronchial-urinary waste (Van Weerd et al., 1999). Settable solids
in the fish culture water were reduced by 60% when exiting the clarifier and Total
Phosphorus was reduced by 27% (Table 6). Calcium hydroxide applications could have
also significantly reduced orthophosphate as it would temporarily significantly increase
pH (> 8.0) in portions of the tank before it could be mixed thoroughly into the water
column. High calcium concentrations coupled with high pH can favor the formation of
hydroxyapatite (Boyd, 2000). Most soilless growing systems utilize a nutrient solution
pH of 5.8 to 6.5 (Jones, 2005).
30
Aquaculture effluent solution contained 95% less phosphorus than the
commercial fertilizer solution. This correlates to what was found in shoot and fruit tissue.
Fish effluent orthophosphate concentrations would be considered too low for most
hydroponic crops but plants may have been able to utilize other phosphorus sources
through active uptake that may have accumulated in the plant substrate (Epstein and
Bloom, 2005). Increased irrigation frequency has also been shown to improve uptake of
P in solutions of low concentrations. This has been demonstrated in bell pepper (Silber et
al., 2005) and lettuce (Silber et al., 2003; Xu et al., 2003). Increasing irrigation frequency
in plants grown with AE could alleviate some deficiencies in AE but substrate porosity
would need to be increased to prevent root rot and other conditions associated with water
logged containers.
AE pH averaged 6.7 over the 44 days of the experiment (Table5). Lowering pH
may be key to improving the availability of phosphorus and other nutrients while also
providing a more favorable pH for the plant growth. Because most RAS depend heavily
on nitrifying bacteria, lowering pH may provide less than optimum conditions for
biofiltration of fish waste. Nitrifying bacteria are efficient at a variety of pH levels that
range from 7.0 to 9.0 (Boyd and Tucker 1998; Chin et al 2005). Villaverde et al (1996)
reported the most efficient pH to be 8.0 taking into account the pH needs for nitrosomas
and nitrobacter. Most integrated systems utilize large volumes of water and revolve
around principles associated with a closed system. Manipulating water pH in closed
aquaponics systems utilizing raft technology to accommodate the plant component is cost
prohibitive due to the large volume of water that would need to be treated. The system
31
designed and used for this experiment utilizes micro-irrigation and requires small
volumes of water for the plant component.
We estimated that the daily volume of AE used in one greenhouse of cucumber
production would be less than 2% of the tank volume. Because such a small volume of
water is being applied to the plants, acid can be injected into the irrigation system
lowering the pH and possible allowing more phosphorus and iron to become available.
The practice of injecting acid into irrigation water is already used by greenhouse growers
in both greenhouse vegetable production and the floriculture industry where irrigation
water may have high concentrations of alkalinity (Whipker et al., 1996; Bailey and
Bilderback 1997). This technology is inexpensive and could also be used to supplement
nutrients typically limiting in integrated fish and plant systems such as potassium,
calcium, and iron, (Rakocy et al., 2006).
The argument has been made that closing this system while utilizing the technique
of acid injection would affect pH of the fish culture system. Maintaining a 20 to 25%
leaching fraction is common practice among greenhouse vegetable producers using media
based production (Resh, 2013). Closing this system and returning pH manipulated AE
leached from one greenhouse would have significantly less of an effect on fish tank pH
than that of the makeup water used to refill the tank after irrigation events.
6.0 Conclusion
Results from this study suggest that while conventional yields were achieved, drip
irrigated biofloc tilapia with greenhouse cucumber is a viable option. The solid separation
and irrigation system used in this study was effective in delivering AE in the same
32
manner this crop would be grown conventionally. The clarifier was effective in reducing
both total suspended solids and settable solids (Table 6). Solids were seen accumulating
in perlite receiving AE but little problems with irrigation and media clogging was
observed. Future work should include nutrient supplementation and pH manipulation of
both the fish culture unit and the plant production unit.
33
References
Al-Hafedh, Y.S., A. Alam, and M.S. Beltagi. 2008. Food production and water conservation in a recirculating aquaponic system in Saudi Arabia at different ratios and fish feed and plants. J. World Aquaculture Soc. 39: 510-520.
Avnimelech, Y. 1999. Carbon/nitrogen ratio as a control element in aquaculture systems. Aquaculture, 176: 227-235.
Avnimelech, Y. 2006. Bio-filters: the need for a new comprehensive approach. Aquac. Eng. 34: 172-178.
Avnimelech, Y. 2007. Feeding with microbial flocs by tilapia in minimal discharge bio-flocs technology ponds. Aquaculture 264: 140-147.
Azim, M.E., and D.C. Little. 2008. The Biofloc technology (BFT) in indoor tanks: Water
quality, biolfoc composition and growth and welfare of Nile tilapia (Oreochromis niloticus). Aquaculture 283: 29-35.
Bailey, D.A., and T. Bilderback. 1997. Alkalinkty control for irrigation water used in nurseries and greenhouses. NC State University Hort. Info. Lflt. #558.
Boyd, C.E. 2000. Water quality an introduction. Kluwer Academic Publishers, Boston MA. 330.
Boyd, C.E., and C.S. Tucker, C.S. 1998. Pond aquaculture water quality management. Kluwer Academic Publishers, Boston MA. 700.
Bumgarner, N. 2014. Cucumber production- An overview of OH numbers in 2013-2014.
Cropking http://cropking.blogspot.com/2014/10/cucumber-production-overview-of-oh.html last accessed June 8, 2015.
Castro, R.S., C.M.S.B Azevedo, and F. Bezerra-Neto. 2006. Increasing cherry tomato
yield using fish effluent as irrigation water in Northeast Brazil. Scientia Horticulturae 110: 44-50.
response to fish culture effluent. Acta Hort. 537: 705-708.
Chen, S.L., J. Ling, and J.P. Blancheton. 2006. Nitrification kinetics of biofilm as affected by water factors. Aquaculture. Eng., 34: 179–197.
Clarkson, R., and S.D. Lane. 1991. Use of a small-scale nutrient-film hydroponic technique to reduce mineral accumulation in aquarium water. Aquaculture and Fisheries Management 22: 37-45.
De Schryver, P., R. Crab, T. Defoirdt, N. Boon, and W. Verstraete. 2008. The basics
of bio-flocs technology: The added value for aquaculture. Aquaculture 277: 125-137.
Epstein, E., Bloom, A.J. 2005. Mineral Nutrition of Plants: Principles and Perspectives.
Sinauer Associates, Inc. Sunderland, MA. FAO. 2009. Impact of rising feed ingredient prices on aquafeeds and aquaculture
production. FAO Fisheries Department, Food and Agriculture Organization of the United Nations, Publishing Management Services, Rome, Italy.
Gross, A., and C.E. Boyd. 1998. A digestion procedure for simultaneous determination of
total nitrogen and total phosphorus in pond water. Journal of World Aquaculture Society, 29: 300-303
Gul, A., F. Kidoglu, and D. Anac. 2007. Effect of nutrient sources on cucumber
production in different substrates. Scientia Horticulturae 113: 216-220. Heinen, J.M., J.A. Hankins, and P.R. Adler. 1996. Water quality and waste production in
a recirculating trout-culture system with feeding of a higher-energy or a lower-energy diet. Aquaculture Research 27: 699-710.
greenhouse Beit-Alpha cucumber varieties and two growing systems. Acta Hort. 659: 461-466.
Jones, J.B. 2005. Hydroponics: a practical guide for the soilless grower. 2nd ed. CRC
Press. Boca Raton, Florida. 423. Jovicich, E. Cantliffe, D.J., Simonne, E.H., and P.J. Stoffella. 2007. Comparative water
and fertilizer use efficiencies of two production systems for cucumbers. Acta Hort. 731: 235-241.
Lewis, W.M., Yopp, J.H., Schramm, H.L., Brandenburg, A.M. 1978. Use of hydroponics
to maintain quality recirculated water in a fish culture system. Transactions of the American Fisheries Society 107: 92-99.
Mariscal-Lagarda, M.M., F. Paez-Osuna, J.L. Esquer-Mendez, I. Guerrero-Monroy,
A. Roma del Vivar, and R. Felix-Gastelum. 2012. Integrated culture of white shrimp (Litopenaeus vannamei) and tomato (Lycopersicon esculentum Mill) with low salinity groundwater: Management and production. Aquaculture 366-367: 76-84.
McMurty, M.R., D.C. Sanders, P.V. Nelson, and A. Nash. 1993. Mineral nutrient
concentration and uptake by tomato irrigated with recirculating aquaculture water influenced by quantity of fish waste products supplied. Journal of Plant Nutrition 16: 407-419.
35
Prapaiwong, N., and C.E. Boyd. 2012. Effluent volume and pollutant loads at an inland,
low-salinity, shrimp farm in Alabama. Aquaculture Engineering 48: 1-5.
Quillere, I., L. Roux, D. Marie, Y. Roux, F. Gosse, and J.F. Morot-Gaudry. 1995. An artificial productive ecosystem based on a fish/bacteria/plant association. 2. Performance. Agriculture, Ecosystems, and Environment 53: 19-30.
Rafiee, G., and C.R. Saad. 2005. Nutrient cycle and sludge production during different
stages of red tilapia (Oreochromis sp.) growth in a recirculating aquaculture system. Aquaculture 244: 109-118.
Rakocy J. E. 1988. Hydroponic lettuce production in a recirculating fish culture system.
Island Perspectives. UVI. AES 5-10.
Rakocy, J.E., and D.S. Bailey, R.C. Shultz, and J.J. Danaher. 2007. Preliminary evaluation of organic waste from two aquaculture systems as a source of inorganic nutrients for hydroponics. Acta Hort 742: 201-207.
Rakocy, J.E., M. P. Masser, and T.M. Losordo. 2006. Recirculating Aquaculture Tank Production Systems: Aquaponics-Integrating Fish and Plant Culture. Southern Regional Aquaculture Center. Publication No. 454.
Rice, E.W., R.B. Baird, A.D. Eaton,and L.S. Clesci (Eds). 2012. Standard methods for examination of waer and wastewater, 22nd edition. American Water Works Assn., Washington D.C.
Savidov, N.A., E. Hutchings, and J.E. Rakocy, J.E. 2007. Fish and plant production in a recirculating aquaponic system: a new approach to sustainable agriculture in Canada. Acta Hort 742: 209-221.
Shaw, N.J., and D.J. Cantliffe, J. Funes, and C. Shine. 2004. Successful Beit Alpha
production in the greenhouse using pine bark as an alternative substrate. HortTechnology 14: 289-294.
Shaw. N.L. and D.J. Cantliffe. 2009. Beit Alpha Cucumber: A new greenhouse crop for
Florida. University of Florida, Institute of Food and Agriculture Sciences. Bulletin HS810.
Silber, A., G. Xu, I. Levkovitch, S. Soriano, A. Bilu, and R. Wallach. 2003. High fertigation frequency: the effects of nutrients, water and plant growth. Plant and Soil 253: 467-477.
Silber, A., M. Bruner, E. Kenig, G. Reshef, H. Zohar, I. Posalski, H. Yehezkel, D.
Shmuel, S. Cohen, M. Dinar, E. Matan, I. Dinkin, Y. Cohen, L. Karni, B. Aloni, and A. Assouline. 2005. High fertigation and phosphorus level: Effects on
36
summer-grown bel pepper growth and blossom-end rot incidence. Plant and Soil 270: 130-146.
Xu, G., I. Levkovitch, S. Soriana, R. Wallach, A. Silber. 2004. Integrated effect of irrigation frequency and phosphorus level on lettuce: P uptake, root growth and yield. Plant and Soil 263:297-309.
Takeda F., P.R. Adler, and D.M. Glenn. 1997. Strawberry production linked to
aquaculture wastewater treatment. Acta Hort 439: 637-677. Tyson, R.V., E.H. Simonne, D.D. Treadwell, M. Davis, and J.M. White. 2008. Effect of
water pH on yield and nutritional status of greenhouse cucumber grown in recirculating hydroponics. Journal of Plant Nutrition 31: 2018-2030.
Villaverde, S., P.A. Garcia-Encina, and F. Fdz-Polanco. 1997. Influence of pH over
nitrifying biofilm activity in submerged biofilters, Water Research 31: 1180-1186. Whipker, B.E., D.A. Bailey, P.V. Nelson, W.C. Fonteno, and P.A. Hammer, P.A. 1996.
A novel approach to calculate acid additions for alkalinity control in greenhouse irrigation water, Communication in Soil Science and Plant Analysis 27: 959-976.
37
Treatment Fruit CountZ Wet Weight (kg)Y Dry MatterX Dry Weight(kg)W
Aqua. Effluent 28 3.2 3.7% 0.12Conv. Fertilizer 39 4.5 3.4% 0.15SignificanceV *** *** N/A N/AZ Average fruit count over 44 days of production, N= 68 plants.YAverage fruit weight over 44 days of production N = 68 plants.XPercent dry matter of fruit, N= 10 plants.
Table 1. Yield of Beit Alpha cucumbers 'Manar' grown with aquaculture effluent or conventional fertilizer.
W Dry weight of fruit was calculated by taking Wet weight and multiplying it by the percent dry matter. XMeans were analyzed using Proc Ttest(SAS Version 9.2 SAS Institute, Cary, NC). If variances were found to be equal the Pooled method was used to determine significance. If variances were unequal Satterthwaite method was used to determine significance. P ≤ 0.05 (*), 0.01 (**), 0.001 (***); NS = nonsignificant.
38
Table 2. Greenhouse cucumber yields found in literature.
SourceShaw et al 2004 4 114 6 20.0 0.05 175Jovicich et al., 2007 3 105 9 27.0 0.09 257Bumgarner 2015, 1.4 119 11 15.0 0.09 126
Mean 113 8.7 20.7 0.08 183This study AEZ 1.6 44 3.2 5.1 0.07 116
ZDAT = Days after transplantYPercentages equal percent of nutrient found in tissue
Table 3. Shoot nutrient analysis of Beit Alpha cucumber 'Manar' grown with aquaculture effluent or conventional fertilizer.
XMeans were analyzed using Proc Ttest(SAS Version 9.2 SAS Institute, Cary, NC). If variances were found to be equal the Pooled method was used to determine significance. If variances were unequal Satterthwaite method was used to determine significance. P ≤ 0.05 (*), 0.01 (**), 0.001 (***); NS = nonsignificant.
Table 4. Fruit nutrient analysis of Beit Alpha cucumber 'Manar' grown aquacutlure effluent or commercial fertilizer.
YMeans were analyzed using Proc Ttest (SAS Version 9.2 SAS Institute, Cary, NC). If variances were found to be equal the Pooled method was used to determine significance. If variances were unequal Satterthwaite method was used to determine significance. P ≤ 0.05 (*), 0.01 (**), 0.001 (***); NS = nonsignificant.
ZPercentages equal percent of nutrient found in tissue.
41
pH NO3-N PO4-P K+ Ca2+ Mg2+
Commercial Fertilizer 6.0 ± 0.0Z 175 ± 10.0 61.7 ± 4.37 245 ± 5.7 254 ± 23.4 52 ± 10.0 (mg/l) n = 3 n = 4 n = 4 n = 4 n = 4 n = 4
Aquaculture Effluent 6.7 ± 0.2 400 ± 62.3 3.3 ± 0.98 170 ± 14.1 418 ± 85 125 ± 24.3(mg/l) n = 75 n = 11 n = 11 n = 6 n = 11 n = 11
ZMeans were analyzed using Proc Means (SAS Version 9.2 SAS Institute, Cary, NC).
Table 5. Nutrient concentrations of commercial fertilizer and aquaculture effluent applied to Beit Alpha cucumber 'Manar'
42
Table 6. Fish culture system and effluent water quality
Water SourceFish Tank 337 414 45 7.4Tank Effluent 214 371 33 2.9ZMeans were analyzed using Proc Means (SAS Version 9.2 SAS Institute, Cary, NC).
Total Suspended Solids (mg/l)
Total Nitrogen
Total Phosphorus
Settable Solids
43
Chapter III
Integrating Greenhouse Cherry Tomato Production with
Biofloc Tilapia Production
Abstract
Integration of intensive aquaculture systems with greenhouse plant production has been
shown to improve aquaculture water quality conditions and improve plant nutrient use
efficiency. The majority of the focus of integrated systems has involved raft culture or
true hydroponics. Little work has been done on soilless culture utilizing drip irrigation.
This study investigated the feasibility of integrating biofloc tilapia (Oreochromis
niloticus) production with greenhouse cherry tomato production (Solanum lycopersicum
var. cerasiforme). Nile tilapia (Oreochromis niloticus) (157 grams/fish) were stocked at
40 fish/m3 and grown for 149 days. Two varieties of cherry tomato (Solanum
lycopersicum var. cerasiforme) were used, ‘Favorita’ and ‘Goldita’ and grown with AE
waste and compared to plants grown with conventional fertilizer in soilless culture. Plants
were grown for 158 days. No differences were observed between treatments until fish
harvest (117 DAT).Yields for ‘Favorita were 11.8 and 11.1 for CF and AE plants,
respectively, at fish harvest and were the same. Post fish harvest ‘Favorita’ there was a
19% difference in total yield between treatments at crop termination. Goldita plants were
different both pre and post fish harvest with overall yield less than Favorita despite
treatment applied. This study demonstrates that greenhouse cherry tomato production
44
utilizing soilless growing techniques can be successfully integrated with AE from a
tilapia biofloc production system.
Introduction
Feed cost can account for over 50% of production cost in an aquaculture system
(FAO 2009), consequently it is important to efficiently convert feed into sellable
products. Fish are among the most efficient cultured animals in regards to feed
conversion, but there is still a considerable amount of wasted nutrients associated with
fish production (Heinen et al., 1996; Rafiee and Saad, 2005). Recirculating aquaculture
systems (RAS) are highly efficient in improving water and space use efficiency but
traditional RAS systems do little to improve the nutrient use efficiency of a system
(NUE).
Biofloc Technology (BFT) is a form of RAS that does not use a traditional
biofilters. BFT relies on the constant mixing of suspended solids in the water column.
Solids in suspension in BFT culture water provide surface area for both heterotrophic and
autotrophic bacteria growth. Most BFT are operated where nitrogenous waste is
primarily handled through mineralization utilizing heterotrophic bacteria. Nitrogenous
waste (primarily Ammonia) is assimilated into microbial protein, converting the N into a
non-toxic form (De Schrymer et al., 2008; Avnimelech 2006). This management
technique is enhanced by increasing the C:N ratio of food adding highly available carbon
sources or by lowering the percent protein in feed (Avnimelech, 1999; Azim and Little,
2008). BFT has been shown to improve feed conversion ratio (FCR) over clear water
systems which improves the nutrient use efficiency of the system (Azim and Little,
45
2008). BFT systems contain high concentrations of settable solids that include microbial
flocs, uneaten feed and fecal waste.
Hydroponic vegetable production lends itself well with integration into RAS
improving NUE. The integration of RAS with hydroponic vegetable production is
commonly referred to as aquaponics (Rakocy 2006). Aquaponic systems have been
shown to improve NUE, decrease water consumption and improve water quality over
conventional RAS systems (Rakocy, 1988; Al-Hafedh et al., 2008; Clarkson and Lane,
1991; Takeda et al., 1997). Quillere et al., (1995) reported that 60% of applied nitrogen
was recovered with 28% being assimilated into plant biomass and 31% being assimilated
into fish biomass when fish production was integrated with hydroponic tomato
production.
Aquaponic research has primarily revolved around 2 major crops: leafy greens
(Rakocy et al., 2004, Rakocy, 1988; Clarkson and Lane, 1991; Chaves, et al., 2007; Al-
Hafedh et al., 2008) and tomatoes (Lewis et al., 1978; Watten and Busch, 1984; McMurty
et al., 1993; Mariscal-Lagarda et al., 2012; Castro et al., 2006) Savidov et al., (2007)
evaluated 24 different plant species grown in an Aquaponic system, demonstrating the
variety of crops that can be gown aquaponically.
Little research has addressed integrating aquaponics and soilless plant production
systems that utilize conventional soilless growing systems commonly in the greenhouse
vegetable industry. Soilless systems utilize highly porous growing media with low water
holding capacity. This allows growers to manipulate nutrients in the root zone with
frequent short irrigation cycles using drip irrigation. Clogging of the micro orifices
associated with micro irrigation with fish waste has been a concern with aquaponics.
46
High concentrations of settable solids associated with BFT have also limited integrated
research for soilless systems with BFT systems. The purpose of this research is to
investigate the integration of BFT aquaculture effluent (AE) with greenhouse cherry
tomato using soilless hydroponic systems for plant production.
2.0 Materials
2.1 Facility
Facilities used in this study consisted of two commercial size greenhouses, located at the
E.W. Shell Fisheries Center, North Auburn Unit and approximately 10 km north of
Auburn, Alabama, USA (32.649171, -85.486725). The fish culture system was housed
in a 267.6 m2 double polyethylene covered greenhouse (9.1 m x 29.2 m) with an east to
west orientation and consisted of two rectangular tanks (1.2 m x 3.7m x 26.8 m) each
with a volume capacity of 125 m3 and an average volume of 100 m3, operated as a
Biofloc system (Avnimelech, 2006). A 1.9 m3 cone bottomed clarifier (30% slope)
adjacent to the greenhouse was used to reduce the concentration of suspended solids from
the system. Water flowed through the clarifier at an approximate flow rate of 18.9 l/min.
and then entered a 1.1 m3 cone bottomed sump used for irrigation (irrigation sump)
before re-entering the fish production tank. Both of these vessels had an uninterrupted
and constant flow of water driven by air lift pumps. Both the clarifier and irrigation
sump were flushed of collected solids twice daily.
The 267.5 m2 (9.1 m x 29.2 m) plant greenhouse was also covered double layered
polyethylene sheeting with a north to south orientation. The plant greenhouse was
47
outfitted for soilless vine crop production with a steel cable trellis system running the
length of the greenhouse with cables suspended approximately 2.1 meters above the
greenhouse floor. Two cables were suspended above each row approximately 0.1 meters
from the row center. Each row was 1.5 meters apart and plant growing containers were
spaced 40.6 cm apart within the row. Both greenhouses were equipped with
environmental controls for year round production.
2.2 Fish production
Only one fish tank (100 m3) was used in this study. The tank was stocked with 3,000 Nile
tilapia (Oreochromis niloticus) (157 grams/fish) 40 fish/m3 on August 29, 2012. Fish
were fed a 36% protein floating feed (Cargill® , Franklinton, LA) at 1-3% body
weight/day, ad libitum twice daily (0830 and 1600 hr.) for approximately twenty minutes.
Calcium-hydroxide [Ca(OH)2] was applied after each feeding to maintain a targeted pH
of 6.8 to 7.0 (Rakocy et al., 2006). Dissolved oxygen and temperature of fish culture
water were recorded twice daily (YSI 550A, YSI Inc., Yellow Springs, OH). Fish were
harvested 150 days after stocking (Jan 24, 2013).
2.3 Plant Production and Experiment Design
To evaluate yields of tomatoes grown with AE against conventionally grown plants, a
commercially available hydroponic fertilizer “Bag Culture Tomato Special 3-13-29”
(Total GrowTM, Winnsboro, LA) and greenhouse grade calcium nitrate (15.5-0-0 ) were
used for the control treatment. Plants were irrigated and fertilized at conventional rates.
Which loosely followed recommendations by Hanna (2013) (Table 1.) Two cherry
48
tomato varieties (Solanum lycopersicum var. cerasiforme) were used, ‘Favorita’ and
‘Goldita’. On October 1, 2012 eight week old tomato transplants were transplanted into
11 liter Bato pots (Bato Plastics B.V. Zevenbergon, The Netherlands) filled with
commercial grade perlite. Following commercial practices two tomatoes were planted in
each pot resulting in a plant density of 3.2 plants/m3. Each pot served as a single
experimental unit.
This study consisted of two treatments, aquaculture effluent (AE) and the
previously mentioned commercial fertilizer (CF). The AE was pumped from the
irrigation sump adjacent to the fish greenhouse. The tomato varieties were evaluated
simultaneously but in separate experiments. Both treatments were delivered through drip
irrigation and pressure compensated emitters at a flow rate of 3.8 l/hour. Plants were
arranged in a completely randomized design with 10 replicates for both treatments of
‘Favorita’. Goldita had 9 replicates of AE and 11 replicates of CF grown plants. Harvest
began 61 days after transplanting (DAT) and continued daily until termination of the
study (158 DAT). Tomato fruit were harvested based on ripeness, with fruit color used as
an indicator. Tissue samples were taken at final harvest.
2.4 Irrigation
This experiment consisted of two treatments, AE and a commercially available
hydroponic fertilizer. The irrigation sump was used to access clarified water for the drip
irrigation system for soilless culture of cherry tomatoes in the adjacent greenhouse. A 1.5
horse power irrigation pump was used to deliver pressurized water at 30 psi. Pressure
was regulated by bleeding excess pressure back into the irrigation sump. Both treatments,
49
AE and CF, were delivered to appropriate plants through standard drip irrigation
equipment used in soilless production of greenhouse vegetable crops. Both treatments
were delivered to plants using a clog resistant pressure compensated emitter (Bowsmith
Non-Stop Emitter, Bowsmith Inc. Exeter California.) at a flow rate of 3.785 l/hour.
Plants grown with AE received water directly from the irrigation sump. Plants grown
with CF received water and fertilizer through two fertilizer injectors (Model DM11
Dosatron USA. Clearwater Florida). This allowed separate but simultaneous injection of
the hydroponic fertilizer blend and calcium nitrate. Solenoid valves responsible for
delivering the respective treatments were wired in tangent so both treatments were
applied at the same time.
3.0 Data collected and Analysis
3.1 Nutrient Analysis and Water Quality
Nutrient analysis was performed twice weekly where TAN, nitrate, nitrite,
potassium and orthophosphate were determined. A three-liter composite sample of the
fish culture water and AE from the irrigation sump was collected twice weekly
characterize the nutrient concentration of water being used to irrigate tomato plants
receiving AE (Table 1). Each sample was filtered using a 40-micron Whatman™ glass
fiber filter (VWR International, Radnor, PA). Standard curves were fit for TAN, nitrate-
nitrogen, potassium and orthophosphate on a GENESYS 20 visible spectrophotometer
CO) was used to determine TAN the ascorbic acid method 8048 (Hach Company,
Loveland, CO) was used to determine orthophosphate. Nitrate-nitrogen and potassium
50
were analyzed using a Cardy twin nitrate and potassium meters (Spectrum Technologies,
Inc., Plainfiled, IL). Titration method 8329 using ethylenediaminetetraacetic acid (Hach
Company, Loveland, CO to determine calcium and magnesium. Total Phosphorus and
Total Nitrogen were determined through persulfate digestion (Rice et al., 2012).
Digestates of nitrate and orthophosphate were determined using spectrophotometric
screening and ascorbic acid method (Prapaiwong and Boyd, 2012; Rice et al., 2012;
Gross and Boyd, 1998)
Settable Solids were determined for water contained in the fish tank and water
returning to the tank from the irrigation sump using an adopted procedure of Standard
Method 2540 F (Rice et al, 2012). Avliminech (2007), reported floc particles become
reanimated if left undisturbed for the 1 hour recommended settling time in the procedure
described in Standard Method 2450, due to gas bubbles forming. For the purposes of this
study, a 30 minute period was used for settling. Suspended solids were measured
according to Standard Method 2540 D (Rice et al, 2012) using glass fiber filtration
followed by gravimetric analysis. The pH of AE of samples were taken twice daily.
3.2 Statistical Analysis
Means were analyzed using Proc Means (SAS version 9.2 SAS Institute, Cary, NC.)
Means comparisons were analyzed using Proc Ttest (SAS version 9.2 SAS Institute,
Cary, NC.) If variances were equal, the pooled method was used to determine
significance. If variances were unequal the Satterthwaite method was used to determine
significance.
51
4. Results
4.1 Fish Production
Fish were grown in the biofloc system for 149 days. Final harvested biomass was
1,501.8 kg (15.0 kg/m3) live weight of tilapia (Table 2). This biomass load is comparable
to Rakocy et al., (2005) in a similarly managed outdoor system (14.4 kg/m3 and 13.7
kg/M3) with similar tank volume and horsepower aeration (0.75 HP/ 100 m3). Timmons
and Ebeling (2013) lists 40 kg/m3 as the maximum biomass that can be produced through
aeration and no supplemental oxygen. The total harvested fish biomass produced (final
– initial) was 1,032 kg (10.3 kg/m3) (Table 1). Survival was approximately 96% with
3,000 fish stocked and 2,872 fish harvested. This yield represents a 220% increase in
growth over 149 days of production and fish grew at a rate of 2.3 g/day/fish. This is a
lower growth rate than was observed by Rakocy et al., (2005) however, initial and final
stocking weight may have influence this rate.
Total water use was approximately 168 m3 and translated to 6.14 kg/m3 per kg of
fish biomass produced (Table 2). The power required was 5.2 kw/kg of tilapia biomass
produced and translated to 35.8 kw/day (Table 2). Base addition using calcium
hydroxide would be considered a minor input of 158.9 kg or 0.2 kg per kg of fish
biomass gained. Feed inputs totaled 2,010 kg (20.1 kg/m3) and represented a FCR of 1.9
(Table 2). FCR’s in this experiment were comparable to FRC reported by Rakocy et al.,
(2005) of 2.2 and 1.9.
The FCR associated with tilapia was average. Tilapia can perform more
efficiently in regards to feed conversion. Water quality conditions and feeding practices
could have affected FCR. Total ammonia nitrogen averaged to 2.3 ± 0.95 mg/l in the fish
52
production tanks (Table 3). The mean nitrite within fish production tanks was 6.2 ± 1.5
mg/l, above recommended levels, but could have been alleviated some by the initial
chloride supplementation of 100 mg/l Cl (Table 3). This concentration was likely
depleted by the end of the fish crop through water exchange.
Dissolved oxygen (DO) concentrations averaged 5.7 mg/l and 4.9 mg/l for
morning and afternoon, respectively (Table 4). DO concentrations was approximately
16% higher in the morning than in the evening (Table 4). The difference observed in
temperature between morning (26.9 C) and afternoon (27.8 C) in combination with feed
inputs were likely the reason for DO temperature fluctuations. PH of water within the
fish culture tanks was maintained at approximately 6.7 (Table 4).
4.2 Plant Production
No differences in yield were observed between plants grown with AE and CF for
each harvest date until fish harvest for the cherry tomato ‘Favorita’ (Table 5). Some
differences were seen between treatments before fish harvest in the ‘Goldita.’ At fish
harvest the total yield across all harvest dates for ‘Favorita’ grown with AE was 11.83
kg/m2 (CF) and 11.11 (AE) kg/m2 and were not different (Table 6). However, ‘Goldita’
plants were 10.80 kg/m2 (CF) and 8.33 kg/m2 (AE) kg/m2 at fish harvest (Table 6). Fish
were withheld feed approximately 7 days from fish harvest. AE used for irrigation was
pumped from the clarifier. Nitrate-nitrogen concentrations exiting the clarifier averaged
331 mg/l and ranged from 170 to 520 mg/l (Table 7). Nitrate-nitrogen concentrations
might be considered very high for the soilless production of greenhouse tomatoes.
Nitrate samples for AE were taken from the clarifier and not at the drip emitter. It is
53
possible that some degree of denitrification could have taken place inside the irrigation
system. Anaerobic conditions would have been favored due to the high organic matter
concentration in the AE and the slow rate of water exchanged in the irrigation lines.
Future studies should monitor AE at the drip emitters. Orthophosphate phosphate
averaged 46.7 mg/l. Potassium levels during the study were within acceptable levels for
tomato production. The mean potassium concentration was 239 mg/l. (Table 7).
Tomato harvest continued for an additional 43 days. In all, the fish production
system went 22 days without feed input until a new crop of fish was stocked. Total yield
at tomato crop termination (158 DAT) for ‘Favorita’ was 23.10 kg/m2 for CF grown
plants and 18.84 kg/m2 for AE grown plants (Table 6). At tomato crop termination, total
yield for Goldita plants was 20.54 kg/m2 for CF grown plants and 14.4 kg/m2 for AE
grown plants (Table 6).
For both varieties, no differences were seen across treatments for the total mean
number of fruit clusters formed for ‘Favorita’ from CF grown plants was 13 and 12 for
AE grown plants. Differences were observable between AE and CF grown plants for
both varieties for each fruit harvest after the fish harvest. Halmann and Kobryn (2003)
investigated ‘Favorita’ response to different growing media over a two year study. The
mean yield was 10.4 kg/m2 at the 12 to 14 the fruit cluster at a plant density of 2.7 plants
when the data were pooled over the two years. The Halmann and Kobryn (2003) yield
was considerably less than yields found in this study but it is important to consider the
lower plant density and the fact that Poland has lower light intensity when compared to
the Southeastern United States.
54
Feeding of the fish crop was terminated approximately one week prior to fish
harvest. In all, the fish production system had 22 days without feed input until a new crop
of fish was stocked. Plant tissue was analyzed at the termination of the study. With high
concentrations of macro nutrients in the fish production tank and the small volume of
water used to irrigate this low number of tomato plants allows a reasonable assumption
that tomato plants receiving AE would have enough nutrients to maintain yields.
Reasons for differences in nutrient concentration in plant tissue between treatments
cannot be determined, because water quality data was not taken between fish harvest and
when tissue analysis was conducted. It is important to consider that a percentage of fruit
harvested after the fish crop was harvested would have already been set on the vine. It is
likely that an imbalance of nutrients is responsible for the differences in treatments
observed after fish harvest.
Elemental analysis of both fruit and leaf tissue are presented in Tables 8, 9 10,
and 11. Optimum levels of elements in tissue are reported in Table 12 (Snyder, 2007).
Nitrogen is lower in both tomato varieties across treatments when compared to
recommended levels. While differences in elemental concentrations were observed for
both varieties between CF and AE, it is difficult to determine which differences could be
responsible for the lower yield in plants receiving AE.
5.0 Discussion
Greenhouse vegetable production allows year round production depending on the
environmental control capacity of a given greenhouse and the market. Greenhouse
tomato production in the Southeastern United States, occurs during months where field
55
crops are not available due to the much higher cost of production associated with
greenhouse production. Plants may be actively growing and present in the greenhouse
while outdoor tomato crops are being harvested but they are in a juvenile stage and fruit
set may not occur for several months after transplanting. In other regions of the world,
several factors lend more toward year round production such as, water availability,
product availability, climate, and food cost associated with that region. Both fish and
plant crop timing, staggering and proper sizing (fish production: plant production) are
areas needing further research.
Knowing plant water demand and the volume of water needed to maintain a
specific nitrogen concentration could allow for a better model to determine the scalability
of RAS systems integrated with soilless crop production. Because such a small volume
of water is being applied to the plants; acid and nutrients could be supplemented to
optimize plant nutrition. Nutrients that are typically limiting in integrated fish and plant
systems are potassium, calcium, and iron, (Rakocy et al., 2006). The practice of injecting
acid into irrigation water is already used by greenhouse growers in both greenhouse
vegetable production and the floriculture industry where irrigation water may have high
concentrations of alkalinity (Whipker et al., 1996; Bailey and Bilderback 1997).
Maintaining this system as a closed loop while utilizing the technique of acid
injection might affect pH of the fish culture system. Recommendations for soilless crop
production include a 20 to 25% leaching fraction (Resh 2013). Closing this system and
returning pH manipulated AE leached from one greenhouse would have significantly less
of an effect on fish tank pH than that of the makeup water used to refill the tank after
irrigation events.
56
6.0 Conclusion
Results from this study suggest that conventional yields are achievable with AE as a
fertilizer and irrigation source for cherry tomato production. The solid separation and
irrigation system used in this study was effective in delivering AE in the same manner as
would occur when tomatoes are grown conventionally. The clarifier was effective in
reducing both total suspended solids and settable solids (Table 3). Solids were seen
accumulating in perlite receiving AE but few problems with irrigation and media
clogging were observed. Future work should include nutrient supplementation and
system scalability in relation to water exchange needs to maintain a specific nitrate
concentration.
57
References
Al-Hafedh, Y.S., A. Alam, and M.S. Beltagi. 2008. Food production and water conservation in a recirculating aquaponic system in Saudi Arabia at different ratios and fish feed and plants. Journal of the World Aquaculture Society 39: 510-520.
Avnimelech, Y. 1999. Carbon/nitrogen ratio as a control element in aquaculture systems.
Aquaculture, 176: 227-235. Avnimelech, Y. 2006. Bio-filters: the need for a new comprehensive approach. Aquac.
Eng. 34: 172-178. Avnimelech, Y. 2007, Feeding with microbial flocs by tilapia in minimal discharge bio-
flocs technology ponds. Aquaculture 264: 140-147. Azim, M.E. and D.C. Little. 2008. The Biofloc technology (BFT) in indoor tanks: Water
quality, biolfoc composition and growth and welfare of Nile tilapia (Oreochromis niloticus). Aquaculture 283: 29-35.
Bailey, D.A. and T. Bilderback. 1997. Alkalinity control for irrigation water used in nurseries and greenhouses. NC State University Hort. Info. Lflt. #558.
Castro, R.S., C.M.S.B Azevedo, and F. Bezerra-Neto. 2006. Increasing cherry tomato
yield using fish effluent as irrigation water in Northeast Brazil. Scientia Horticulturae 110: 44-50.
Chaves, P.A., J. Beltrao, L.M. Laird and R. Sutherland. 2000. Lettuce (Lactuca sativa sp.) response to fish culture effluent. Acta Hort. 537: 705-708
Clarkson, R. and S.D. Lane. 1991. Use of a small-scale nutrient-film hydroponic technique to reduce mineral accumulation in aquarium water. Aquaculture and Fisheries Management 22: 37-45.
De Schryver, P., R. Crab, T. Defoirdt, N. Boon, and W. Verstraete. 2008. The basics of
bio-flocs technology: The added value for aquaculture. Aquaculture 277: 125-137.
FAO. 2009. Impact of rising feed ingredient prices on aquafeeds and aquaculture
production. FAO Fisheries Department, Food and Agriculture Organization of the United Nations, Publishing Management Services, Rome, Italy.
Gross, A., and C.E. Boyd. 1998. A digestion procedure for simultaneous
determination of total nitrogen and total phosphorus in pond water. Journal of World Aquaculture Society, 29: 300-303.
Halmann, E. and E. Kobryn. 2003. Yield and quality of cherry tomato (Lycopersicon
58
esclentum var. Cerasiforme) cultivated on rockwool and cocofibre. Acta Hort 614: 693-697
Hanna H. 2013. Hanna Tomato Book. https://www.lsuagcenter.com/NR/rdonlyres/38D0 13C6-A7BF-4702-88DC-921E038778F8/10111/HannaTomatoBook.pdf. June 8, 2015.
Heinen, J.M., J.A. Hankins, and P.R. Adler. 1996. Water quality and waste production in
a recirculating trout-culture system with feeding of a higher-energy or a lower-energy diet. Aquaculture Research 27: 699-710.
Lewis, W.M., J.H. Yopp, H.L. Schramm, and A.M. Brandenburg. 1978. Use of
hydroponics to maintain quality recirculated water in a fish culture system. Transactions of the American Fisheries Society. 107: 92-99.
Mariscal-Lagarda, M.M., F. Paez-Osuna, J.L. Esquer-Mendez, I. Guerrero-Monroy,
A. Roma del Vivar, and R. Felix-Gastelum. 2012. Integrated culture of white shrimp (Litopenaeus vannamei) and tomato (Lycopersicon esculentum Mill) with low salinity groundwater: Management and production. Aquaculture 366-367: 76-84.
McMurty, M.R., D.C. Sanders, P.V. Nelson, and A. Nash. 1993. Mineral nutrient
concentration and uptake by tomato irrigated with recirculating aquaculture water influenced by quantity of fish waste products supplied. Journal of Plant Nutrition 16: 407-419.
Prapaiwong, N., and C.E. Boyd. 2012. Effluent volume and pollutant loads at an inland,
low-salinity, shrimp farm in Alabama. Aquaculture Engineering. 48: 1-5. Quillere, I., L. Roux, D. Marie, Y. Roux, F. Gosse, and J.F. Morot-Gaudry. 1995. An
artificial productive ecosystem based on a fish/bacteria/plant association 2 Performance. Agriculture, Ecosystems, and Environment 53: 19-30.
Rafiee, G. and C.R. Saad, 2005. Nutrient cycle and sludge production during different
stages of red tilapia (Oreochromis sp.) growth in a recirculating aquaculture system. Aquaculture 244: 109-118.
Rakocy J. E. 1988. Hydroponic lettuce production in a recirculating fish culture system.
Island Perspectives. UVI. AES 5-10. Rakocy, J.E., R.C. Schultz, D.S. Bailey, and E.S. Thoman. 2004. Aquaponic production
of tilapia and basil: Comparing a batch and staggered cropping system. Acta Hort 648: 63-69.
Rakocy, J.E., J.J. Danaher, D.S. Bailey, and R.C. Shultz. 2005. Development of a biofloc
system for the production of tilapia. University of Arizona. http://ag.arizona.edu/azaqua/ista/ISTA9/FullPapers/Rakocy2.doc last accessed June 10, 2015.
Rakocy, J.E., M.P. Masser, and T.M. Lasordo. 2006. Recirculating Aquaculture Tank Production Systems: Aquaponics-Integrating Fish and Plant Culture. Southern Regional Aquaculture Center. Publication No. 454.
Rice, E.W., R.B. Baird, A.D. Eaton, and L.S. Clesci (Eds). 2012. Standard Methods for Examination of Water and Wastewater, 22nd edition. American Water Works Assn., Washington D.C.
Savidov, N.A., E. Hutchings, and J.E. Rakocy, J.E. 2007. Fish and plant production in a recirculating aquaponic system: a new approach to sustainable agriculture in Canada. Acta Hort 742: 209-221.
Company LLC, Ithaca, NY. 788. Whipker, B.E., D.A. Bailey, P.V. Nelson, W.C. Fonteno, and P.A. Hammer. 1996. A
novel approach to calculate acid additions for alkalinity control in greenhouse irrigation water. Communication in Soil Science and Plant Analysis, 27: 959-976.
YFinal biomass of Nile tilapia (Oreocrhromis niloticus)
Table 2. Inputs and outputs of a 149 day tilapia crop in a 100 m3
production system.
WCalcium hydroxide was used as base source.
per kg of fish
per m3 of fish productionZ
ZCalculated from 100 m3 fish production unit.
XPower included energy consumption from reginerative blowers and greenhouse fans.
62
Parameter Location MeanZYStandard Deviation
Production Tank 2.3 ± 0.95Exiting Clarifier 2.2 ± 1.15
Nitrite Production Tank 6.2 ± 1.50(mg/l) Exiting Clarifier 6.1 ± 1.30
Nitrate Production Tank 330.6 ± 99.70(mg/l) Exiting Clarifier 331.0 ± 106.00
Total Hardness Production Tank 1,216.9 ± 368.00(mg/l) Exiting Clarifier 1,231.6 ± 368.00
Total Suspended Solids Production Tank 508.8
±210.00
(mg/l) Exiting Clarifier 463.6 ± 170.60
Settable Solids Production Tank 21.1 ± 21.60(ml/l) Exiting Clarifier 11.6 ± 15.90
ZMeans were calculated from water samples taken weekly
Total Ammonia Nitrogen (mg/l)
YDescriptive statistics analyzed using the StatPlus software package (AnalystSoft Inc., Alexandria, Virginia).
Table 3. Water quality parameters as relates to fish health during 149 day production cycle in a minimum water exchange biofloc production system.
63
Time Measure MeanZY
Standard Deviation
AM 5.7 ± 0.8PM 4.9 ± 0.5
Temperature (C°) AM 26.9 ± 3.0PM 27.8 ± 3.0
pH AM 6.7 ± 0.2PM 6.7 ± 0.2
ZMeans were calculated from water samples taken dailyYDescriptive statistics analyzed using the StatPlus software package (AnalystSoft Inc., Alexandria, Virginia).
ParameterDissolved Oxygen (mg/l)
Table 4. Dailey water quality parameters as relates to fish health during 149 day production cycle in a minimum water exchange biofloc production
Z Plant density was 3.2 plants/m2.YFish crop was harvested on 1/24/15.XMeans were analyzed using Proc Ttest(SAS Version 9.2 SAS Institute, Cary, NC). If variances were found to be equal the Pooled method was used to determine significance. If variances were unequal Satterthwaite method was used to determine significance. P ≤ 0.05 (*); NS = nonsignificant.
Yield (kg/m2) for each harvest dateZ,XTable 5. Yield comparisons of cherry tomato cultivars 'Goldita' and 'Favorita' grown with conventional fertilizer or aquaculture effluent.
Z Plant density was 3.3 plants/m2.YFish crop was harvested on 1/24/15.XTomato crop was terminated on 3/7/13.
Table 6. Yield of cherry tomato cultivars Goldita and Favorita grown with conventional fertilizer or aquaculture effluent at time of fish harvest and crop termination.
WMeans were analyzed using Proc Ttest(SAS Version 9.2 SAS Institute, Cary, NC). If variances were found to be equal the Pooled method was used to determine significance. If variances were unequal Satterthwaite method was used to determine significance. P ≤ 0.05 (*); NS = nonsignificant.
66
Parameter Location MeanZYStandard Deviation
Total Nitrogen Production Tank 371.8 ± 148.0(mg/l) Exiting Clarifier 405.0 ± 157.0
Nitrate Production Tank 330.6 ± 99.7(mg/l) Exiting Clarifier 331.0 ± 106.0
Production Tank 47.2 ± 13.8Exiting Clarifier 42.7 ± 15.4
Production Tank 82.2 ± 39.9Exiting Clarifier 73.6 ± 24
Potassium Production Tank 239.4 ± 36.4(mg/l) Exiting Clarifier 235.8 ± 32.3
Calcium Production Tank 424.4 ± 141.6mg/l Exiting Clarifier 431.0 ± 138.8
Magnesium Production Tank 44.4 ± 4.0(mg/l) Exiting Clarifier 43.9 ± 6.0
ZMeans were calculated from water samples taken daily
Dissolved Reactive Phosphorus (mg/l)
Total Phosphorus (mg/l)
YDescriptive statistics analyzed using the StatPlus software package (AnalystSoft Inc., Alexandria, Virginia).
Table 7. Water quality parameters as relates to plant health during 149 day production cycle in a minimum water exchange biofloc production system.
Concentration (mg/l) of micronutrient found in leaf tissue
ZMeans were analyzed using Proc Ttest(SAS Version 9.2 SAS Institute, Cary, NC). If variances were found to be equal the Pooled method was used to determine significance. If variances were unequal Satterthwaite method was used to determine significance. P ≤ 0.05
Table 8. Nutrient concentration of cherry tomato 'Favorita' fruit tissue grown with conventional fertilizer or aquaculture effluent.
Concentration (mg/l) of micronutrient found in leaf tissue
ZMeans were analyzed using Proc Ttest(SAS Version 9.2 SAS Institute, Cary, NC). If variances were found to be equal the Pooled method was used to determine significance. If variances were unequal Satterthwaite method was used to determine significance. P ≤ 0.05 (*); NS = nonsignificant.
Table 9. Nutrient concentration of cherry tomato 'Goldita' fruit tissue grown with conventional fertilizer or aquaculture effluent.
Concentration (mg/l) of micronutrient found in leaf tissue
ZMeans were analyzed using Proc Ttest(SAS Version 9.2 SAS Institute, Cary, NC). If variances were found to be equal the Pooled method was used to determine significance. If variances were unequal Satterthwaite method was used to determine significance. P ≤ 0.05 (*); NS = nonsignificant.
Table 10. Nutrient concentration of cherry tomato 'Favorita' leaf tissue grown with conventional fertilizer or aquaculture effluent.
Concentration (mg/l) of micronutrient found in leaf tissue
ZMeans were analyzed using Proc Ttest(SAS Version 9.2 SAS Institute, Cary, NC). If variances were found to be equal the Pooled method was used to determine significance. If variances were unequal Satterthwaite method was used to determine significance. P ≤ 0.05 (*); NS = nonsignificant.
Table 11. Nutrient concentration of cherry tomato 'Goldita' leaf tissue grown with conventional fertilizer or aquaculture effluent.
YConv. Fert = Conventional fertilizer treatment.
71
N P K Ca Mg4.0-5.5 0.3-1.0 4.0-7.0 1.0-5.0 0.4-1.5
Fe Zn Mn Cu B Mo100-250 30-150 40-300 5-25 35-100 0.15-5.0
ZFrom Snyder (1992).
Table 12. Optimum levels of nutrient elements in greenhouse tomato leaf tissueZ.
%
ppm
Concentration (mg/l) of micronutrient found in leaf tissue
Percent macronutrient found in leaf tissue
72
Chapter IV
Economics and Input Efficiencies Associated with Integrating Biolfoc Tilapia
Production with Cherry Tomato Production
Abstract
Little information exists quantifying cost savings when integrating fish production
with greenhouse vegetable production systems. The objective of this research was to
critically investigate the economic changes associated with integrating a biofloc tilapia
(Oreochromis niloticus) production system with greenhouse cherry tomato (Solanum
lycopersicum var. cerasiforme) production. Production data from an experiment
investigating the integration of biofloc tilapia production with greenhouse cherry
tomatoes was used to develop the economic analysis. Data was extrapolated from cherry
tomato production to cover 267 m3 of 100% cherry tomato production. In order to
evaluate economic and resource changes associated with integration, an integrated system
was compared to a tilapia only production and greenhouse tomato only production.
When fertilizer savings associated with integration was applied to the tilapia production
variable cost(as a negative cost), the return above variable cost increased by 12% for
tilapia when compared to tilapia grown in the non-integrated scenario. Through
integration where fertilizer savings were applied to tilapia variable costs, the break-even
price per kg of fish was reduced by 7%. An opportunity cost to land was observed when
independent tomato production was chosen over the integrated scenario. Water use was
73
reduced by 50% in the integrated approach. The conversion of nitrogen to sellable
products was improved by 68% in the integrated approach. This analysis makes a strong
case for an economic and resource saving advantage to existing fish production facilities
to integrate, providing a market for the plant product is available. The benefits to
existing greenhouse cherry tomato producers to integrate with tilapia production is
limited. Water and nitrogen use efficiency improvements may outweigh these
opportunity cost in areas where water is limited or nitrogen pollution are a concern.
Introduction
While fish as a production crop is efficient in feed conversion compared to other
livestock animals a great deal of waste is still produced. Fish waste containing nutrients
can have negative environmental impacts to encompassing or nearby water bodies (Cao
et al., 2007; Herbeck et al., 2014; Farmaki et al., 2014). As feed is a major expense in
fish production. Conversion of as much feed into sellable product as possible is
desirable. Improving feed conversion and nutrient use efficiency (NUE) can increase
both the economic and environmental sustainability of an aquaculture system.
In traditional RAS, nitrate concentrations can cost effectively be reduced by two
methods; water exchange (dilution) or through denitrification. Denitrification involves
treating culture water by recirculation in an anaerobic vessel where bacteria are able to
use nitrate or nitrite in anaerobic respiration (Van Rijn et al., 2006). The end result of
denitrification is the conversion of nitrate and/or nitrite into nitrogen gas resulting in loss
through vitalization (Van Rijn et al., 2006; Lee et al., 2000). Both dilution and
denitrification result in lowering NUE as nitrogen is lost from the system.
74
Aquaponics is the integration of fish and plant culture (Rakocy et al., 2006).
Aquaponic systems have been shown to improve NUE, decrease water consumption and
improve water quality over conventional RAS systems (Rakocy, 1988; Al-Hafedh et al.,
2008; Clarkson and Lane 1991; Takeda et al., 1997). The impact integration has on water
quality and NUE varies depending on plant and fish species and RAS design. Quiller et
al., (1995) reported that 60 % of applied nitrogen was recovered with 28% being
assimilated into plant biomass and 31% being assimilated into fish biomass when fish
production was integrated with hydroponic tomato production. Chaves et al., (2000)
compared an integrated system to both monoculture fish system and monoculture plant
system and observed 13 to 14% reduction in nitrates and 14 to 19% reduction in PO4
when compared to an identical fish production. Mariscal-Largarda reported a 97 to 98%
reduction in water usage per kg of shrimp when comparing to traditional monoculture
systems in Mexico and a 93 to 96% reduction accounting for water used for tomato
production.
Greenhouse production of vegetables utilizing hydroponic and soilless culture
techniques improves nutrient and water use efficiency (WUE) over conventional open
field production (Grewal et al., 2011, El-Behairy, 2003). Jovicich et al., (2007)
demonstrated a 33% reduction in water and a 28% reduction in a nitrogen per kg of
cucumber fruit when comparing greenhouse grown to conventional field grown
cucumbers. Greenhouse vegetable growers commonly use soilless culture to discharge
irrigation without recycling that nutrient laden water. This is commonly referred to as
“drip to waste”. This leachate solution is not recycled for biosecurity reasons and
associated difficulty related to managing nutrient concentrations in recycled solutions.
75
Drip to waste soilless systems typically allow a 20 to 25% leaching fraction to prevent
the buildup of fertilizer salts in the media that would otherwise cause damage to the crop
(Resh, 2013)
Previous experiments have suggested that integrating fish production with soilless
greenhouse vegetable production is possible. Little research has documented the
economic impact integration has on both fish and plant production. This purpose of this
project is to investigate the economic implications of a biofloc system integrated with
soilless culture of greenhouse cherry tomato production and the effects on nitrogen and
WUE.
Materials and methods
Economic analysis for this study is derived from a previous study on the
feasibility of utilizing aquaculture effluent from a biofloc system to irrigate and fertilize
greenhouse grown cherry tomatoes (Chapter 3). Production parameters for each crop is
outlined in Table 1. Tilapia (Oreochromis niloticus) (157 g) were stocked in a 100 m3
biofloc system at a density of 30 fish/m3. Cherry tomatoes ‘Favorita’were transplanted
32 days after fish stocking in an adjacent greenhouse (Table 1). Two
irrigation/fertilization treatments were applied, aquaculture effluent or a commercial
fertilizer. The plants were arranged in a complete randomized design with a planting
density of 3.2 plants/m2, with 10 replicates per treatment.
Plants were grown in perlite with a conventional irrigation system that has been
previously described (Chapter 3). Plants were trained with conventional cultural
techniques (Snyder, 2007). Fertilization of plants receiving fertilizer loosely followed the
76
fertigation regime presented by Hanna (2013). This economic analysis is based off data
collected from stocking until fish harvest for both the tomato and tilapia crop and
includes 147 days of tilapia production and 117 days of cherry tomato production. Plant
yield is an important component in this analysis. Yield is highly variable in greenhouse
production and can be influenced by cultivar, crop duration, light intensity and plant
health. Little information is available on verified yields of cherry tomato production and
yields can be significantly impacted by geographical area, associated weather and light
levels. Cherry tomato production data was extrapolated to a 267.5 m2 greenhouse in full
production. Economic analysis and presentation was modeled after Brown et al., 2014.
Nitrogen conversion ratio (NCR) was calculated using the following:
Boyd (2005) has suggested using a water index that would allow systems to be
evaluated based on water use.
𝑊𝑊𝑏𝑏𝑛𝑛𝑛𝑛𝑛𝑛 𝑝𝑝𝐹𝐹𝑛𝑛 𝑛𝑛𝑛𝑛𝑓𝑓𝑛𝑛𝑥𝑥 (𝑏𝑏3/𝑘𝑘𝑛𝑛) =Total water used in production (m3)
𝑃𝑃𝑛𝑛𝑛𝑛𝑓𝑓𝑝𝑝𝑝𝑝𝑛𝑛𝑛𝑛𝑛𝑛𝑛𝑛 (𝑘𝑘𝑛𝑛)
(Adapted from water use indices proposed by Boyd (2005)).
77
In order to quantify savings three scenarios were compared, consisting of the following:
1) tilapia and cherry tomato produced independently and no savings applied; 2) tilapia
and cherry tomato integrated where fertilizer savings were applied to variable cost in
cherry tomato production; and 3) tilapia and cherry tomato integrated where fertilizer
value was applied to receipts in tilapia production.
Assumptions
Labor cost was based on an average of 25 man hours per week of production
(Snyder et al., 2007). Data was not available for actual greenhouse heating cost, so
propane cost was assumed to be $3,000 for the winter production of the tomato crop. This
assumption was based off previous experience and average cost reported by local
growers. Prices associated with greenhouse developmental cost was based on prices
from greenhouse manufacturers and greenhouse construction contractors. Energy cost
for both the fish and tomato systems were from actual power meter records for those
crops. Water use for fish production was derived from actual water use data collected
during production. Management, transportation and marketing cost were not included.
Tilapia prices were assumed to be $6.00 per kg and cherry tomato prices were assumed to
be $10.00 per kg with the assumption that 100% of the product for both crops were sold.
Straight line depreciation method was used to calculate depreciation. After the tomato
crop that provided this data was harvested, for an additional 36 days and 12 more kg of
tomatoes were harvested from plants grown with conventional fertilizer and 7 kg for
plants grown from aquaculture effluent grown plants.
78
Results
The gross returns for the tilapia crop production and tomato crop was $9,102 and
$22,269, respectively (Table 2). The total variable cost for fish production was $5,662
compared to $8,799 associated with tomato production (Table 2). When total variable
costs were reduced to cost per square meter the fish and tomato were $14.5 and $28.6 per
m2, respectively. Income above variable cost for tilapia was $3,350 and $13,470 for
tomato.
The capital cost to develop the fish greenhouse (267.5 m2) and production system
was $56,874 or $213/m2 (Table 3). It is important to note that this analysis includes only
the 149 day tilapia crop discussed in Chapter 3 and only represents only 16% of the total
annual capacity of the fish system. Variable cost and fixed cost have been adjusted to
reflect the only 16% of the total annual variable and fixed cost (Table 3). The
greenhouse and production system responsible for the cherry tomato production was
$42,910 or 160/m2 (Table 4).
The variable cost associated with both the tilapia and cherry tomato production
systems were calculated (Table 5). The tilapia crop was similar to most aquaculture
systems, where feed (35%) and fingerlings (29%) make up the majority of the variable
cost (Table 5). The majority of the variable cost associated with the cherry tomato
production was in labor (18%) and heat energy (13%).
Data was not available for the actual fertilizer usage for the cherry tomato crop, so
fertilizer use was calculated from the recommended fertilization and irrigation schedule
outlined by (Hanna, 2013) (Table 6). It is assumed that one crop of fish could provide
79
adequate nutrition to one greenhouse (267m2) of cherry tomatoes, a ratio that will vary
between systems. The stocking density used in this study would be considered low
density especially for the amount of inputs associated with tilapia production. More
advanced, higher density systems may allow a higher ratio of plants to fish.
For tomatoes, savings in fertilizer was the only savings identified in this analysis.
Savings from reduced fertilizer cost amounted to $478 per greenhouse of cherry tomato
production where fertilizer could be 100% augmented by aquaculture effluent. The
income above variable cost was increased by 3.4% when the savings associated with
fertilizer were applied to the tomato variable cost when compared to the nonintegrated
system, but when the savings were applied to tilapia production the incomve above
variable cost increased by 12.5% (Table 5). Savings in variable cost had a more dramatic
effect on the income above variable cost when compared to the scenario in which savings
were applied to tomato production variable cost (Table 2). This is due to the higher
degree of impact that variable cost has per unit of product when compared to the tomato
production. This difference in savings was similar for net returns above all expenses,
where savings provided a 20% increase in net returns to the non-integrated system for
savings applied to fish (Table 2). Difference in savings was due to fertilizer being a
minor component of greenhouse plant production. Fertilizer was approximately 5% of
the variable cost associated with this crop of cherry tomatoes (Table 5).
An advantage of integrated systems that has not been documented is the ability to
lower the selling price of a product as a result of the savings associated with integration.
The breakeven price above all cost for cherry tomatoes was reduced by 3% (Table 2).
When the savings was applied to the fish variable cost, the savings were 7% (Table 2).
80
When fertilizer savings from plant production was applied to fish variable cost a
marketing advantage can occur by lowering the break-even price which could allow a
reduced fish selling price. The live fish market is highly competitive in the U.S due to
the limited amount of available markets. Reducing the price per unit of fish product
could give integrated producers an advantage over nonintegrated producers.
Economic analysis revealed opportunity cost to land. In the non-integrated
scenario the net returns above variable cost per m2 was $25.00 for fish production and
$50.00 for cherry tomato production (Table 5). For income above variable cost the return
per m2 increased by 42% when compared to fish alone but decreased by 14% when
compared to cherry tomato production. These results suggest a potential opportunity cost
of an integrated system over that of producing cherry tomatoes alone. This cost would be
negated if integrating an already existing fish production system. Integrating an already
existing cherry tomato production enterprise would result in less return per area.
In this study 2,010 kg of nitrogen and 168 m3 of water was used to produce a net
biomass of 1,032 kg of tilapia. The nitrogen conversion ratio (NCR) for feed to fish
biomass was 0.10 for the non-integrated scenario. The actual amount of nitrogen applied
to the cherry tomato crop was not recorded but loosely followed the irrigation and
fertilization schedule recommended by Hanna (2013) (Table 6). Using these
recommendations the total amount of nitrogen to produce 2,227 kg of cherry tomatoes in
a 267.5 m2 greenhouse was 15 kg. This represents a NCR of 0.01 kg of nitrogen for
cherry tomatoes produced. In order to demonstrate the improvement of the NCR, only
nitrogen applied to tilapia was used to calculate the NCR of the integrated scenario where
nitrogen from feed was applied to both fish and tomatoes. The NCR for the integrated
81
scenario of tilapia and cherry tomatoes was 0.03. This improved the nitrogen conversion
by 68% when compared to fish alone.
Similarly to the NCR, integration improved the water use index. Tilapia
production required 168 m3 of water to produce 1,032 kg of net fish biomass. This
calculated to a water use index (WUI) for tilapia production of 0.16 m3/kg. Data was not
available for water use in the cherry tomato production and was calculated based on the
fertilization and irrigation schedule recommended by Hanna (2013). Cherry tomato
production was very efficient in converting water to fruit biomass with a WUI of 0.05.
WUI for the integrated system was calculated in the same manner as the NCR where
100% of water was considered consumed by both fish and plants. The WUI for the
integrated system was also 0.05 and improved WCR by 50% over fish production alone.
The system evaluated in this study was an open system and leachate from plant
production was not recycled back to fish production. It is recommended that 20 to 25%
of irrigation applied should be leached from the plant production containers at each
irrigation event to reduce fertilizer salt buildup (Resh, 2013). Utilizing this information
calculations are that recirculating would improve WUI by 8% over an open system. This
increase in WUI may outweigh the biosecurity risks associated with recycling the plant
leachate.
Conclusions
This study is composed of both calculated and actual data. System design,
stocking rates, feeding rates and plant crop can all have a profound impact on the
practicality of integration. In more conventional RAS systems with higher densities and
feed inputs, more water must be exchanged to control nitrates and therefor more plant
82
area could be irrigated. Increasing plant area can have a positive effect on net returns
when savings from fertilizer is applied to the variable cost in fish production, as was
demonstrated when comparing the different scenarios in this economic analysis. Through
this analysis it was apparent that fertilizer cost is not a major variable cost in cherry
tomato production and this can be assumed for most other greenhouse vegetable crops.
The savings produced from the reduction of fertilizer can have a more significant impact
when the savings is applied to fish production cost, since fish production has a higher
ratio of variable cost to net returns compared to that of the cherry tomato production.
Specific to this scenario, the savings can reduce the break-even price point per kg of fish
allowing a more competitive market price or an increase in profit margin for integrated
fish production compared to the non-integrated scenario.
Both water and nitrogen conversion into sellable product was improved through
integration. This study suggests a clear advantage for RAS producers who integrated
compared to non-integrates systems. This same advantage may not be present for already
existing greenhouse companies as the net return per m2 for greenhouse production was
lowered through integration. This analysis is specific to these specific scenarios.
Greenhouse tomato production in the Southeastern US is seasonally limited to winter and
spring when field tomatoes are unavailable. Savings observed through this analysis
would decrease if the savings were spread out over two more fish crops.
83
References
Al-Hafedh, Y.S., A. Alam, and M.S. Beltagi. 2008. Food production and water conservation in a recirculating aquaponic system in Saudi Arabia at different ratios and fish feed and plants. J. World Aquaculture Soc. 39: 510-520.
Boyd, C.E., 2005. Water use in aquaculture. World Aquaculture 70: 12-15. Boyd, C.E., C. Tucker, A. McNevin, K. Bostick, and J. Clay. 2007. Indicators of resource
use efficiency and environmental performance in fish and crustacean aquaculture. Reviews in Fisheries Science 15: 327-360
Brown, T.W., T.H. Hanson, J.A. Chappell, C.E. Boyd, and D.S. Wilson. 2014. Economic feasibility of an In-Pond Raceway System for commercial catfish production in West Alabama. N. Amer. J. of Aquaculture 76: 79-89.
Environmental impact of aquaculture and countermeasures to aquaculture pollution in China. Env. Sci. Pollut-Res 14: 452-462.
Chaves, P.A., J. Beltrao, L.M. Laird and R. Sutherland. 2000. Lettuce (Lactuca sativa
sp.) response to fish culture effluent. Acta Hort. 537: 705-708.
Clarkson, R. and S.D. Lane. 1991. Use of a small-scale nutrient-film hydroponic technique to reduce mineral accumulation in aquarium water. Aquaculture and Fisheries Management 22: 37-45.
El-Behairy, U.A. 2003. The effect of heating air or nutrient solution on productivity and
fruit quality of cantaloupe grown in winter by using nutrient film technique (NFT) in comparison with soil cultivation. Acta Hort. 614: 655-661.
Farmaki, E.G., N.S. Thomaidis, I.N. Pasias, C. Baulard, L. Papaharisis, and C.E.
Efstathiou. 2014. Environmental impact of intensive aquaculture: Investigation on the accumulation of metals and nutrients in marine sediments of Greece. Science of the Total Environment 486: 554-562.
Grewal, H.S., B. Maheshwari, and S.E. Parks. 2011. Water and nutrient use efficiency of
low-cost hydroponic greenhouse for a cucumber crop: An Australian case study. Agricultural Water Management 98: 841-846.
Hanna H., 2013. Hanna Tomato Book. https://www.lsuagcenter.com/NR/rdonlyres/38D0
13C6-A7BF-4702-88DC-921E038778F8/10111/HannaTomatoBook.pdf. June 8, 2015.
Herbeck, L.S., M. Sollich, D. Unger, M. Homer, and T.C. Jennerjahn. 2014. Impact of pond aquaculture effluents on seagrass performance in Hainan, tropical China.
Marine Pollution Bulletin 85: 190-203. Jovicich, E., and D.J. Cantliffe, E.H. Simmonne, and P.J. Stoffella. 2007. Comparative
water and fertilizer use efficiencies of two production systems for cucumbers. Acta Hort. 731: 235-241.
Lee, P.G., R.N. Lea, E. dohmann, W. Prebilsky, P.E. Turk, H. Ying, and J.L. Whitson.
2000. Denitrification in aquaculture systems: an example of a fuzzy logic control problem. Aquacultural Engineering 23: 37-59.
Mariscal-Lagarda, M.M., F. Paez-Osuna, J.L. Esquer-Mendez, I. Guerrero-Monroy,
A. Roma del Vivar, and R. Felix-Gastelum. 2012. Integrated culture of white shrimp (Litopenaeus vannamei) and tomato (Lycopersicon esculentum Mill) with low salinity groundwater: Management and production. Aquaculture 366-367: 76-84.
Quillere, I., L. Roux, D. Marie, Y. Roux, F. Gosse, and J.F. Morot-Gaudry. 1995. An artificial productive ecosystem based on a fish/bacteria/plant association. 2. Performance. Agriculture, Ecosystems, and Environment 53: 19-30.
Rakocy J. E. 1988. Hydroponic lettuce production in a recirculating fish culture system.
Island Perspectives. UVI. AES 5-10. Rakocy, J.E., M. P. Masser, and T.M. Lasordo. 2006. Recirculating Aquaculture Tank
Production Systems: Aquaponics-Integrating Fish and Plant Culture. Southern Regional Aquaculture Center. Publication No. 454.
P1828. Takeda F., Adler, P.R., Glenn, D.M., 1997. Strawberry production linked to aquaculture
wastewater treatment. Acta Hort 439, 637-677. Van Rijn, J., T. Tal, and H.J. Schreier, 2006. Denitrification in recirculating systems:
Theory and applications. Aquaculture Engineering. 34: 364-376
85
Item Units Amount
Total growing volume per cropZ m3 50 Biomass at stocking kg 470 Fingerling weight g 156 Days to reach market weight days 149 Percent survival % 96%Final Final biomass kg/m3 30 Final biomass kg 1,502 Market weight kg 1 Total amount of feed fed kg 2,010 Total amount of water used m3 168 FCR kg/kg 2
Plant Density plants/m2 3.2 Yield kg 27 Growing area dedicated to crop m2 268 Space utilization % 75%Days of production days/crop 117 Cherry tomato plants per crop cycle no. 660
Table 1. Production parameters for a tilapia crop integrated with cherry tomato production in greenhouses in Auburn, AL.
Tilapia production
Cherry tomato production
ZTotal growing volume represents 1/6 of yearly production capacity of fish growing system
Table 2. Enterprise budget summaries (US$) for tilapia and cherry tomato production with savings resulting from integration applied in different scenarios.
The not integrated scenerio represents where both tilapia and cherry tomatoes are treated as two separate enterprises and no economic benefits associated with interation are applied.Indicates the scenerio where savings associated with integration was applied to tomato variable cost.Indicates the scenerio where savings associated with integration was applied to tilapia variable cost.
87
Table 3. Investment Cost/ Developmental Cost for one greenhouse in tilapia production (267.5 m2 production area).
Item Cost/Unit CostGreenhouse framing 9,362 1 9,362 20 4,681 468 374 Greenhouse covering 985 1 985 4 493 246 39 Covering locking system 0.75 928 696 20 348 35 28 Inflation system 99 1 99 5 50 20 4 Ventilation (fans and vents) 3,180 1 3,180 10 1,590 318 127 Shade 80% 1,014 1 1,014 5 507 203 41 Gravel walkways 500 1 500 20 250 25 20 Electrical 1,500 1 1,500 20 750 75 60 Construction 15,000 1 15,000 20 7,500 750 600 Clarifier and airlift system 1,676 1 1,676 6 838 279 67 Fish tank construction 6,144 1 6,144 6 3,072 1,024 246 Fish production air systems 4,964 1 4,964 6 2,482 827 199 Corn boiler and accessories 7,000 1 7,000 6 3,500 1,167 280 Generator 3,000 1 3,000 10 1,500 300 120 Dissolved oxygen meter 831 1 831 3 416 277 33 Water quality test kit 197 1 197 1 99 197 8 Dip nets 23 3 69 1 35 69 3 Baskets 24 3 72 2 36 36 3 Scale 585 1 585 3 293 195 23 Total investment costs 56,874 28,437 6,511 2,275 Per fish crop (16% of total capacity) 9,100 4,550 1,042 364 ZCalculated with straight-line depreciation method with no salvage value for depreciable items
Average on investment
Interest on investment
Annual depreciationZQuantity
Useful life (years)
88
Table 4. Initial Investment cost for one 267.5 m3 greenhouse in cherry tomato production.
364 364 364 Total fixed cost (tilapia) 1,406 1,406 1,406 Equipment depreciation (tomato) 5,392 5,392 5,392 Interest on equipment and construction (tomato) 431 431 431 Total fixed cost (tomato) 5,823 5,823 5,823 Total Fixed Cost (tilapia+tomato) 7,229 7,229 7,229
V. Total varialbe and fixed costs - - Tilapia 7,067 7,067 6,589 Tomato 14,623 14,145 14,623 Total 21,690 21,212 21,212
VI. Net Returns Above All Specified Expenses - - Tilapia 1,945 1,945 2,423 Tomato 7,647 8,125 7,647 Total 9,591 10,069 10,069
Table 5. Cont. Enterprise budget comparing integrated and non integrated tilapia and greenhouse cherry tomato production for one crop each.
Interest on equipment and construction
Not integratedZ
Integrated savings to tomatoY
Integrated savings to tilapiaX
92
VII. Net returns per square meter of greenhouse Above specified variable cost (tilapia) 25.05 25.05 28.62 Above specified total cost (tilapia) 14.54 14.54 18.11 Above specified variable cost (tomato) 50.36 52.14 50.36 Above specified total cost (tomato) 28.59 30.37 28.59 Above specified variable cost (tilapia+tomato) 41.92 43.11 43.11 Above specified total cost (tilapia+tomato) 23.90 25.09 25.09
VIII. Break-even price per unit of product - - Above specified variable cost (tilapia) 3.77 3.77 3.45 Above specified total cost (tilapia) 4.71 4.71 4.39 Above specified variable cost (tomato) 3.95 3.74 3.95 Above specified total cost (tomato) 6.57 6.35 6.57
Z
Y
XIndicates the scenerio where savings associated with integration was applied to tomato variable cost.Indicates the scenerio where savings associated with integration was applied to tilapia variable cost.
Not integratedZ
Integrated savings to tomatoY
Integrated savings to tilapiaX
Table 5. Cont. Enterprise budget comparing integrated and non integrated tilapia and greenhouse cherry tomato production for one crop each.
The not integrated scenerio represents where both tilapia and cherry tomatoes are treated as two separate enterprises and no economic benefits associated with interation are applied.
93
Table 6. Fertilization schedule for greenhouse cherry tomato productionZ.
Production system (kg)Fish 0.10 0.16 Cherry tomato 0.01 0.05 Fish + cherry tomato 0.03 0.05
YWater conversion equals the amount of water (m3) applied to yield one unit (kg) of product. With fish production, the amount of biomass gained was used in the calculation and 100% of the water applied was calculated as being consumed by the crop.
ZNitrogen convesion equals the amount of nitrogen (kg) applied to yield one unit (kg) of product. With fish production, the amount of biomass gained was used in the calculation and 100% of the nitrogen applied was calculated as being consumed by the crop.
Nitrogen conversion ratio (kg)Z Water use index (kg)
Table 7. Comparison of input conversions for greenhouse tilapia, greenhouse cherry tomato production and their integration.
95
Conclusions
Integration of intensive aquaculture systems with greenhouse plant production has
been shown to improve aquaculture water quality conditions and improve plant nutrient
use efficiency. The majority of research on integrated systems has involved raft culture
or true hydroponics. Little work has been done on soilless culture utilizing drip
irrigation. These studies demonstrate that greenhouse cherry tomato and greenhouse
cucumber production utilizing soilless growing techniques can be successfully integrated
with aquaculture effluent (AE) from a tilapia biofloc production system. Past research
has excluded soilless production systems utilizing drip irrigation due to fouling of drip
irrigation components. The system used to filter and deliver AE to plants has been in
place for some time after these experiments and has shown little problems handling
solids/sediment in the AE.
Yields for plants grown with AE in both of these experiments were less than
yields produced when plants were grown with the fertilizer control by 20 to 30%.
Previous experiments have shown yields that were the same or better than controls (data
not shown), demonstrating a high degree of variability resulting from factors associated
with fish production. Balancing fish, bacteria and plants to produce a consistent growing
environment from crop to crop is difficult, however any reduction in yields may be
outweighed by the potential benefits associated with water and nutrient savings. Work
demonstrated in these studies show an increase in nutrient and water use efficiency.
96
Water savings in Alabama is not currently considered a major concern in due to the
abundance of water in the state. Reducing nutrient pollution may not justify the risk
associated with integration with current waste water regulations. However, the author
has observed situations in the Southeastern U.S. were a reduction in water pollutants
through integration would be of great benefit. One scenario involved a large aquaculture
facility where effluent nitrogen concentrations and volume posed immense environmental
concern. A second scenario involved an industrial plant located in an area that required
the municipal water system to treat effluent. This treatment became a significant cost of
production. Alabama has an abundance of water and is less concerned with pollution,
other parts of the world where arid conditions exist and food security is an issue,
increasing water and nutrient use efficiency would more than outweigh any reduction in
yield.
The economic analysis in Chapter 4, demonstrates several synergistic benefits in
regards to integration. An opportunity cost to land was observed when comparing the
scenario of only growing tomatoes in the integrated scenario but a positive effect were
observed when integrated production was compared to only tilapia production. There was
also benefits observed in lowering the breakeven price of both products as a result of
reducing production cost. This reduction in breakeven price would be of more benefit to
an aquaculture producer than to an existing tomato producer due to tighter margins
associated with intensive fish systems.
This analysis demonstrated that fertilizer cost is not a major variable cost in
cherry tomato production, a result that is reasonable to assume for most other greenhouse
vegetable crops. The savings produced from the reduction of fertilizer can have a more
97
significant impact when the savings is applied to fish production cost, since fish
production has a higher ratio of variable cost to net returns compared to that of the cherry
tomato production. Specific to this scenario, the savings can reduce the break-even point
per kg of fish, allowing a more competitive price or an increase in profit margin for
integrated fish production compared to the non-integrated scenario.
This study suggests an advantage for RAS producers who integrate compared to
non-integrated systems. This same advantage may not be present for already existing
greenhouse vegetable growers as the net return per m2 for greenhouse production was
lowered through integration. This analysis is specific to the systems and crops used in
this study and is highly variable from system to system. Demand for greenhouse tomato
production in the Southeastern U.S. is seasonally limited to winter and spring when field
tomatoes are unavailable. Savings observed through this analysis would decrease if the
savings were spread out over 2 more fish crops, however if the plant to fish ratio was
increased the savings associated with fertilizer cost would increase resulting in an even
lower breakeven price and net return.
Future work should attempt to better understand system sizing capacity as relates
to amount of feed fed to plant growing area. Acid injection and nutrient supplementation
should also be investigated to increase plant crop yields and give the grower more
flexibility over the system.
98
Literature Cited Alder, P.R., S.T. Summerfelt, D.M. Glenn, and F. Takeda, F. 1996. Evaluation of
wetland system designed to meet stringent phosphorus discharge requirements. Water Environmental Research 68: 836-840.
Al-Hafedh, Y.S., A. Alam, and M.S. Beltagi. 2008. Food production and water conservation in a recirculating aquaponic system in Saudi Arabia at different ratios and fish feed and plants. J. World Aquaculture Soc. 39: 510-520.
Avnimelech, Y. 1999. Carbon/nitrogen ratio as a control element in aquaculture systems. Aquaculture, 176: 227-235.
Avnimelech, Y. 2006. Bio-filters: the need for a new comprehensive approach. Aquac. Eng. 34 (3), 172-178.
Avnimelech, Y. 2007. Feeding with microbial flocs by tilapia in minimal discharge bio-flocs technology ponds. Aquaculture 264: 140-147.
Azim, M.E., and D.C. Little. 2008. The Biofloc technology (BFT) in indoor tanks: Water quality, biolfoc composition and growth and welfare of Nile tilapia (Oreochromis niloticus). Aquaculture 283: 29-35.
Bailey, D.A., and T. Bilderback. 1997. Alkalinkty control for irrigation water used in nurseries and greenhouses. NC State University Hort. Info. Lflt. #558.
Boyd, C.E. 2000. Water quality an introduction. Kluwer Academic Publishers, Boston MA. 330.
Boyd, C.E., 2003. Guidelines for aquaculture effluent management at the farm level. Aquaculture 226:101-112.
Boyd, C.E., 2005. Water use in aquaculture. World Aquaculture 70: 12-15. Boyd, C.E., and C.S. Tucker, C.S. 1998. Pond aquaculture water quality management.
Kluwer Academic Publishers, Boston MA. 700. Boyd, C.E., C. Tucker, A. McNevin, K. Bostick, and J. Clay. 2007. Indicators of resource
use efficiency and environmental performance in fish and crustacean aquaculture. Reviews in Fisheries Science 15: 327-360
Brown, T.W., T.H. Hanson, J.A. Chappell, C.E. Boyd, and D.S. Wilson. 2014. Economic
feasibility of an In-Pond Raceway System for commercial catfish production in West Alabama. N. Amer. J. of Aquaculture 76: 79-89.
99
Bumgarner, N. 2014. Cucumber production- An overview of OH numbers in 2013-2014.
Cropking http://cropking.blogspot.com/2014/10/cucumber-production-overview-of-oh.html last accessed June 8, 2015.
Castro, R.S., C.M.S.B Azevedo, and F. Bezerra-Neto. 2006. Increasing cherry tomato yield using fish effluent as irrigation water in Northeast Brazil. Scientia Horticulturae 110: 44-50.
Environmental impact of aquaculture and countermeasures to aquaculture pollution in China. Env Sci Pollut-Res 14: 452-462.
Chaves, P.A., J. Beltrao, L.M. Laird and R. Sutherland. 2000. Lettuce (Lactuca sativa
sp.) response to fish culture effluent. Acta Hort. 537: 705-708.
Chen, S.L., J. Ling, and J.P. Blancheton. 2006. Nitrification kinetics of biofilm as affected by water factors. Aquaculture. Eng., 34: 179–197.
Clarkson, R. and S.D. Lane. 1991. Use of a small-scale nutrient-film hydroponic
technique to reduce mineral accumulation in aquarium water. Aquaculture and Fisheries Management 22: 37-45.
Colt, J. 2006. Water quality requirements for reuse systems. Aquaculture Engineering 34:
143-156. Cordell, D., J. Drangert, and S. White. 2009. The story of phosphorus: Global food
security and food for thought. Global Environment Change 19: 292-305.
Danaher, J.J., J.M. Pickens, J.L. Sibley, J.A. Chappell, T.R. Hanson, and C.E. Boyd.
2013. Petunia growth response to container substrate amended with dewatered aquaculture effluent. HortTechnology 23: 57-63.
Danaher, J.J., J.M. Pickens, J.L. Sibley, J.A. Chappell, T.R. Hanson, and C.E. Boyd.
2014. Growth of Tomato Seedlings in commercial substrate amended with dewatered aquaculture effluent. International J. of Veg. Sci.20: 340-353.
Davidson, J., C. Good, C. Welsh, and S.T. Summerfelt. 2014. Comparing the effects of
high vs low nitrate on the health performance, and welfare of juvenile rainbow trout Onchorhynchus mykiss within water recirculating aquaculture systems. Aquaculture Engineering 59: 30-40.
De Schryver, P., R. Crab, T. Defoirdt, N. Boon, and W. Verstraete. 2008. The basics of
bio-flocs technology: The added value for aquaculture. Aquaculture 277, 125-137. Ebeling, J.M., M.B. Timmons, and J.J. Bisogni. 2006. Engineering analysis of the
stoichiometry of photoautotrophic, autotrophic, and heterotrophic removal of ammonia-nitrogen in aquaculture systems. Aquaculture 257: 346-358.
El-Behairy, U.A. 2003. The effect of heating air or nutrient solution on productivity and
fruit quality of cantaloupe grown in winter by using nutrient film technique (NFT) in comparison with soil cultivation. Acta Hort. 614: 655-661.
Farmaki, E.G., N.S. Thomaidis, I.N. Pasias, C. Baulard, L. Papaharisis, and C.E.
Efstathiou. 2014. Environmental impact of intensive aquaculture: Investigation on the accumulation of metals and nutrients in marine sediments of Greece. Science of the Total Environment 486: 554-562.
FAO. 2009. Impact of rising feed ingredient prices on aquafeeds and aquaculture
production. FAO Fisheries Department, Food and Agriculture Organization of the United Nations, Publishing Management Services, Rome, Italy.
FAO. 2012. The State of the world fisheries and aquaculture. FAO Fisheries
Department, Food and Agriculture Organization of the United Nations, Publishing Management Services, Rome, Italy
Grewal, H.S., B. Maheshwari, and S.E. Parks. 2011. Water and nutrient use efficiency of
low-cost hydroponic greenhouse for a cucumber crop: An Australian case study. Agricultural Water Management 98: 841-846.
Gross, A., C.E. Boyd, and C.W. Wood. 2000. Nitrogen transformations and balance in
channel catfish ponds. Aquaculture Engineering 24: 1-14. Gul, A., F. Kidoglu, and D. Anac. 2007. Effect of nutrient sources on cucumber
production in different substrates. Scientia Horticulturae 113: 216-220. Halmann, E. and E. Kobryn. 2003. Yield and quality of cherry tomato (Lycopersicon
esclentum var. Cerasiforme) cultivated on rockwool and cocofibre. Acta Hort 614: 693-697
Hanna H. 2013. Hanna Tomato Book. https://www.lsuagcenter.com/NR/rdonlyres/38D0 13C6-A7BF-4702-88DC-921E038778F8/10111/HannaTomatoBook.pdf. June 8, 2015.
Heinen, J.M., J.A. Hankins, and P.R. Adler. 1996. Aquaculture Research 27: 699-710. Herbeck, L.S., M. Sollich, D. Unger, M. Homer, and T.C. Jennerjahn. 2014. Impact of pond aquaculture effluents on seagrass performance in Hainan, tropical China. Marine Pollution Bulletin 85: 190-203. Hochmuth, R.C., L.L. Davis, E.H. Simonne, S.A. Sargent. 2004. Evaluation of twelve
greenhouse Beit-Alpha cucumber varieties and two growing systems. Acta Hort. 659: 461-466.
Huang, W. 2007. Impact of rising natural gas prices on U.S. ammonia supply. USDA
WRS-0720. Retrieved 14 June 2013. http://www.ers.usda.gov/media/198815/wrs0702_1_.pdf
Huang, W. 2009. Factors contributing to the recent increase in U.S. fertilizer prices, 2002-08. USDA AR- 33. Retrieved 14 June 2013. http://www.ers.usda.gov/publications/ar-agricultural-resources-situation-and-outlook/ar-33.aspx
Jensen, H.H. 2006. Changes in seafood consumer preferences patterns and associated
changes in risk exposure. Marine Pollution Bulletin 53: 591-598. Jones, J.B. 2005. Hydroponics: a practical guide for the soilless grower. 2nd ed. CRC
Press. Boca Raton, Florida. 423. Jovicich, E., and D.J. Cantliffe, E.H. Simmonne, and P.J. Stoffella. 2007. Comparative
water and fertilizer use efficiencies of two production systems for cucumbers. Acta Hort. 731: 235-241.
Kharas, H., 2010. The emerging middle class in developing countries. OECD
Development Centre No. 285. Lasordo, T.M., M.P. Masser, and J. Rakocy. 1998.Recirculating aquaculture tank
production systems, An overview of critical considerations, SRAC Publication NO. 451
Lee, P.G., R.N. Lea, E. dohmann, W. Prebilsky, P.E. Turk, H. Ying, and J.L. Whitson. 2000. Denitrification in aquaculture systems: an example of a fuzzy logic control problem. Aquacultural Engineering 23: 37-59.
Lewis, W.M., J.H. Yopp, H.L. Schramm, A.M. Brandenburg. 1978. Use of hydroponics
to maintain quality recirculated water in a fish culture system. Transactions of the American Fisheries Society 107: 92-99.
Mariscal-Lagarda, M.M., F. Paez-Osuna, J.L. Esquer-Mendez, I. Guerrero-Monroy, A. Roma del Vivar, and R. Felix-Gastelum. 2012. Integrated culture of white shrimp (Litopenaeus vannamei) and tomato (Lycopersicon esculentum Mill) with low salinity groundwater: Management and production. Aquaculture 366-367: 76-84.
Masser, M.P., J. Rakocy, and T.M. Lasordo. 1999. Recirculating aquaculture tank
production systems, management of recirculating systems. SRAC Pub No. 452. McMurty, M.R., D.C. Sanders, P.V. Nelson, and A. Nash. 1993. Mineral nutrient
concentration and uptake by tomato irrigated with recirculating aquaculture water influenced by quantity of fish waste products supplied. Journal of Plant Nutrition 16: 407-419.
McNeal, B.L., C.D. Stanley, W.D. Graham, P.R. Gilreath, D. Downey, and J.F.
Creighton. 1995. Nutrient-Loss Trends for Vegetable and Citrus Fields in West-Central Florida: I. Nitrate. J. Environ. Qual. 24:95-100
Naylor, S.J., R.D. Moccia, and G.M. Durant. 1999. The chemical composition of
settleable solid fish waste (manure) from commercial rainbow trout farms in Ontario, Canada. North American J. of Aquaculture 61: 21-26.
Naylor, R.L., R.J. Goldburg, J.H. Primavera, N. Kautsky, M.C.M.Beveridge, J. Clay, C. Folke, J. Lubcheno, H. Mooney, and M. Troell. 2000. Effect of aquaculture on world fish supplies. Nature 405: 1017-1024.
Pierce, R.H., J.M. Weeks, and J.M. 1993. Nitrate toxicity to five species of marine
fish. J. of the World Aquaculture Society 24: 105-107. Prapaiwong, N., and C.E. Boyd. 2012. Effluent volume and pollutant loads at an inland,
low-salinity, shrimp farm in Alabama. Aquaculture Engineering 48: 1-5.
Quillere, I., L. Roux, D. Marie, Y. Roux, F. Gosse, and J.F. Morot-Gaudry. 1995. An artificial productive ecosystem based on a fish/bacteria/plant association. 2. Performance. Agriculture, Ecosystems, and Environment 53: 19-30.
Rafiee, G. and C.R. Saad, 2005. Nutrient cycle and sludge production during different
stages of red tilapia (Oreochromis sp.) growth in a recirculating aquaculture system. Aquaculture 244, 109-118.
Rakocy J. E. 1988. Hydroponic lettuce production in a recirculating fish culture system.
Island Perspectives. UVI. AES 5-10. Rakocy, J.E., R.C. Shultz, D.S. Bailey, and E.S. Thoman. 2004. Aquaponic production
of tilapia and basil: Comparing a batch and staggered cropping system. Acta Hort 2004: 63-69.
Rakocy, J.E., J.J. Danaher, D.S. Bailey, and R.C. Shultz. 2005. Development of a biofloc
system for the production of tilapia. University of Arizona. http://ag.arizona.edu/azaqua/ista/ISTA9/FullPapers/Rakocy2.doc last accessed June 10, 2015.
Rakocy, J.E., M.P. Masser, and T.M. Lasordo. 2006. Recirculating Aquaculture Tank
Production Systems: Aquaponics-Integrating Fish and Plant Culture. Southern Regional Aquaculture Center. Publication No. 454.
Rakocy, J.E., and D.S. Bailey, R.C. Shultz, and J.J. Danaher. 2007. Preliminary evaluation of organic waste from two aquaculture systems as a source of inorganic nutrients for hydroponics. Acta Hort 742: 201-207.
Rice, E.W., R.B. Baird, A.D. Eaton,and L.S. Clesci (Eds). 2012. Standard methods for
examination of waer and wastewater, 22nd edition. American Water Works Assn., Washington D.C.
Salazar, F.J., and R.C. Saldana. 2007. Characterization of manures from fish cage farming in Chile. Bioresource Technology 98: 3322-3327.
Sato, S., K.T. Morgan, M. Ozores-Hampton, K. Mahmoud, and E.H. Simonne. 2010.
Nutrient balance and use efficiency in ssandy soils cropped with tomato under seepage irrigation. Soil Sci. Soc. Am. J. 76: 1867-1876.
Savidov, N.A., E. Hutchings, and J.E. Rakocy, J.E. 2007. Fish and plant production in a
recirculating aquaponic system: a new approach to sustainable agriculture in Canada. Acta Hort 742: 209-221.
Schneider, O., A.K. Amirkolaie, J. Vera-Cartas, E.H. Eding, J.W. Schrama, and J.A.J.
Verreth. 2004. Digestibility, faeces recovery, and related carbon, nitrogen and phosphorus balances of five feed ingredients evaluated as fishmeal alternatives in Nile tilapia, Oreochromis niloticus L. Aquaculture Research 35: 1370-1379.
Sharma, B., and R.C. Ahlert. 1977. Nitrification and nitrogen removal. Water Research
11: 897-925. Shaw, N.J., and D.J. Cantliffe, J. Funes, and C. Shine. 2004. Successful Beit Alpha
production in the greenhouse using pine bark as an alternative substrate. HortTechnology 14: 289-294.
Shaw. N.L. and D.J. Cantliffe. 2009. Beit Alpha Cucumber: A new greenhouse crop for
Florida. University of Florida, Institute of Food and Agriculture Sciences. Bulletin HS810.
Silber, A., G. Xu, I. Levkovitch, S. Soriano, A. Bilu, and R. Wallach. 2003. High fertigation frequency: the effects of nutrients, water and plant growth. Plant and Soil 253: 467-477.
Silber, A., M. Bruner, E. Kenig, G. Reshef, H. Zohar, I. Posalski, H. Yehezkel, D.
Shmuel, S. Cohen, M. Dinar, E. Matan, I. Dinkin, Y. Cohen, L. Karni, B. Aloni, and A. Assouline. 2005. High fertigation and phosphorus level: Effects on summer-grown bel pepper growth and blossom-end rot incidence. Plant and Soil 270: 130-146.
104
Sleeper, A.M., J.A.Chappell, J.M. Pickens, W.G. Foshee, III, and J.L. Sibley. 2009.
Integration of intensive aquaculture and greenhouse crop production. Proc. SNA Res. Conf. 54:106-110.
Stanley, C.D., B.L. McNeal, P.R. Gilreath, J.F. Creighton, W.D. Graham, and G. Alverio.
1995. J. Environ. Qual. 24: 101-106. Summerfelt, S.T. P.R. Adler, D.M. Glenn, and R.N. Kretschmann. 1999. Aquaculture
sludge removal and stabilization within created wetlands. Aquacultural Engineering 19: 81-92.
Takeda F., P.R. Adler, and D.M. Glenn. 1997. Strawberry production linked to
Publishing Company LLC, Ithaca, NY. 788. Tyson, R.V., E.H. Simonne, D.D. Treadwell, M. Davis, and J.M. White. 2008. Effect of
water pH on yield and nutritional status of greenhouse cucumber grown in recirculating hydroponics. Journal of Plant Nutrition 31: 2018-2030.
Van Rijn, J., T. Tal, and H.J. Schreier, 2006. Denitrification in recirculating systems:
Theory and applications. Aquaculture Engineering. 34: 364-376 Van Weerd, J.H., Khalaf, K.A., Aartesen, F.J., Tijssen, P.A.T., 1999. Balance trials with
Villaverde, S., P.A. Garcia-Encina, and F. Fdz-Polanco. 1997. Influence of pH over nitrifying biofilm activity in submerged biofilters, Water Research 31: 1180-1186.
Watten, B.J., and R.L. Busch. 1984. Tropical production of Tilapia (Saratherodon aurea)
and Tomatoes (Lycopersicon esculentum) in a small-scale recirculating water system. Aquaculture 41: 271-283.
Whipker, B.E., D.A. Bailey, P.V. Nelson, W.C. Fonteno, and P.A. Hammer, P.A. 1996. A novel approach to calculate acid additions for alkalinity control in greenhouse irrigation water, Communication in Soil Science and Plant Analysis 27: 959-976.
Zweig, R.D., 1986. An integrated fish culture hydroponic vegetable production system. Aquaculture Magazine 34-39.
Xu, G., I. Levkovitch, S. Soriana, R. Wallach, A. Silber. 2004. Integrated effect of
irrigation frequency and phosphorus level on lettuce: P uptake, root growth and yield. Plant and Soil 263:297-309.