Page 1
Scholars' Mine Scholars' Mine
Masters Theses Student Theses and Dissertations
Spring 2010
Integration and characterization of an electrical storage system Integration and characterization of an electrical storage system
for a hydrogen fuel cell plug-in hybrid electric vehicle for a hydrogen fuel cell plug-in hybrid electric vehicle
Edward Alexei Anculle Arauco
Follow this and additional works at: https://scholarsmine.mst.edu/masters_theses
Part of the Mechanical Engineering Commons
Department: Department:
Recommended Citation Recommended Citation Anculle Arauco, Edward Alexei, "Integration and characterization of an electrical storage system for a hydrogen fuel cell plug-in hybrid electric vehicle" (2010). Masters Theses. 6726. https://scholarsmine.mst.edu/masters_theses/6726
This thesis is brought to you by Scholars' Mine, a service of the Missouri S&T Library and Learning Resources. This work is protected by U. S. Copyright Law. Unauthorized use including reproduction for redistribution requires the permission of the copyright holder. For more information, please contact [email protected] .
Page 3
INTEGRATION AND CHARACTERIZATION OF AN ELECTRICAL STORAGE
SYSTEM FOR A HYDROGEN FUEL CELL PLUG-IN HYBRID ELECTRIC
VEHICLE
by
EDWARD ALEXEI ANCULLE ARAUCO
A THESIS
Presented to the Faculty of the Graduate School of the
MISSOURI UNIVERSITY OF SCIENCE AND TECHNOLOGY
In Partial Fulfillment of the Requirements for the Degree
MASTER OF SCIENCE IN MECHANICAL ENGINEERING
2010
Approved by
John W. Sheffield
Frank Liou
Scott E. Grasman
Page 4
iii
2010
Edward Alexei Anculle Arauco
All Rights Reserved
Page 5
iii
ABSTRACT
Hydrogen fuel cell hybrid vehicles are an advance technology that promises to
solve the energy crisis in transportation and green houses emissions. Even more, Plug-in
or extended range vehicles can add diversity in energy sources. Extended range vehicles
have the capability to extract energy from the grid and hence reduce the cost of operation
of the vehicle. EcoCAR: the NeXt Challenge is a Noth American competition with
seventeen schools participating across North America. Missouri S&T is developing a
Fuel Cell Plug-in Hybrid electric vehicle which has a large lithium-ion battery able to
store 16 kWh. The fuel cell powertrain is a GM donated fuel cell which includes an
electric traction motor and three hydrogen storage cylinders. The proposed electrical
storage system consist of five A123 modules which thermal, safety and vibrations
requirements. The present work illustrates all the integration process, describes the
components of the electrical storage system and presents the cost of integration. The case
of the electrical storage system is designed to support 20 g of acceleration for a side and
front crash and 8g of acceleration for a rollover crash, the electrical storage system
modules are vibration isolated with four vibration isolators per module and a failure
analysis is presented. The Missouri S&T prototype is entirely made of aluminum with a
total cost of $40,656, the total weight of the system is 322.65 kg which represents an
energy/weight ratio of 46.59 Wh/kg.
Page 6
iv
ACKNOWLEDGMENTS
I would like to thank my advisor and my friend Dr. John W. Sheffield for his help
and guidance in my Master degree. He encouraged my development in innumerable ways
and I will always be grateful. I would like to thank my professors and committee
members Dr. Frank Liou and Dr. Scott Grasman for their help in the success of this work.
I am grateful to the Mechanical and Aerospace Engineering Department at the
Missouri University of Science and Technology for supporting this project and
supporting the Missouri S&T EcoCAR team.
I would also like to thank the organizers, Frank Falconne, Kristen de la Rosa and
Mike Wahlstrom of the EcoCAR: The NeXt challenge for doing this amazing project.
My infinite gratitude to our GM mentors Chris Graham, Chris Lawrence and Chris
Thomason for their patience and knowledge. A special mention to our sponsors specially
A123 Systems and Bachman Machine Company for their support in the develop of the
battery system.
Missouri S&T EcoCAR team is a dynamic, dedicated and diverse group of people
and between all of them I will always remember my friends Andrew Meintz, Joseph
Ishaku, Vijay Mohan, Aanchal Shah and our team leader Kevin Martin. Moreover, I
would like to mention my everyday friends and constant support of Michelle, Geonsik
and Chrystian.
Finally, this work is dedicated to my parents Huberth and Vilma for the best gift
that they could have ever given me: education.
Page 7
v
TABLE OF CONTENTS
Page
ABSTRACT ....................................................................................................................... iii
ACKNOWLEDGMENTS ................................................................................................. iv
LIST OF ILLUSTRATIONS ............................................................................................ vii
LIST OF TABLES ............................................................................................................. ix
SECTION
1. INTRODUCTION ...................................................................................................... 1
1.1. PROBLEM STATEMENT ................................................................................. 1
1.2. OBJECTIVES ..................................................................................................... 3
1.3. PROBLEM BACKGROUND ............................................................................ 4
1.4. PLUG-IN HYBRID VEHICLE POWERTRAINS ............................................. 7
1.4.1. Parallel PHEV. ......................................................................................... 9
1.4.2. Series PHEV. ........................................................................................ 10
1.5. TRANSPORTATION HYDROGEN FUEL CELL TECHNOLOGY ............. 10
1.6. ADVANCE ELECTRICAL STORAGE SYSTEM ......................................... 14
2. FUEL CELL PLUG-IN HYBRID ELECTRIC VEHICLE ..................................... 16
2.1. ECOCAR: THE NEXT CHALLENGE ............................................................ 16
2.2. VEHICLE ARCHITECTURE DESCRIPTION ............................................... 17
2.2.1. Vehicle Electrical Systems . .................................................................. 20
2.2.2. Vehicle Control Architecture .............................................................. 21
2.2.3. Vehicle Hydrogen Storage System ....................................................... 21
2.2.4. Fuel Cell Power Module ......................................................................... 22
2.2.5. Thermal Systems .................................................................................. 23
2.3. STRUCTURAL MODIFICATION .................................................................. 25
3. ELECTRICAL STORAGE SYSTEM DESIGN ...................................................... 26
3.1. COMPONENTS AND SUBSYSTEMS ........................................................... 26
3.2. ELECTRICAL DESIGN .................................................................................. 30
3.3. MECHANICAL DESIGN ................................................................................ 31
3.3.1. CAD ....................................................................................................... 31
Page 8
vi
3.3.2. Mounting Concept .................................................................................. 35
3.3.3. Structural Analysis ................................................................................ 36
3.3.4. Vibration Analysis .................................................................................. 45
3.4. THERMAL ANALYSIS .................................................................................. 45
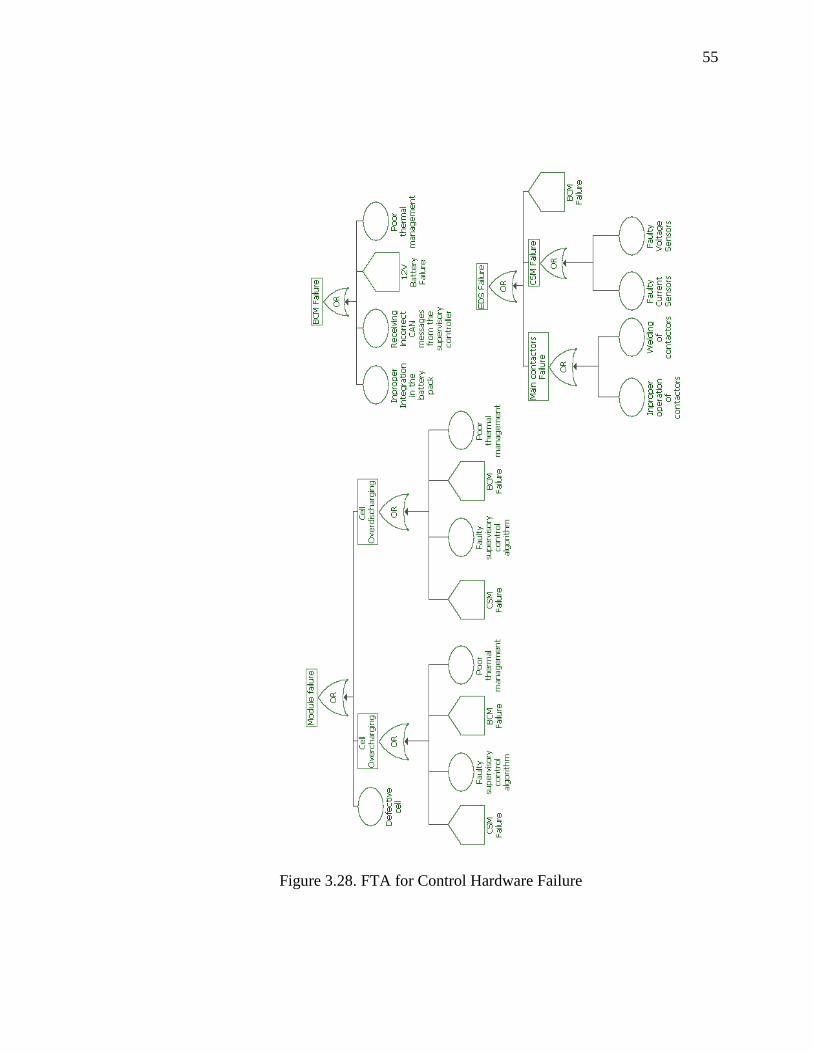
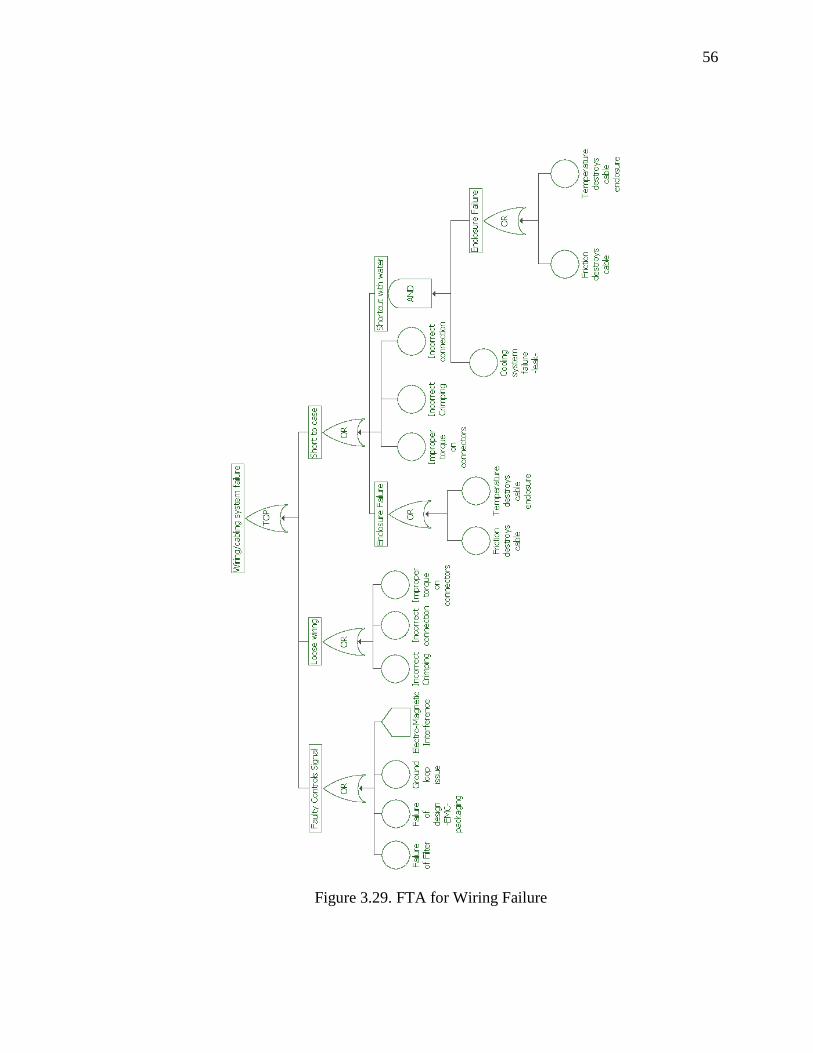
3.5. FAILURE ANALYSIS ..................................................................................... 50
4. COSTS ANALYSIS ................................................................................................. 58
5. CONCLUSIONS AND FUTURE WORK............................................................... 59
APPENDICES .................................................................................................................. 61
A. RUPTURE DISC FOR EXHAUST SYSTEM........................................................ 61
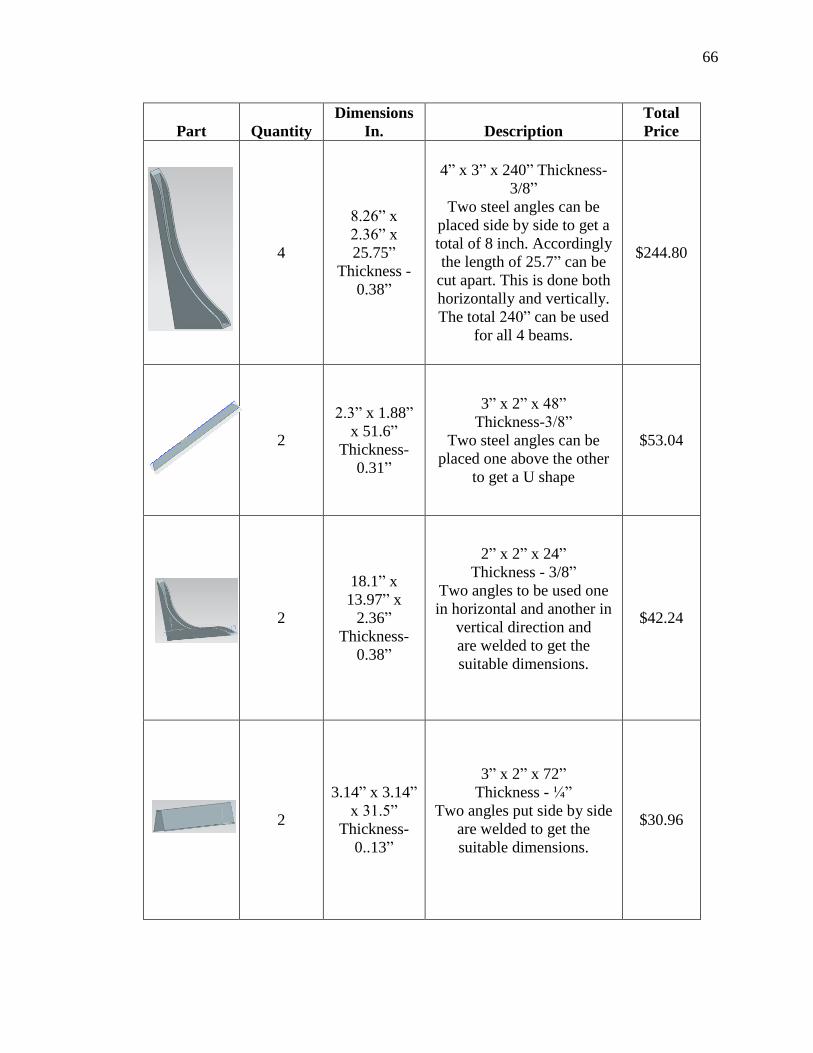
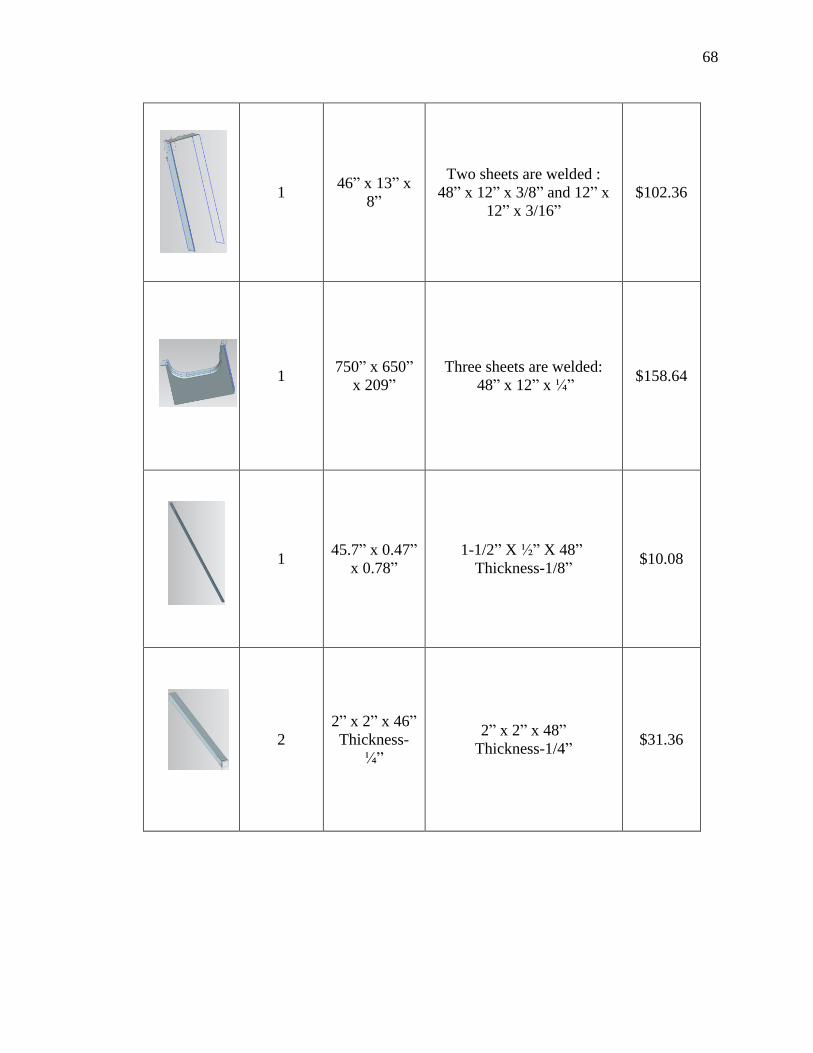
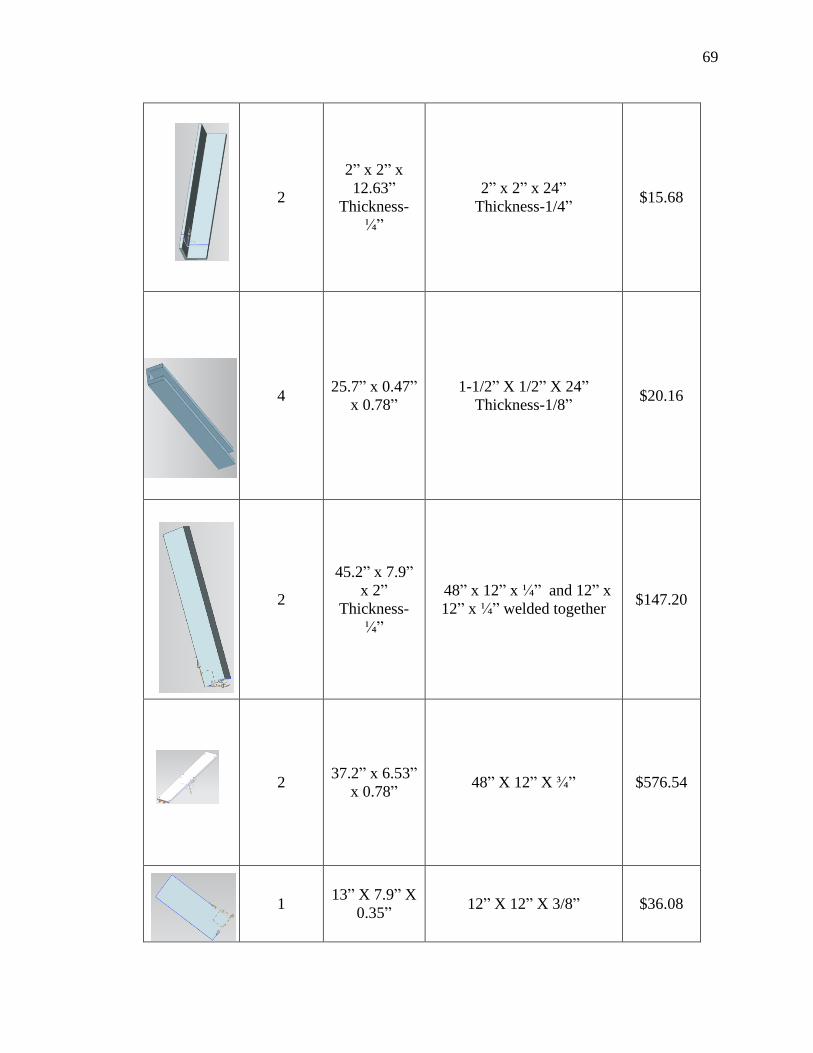
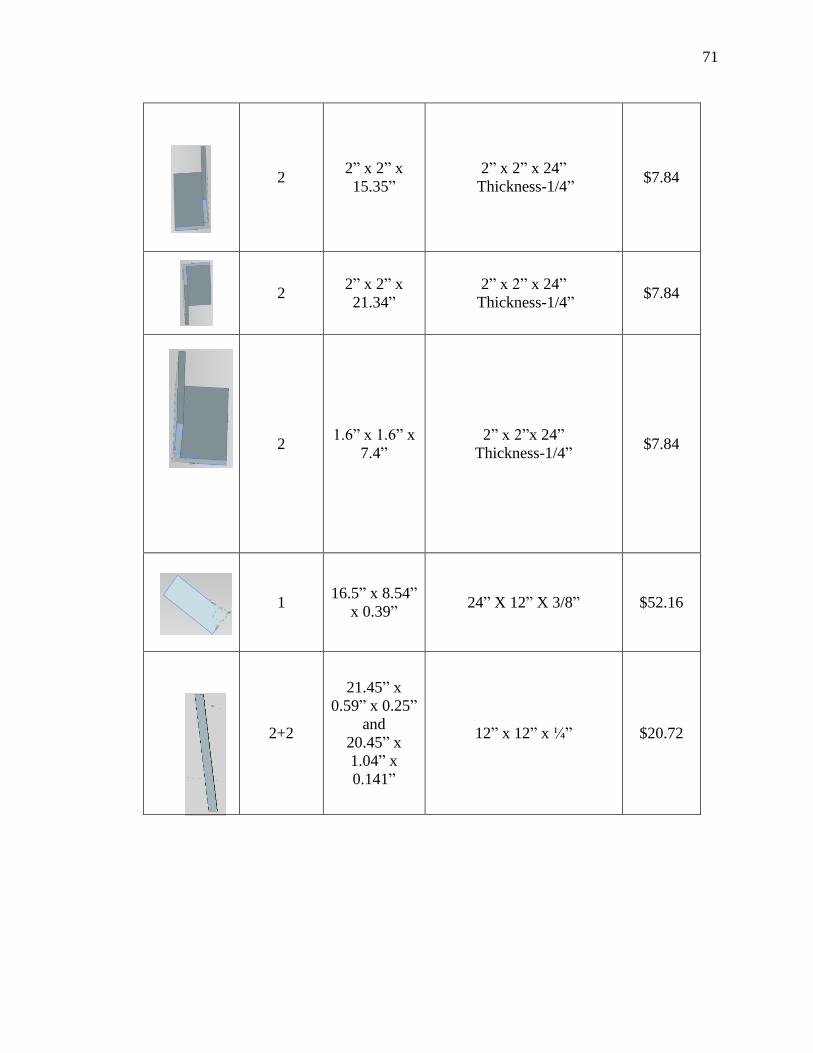
B. MECHANICAL COMPONENTS FOR THE ESS ................................................. 65
BIBLIOGRAPHY ............................................................................................................. 72
VITA ................................................................................................................................ 75
Page 9
vii
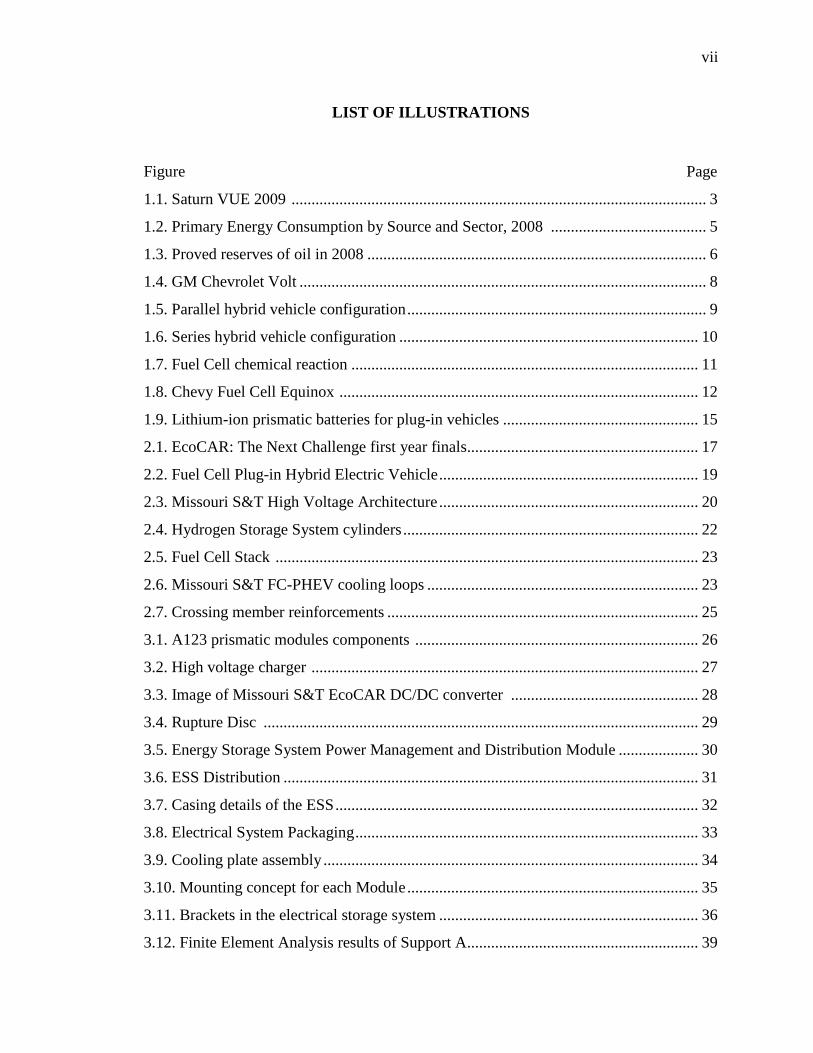
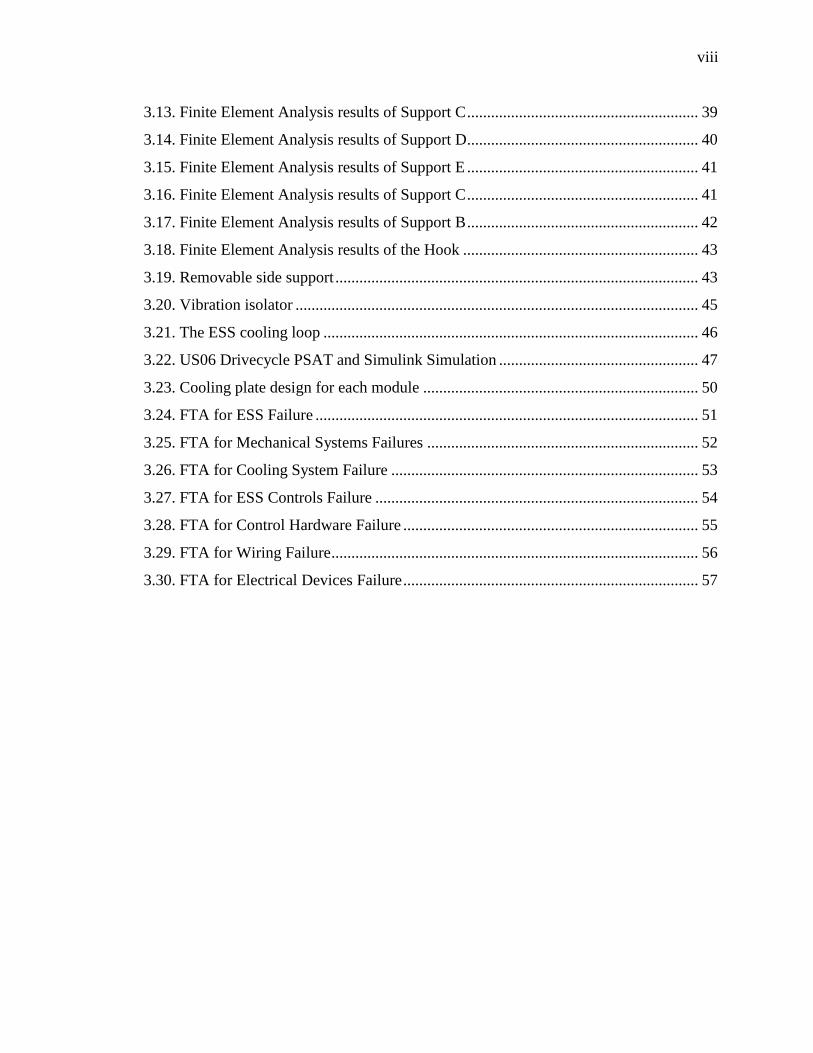
LIST OF ILLUSTRATIONS
Figure Page
1.1. Saturn VUE 2009 ........................................................................................................ 3
1.2. Primary Energy Consumption by Source and Sector, 2008 ....................................... 5
1.3. Proved reserves of oil in 2008 ..................................................................................... 6
1.4. GM Chevrolet Volt ...................................................................................................... 8
1.5. Parallel hybrid vehicle configuration ........................................................................... 9
1.6. Series hybrid vehicle configuration ........................................................................... 10
1.7. Fuel Cell chemical reaction ....................................................................................... 11
1.8. Chevy Fuel Cell Equinox .......................................................................................... 12
1.9. Lithium-ion prismatic batteries for plug-in vehicles ................................................. 15
2.1. EcoCAR: The Next Challenge first year finals.......................................................... 17
2.2. Fuel Cell Plug-in Hybrid Electric Vehicle ................................................................. 19
2.3. Missouri S&T High Voltage Architecture ................................................................. 20
2.4. Hydrogen Storage System cylinders .......................................................................... 22
2.5. Fuel Cell Stack .......................................................................................................... 23
2.6. Missouri S&T FC-PHEV cooling loops .................................................................... 23
2.7. Crossing member reinforcements .............................................................................. 25
3.1. A123 prismatic modules components ....................................................................... 26
3.2. High voltage charger ................................................................................................. 27
3.3. Image of Missouri S&T EcoCAR DC/DC converter ............................................... 28
3.4. Rupture Disc ............................................................................................................. 29
3.5. Energy Storage System Power Management and Distribution Module .................... 30
3.6. ESS Distribution ........................................................................................................ 31
3.7. Casing details of the ESS ........................................................................................... 32
3.8. Electrical System Packaging ...................................................................................... 33
3.9. Cooling plate assembly .............................................................................................. 34
3.10. Mounting concept for each Module ......................................................................... 35
3.11. Brackets in the electrical storage system ................................................................. 36
3.12. Finite Element Analysis results of Support A.......................................................... 39
Page 10
viii
3.13. Finite Element Analysis results of Support C .......................................................... 39
3.14. Finite Element Analysis results of Support D.......................................................... 40
3.15. Finite Element Analysis results of Support E .......................................................... 41
3.16. Finite Element Analysis results of Support C .......................................................... 41
3.17. Finite Element Analysis results of Support B .......................................................... 42
3.18. Finite Element Analysis results of the Hook ........................................................... 43
3.19. Removable side support ........................................................................................... 43
3.20. Vibration isolator ..................................................................................................... 45
3.21. The ESS cooling loop .............................................................................................. 46
3.22. US06 Drivecycle PSAT and Simulink Simulation .................................................. 47
3.23. Cooling plate design for each module ..................................................................... 50
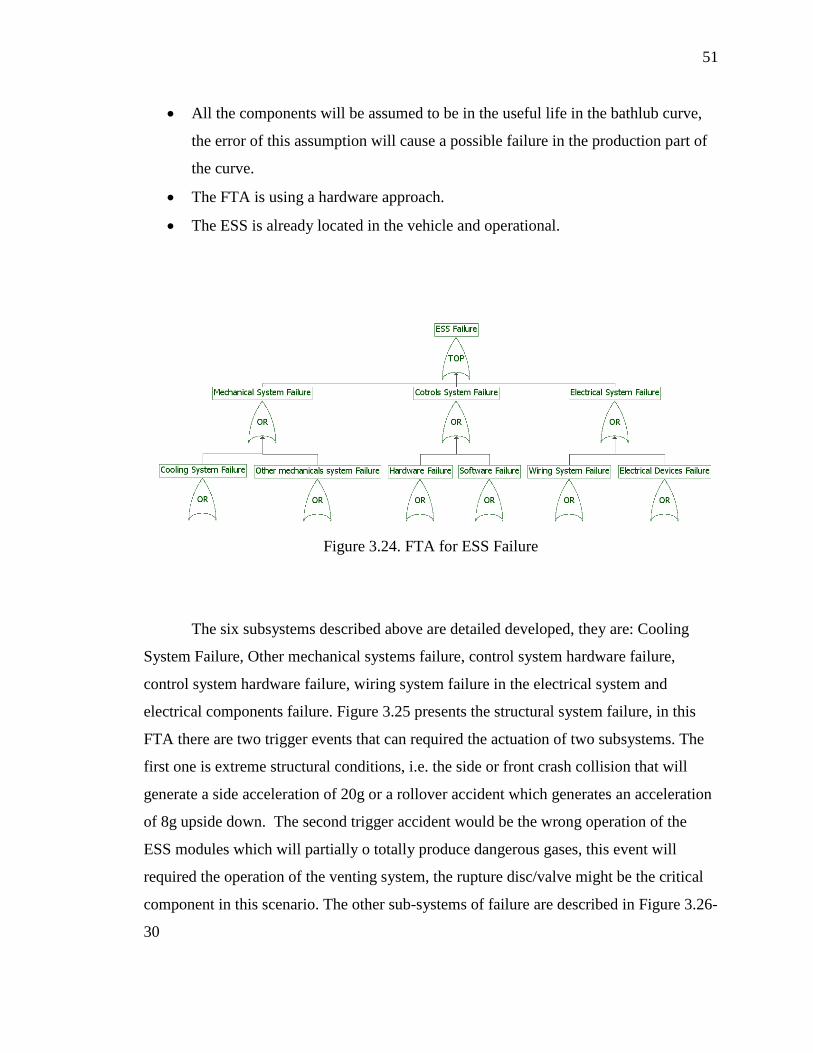
3.24. FTA for ESS Failure ................................................................................................ 51
3.25. FTA for Mechanical Systems Failures .................................................................... 52
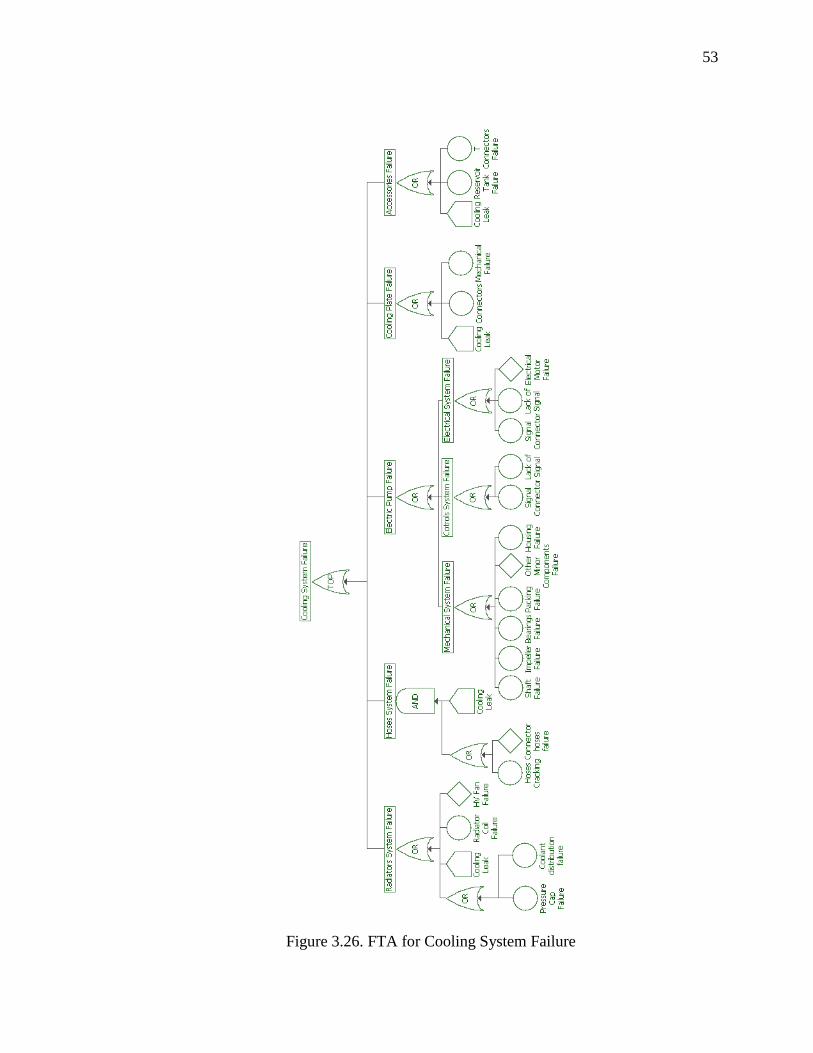
3.26. FTA for Cooling System Failure ............................................................................. 53
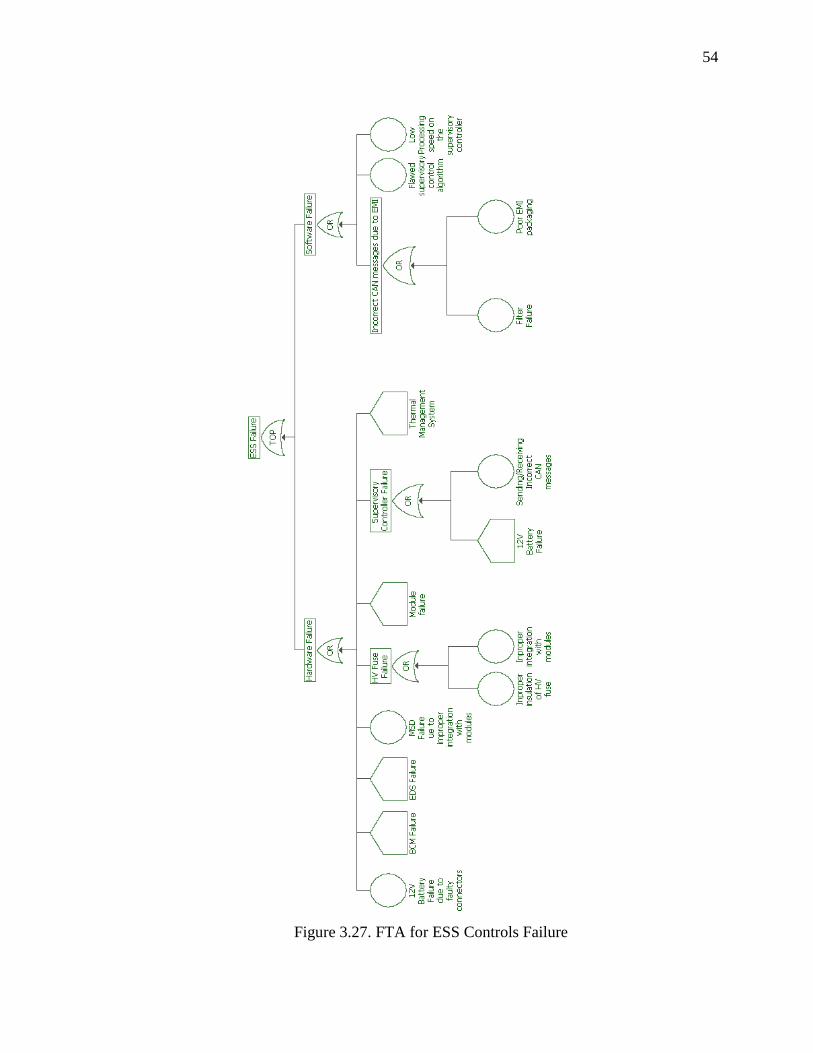
3.27. FTA for ESS Controls Failure ................................................................................. 54
3.28. FTA for Control Hardware Failure .......................................................................... 55
3.29. FTA for Wiring Failure ............................................................................................ 56
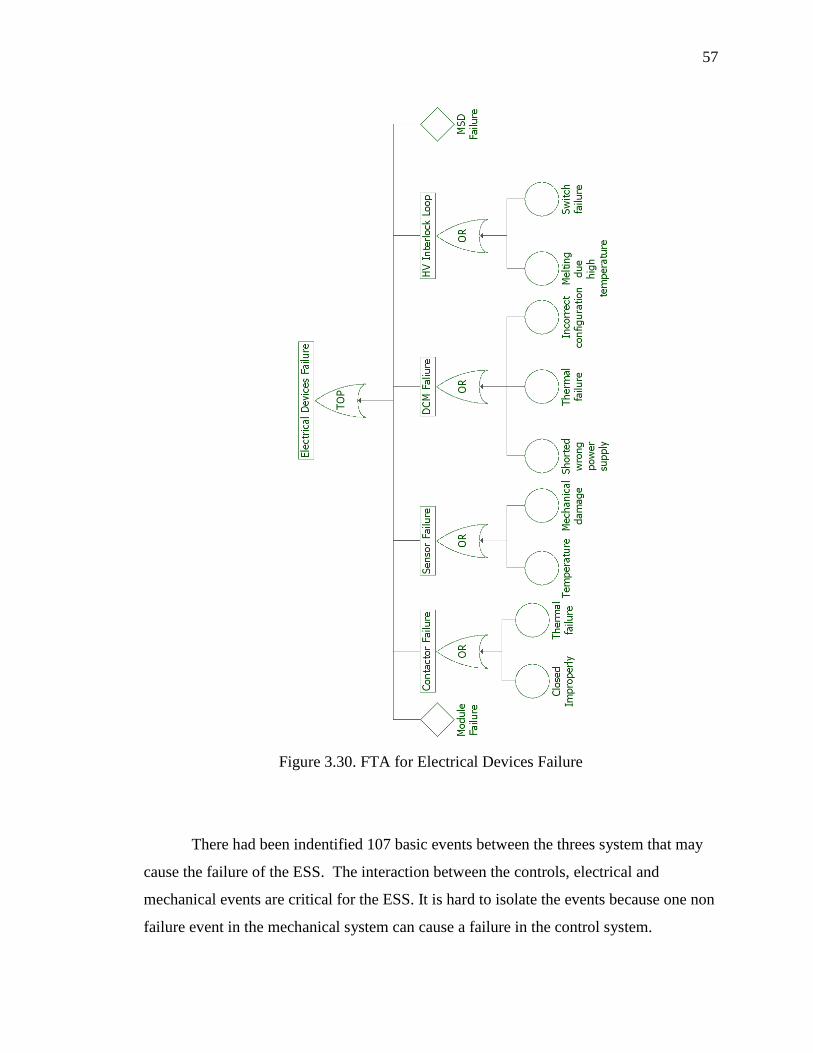
3.30. FTA for Electrical Devices Failure .......................................................................... 57
Page 11
ix
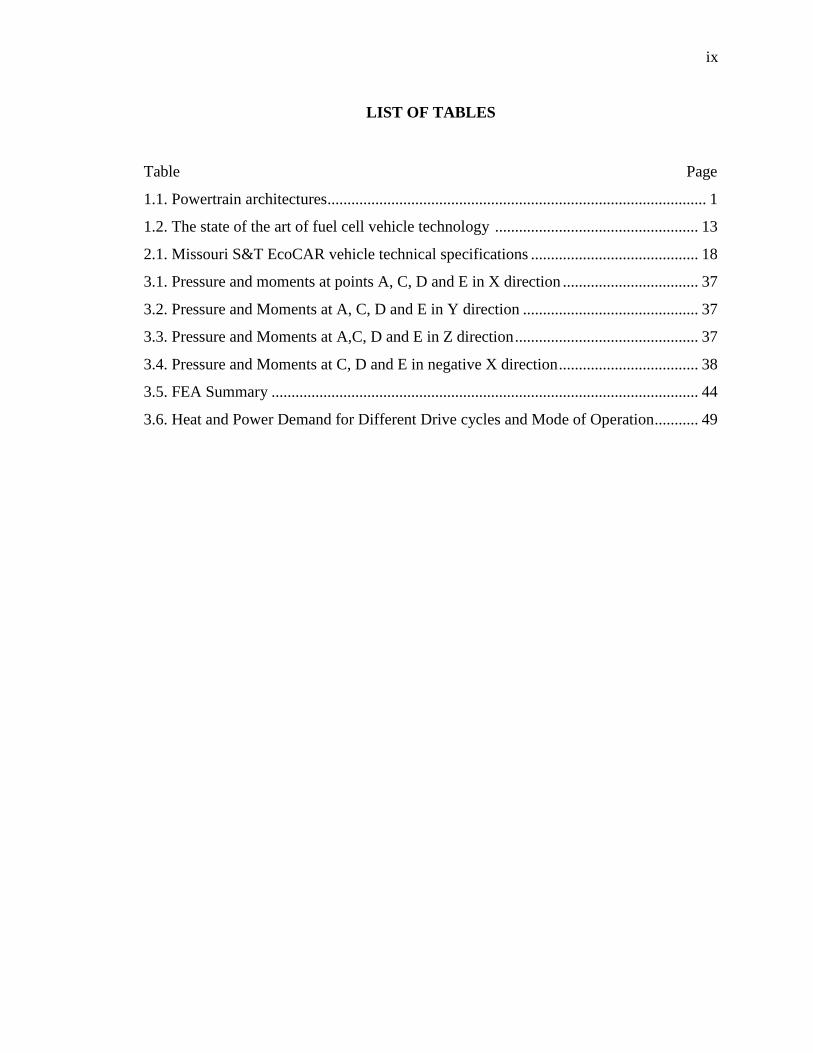
LIST OF TABLES
Table Page
1.1. Powertrain architectures............................................................................................... 1
1.2. The state of the art of fuel cell vehicle technology ................................................... 13
2.1. Missouri S&T EcoCAR vehicle technical specifications .......................................... 18
3.1. Pressure and moments at points A, C, D and E in X direction .................................. 37
3.2. Pressure and Moments at A, C, D and E in Y direction ............................................ 37
3.3. Pressure and Moments at A,C, D and E in Z direction .............................................. 37
3.4. Pressure and Moments at C, D and E in negative X direction ................................... 38
3.5. FEA Summary ........................................................................................................... 44
3.6. Heat and Power Demand for Different Drive cycles and Mode of Operation ........... 49
Page 12
1
1. INTRODUCTION
1.1. PROBLEM STATEMENT
Currently, there is considerable interest around the world in the development of
new vehicle technologies to reduce greenhouse gas emissions and the dependence upon
petroleum. The most promising technology to replace the Internal Combustion Engine
(ICE) is the Hydrogen Fuel Cell. Hydrogen is sometimes considered the ultimate clean
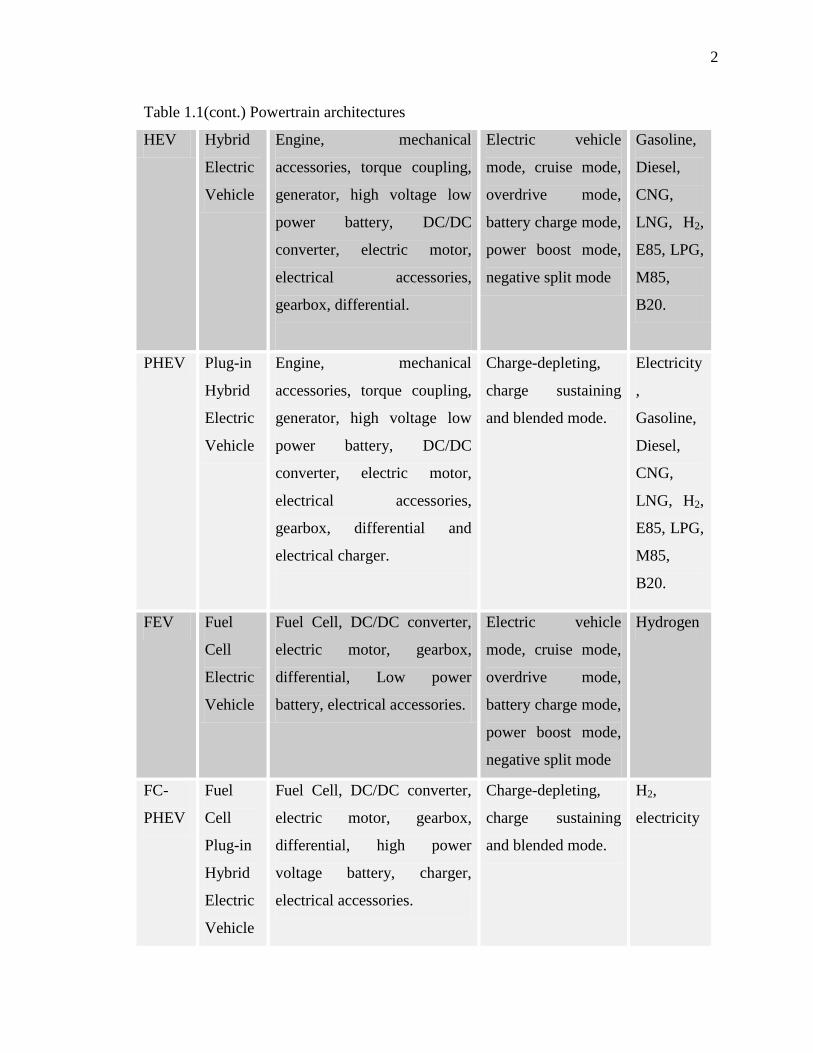
fuel due to its different renewable pathways from which it can be produced. Table 1.1
describes the architecture of different powertrain components according to Powertrain
System Analysis Toolkit (PSAT).
Table 1.1 Powertrain architectures
Name PSAT standard
components
Mode Fuel
ICE
SI CI
Internal
Combustion
Engine
Vehicle
Starter, engine, mechanical
accessories, clutch, gearbox,
differential, torque coupling,
generator, low voltage
battery and electrical
accessories.
Full ICE Gasoline,
Diesel,
CNG,
LNG, H2,
E85, LPG,
M85,
B20.
EV Electric
Vehicle
High voltage power battery,
electric motor, gearbox,
differential, DC/DC
converter and electrical
accessories
Full Electric Electricity
Page 13
2
Table 1.1(cont.) Powertrain architectures
HEV Hybrid
Electric
Vehicle
Engine, mechanical
accessories, torque coupling,
generator, high voltage low
power battery, DC/DC
converter, electric motor,
electrical accessories,
gearbox, differential.
Electric vehicle
mode, cruise mode,
overdrive mode,
battery charge mode,
power boost mode,
negative split mode
Gasoline,
Diesel,
CNG,
LNG, H2,
E85, LPG,
M85,
B20.
PHEV Plug-in
Hybrid
Electric
Vehicle
Engine, mechanical
accessories, torque coupling,
generator, high voltage low
power battery, DC/DC
converter, electric motor,
electrical accessories,
gearbox, differential and
electrical charger.
Charge-depleting,
charge sustaining
and blended mode.
Electricity
,
Gasoline,
Diesel,
CNG,
LNG, H2,
E85, LPG,
M85,
B20.
FEV Fuel
Cell
Electric
Vehicle
Fuel Cell, DC/DC converter,
electric motor, gearbox,
differential, Low power
battery, electrical accessories.
Electric vehicle
mode, cruise mode,
overdrive mode,
battery charge mode,
power boost mode,
negative split mode
Hydrogen
FC-
PHEV
Fuel
Cell
Plug-in
Hybrid
Electric
Vehicle
Fuel Cell, DC/DC converter,
electric motor, gearbox,
differential, high power
voltage battery, charger,
electrical accessories.
Charge-depleting,
charge sustaining
and blended mode.
H2,
electricity
Page 14
3
In order to ensure the consumer acceptability an extensive analysis must be
performed to correctly integrate the different components of the fuel cell hybrid vehicle.
Charge depleting hybrid vehicles however have a bigger challenge with the large
electrical storage system requirements.
1.2. OBJECTIVES
This work presents the mechanical integration of the several components of an
electrical storage system in an extended range fuel cell hybrid vehicle. The work was
realized in parallel with the design and integration of the Missouri S&T Fuel Cell Plug-in
Hybrid Electric Vehicle (FC-PHEV).
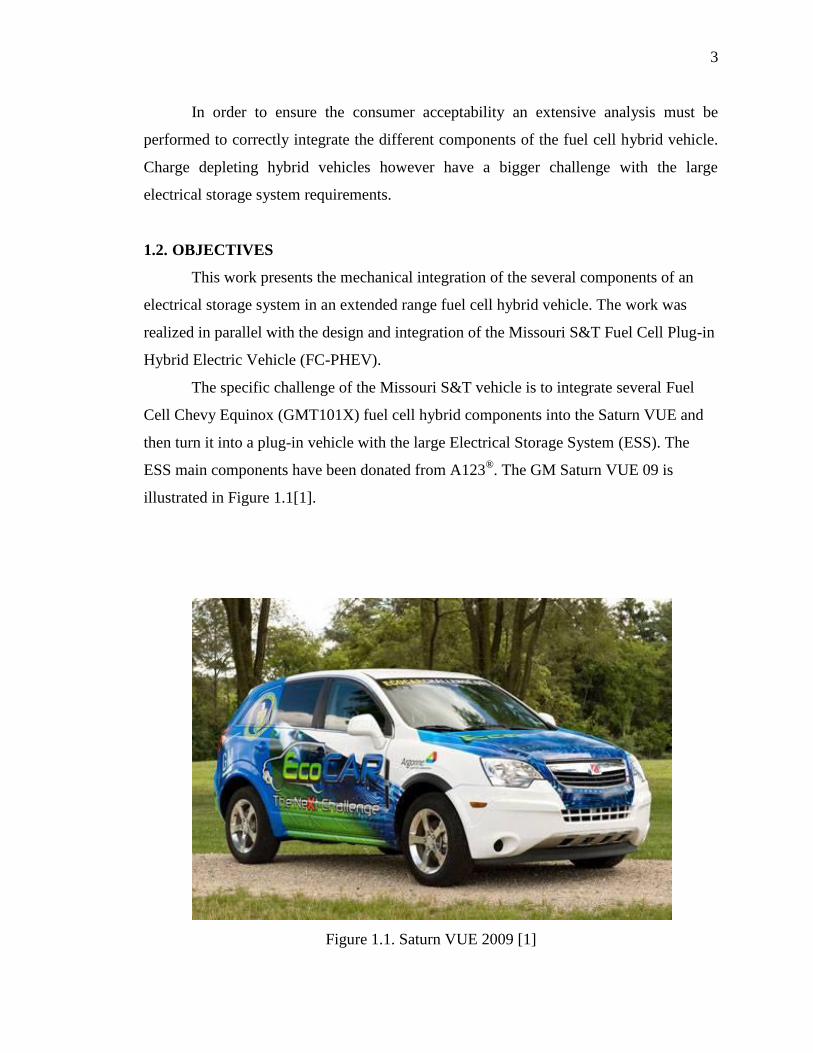
The specific challenge of the Missouri S&T vehicle is to integrate several Fuel
Cell Chevy Equinox (GMT101X) fuel cell hybrid components into the Saturn VUE and
then turn it into a plug-in vehicle with the large Electrical Storage System (ESS). The
ESS main components have been donated from A123®. The GM Saturn VUE 09 is
illustrated in Figure 1.1[1].
Figure 1.1. Saturn VUE 2009 [1]
Page 15
4
The components of the ESS and devices for the correct operation are extensively
described in the present document, furthermore the packaging of the ESS assembly with
all the mechanical constraints are analyzed.
1.3. PROBLEM BACKGROUND
Around the world, energy crisis, air pollution and Green House Gases (GHG)
emissions due to dependence upon fossil fuels, have generated a big concern and has
become a serious problem in human development.
In 2006, most of the world’s marketed energy used was produced by liquid fuels
followed by coal and natural gas representing almost 88% of the share [2]. This means
that most of all the energy used in the world is non-renewable energy. The United States
of America follows the same distribution, the petroleum supplies 10.87 × 10¹²
kWh,
natural gas 6.97 × 10¹²
kWh and coal 6.59× 10¹²
kWh. Furthermore, 71% of the total
petroleum energy is used for transportation which represents the 95% of the total energy
used in transportation [3].Figure 1.2 illustrates the supply sources of energy as well as the
demand sectors. Transportation uses almost all energy from petroleum and it represents a
large portion of the total energy used in the country. Finally, the depleting of petroleum is
causing a significant increase in its price, for example the price of a barrel of petroleum
on July 2008 was $135, significantly higher than the price of $30 on January 2003. [4]
The main GHG are water vapor (H2O), carbon dioxide (CO2), methane (CH4),
nitrous oxide (N2O), ozone (O3) and chlorofluorocarbons (CFC). CFC is an organic
compound that contains carbon, chlorine and fluorine. The component that contributes
more to the green house effect is the water vapor followed closely by the carbon dioxide.
However, carbon dioxide is the component that had grown more in the last century, since
the global fossil carbon emissions in 1900 was less than a half of thousand million metric
tons of carbon but in 2008 the emissions were 8 thousand million of metric tons. This
represents an increase of 1600% [5].
Page 16
5
Figure 1.2. Primary Energy Consumption by Source and Sector, 2008 (Quadrillion BTU)
The warming effect on our climate due to increase of GHG, mainly carbon
dioxide, is a fact widely accepted in the scientific community [6]. The effects that global
warming have on the ecosystem and economy, have been modeled and are predicted to
be severe, including increased tropical storms, droughts, and floods [7]. Poor air quality
in urban areas caused by vehicle emissions has a significant negative impact on human
health [8]. In United States of America, 35% of the transportation greenhouse gas
emissions are produced by passenger cars followed by the light trucks with 27%, heavy-
duty vehicles with 19% and aircraft with 9%. [9]
Page 17
6
The U.S.A’s light-duty vehicle fleet consists of approximately 135 million cars
and 100 million light-trucks which include pick-ups, minivans and sport utility vehicles
(SUVs). New sales in 2006 totaled to nearly 16.6 million units, comprising 81 million
passenger cars and 8.5 million light-trucks, or approximately 7 percent of the total LDV
fleet [10]. In 20th
century the original reason for using petroleum derivates as the main
fuel for transportation was the easy extraction, availability and transportation. However,
now the demand of this energy source is really large and its proved reserves are mainly in
countries with political issues. Moreover, its huge supplies are concentrated in a specific
area of the world which creates huge issues in transportation and distribution. For
example, while in the United States of America there were 30.5 thousand million of
barrels in 2008, in Saudi Arabia there was 264.2 thousand million barrels of oil [11]. This
comparison is only in energy, however for extraction purposes, power is an additional
constraint for continuously using this source of energy.
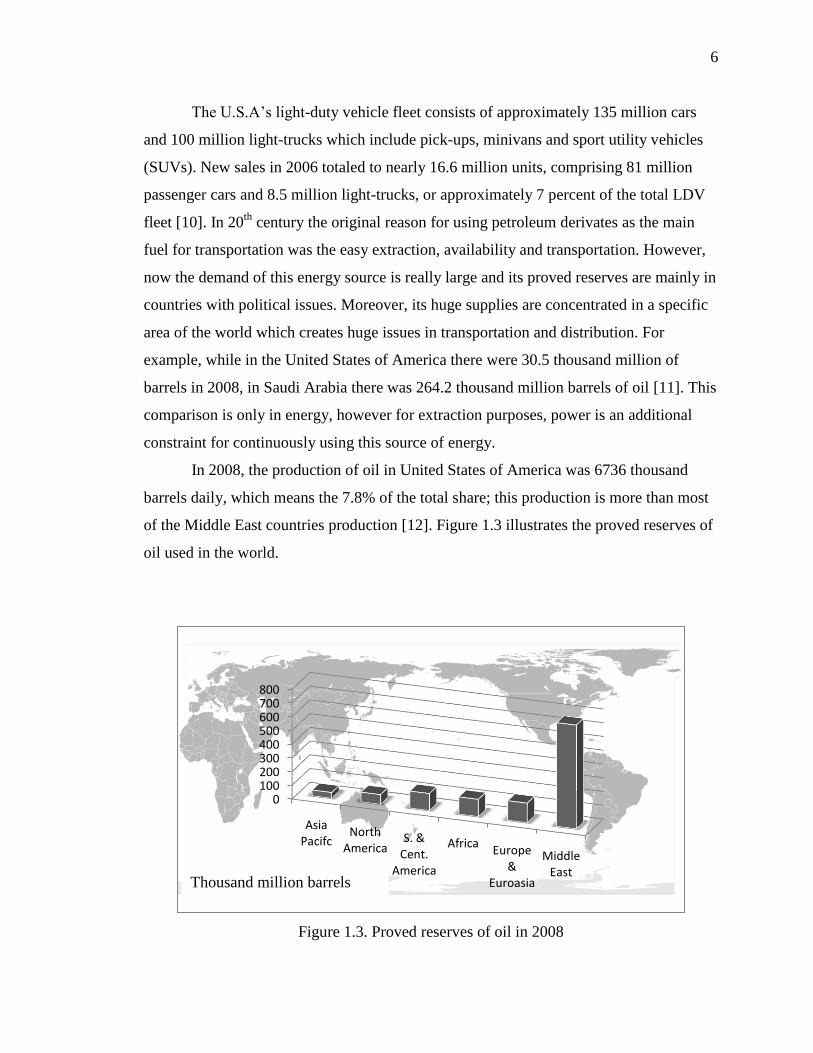
In 2008, the production of oil in United States of America was 6736 thousand
barrels daily, which means the 7.8% of the total share; this production is more than most
of the Middle East countries production [12]. Figure 1.3 illustrates the proved reserves of
oil used in the world.
Figure 1.3. Proved reserves of oil in 2008
0100200300400500600700800
Asia Pacifc
North America
S. & Cent.
America
AfricaEurope
& Euroasia
Middle East
Thoused million barrels of oilThousand million barrels
Page 18
7
1.4. PLUG-IN HYBRID VEHICLE POWERTRAINS
The Institute of Electrical and Electronics Engineers (IEEE) defines Plug-in
Hybrid Electric Vehicles PHEV as a car, truck or other vehicle that can be driven solely
by an electric motor for at least ten miles without consuming any gasoline (called a
“PHEV-10”), and with batteries that can be recharged by plugging it into a wall outlet.
[13]
The PHEV has several advantages over regular vehicles. It has better fuel
efficiency, significantly reduces the GHG, reduces operating costs, better mileage than all
electric vehicles, reduces smog and has the plug-in capability which improves the use of
electricity.
PHEVs are considered more energy efficient vehicles because they can be
charged during off peak periods, and are equipped with technology to shut off charging
during periods of peak demand. Finally, extended range vehicles have the ability to load
balance and help the grid during the peak loads. This is accomplished with the vehicle to
grid technology (V2G) By using excess battery capacity to send power back into the grid
and then recharging during off peak times using cheaper power, such vehicles are
actually advantageous to utilities as well as their owners.
Even if such vehicles just led to an increase in the use of night time electricity
they would even out electricity demand which is typically higher in the day time, and
provide a greater return on capital for electricity infrastructure [14].
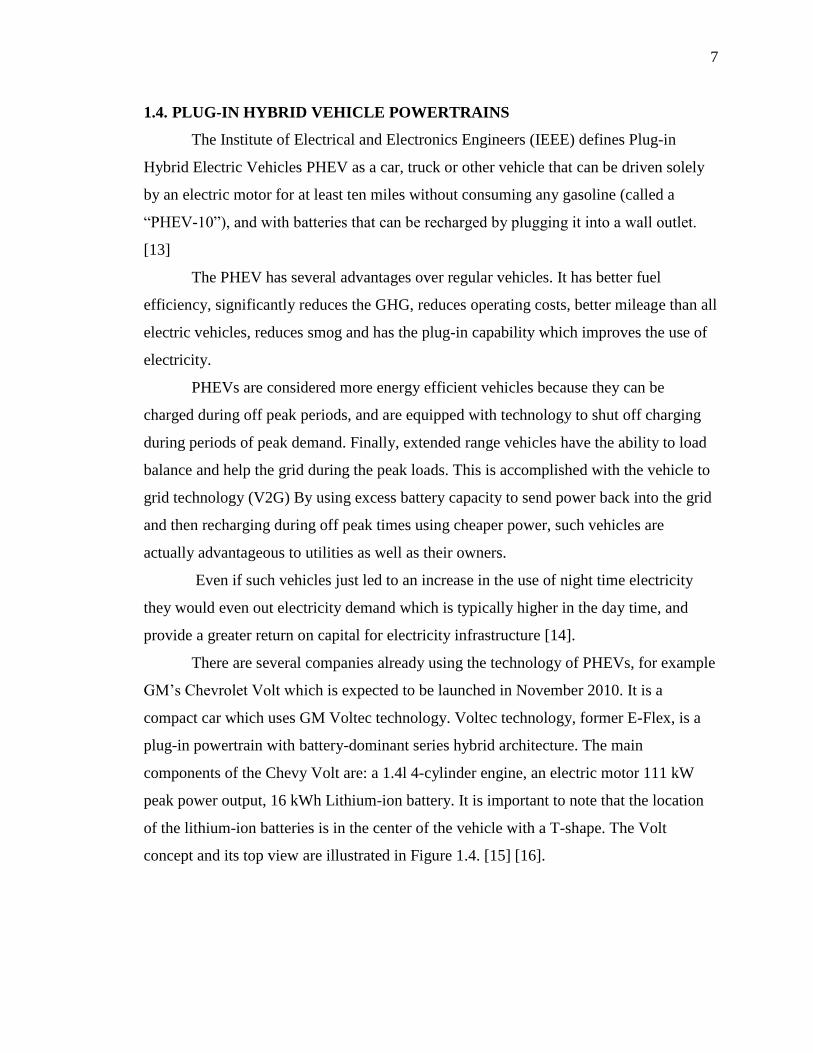
There are several companies already using the technology of PHEVs, for example
GM’s Chevrolet Volt which is expected to be launched in November 2010. It is a
compact car which uses GM Voltec technology. Voltec technology, former E-Flex, is a
plug-in powertrain with battery-dominant series hybrid architecture. The main
components of the Chevy Volt are: a 1.4l 4-cylinder engine, an electric motor 111 kW
peak power output, 16 kWh Lithium-ion battery. It is important to note that the location
of the lithium-ion batteries is in the center of the vehicle with a T-shape. The Volt
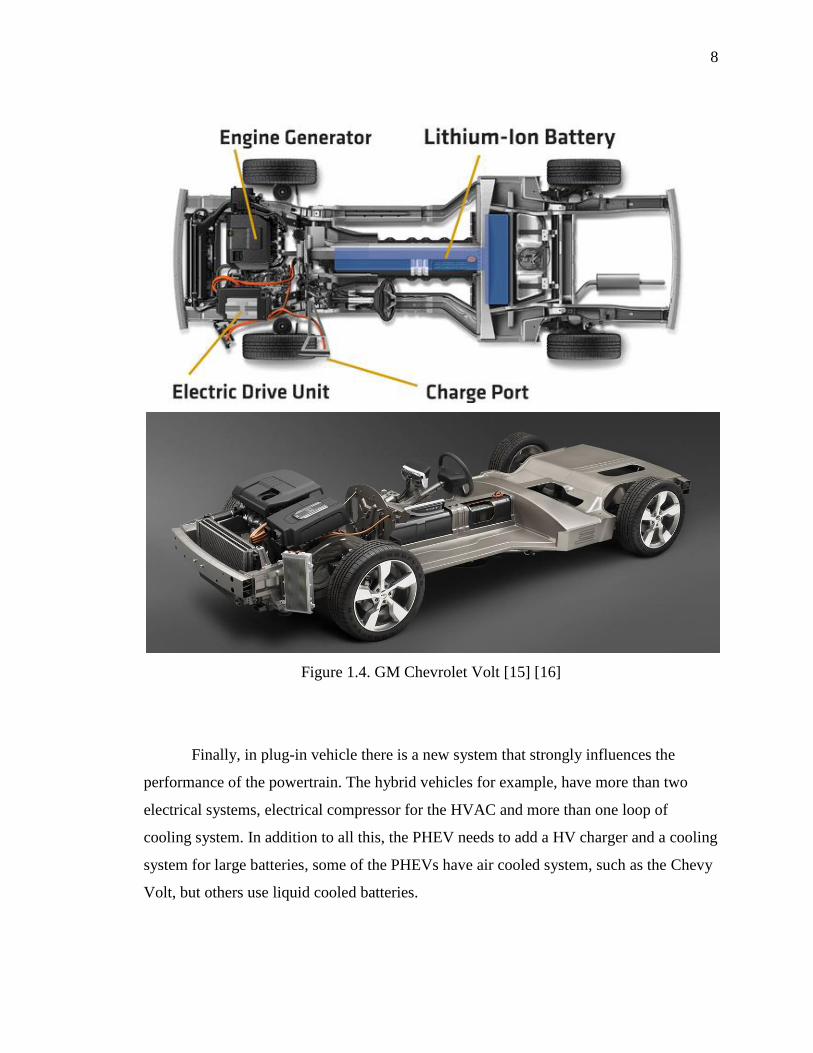
concept and its top view are illustrated in Figure 1.4. [15] [16].
Page 19
8
Figure 1.4. GM Chevrolet Volt [15] [16]
Finally, in plug-in vehicle there is a new system that strongly influences the
performance of the powertrain. The hybrid vehicles for example, have more than two
electrical systems, electrical compressor for the HVAC and more than one loop of
cooling system. In addition to all this, the PHEV needs to add a HV charger and a cooling
system for large batteries, some of the PHEVs have air cooled system, such as the Chevy
Volt, but others use liquid cooled batteries.
Page 20
9
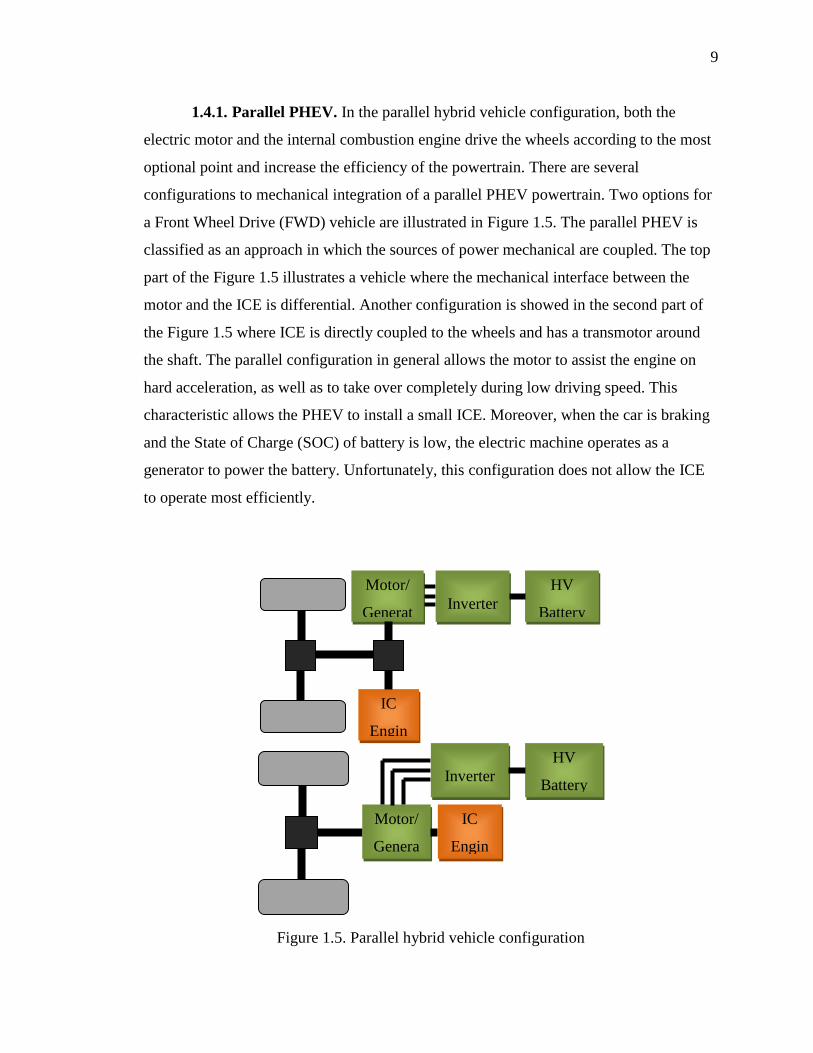
1.4.1. Parallel PHEV. In the parallel hybrid vehicle configuration, both the
electric motor and the internal combustion engine drive the wheels according to the most
optional point and increase the efficiency of the powertrain. There are several
configurations to mechanical integration of a parallel PHEV powertrain. Two options for
a Front Wheel Drive (FWD) vehicle are illustrated in Figure 1.5. The parallel PHEV is
classified as an approach in which the sources of power mechanical are coupled. The top
part of the Figure 1.5 illustrates a vehicle where the mechanical interface between the
motor and the ICE is differential. Another configuration is showed in the second part of
the Figure 1.5 where ICE is directly coupled to the wheels and has a transmotor around
the shaft. The parallel configuration in general allows the motor to assist the engine on
hard acceleration, as well as to take over completely during low driving speed. This
characteristic allows the PHEV to install a small ICE. Moreover, when the car is braking
and the State of Charge (SOC) of battery is low, the electric machine operates as a
generator to power the battery. Unfortunately, this configuration does not allow the ICE
to operate most efficiently.
Figure 1.5. Parallel hybrid vehicle configuration
IC
Engin
e
Motor/
Genera
tor
Inverter
HV
Battery
IC
Engin
e
Motor/
Generat
or
Inverter
HV
Battery
Page 21
10
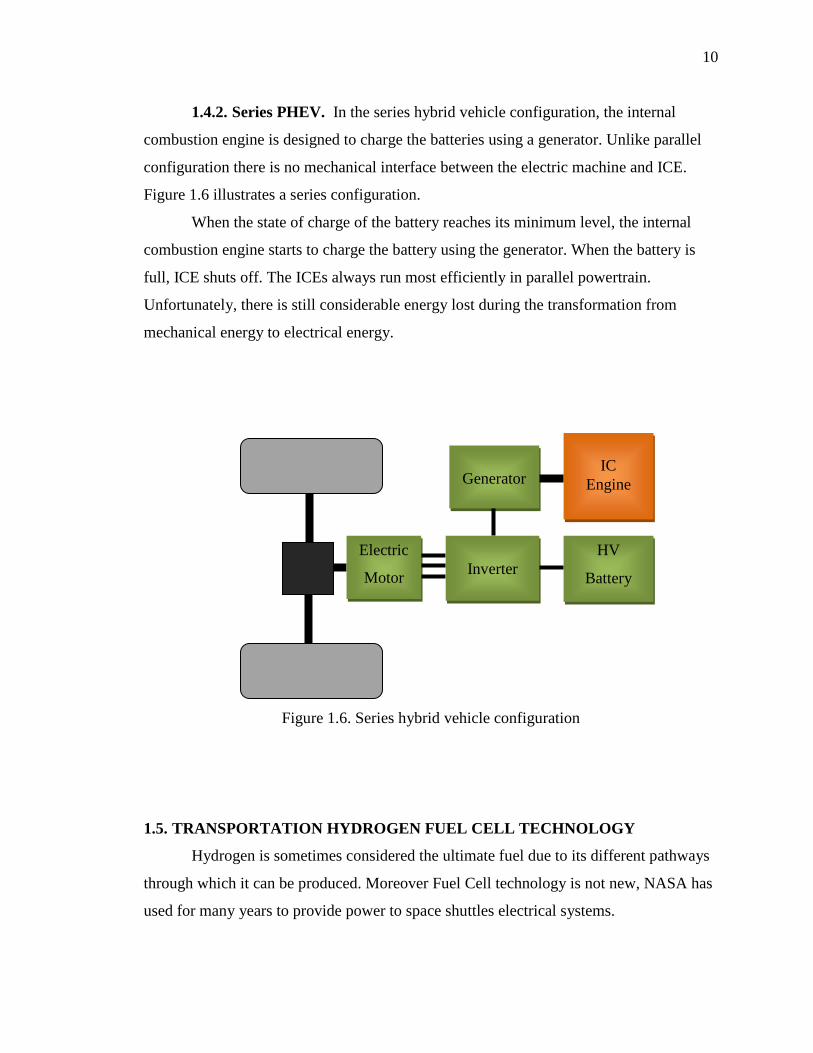
1.4.2. Series PHEV. In the series hybrid vehicle configuration, the internal
combustion engine is designed to charge the batteries using a generator. Unlike parallel
configuration there is no mechanical interface between the electric machine and ICE.
Figure 1.6 illustrates a series configuration.
When the state of charge of the battery reaches its minimum level, the internal
combustion engine starts to charge the battery using the generator. When the battery is
full, ICE shuts off. The ICEs always run most efficiently in parallel powertrain.
Unfortunately, there is still considerable energy lost during the transformation from
mechanical energy to electrical energy.
Figure 1.6. Series hybrid vehicle configuration
1.5. TRANSPORTATION HYDROGEN FUEL CELL TECHNOLOGY
Hydrogen is sometimes considered the ultimate fuel due to its different pathways
through which it can be produced. Moreover Fuel Cell technology is not new, NASA has
used for many years to provide power to space shuttles electrical systems.
IC
Engine
Generator
Electric
Motor
Inverter
HV
Battery
Page 22
11
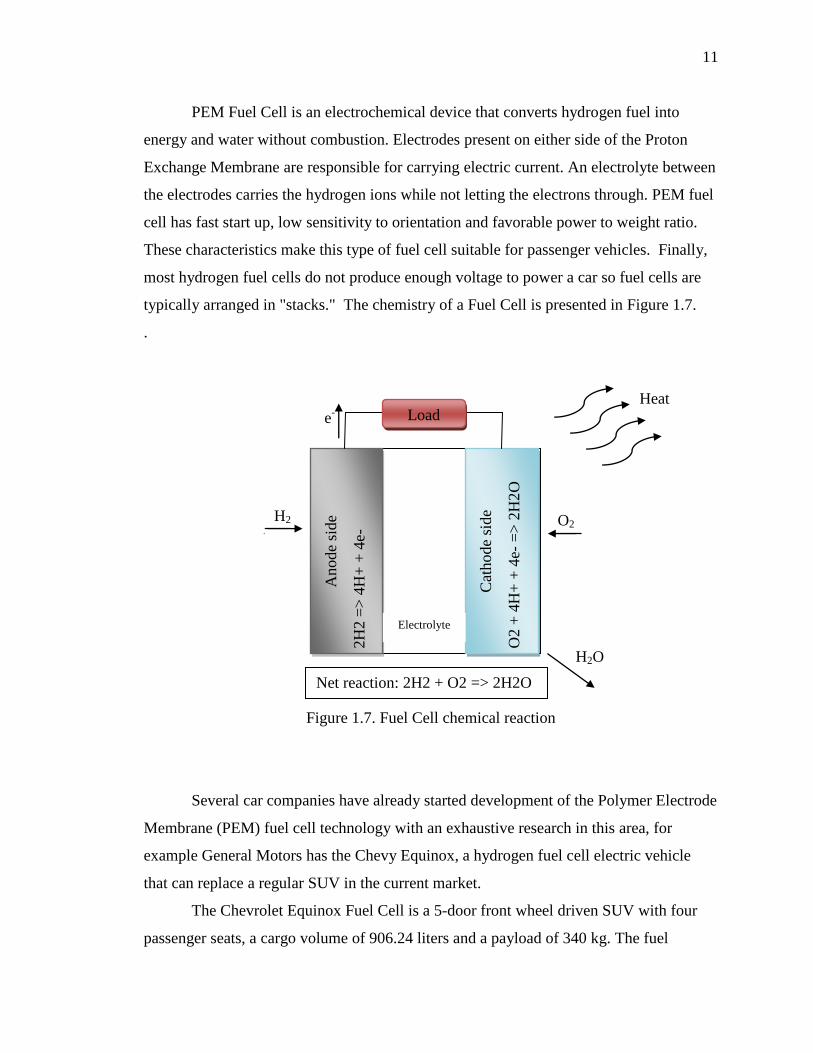
PEM Fuel Cell is an electrochemical device that converts hydrogen fuel into
energy and water without combustion. Electrodes present on either side of the Proton
Exchange Membrane are responsible for carrying electric current. An electrolyte between
the electrodes carries the hydrogen ions while not letting the electrons through. PEM fuel
cell has fast start up, low sensitivity to orientation and favorable power to weight ratio.
These characteristics make this type of fuel cell suitable for passenger vehicles. Finally,
most hydrogen fuel cells do not produce enough voltage to power a car so fuel cells are
typically arranged in "stacks." The chemistry of a Fuel Cell is presented in Figure 1.7.
.
Figure 1.7. Fuel Cell chemical reaction
Several car companies have already started development of the Polymer Electrode
Membrane (PEM) fuel cell technology with an exhaustive research in this area, for
example General Motors has the Chevy Equinox, a hydrogen fuel cell electric vehicle
that can replace a regular SUV in the current market.
The Chevrolet Equinox Fuel Cell is a 5-door front wheel driven SUV with four
passenger seats, a cargo volume of 906.24 liters and a payload of 340 kg. The fuel
Anode
side
2H
2 =
> 4
H+
+ 4
e-
Cat
hode
side
O2 +
4H
+ +
4e-
=>
2H
2O
Load
Net reaction: 2H2 + O2 => 2H2O
e-
H2 O2
H2O
Electrolyte
Heat
Page 23
12
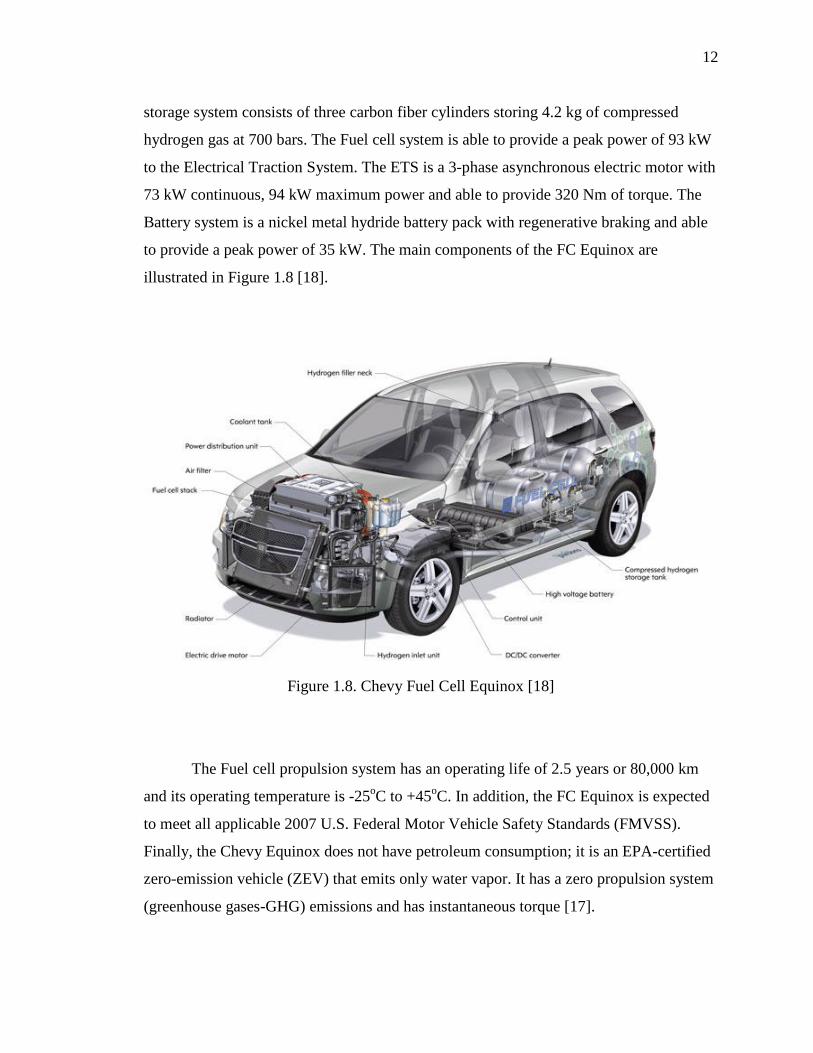
storage system consists of three carbon fiber cylinders storing 4.2 kg of compressed
hydrogen gas at 700 bars. The Fuel cell system is able to provide a peak power of 93 kW
to the Electrical Traction System. The ETS is a 3-phase asynchronous electric motor with
73 kW continuous, 94 kW maximum power and able to provide 320 Nm of torque. The
Battery system is a nickel metal hydride battery pack with regenerative braking and able
to provide a peak power of 35 kW. The main components of the FC Equinox are
illustrated in Figure 1.8 [18].
Figure 1.8. Chevy Fuel Cell Equinox [18]
The Fuel cell propulsion system has an operating life of 2.5 years or 80,000 km
and its operating temperature is -25oC to +45
oC. In addition, the FC Equinox is expected
to meet all applicable 2007 U.S. Federal Motor Vehicle Safety Standards (FMVSS).
Finally, the Chevy Equinox does not have petroleum consumption; it is an EPA-certified
zero-emission vehicle (ZEV) that emits only water vapor. It has a zero propulsion system
(greenhouse gases-GHG) emissions and has instantaneous torque [17].
Page 24
13
Furthermore, the state of art of the fuel cell vehicles is presented in Table 1.2 [19].
As it can be seen all the important automotive companies around the world had already
started the development of this zero emissions powertrain.
Table 1.2. The state of the art of fuel cell vehicle technology [19]
Manufacturer Vehicle Hybrid Features
DaimlerChrysler Modified Mercedes-Benz
A-Class "F-Cell"
65 kW drive motor, 350 bar
storage, 150 km range
Ford Motor Modified Ford Focus
"FCV"
85 kW fuel cell, NiMH
battery, 300 km range
General Motors Modified Chevrolet
Equinox "Equinox Fuel
Cell"
93 kW fuel cell, 35kW
NiMH battery, 320 km
range
Honda Custom Honda "FCX" 80 kW drive motors, ultra
capacitors, 430 km range
Hyundai Modified Hyundai Tucson
"FCEV"
80 kW drive motors, NiMH
battery, 300 km range
Nissan Modified Nissan X-TRAIL
"FCV"
85 kW drive motors, Lion
battery, 350 km range
Toyota Modified Toyota
Highlander "FCV"
82 kW drive motors, NiMH
battery, 330 km range
The conclusion is fuel cell hybrid electric vehicles technologies are in an
advanced stage. However, there are still several obstacles which include technical and
political issues. Moreover, the hydrogen storage systems for the vehicle range and fuel
cell stack mass production are the topics on research and development.
Page 25
14
1.6. ADVANCE ELECTRICAL STORAGE SYSTEM
The success of hybrid vehicles technology is primarily due to energy storage
systems. There are several energy storage systems that can be applied for the PHEV,
which includes ultra capacitors, flow batteries, Ni-Cd batteries, Ni-H2 batteries and
recently lithium ion batteries. Li-ion offer potential advantages in energy density, high
discharge voltage, high efficiency of charge/discharge and power density [20] [21].
Moreover, ultra capacitors represent a reliable alternative for FC-PHEV.
Simulations indicate that fuel-efficient hybrid-electric vehicles can be designed using
either batteries or ultra capacitors and that the decision between the two technologies is
dependent on their cost and useful life [22]. Some of the disadvantages of the ultra
capacitors are low energy density compared with Li-ion batteries, low working voltage
and variable voltage which leads to a more complex power electronics. In a FC-PHEV
where the powertrain has large and heavy components the use of ultra-capacitor would
increase the weight of the vehicle.
A Lithium-ion battery is a type of rechargeable battery in which lithium ions
move from the anode to cathode during discharge, and from the cathode to the anode
when charged. Different types of lithium-ion batteries use different chemistry and have
different performance, cost, and safety characteristics. Unlike primary lithium batteries,
lithium-ion cells use an intercalated lithium compound as the electrode material instead
of metallic lithium [23]. The technical characteristics of the current Li-ion battery
technology are energy/weight 100-160 Wh/kg, energy/size 250-360 Wh/l, power/weight
250-340 W/kg and charge/discharge efficiency 80-90%.
As a chemical device, lithium-ion batteries can ignite when are exposed to high-
temperature or have a short circuiting. For this reason they normally contain safety
devices that protect the cells from abuse and to protect users.
A123 System is a leading company on lithium-ion batteries for hybrid and plug-in
hybrid vehicles. They offer several types of lithium-ion cylindrical and prismatic
configuration such as 18650 cells, 26650 cells, 32113 cells and 20Ah prismatic cells.
Figure 1.9 [24] [25] illustrates an A123 prismatic cell assembled in a cell which is a basic
component for extended range vehicles electrical storage systems.
Page 26
15
Figure 1.9. Lithium-ion prismatic batteries for plug-in vehicles [24] [25]
Page 27
16
2. FUEL CELL PLUG-IN HYBRID ELECTRIC VEHICLE
2.1. ECOCAR: THE NEXT CHALLENGE
This thesis is integrated in parallel with the development of the Fuel Cell Plug-in
Hybrid Electric Vehicle (FC-PHEV) in Missouri University of Science and Technology
during the periods of 2008-2010. Missouri S&T was selected from over 300 schools to
be part of the EcoCAR: The NeXt Challenge.
EcoCAR: The NeXt Challenge is a new collegiate Advanced Vehicle Technology
Competition (AVTC) which kicked off in the fall of 2008. Sponsored by the U.S.
Department of Energy (DOE) and General Motors (GM), as well as by Natural Resources
Canada and other industry leaders, EcoCAR challenges engineering students from
universities across North America to re-engineer a GM vehicle, minimizing energy
consumption, emissions, and greenhouse gases while maintaining the vehicle’s utility,
safety, and performance[26].
The challenge selected 17 schools across United States of America and Canada,
between all of them only two schools were selected to receive a hydrogen system to
integrate it into the school’s powertrain, Missouri S&T from United States of America
and Waterloo from Canada.
During the first year of EcoCAR competition, the teams used math based design
tools such as Powertrain Systems Analysis Toolkit (PSAT) in order to select an advanced
vehicle powertrain to meet the technical specifications of the competition. Moreover,
teams used CAD software to ensure that their chosen components fit into their donated
vehicle and that the electrical, mechanical and software systems function properly.
Finally, teams also used software-in-the-loop (SIL) and hardware-in-the-loop (HIL) to
develop better controls and subsystems.
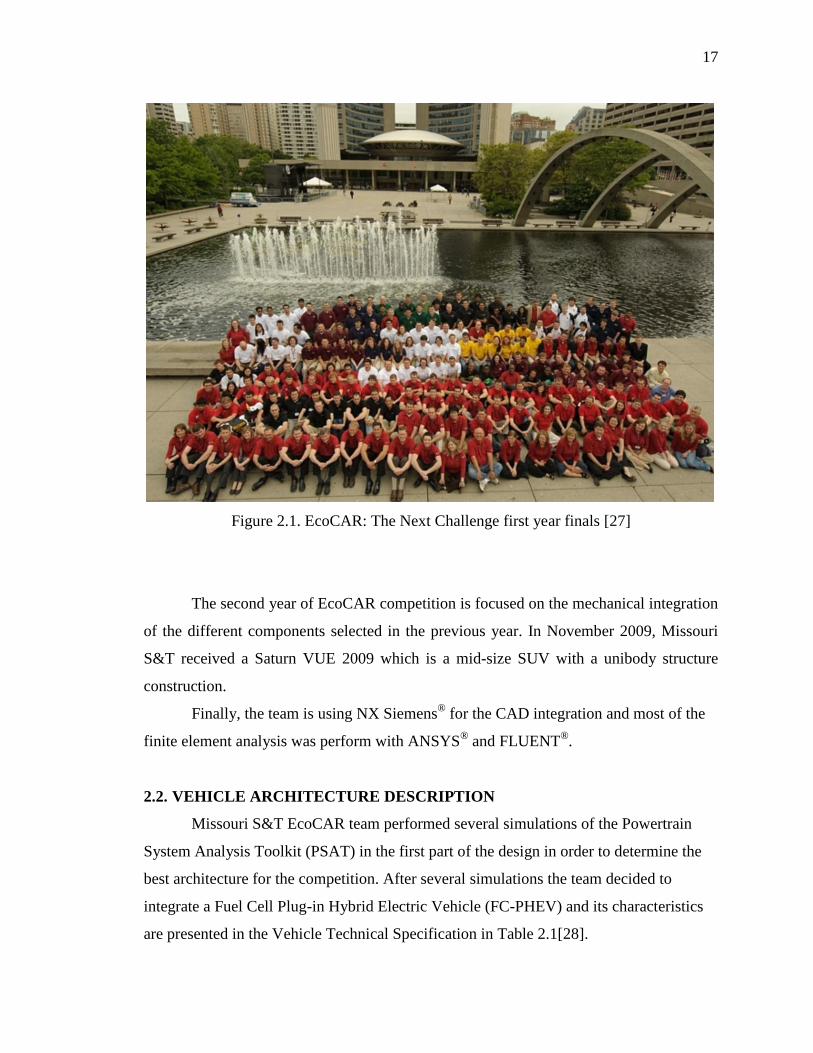
The Finals of the first year was in Toronto Canada in summer 2009, it was an
entire week full of presentations, reports and several types of events Figure 2.1 [27]
illustrates all the members of EcoCAR: The NeXt challenge that includes team members,
sponsors and organizers.
Page 28
17
Figure 2.1. EcoCAR: The Next Challenge first year finals [27]
The second year of EcoCAR competition is focused on the mechanical integration
of the different components selected in the previous year. In November 2009, Missouri
S&T received a Saturn VUE 2009 which is a mid-size SUV with a unibody structure
construction.
Finally, the team is using NX Siemens® for the CAD integration and most of the
finite element analysis was perform with ANSYS® and FLUENT
®.
2.2. VEHICLE ARCHITECTURE DESCRIPTION
Missouri S&T EcoCAR team performed several simulations of the Powertrain
System Analysis Toolkit (PSAT) in the first part of the design in order to determine the
best architecture for the competition. After several simulations the team decided to
integrate a Fuel Cell Plug-in Hybrid Electric Vehicle (FC-PHEV) and its characteristics
are presented in the Vehicle Technical Specification in Table 2.1[28].
Page 29
18
The teams vehicle technical specification (VTS) has to achieve the competition
requirements, which are defined mainly by the production VUE 09 specifications. The
range does not achieve the competition requirements and the weight is in the limit
allowed. During the mechanical integration these parameters are considered to keep the
vehicle in the competition requirements.
Table 2.1. Missouri S&T EcoCAR vehicle technical specifications
Specification Competition Missouri S&T VTS
EcoCAR Production VUE Competition
Requirement VTS
Acceleration from
0 to 60 10.6 s ≤ 14 s 9.8
Acceleration from
50 to 70 7 s ≤ 10 s 5.8
UF Weighted FE * 8.3 l/100 km 7.4 l/100 km 7.4 l/100 km
Towing Capacity 680 kg (1500 lb) ≥ 680 kg @ 3.5%,
20 min @ 72 kph 680 kg @45 mph
Cargo Capacity 0.83 m3
Height: 457 mm
Depth: 686 mm
Width: 762 mm
0 .83 m3
Passenger Capacity 5 ≥ 4 4
Braking 60 - 0 38 m- 43 m < 51.8 m < 51.8 m
Mass 1758 kg ≤ 2268 kg 2238 kg
Starting Time ≤ 2 s ≤ 15 s ≤ 15 s
Ground Clearance 198 mm ≥178 mm ≥178 mm
Range > 580 km ≥ 320 km 305 km
Page 30
19
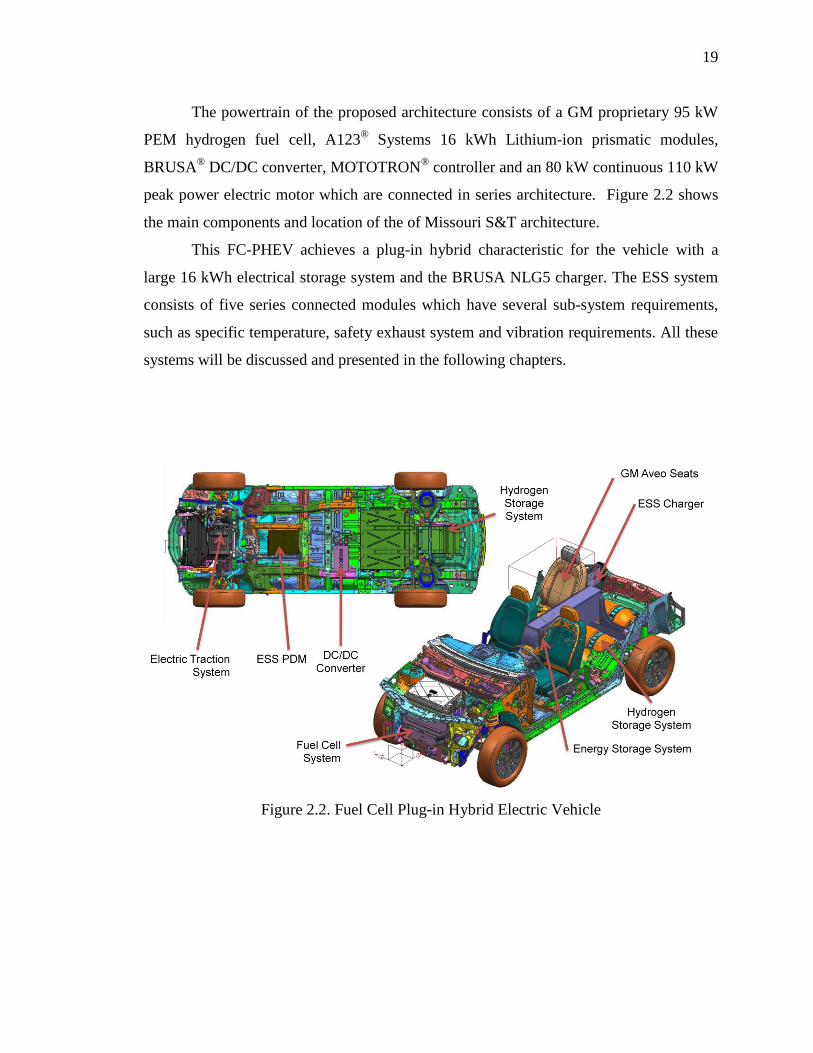
The powertrain of the proposed architecture consists of a GM proprietary 95 kW
PEM hydrogen fuel cell, A123® Systems 16 kWh Lithium-ion prismatic modules,
BRUSA® DC/DC converter, MOTOTRON
® controller and an 80 kW continuous 110 kW
peak power electric motor which are connected in series architecture. Figure 2.2 shows
the main components and location of the of Missouri S&T architecture.
This FC-PHEV achieves a plug-in hybrid characteristic for the vehicle with a
large 16 kWh electrical storage system and the BRUSA NLG5 charger. The ESS system
consists of five series connected modules which have several sub-system requirements,
such as specific temperature, safety exhaust system and vibration requirements. All these
systems will be discussed and presented in the following chapters.
Figure 2.2. Fuel Cell Plug-in Hybrid Electric Vehicle
Page 31
20
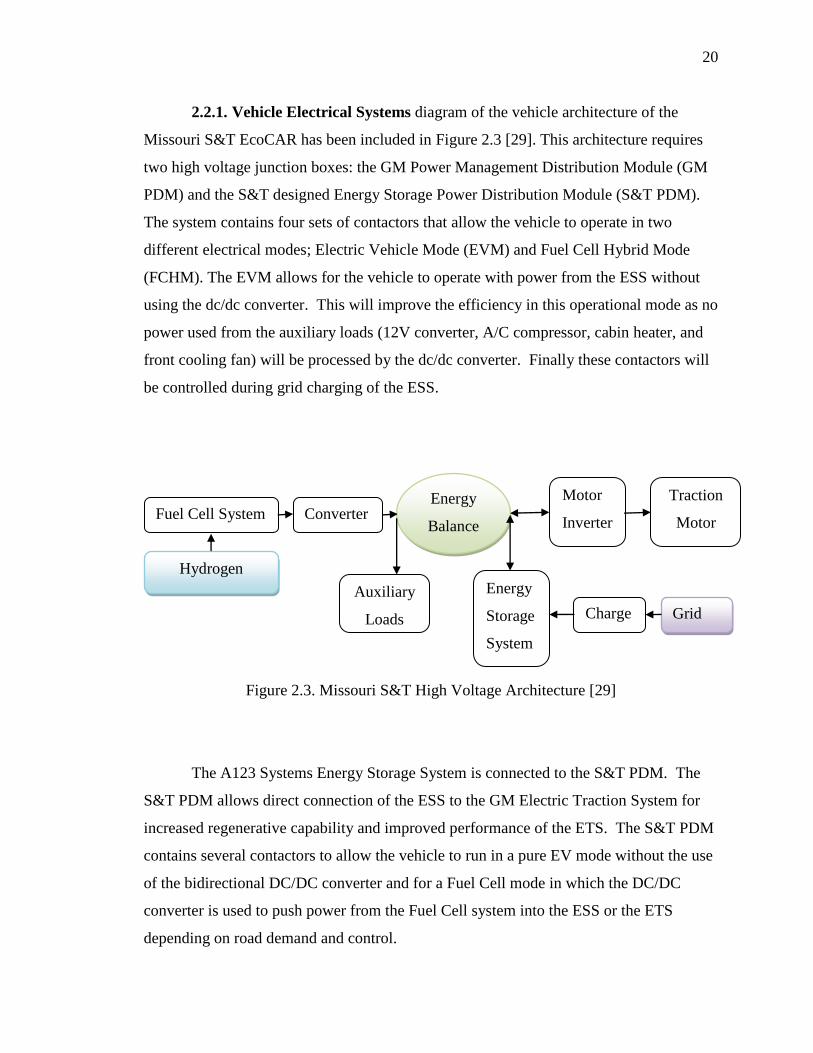
2.2.1. Vehicle Electrical Systems diagram of the vehicle architecture of the
Missouri S&T EcoCAR has been included in Figure 2.3 [29]. This architecture requires
two high voltage junction boxes: the GM Power Management Distribution Module (GM
PDM) and the S&T designed Energy Storage Power Distribution Module (S&T PDM).
The system contains four sets of contactors that allow the vehicle to operate in two
different electrical modes; Electric Vehicle Mode (EVM) and Fuel Cell Hybrid Mode
(FCHM). The EVM allows for the vehicle to operate with power from the ESS without
using the dc/dc converter. This will improve the efficiency in this operational mode as no
power used from the auxiliary loads (12V converter, A/C compressor, cabin heater, and
front cooling fan) will be processed by the dc/dc converter. Finally these contactors will
be controlled during grid charging of the ESS.
Figure 2.3. Missouri S&T High Voltage Architecture [29]
The A123 Systems Energy Storage System is connected to the S&T PDM. The
S&T PDM allows direct connection of the ESS to the GM Electric Traction System for
increased regenerative capability and improved performance of the ETS. The S&T PDM
contains several contactors to allow the vehicle to run in a pure EV mode without the use
of the bidirectional DC/DC converter and for a Fuel Cell mode in which the DC/DC
converter is used to push power from the Fuel Cell system into the ESS or the ETS
depending on road demand and control.
Fuel Cell System
Hydrogen
Converter Energy
Balance
Auxiliary
Loads
Energy
Storage
System
Charge
r
Motor
Inverter
Traction
Motor
Grid
Page 32
21
2.2.2. Vehicle Control Architecture This design includes three different control
areas: the fuel cell power module (FCPM), the fuel cell propulsion system (FCPS), and
the platform control system. The FCPM area contains all of the ancillary systems
required to operate the fuel cell. The FCPS contains the system essential for power
balance in the vehicle and the hydrogen delivery system. The platform area contains the
vehicle safety system and human to machine interface system. The charge depleting cycle
shows the low power use of the fuel cell with increase in the power demand to limit the
discharge of the energy storage system. This discharge limit has been set at 1C (one hour
discharge rate) or 16kW. In the charge sustaining operation, the fuel cell meets the
average power demand of the vehicle for the drive cycle. The ESS DC/DC converter is
limited to 28 kW sustained operation with peaking operation up to 40.5 kW based on
thermal conditions. Therefore while in charge sustaining operation the fuel cell cannot
act as a perfect power follower. The ESS will be required then to meet the balance of the
power required. The vehicle operation has three propelling modes of operation: charge
depleting, charge sustaining and all electric; with three braking modes: friction, all
regenerative and hybrid which form the supervisory control strategy for the vehicle. The
transitions are based on the ESS state of charge, acceleration power demand, deceleration
demand, vehicle speed, time since fuel cell startup, and regenerative braking capability as
determined by state of charge and current output power of the fuel cell. The decision of
high velocity and high acceleration is generally based on the calculated power demand of
the drive cycle and the duration of this demand [30].
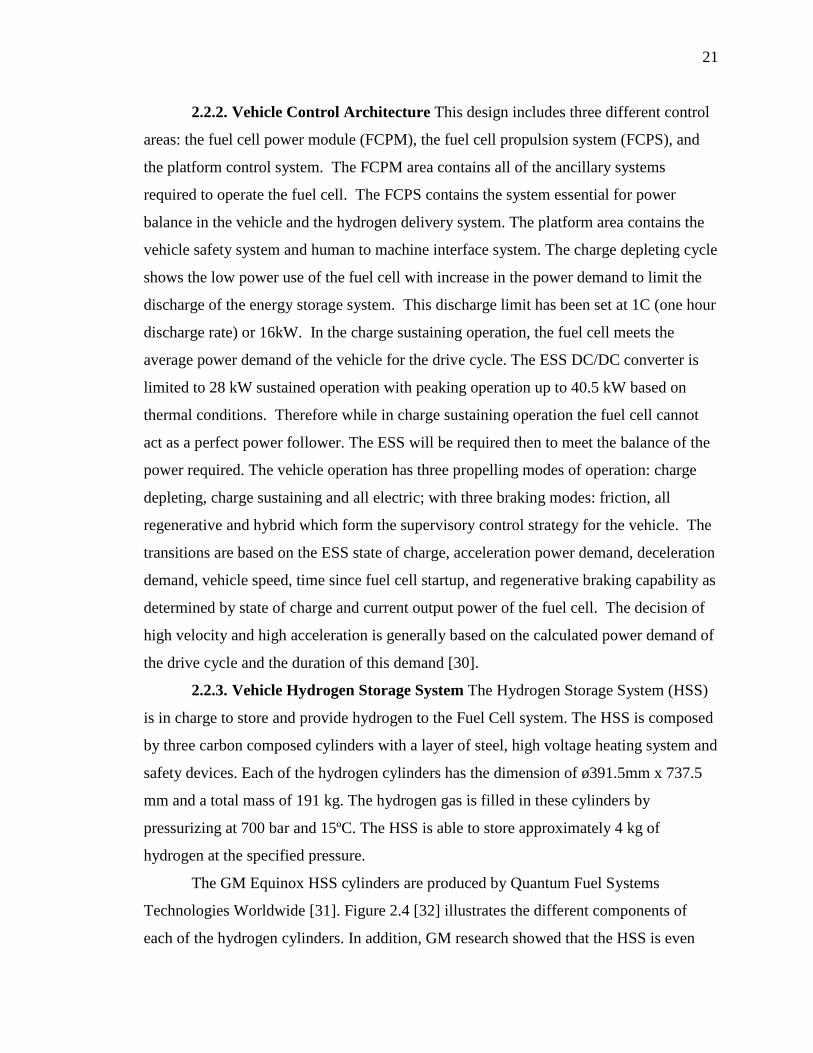
2.2.3. Vehicle Hydrogen Storage System The Hydrogen Storage System (HSS)
is in charge to store and provide hydrogen to the Fuel Cell system. The HSS is composed
by three carbon composed cylinders with a layer of steel, high voltage heating system and
safety devices. Each of the hydrogen cylinders has the dimension of ø391.5mm x 737.5
mm and a total mass of 191 kg. The hydrogen gas is filled in these cylinders by
pressurizing at 700 bar and 15ºC. The HSS is able to store approximately 4 kg of
hydrogen at the specified pressure.
The GM Equinox HSS cylinders are produced by Quantum Fuel Systems
Technologies Worldwide [31]. Figure 2.4 [32] illustrates the different components of
each of the hydrogen cylinders. In addition, GM research showed that the HSS is even
Page 33
22
more safe that gasoline tanks and at its location, is able to support forces up to 35 to 40
kN [33].
Figure 2.4. Hydrogen Storage System cylinders [32]
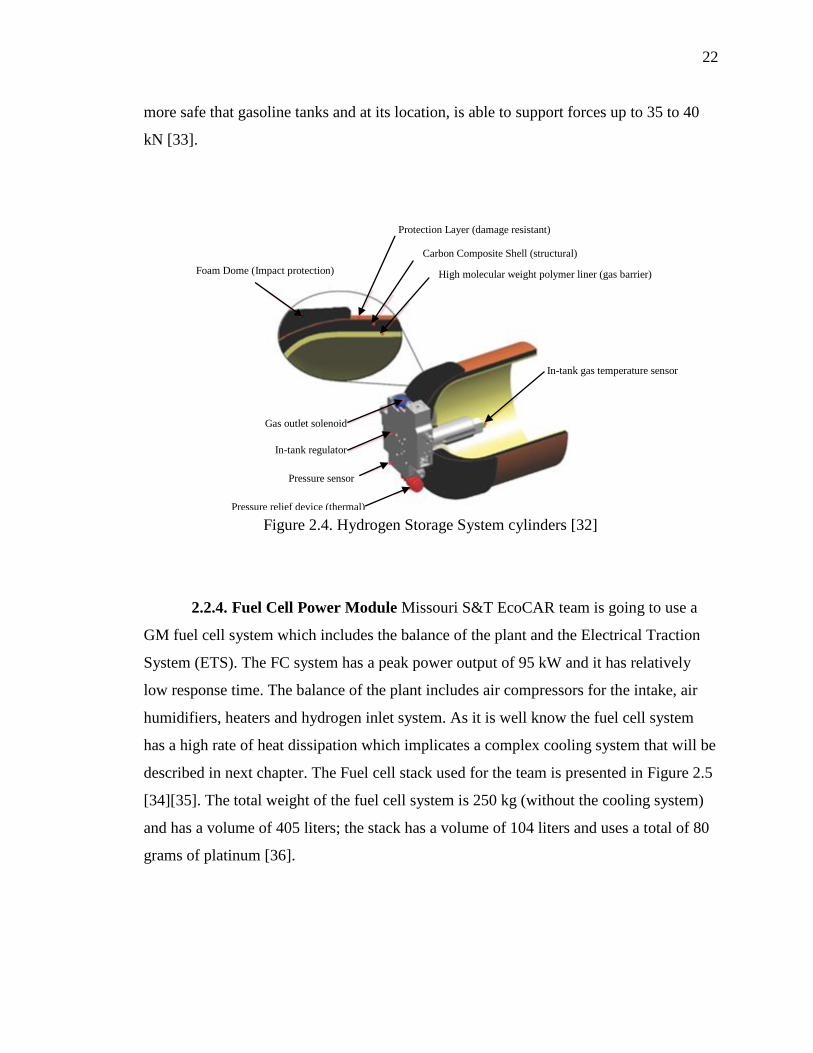
2.2.4. Fuel Cell Power Module Missouri S&T EcoCAR team is going to use a
GM fuel cell system which includes the balance of the plant and the Electrical Traction
System (ETS). The FC system has a peak power output of 95 kW and it has relatively
low response time. The balance of the plant includes air compressors for the intake, air
humidifiers, heaters and hydrogen inlet system. As it is well know the fuel cell system
has a high rate of heat dissipation which implicates a complex cooling system that will be
described in next chapter. The Fuel cell stack used for the team is presented in Figure 2.5
[34][35]. The total weight of the fuel cell system is 250 kg (without the cooling system)
and has a volume of 405 liters; the stack has a volume of 104 liters and uses a total of 80
grams of platinum [36].
Foam Dome (Impact protection)
Protection Layer (damage resistant)
Carbon Composite Shell (structural)
High molecular weight polymer liner (gas barrier)
In-tank gas temperature sensor
Gas outlet solenoid
In-tank regulator
Pressure sensor
Pressure relief device (thermal)
Page 34
23
Figure 2.5. Fuel Cell Stack [34] [35]
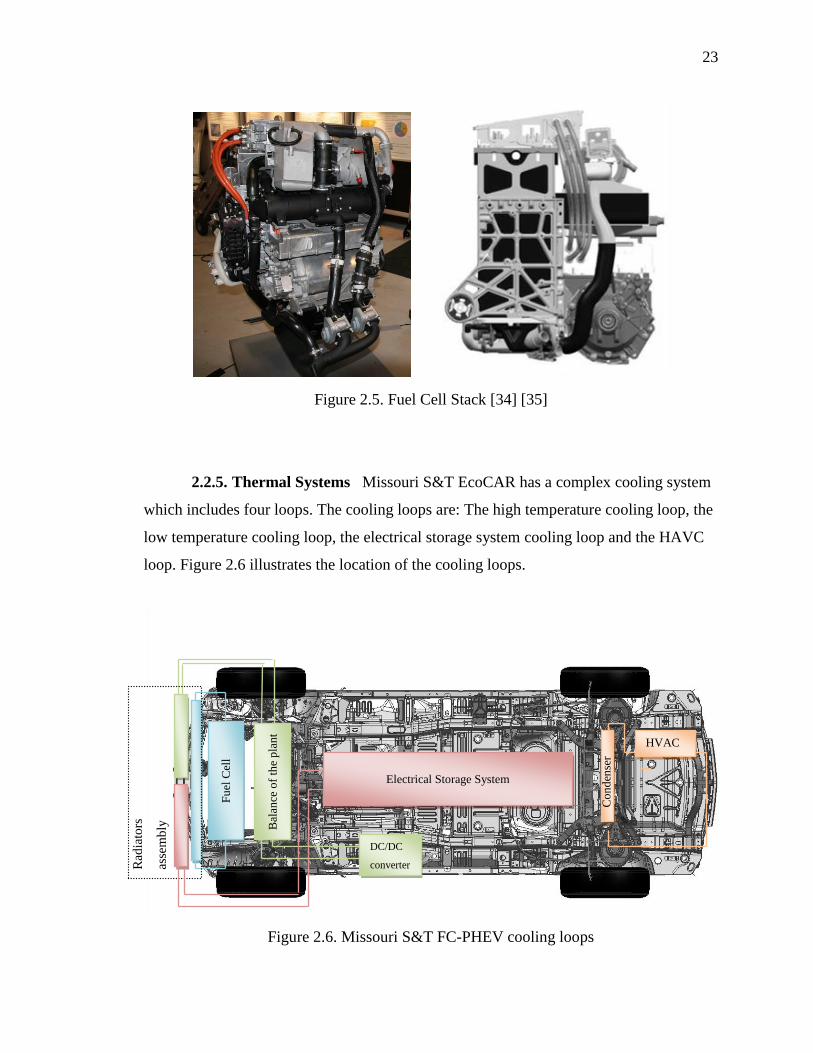
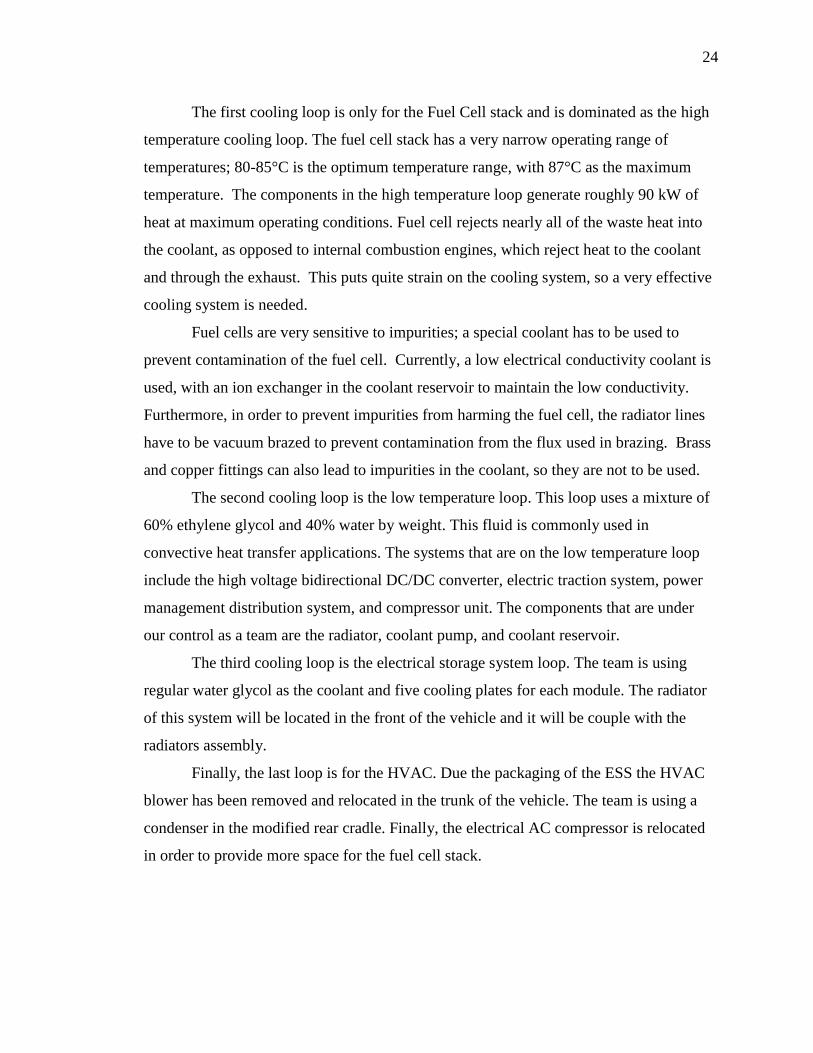
2.2.5. Thermal Systems Missouri S&T EcoCAR has a complex cooling system
which includes four loops. The cooling loops are: The high temperature cooling loop, the
low temperature cooling loop, the electrical storage system cooling loop and the HAVC
loop. Figure 2.6 illustrates the location of the cooling loops.
Figure 2.6. Missouri S&T FC-PHEV cooling loops
Electrical Storage System
Fu
el C
ell
Bal
ance
of
the
pla
nt
DC/DC
converter Rad
iato
rs
asse
mb
ly
HVAC
Co
nd
ense
r
Page 35
24
The first cooling loop is only for the Fuel Cell stack and is dominated as the high
temperature cooling loop. The fuel cell stack has a very narrow operating range of
temperatures; 80-85°C is the optimum temperature range, with 87°C as the maximum
temperature. The components in the high temperature loop generate roughly 90 kW of
heat at maximum operating conditions. Fuel cell rejects nearly all of the waste heat into
the coolant, as opposed to internal combustion engines, which reject heat to the coolant
and through the exhaust. This puts quite strain on the cooling system, so a very effective
cooling system is needed.
Fuel cells are very sensitive to impurities; a special coolant has to be used to
prevent contamination of the fuel cell. Currently, a low electrical conductivity coolant is
used, with an ion exchanger in the coolant reservoir to maintain the low conductivity.
Furthermore, in order to prevent impurities from harming the fuel cell, the radiator lines
have to be vacuum brazed to prevent contamination from the flux used in brazing. Brass
and copper fittings can also lead to impurities in the coolant, so they are not to be used.
The second cooling loop is the low temperature loop. This loop uses a mixture of
60% ethylene glycol and 40% water by weight. This fluid is commonly used in
convective heat transfer applications. The systems that are on the low temperature loop
include the high voltage bidirectional DC/DC converter, electric traction system, power
management distribution system, and compressor unit. The components that are under
our control as a team are the radiator, coolant pump, and coolant reservoir.
The third cooling loop is the electrical storage system loop. The team is using
regular water glycol as the coolant and five cooling plates for each module. The radiator
of this system will be located in the front of the vehicle and it will be couple with the
radiators assembly.
Finally, the last loop is for the HVAC. Due the packaging of the ESS the HVAC
blower has been removed and relocated in the trunk of the vehicle. The team is using a
condenser in the modified rear cradle. Finally, the electrical AC compressor is relocated
in order to provide more space for the fuel cell stack.
Page 36
25
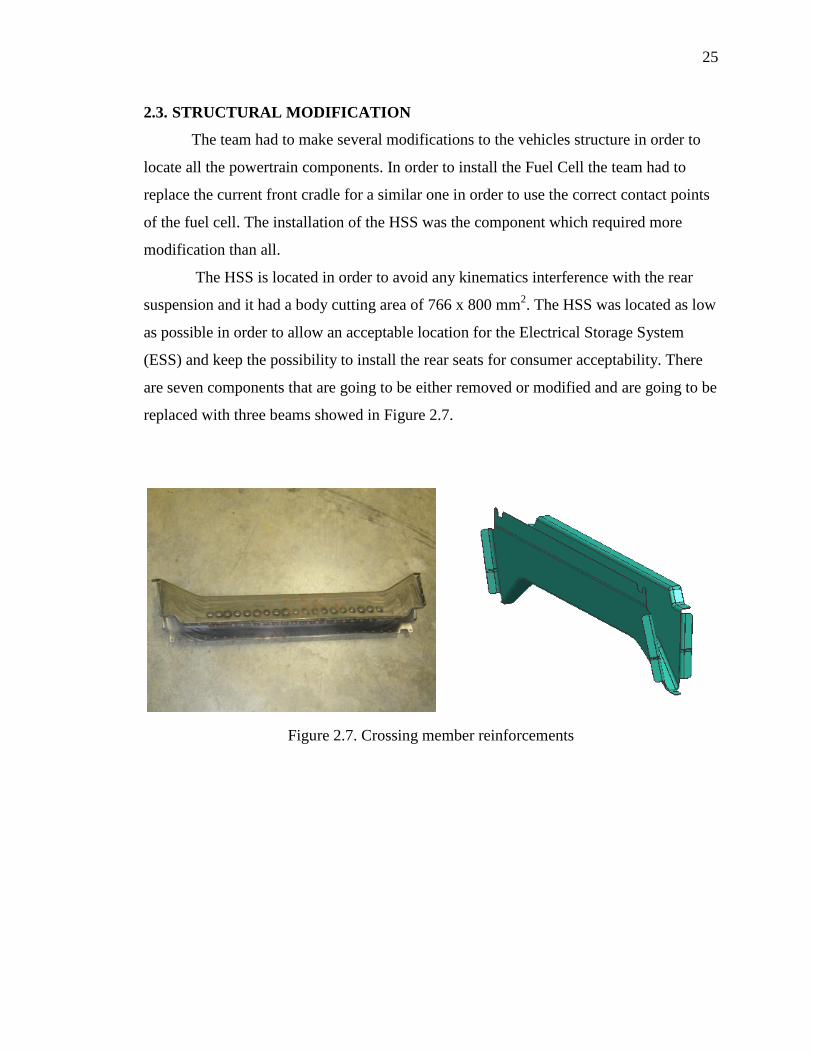
2.3. STRUCTURAL MODIFICATION
The team had to make several modifications to the vehicles structure in order to
locate all the powertrain components. In order to install the Fuel Cell the team had to
replace the current front cradle for a similar one in order to use the correct contact points
of the fuel cell. The installation of the HSS was the component which required more
modification than all.
The HSS is located in order to avoid any kinematics interference with the rear
suspension and it had a body cutting area of 766 x 800 mm2. The HSS was located as low
as possible in order to allow an acceptable location for the Electrical Storage System
(ESS) and keep the possibility to install the rear seats for consumer acceptability. There
are seven components that are going to be either removed or modified and are going to be
replaced with three beams showed in Figure 2.7.
Figure 2.7. Crossing member reinforcements
Page 37
26
3. ELECTRICAL STORAGE SYSTEM DESIGNTHIS
3.1. COMPONENTS AND SUBSYSTEMS
In order to have the Electrical Storage Battery operational, it needs several
subcomponents in the high voltage electrical system. The main components of the ESS
system are the high voltage charger, DC/DC converter, ESS Power Distribution Module,
ESS Electrical Distribution System, ESS Battery Control Module, and the A123
prismatic modules. The ESS is composed by five A123 prismatic modules illustrated in
Figure 3.1. [37].
Figure 3.1. A123 prismatic modules components [37]
Page 38
27
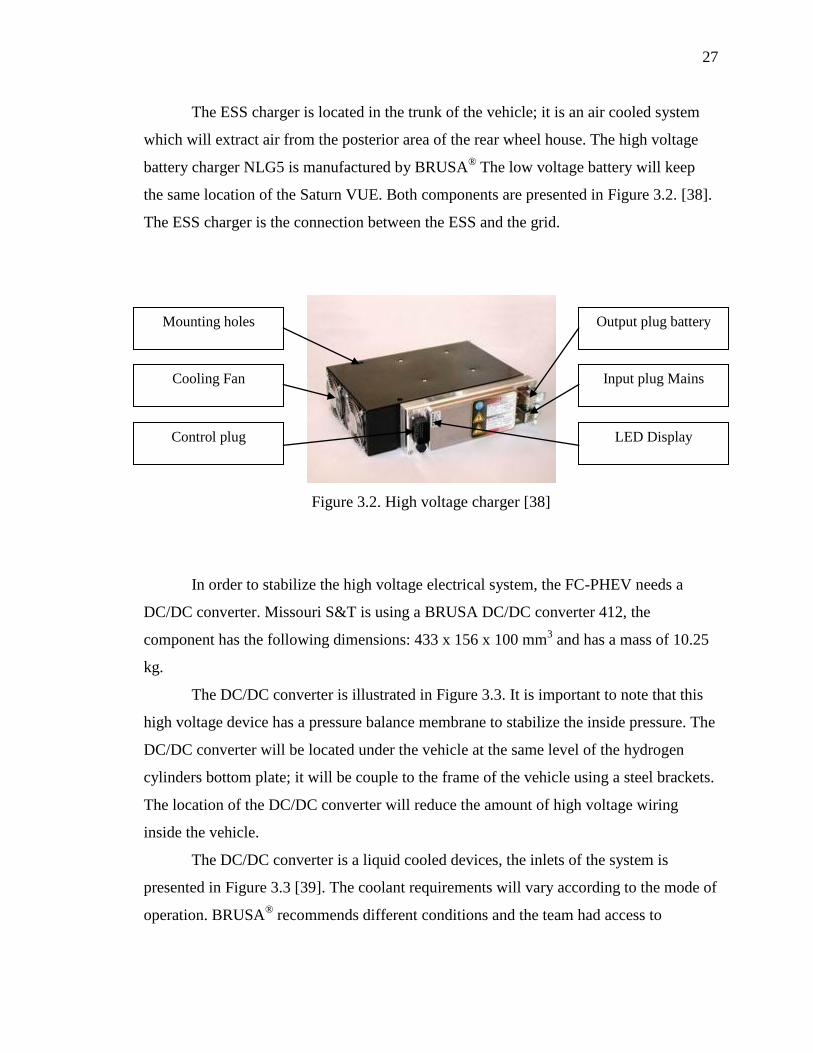
The ESS charger is located in the trunk of the vehicle; it is an air cooled system
which will extract air from the posterior area of the rear wheel house. The high voltage
battery charger NLG5 is manufactured by BRUSA® The low voltage battery will keep
the same location of the Saturn VUE. Both components are presented in Figure 3.2. [38].
The ESS charger is the connection between the ESS and the grid.
Figure 3.2. High voltage charger [38]
In order to stabilize the high voltage electrical system, the FC-PHEV needs a
DC/DC converter. Missouri S&T is using a BRUSA DC/DC converter 412, the
component has the following dimensions: 433 x 156 x 100 mm3 and has a mass of 10.25
kg.
The DC/DC converter is illustrated in Figure 3.3. It is important to note that this
high voltage device has a pressure balance membrane to stabilize the inside pressure. The
DC/DC converter will be located under the vehicle at the same level of the hydrogen
cylinders bottom plate; it will be couple to the frame of the vehicle using a steel brackets.
The location of the DC/DC converter will reduce the amount of high voltage wiring
inside the vehicle.
The DC/DC converter is a liquid cooled devices, the inlets of the system is
presented in Figure 3.3 [39]. The coolant requirements will vary according to the mode of
operation. BRUSA® recommends different conditions and the team had access to
Cooling Fan
Mounting holes
Control plug
Output plug battery
Input plug Mains
LED Display
Page 39
28
experimental test of the converter. The team decided to couple this component to the low
temperature cooling loop and run 4l/min and an inlet of 25oC-35
oC.
Figure 3.3. Image of Missouri S&T EcoCAR DC/DC converter [39]
Another important high voltage component is the Electrical Storage System
Power Distribution Module (ESS PDM), the main function is to easily change between a
Electrical Vehicle design to a Fuel Cell hybrid design. It is composed mainly of
contactors, fuses and wiring. The location of this component will be next to the water
vapor exhaust system under the vehicle.
Inside the pack there are two important components that allow the ESS pack to be
electrical operational, the ESS Electrical Distribution Module that basically measures the
current, measures the Hall Effect, and is composed mainly by contactors, resistors and
sensors. The other important component in the pack is the Battery Control module that
interacts with the main vehicle controller. Other components that the team needed to
install in the pack are services disconnect switch and a high voltage fuse.
Control plug
Pressure balance
membrane
Mounting
Holes
Cooling
Pipes
Low-side power
connector
High-side power
connector
Page 40
29
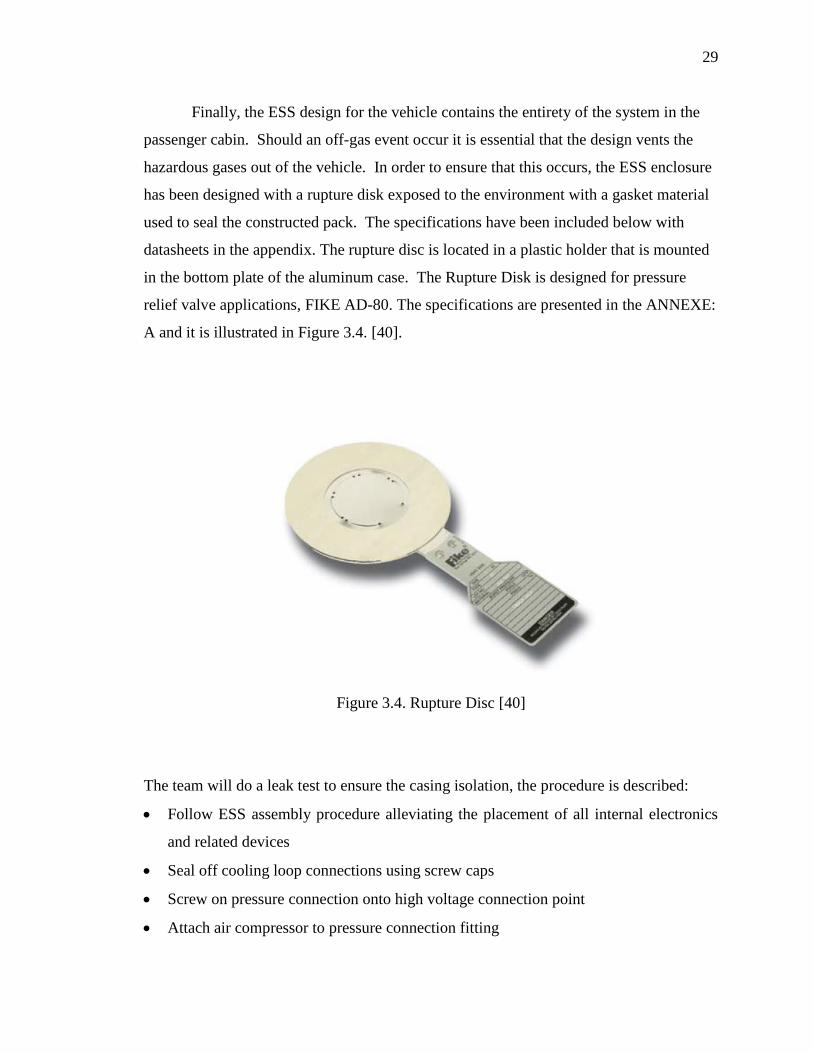
Finally, the ESS design for the vehicle contains the entirety of the system in the
passenger cabin. Should an off-gas event occur it is essential that the design vents the
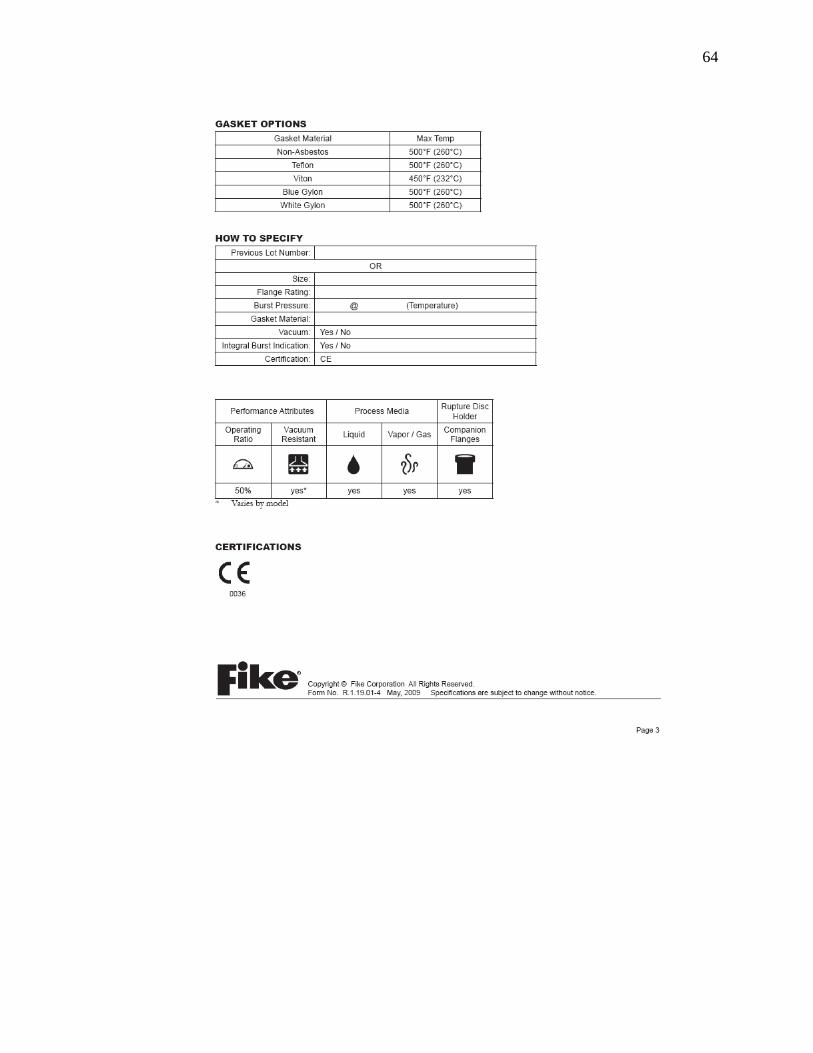
hazardous gases out of the vehicle. In order to ensure that this occurs, the ESS enclosure
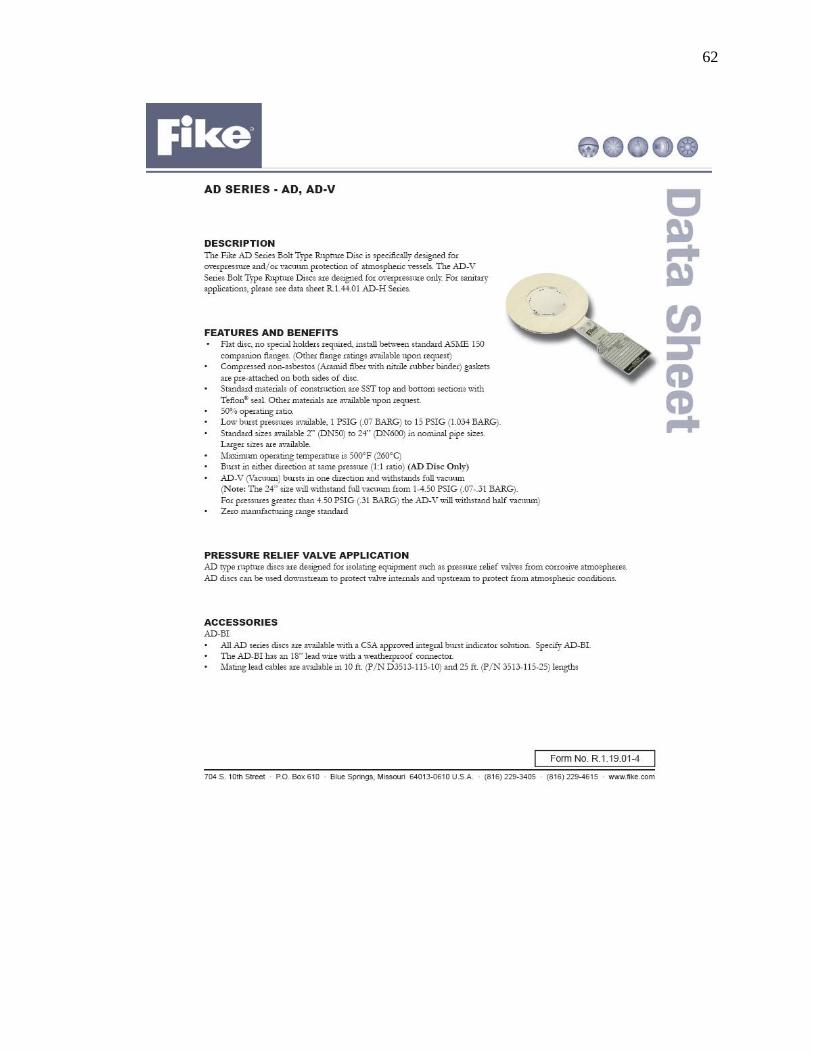
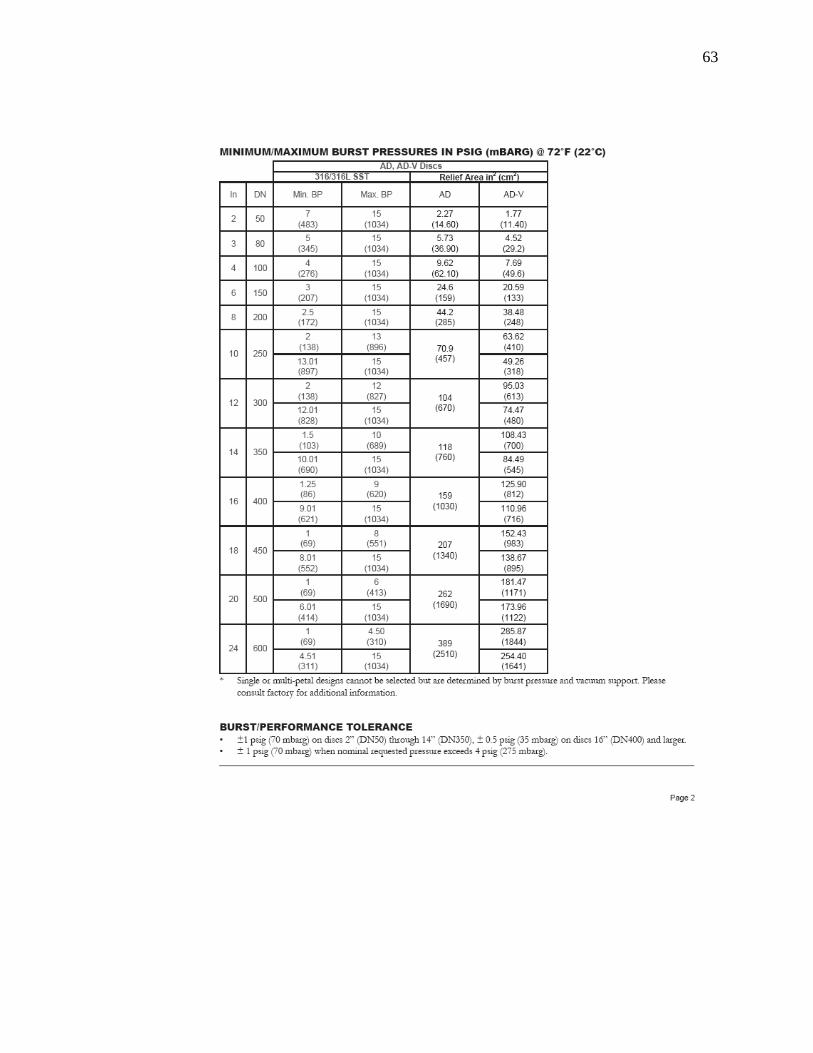
has been designed with a rupture disk exposed to the environment with a gasket material
used to seal the constructed pack. The specifications have been included below with
datasheets in the appendix. The rupture disc is located in a plastic holder that is mounted
in the bottom plate of the aluminum case. The Rupture Disk is designed for pressure
relief valve applications, FIKE AD-80. The specifications are presented in the ANNEXE:
A and it is illustrated in Figure 3.4. [40].
Figure 3.4. Rupture Disc [40]
The team will do a leak test to ensure the casing isolation, the procedure is described:
Follow ESS assembly procedure alleviating the placement of all internal electronics
and related devices
Seal off cooling loop connections using screw caps
Screw on pressure connection onto high voltage connection point
Attach air compressor to pressure connection fitting
Page 41
30
Apply either Snoop or mixture of soap and water to all seals and joints
Turn on air compressor and allow it to run until 5 psi is achieved with the ESS pack
Turn off air compressor and check for bubble formation
Monitor pressure gauge for 15 minutes to ensure no leakage has occurred
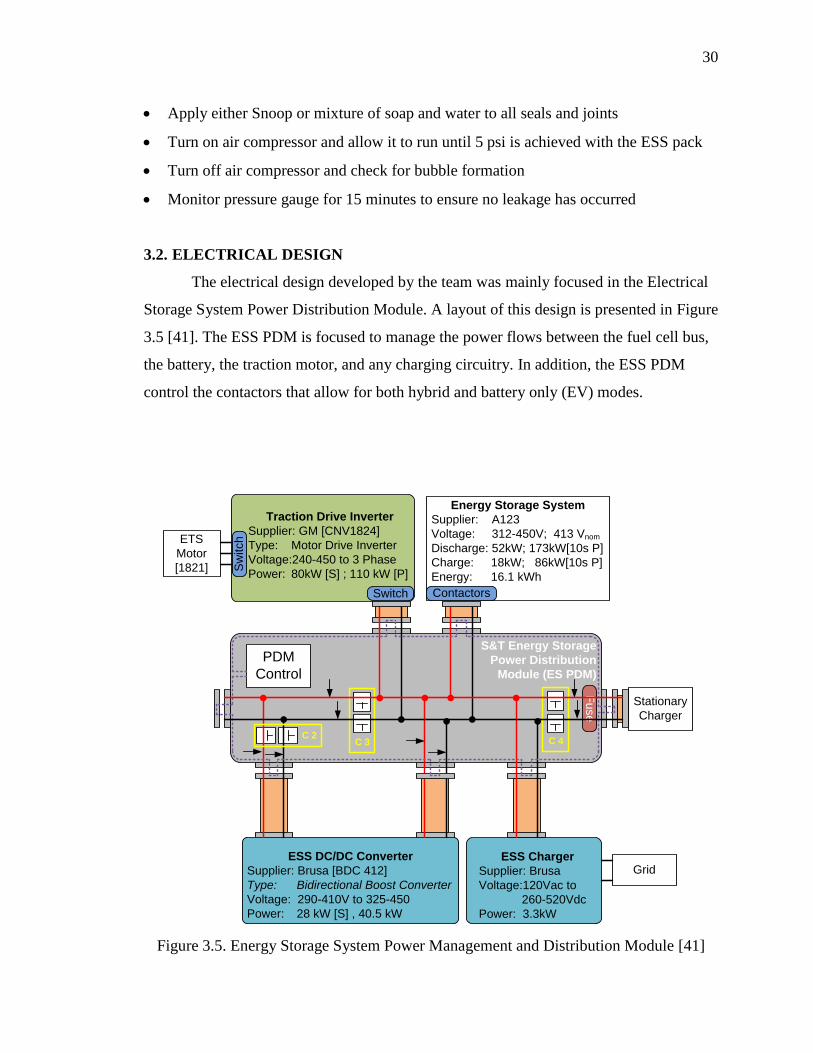
3.2. ELECTRICAL DESIGN
The electrical design developed by the team was mainly focused in the Electrical
Storage System Power Distribution Module. A layout of this design is presented in Figure
3.5 [41]. The ESS PDM is focused to manage the power flows between the fuel cell bus,
the battery, the traction motor, and any charging circuitry. In addition, the ESS PDM
control the contactors that allow for both hybrid and battery only (EV) modes.
ESS DC/DC Converter
Supplier: Brusa [BDC 412]
Type: Bidirectional Boost Converter
Voltage: 290-410V to 325-450
Power: 28 kW [S] , 40.5 kW
ESS Charger
Supplier: Brusa
Voltage:120Vac to
260-520Vdc
Power: 3.3kW
Grid
Stationary
Charger
S&T Energy Storage
Power Distribution
Module (ES PDM)
Energy Storage System
Supplier: A123
Voltage: 312-450V; 413 Vnom
Discharge: 52kW; 173kW[10s P]
Charge: 18kW; 86kW[10s P]
Energy: 16.1 kWh
Traction Drive Inverter
Supplier: GM [CNV1824]
Type: Motor Drive Inverter
Voltage:240-450 to 3 Phase
Power: 80kW [S] ; 110 kW [P]
ETS
Motor
[1821]
Contactors
Sw
itch
Switch
PDM
Control
Fu
se
C 2C 3 C 4
Figure 3.5. Energy Storage System Power Management and Distribution Module [41]
Page 42
31
3.3. MECHANICAL DESIGN
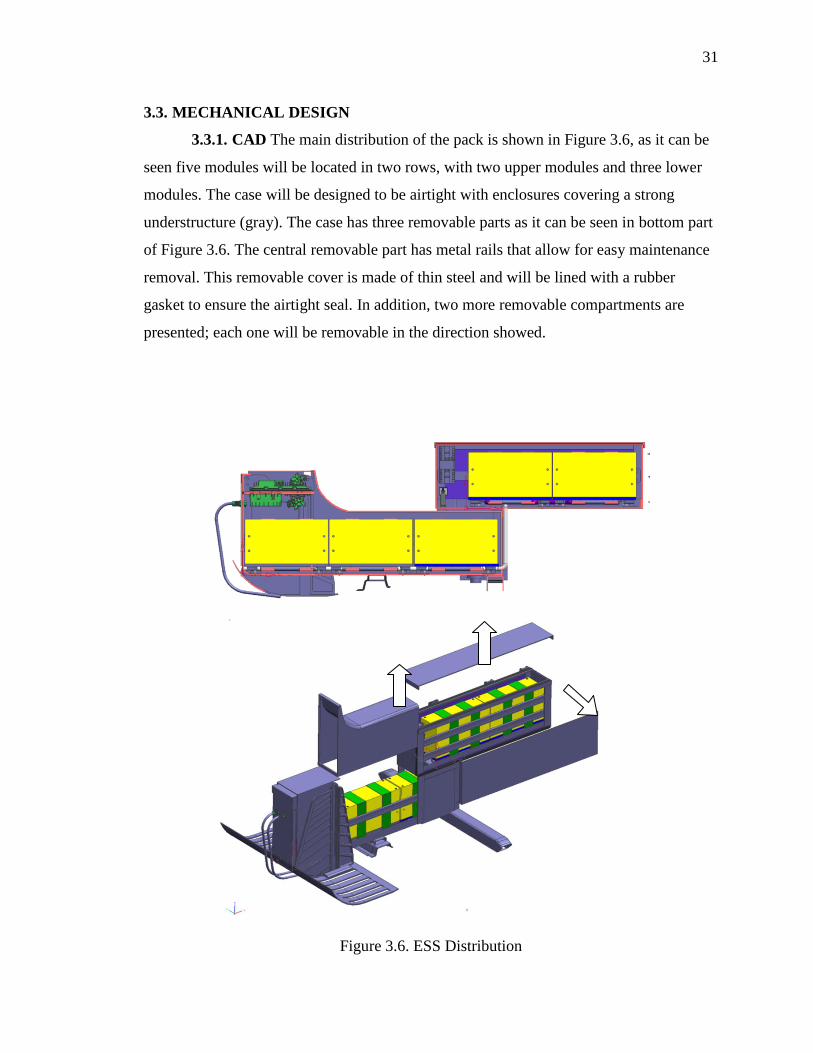
3.3.1. CAD The main distribution of the pack is shown in Figure 3.6, as it can be
seen five modules will be located in two rows, with two upper modules and three lower
modules. The case will be designed to be airtight with enclosures covering a strong
understructure (gray). The case has three removable parts as it can be seen in bottom part
of Figure 3.6. The central removable part has metal rails that allow for easy maintenance
removal. This removable cover is made of thin steel and will be lined with a rubber
gasket to ensure the airtight seal. In addition, two more removable compartments are
presented; each one will be removable in the direction showed.
Figure 3.6. ESS Distribution
Page 43
32
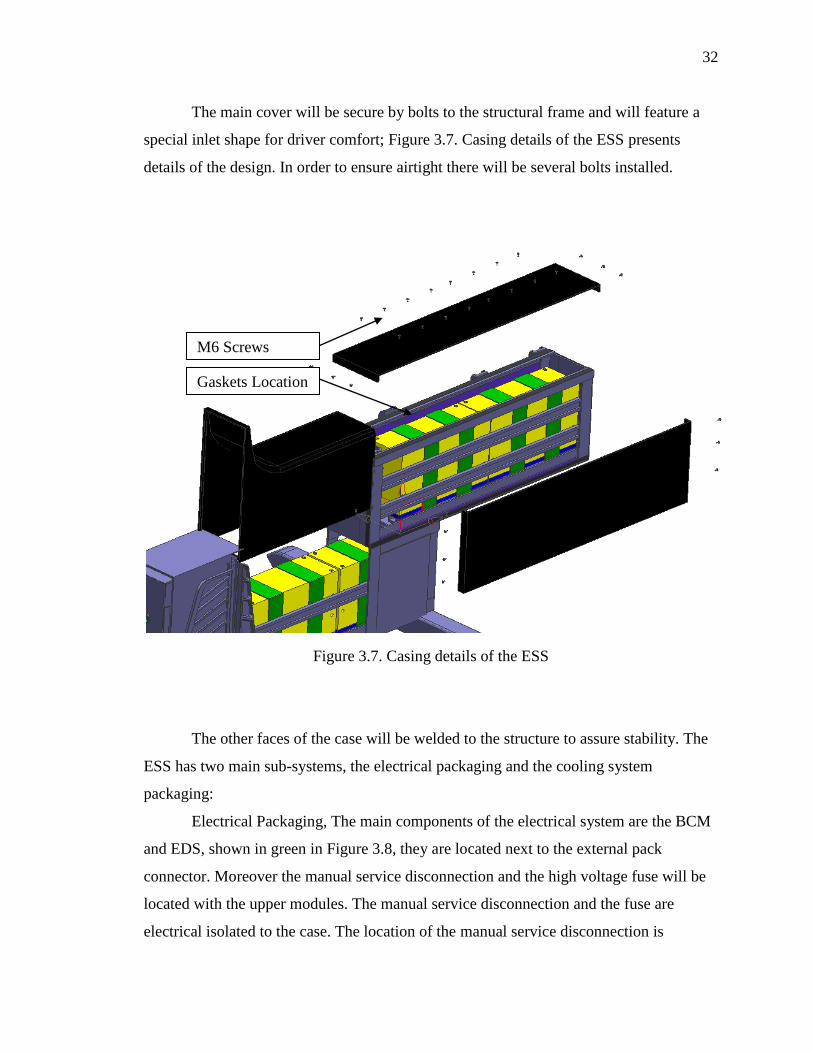
The main cover will be secure by bolts to the structural frame and will feature a
special inlet shape for driver comfort; Figure 3.7. Casing details of the ESS presents
details of the design. In order to ensure airtight there will be several bolts installed.
Figure 3.7. Casing details of the ESS
The other faces of the case will be welded to the structure to assure stability. The
ESS has two main sub-systems, the electrical packaging and the cooling system
packaging:
Electrical Packaging, The main components of the electrical system are the BCM
and EDS, shown in green in Figure 3.8, they are located next to the external pack
connector. Moreover the manual service disconnection and the high voltage fuse will be
located with the upper modules. The manual service disconnection and the fuse are
electrical isolated to the case. The location of the manual service disconnection is
Gaskets Location
M6 Screws
Page 44
33
accessible through the top removable case of the second section of the pack. Between the
modules there will be a special HV connection in order to reduce the unnecessary wire.
The manual service disconnection will be pulled to the top of the battery pack. The BCM
and EDS are located in a removable plate. Finally this system is completely isolated from
the others, i.e. if there is leaks in the cooling system there will not a form to touch the
electrical system.
Figure 3.8. Electrical System Packaging
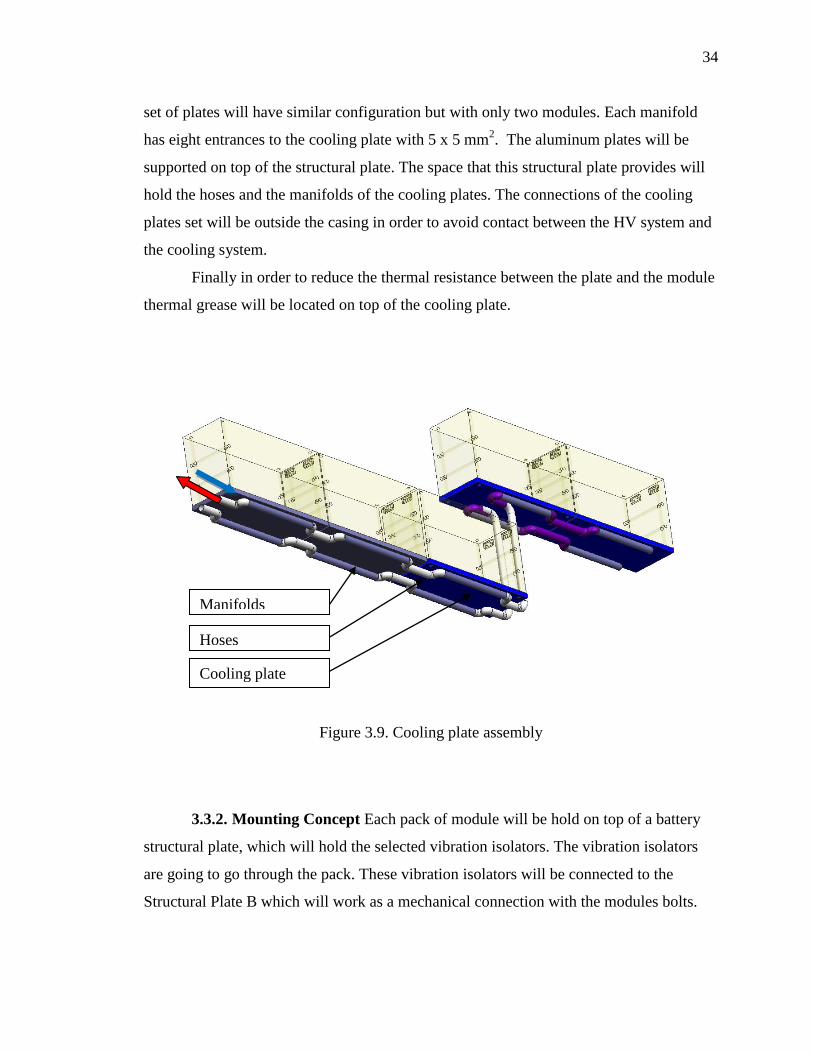
Cooling System, The cooling system has two sets of cooling plates, each of one
connected in parallel Figure 3.9 shows the inlet and outlet of the cooling plate system.
The first set of cooling plates has three plates interconnect with a 1 in. hose. The second
SBX 350 MSD
Fuse 170 M3018
A123 Module
A123 BCM
A123 EDM
CD21AA Connector
Page 45
34
set of plates will have similar configuration but with only two modules. Each manifold
has eight entrances to the cooling plate with 5 x 5 mm2. The aluminum plates will be
supported on top of the structural plate. The space that this structural plate provides will
hold the hoses and the manifolds of the cooling plates. The connections of the cooling
plates set will be outside the casing in order to avoid contact between the HV system and
the cooling system.
Finally in order to reduce the thermal resistance between the plate and the module
thermal grease will be located on top of the cooling plate.
Figure 3.9. Cooling plate assembly
3.3.2. Mounting Concept Each pack of module will be hold on top of a battery
structural plate, which will hold the selected vibration isolators. The vibration isolators
are going to go through the pack. These vibration isolators will be connected to the
Structural Plate B which will work as a mechanical connection with the modules bolts.
Manifolds
Hoses
Cooling plate
Page 46
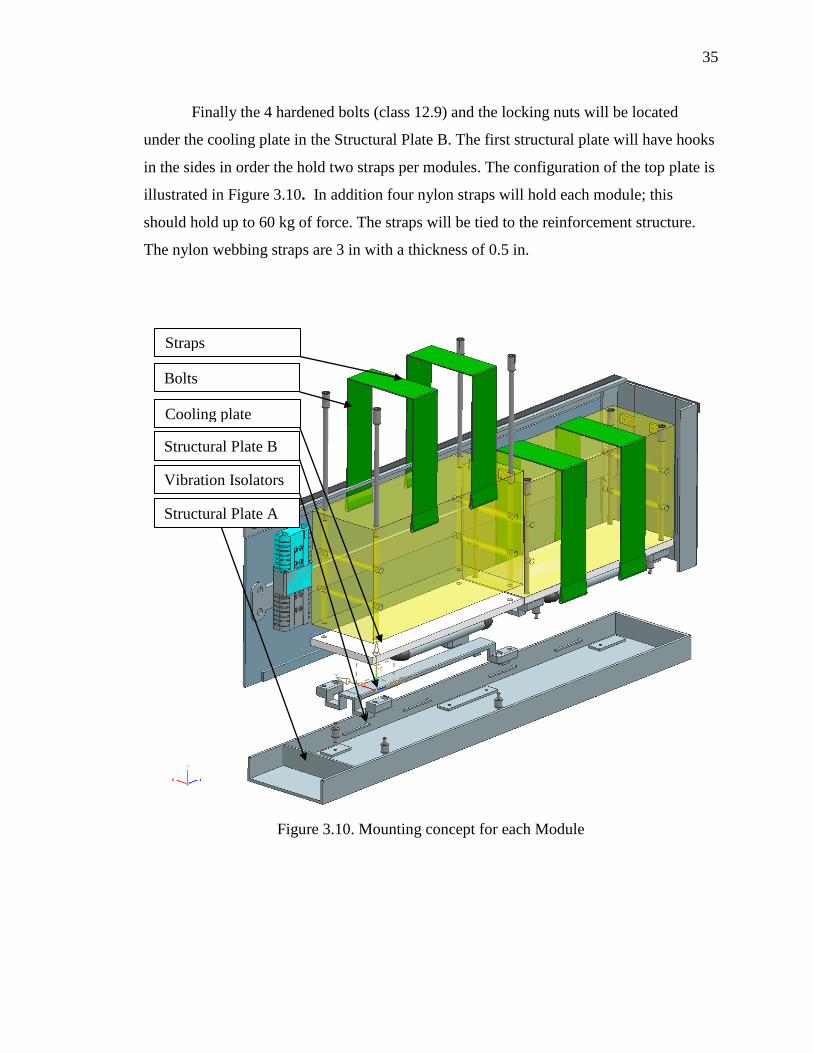
35
Finally the 4 hardened bolts (class 12.9) and the locking nuts will be located
under the cooling plate in the Structural Plate B. The first structural plate will have hooks
in the sides in order the hold two straps per modules. The configuration of the top plate is
illustrated in Figure 3.10. In addition four nylon straps will hold each module; this
should hold up to 60 kg of force. The straps will be tied to the reinforcement structure.
The nylon webbing straps are 3 in with a thickness of 0.5 in.
Figure 3.10. Mounting concept for each Module
Structural Plate A
Structural Plate B
Vibration Isolators
Cooling plate
Bolts
Straps
Page 47
36
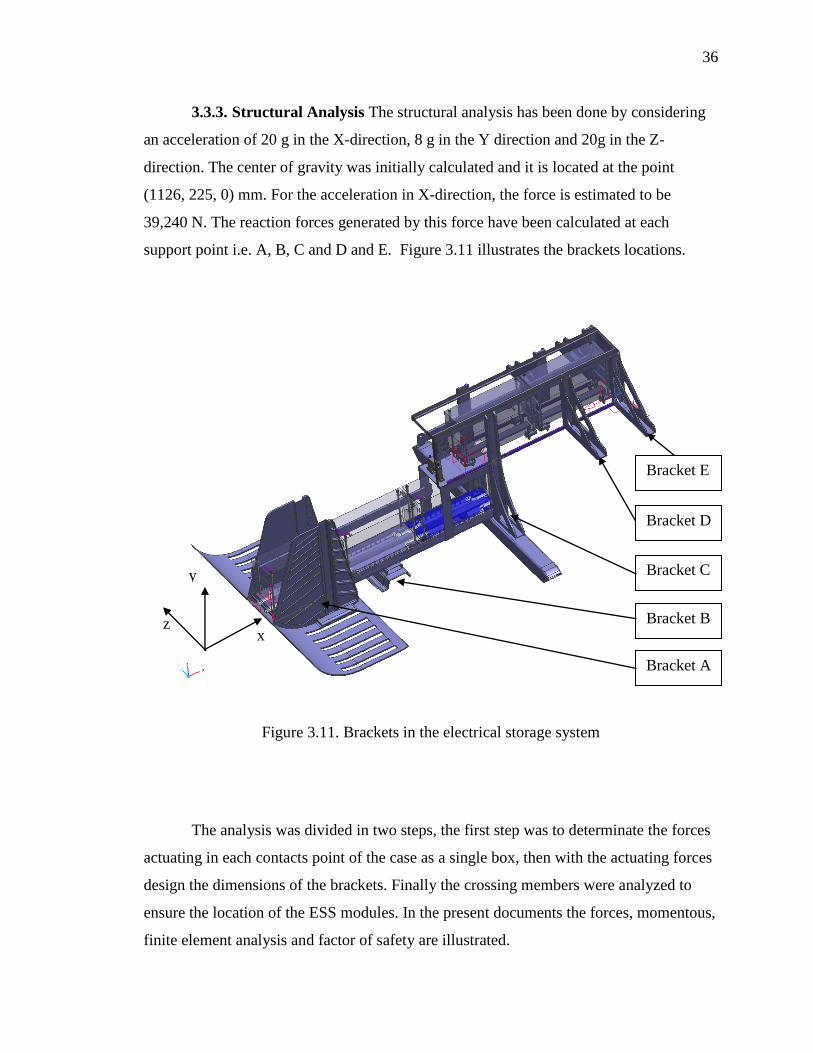
3.3.3. Structural Analysis The structural analysis has been done by considering
an acceleration of 20 g in the X-direction, 8 g in the Y direction and 20g in the Z-
direction. The center of gravity was initially calculated and it is located at the point
(1126, 225, 0) mm. For the acceleration in X-direction, the force is estimated to be
39,240 N. The reaction forces generated by this force have been calculated at each
support point i.e. A, B, C and D and E. Figure 3.11 illustrates the brackets locations.
Figure 3.11. Brackets in the electrical storage system
The analysis was divided in two steps, the first step was to determinate the forces
actuating in each contacts point of the case as a single box, then with the actuating forces
design the dimensions of the brackets. Finally the crossing members were analyzed to
ensure the location of the ESS modules. In the present documents the forces, momentous,
finite element analysis and factor of safety are illustrated.
Bracket E
Bracket D
Bracket C
Bracket B
Bracket A
x
y
z
Page 48
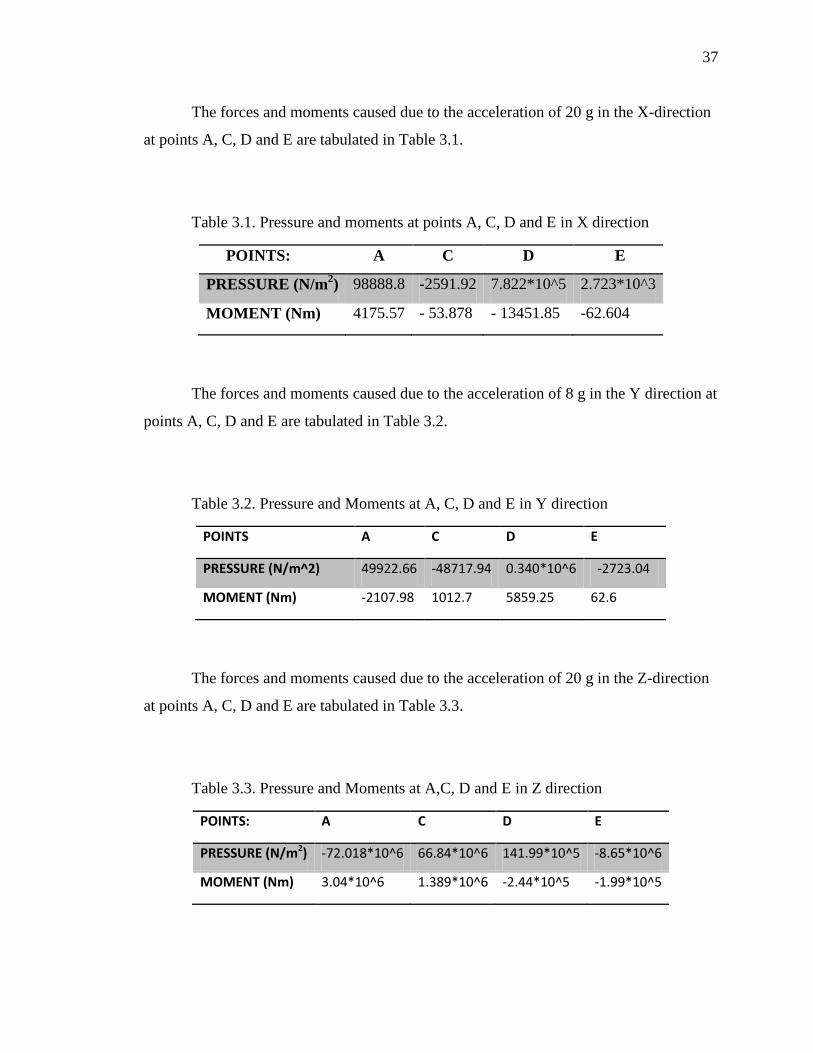
37
The forces and moments caused due to the acceleration of 20 g in the X-direction
at points A, C, D and E are tabulated in Table 3.1.
Table 3.1. Pressure and moments at points A, C, D and E in X direction
POINTS: A C D E
PRESSURE (N/m2) 98888.8 -2591.92 7.822*10^5 2.723*10^3
MOMENT (Nm) 4175.57 - 53.878 - 13451.85 -62.604
The forces and moments caused due to the acceleration of 8 g in the Y direction at
points A, C, D and E are tabulated in Table 3.2.
Table 3.2. Pressure and Moments at A, C, D and E in Y direction
POINTS A C D E
PRESSURE (N/m^2) 49922.66 -48717.94 0.340*10^6 -2723.04
MOMENT (Nm) -2107.98 1012.7 5859.25 62.6
The forces and moments caused due to the acceleration of 20 g in the Z-direction
at points A, C, D and E are tabulated in Table 3.3.
Table 3.3. Pressure and Moments at A,C, D and E in Z direction
POINTS: A C D E
PRESSURE (N/m2) -72.018*10^6 66.84*10^6 141.99*10^5 -8.65*10^6
MOMENT (Nm) 3.04*10^6 1.389*10^6 -2.44*10^5 -1.99*10^5
Page 49
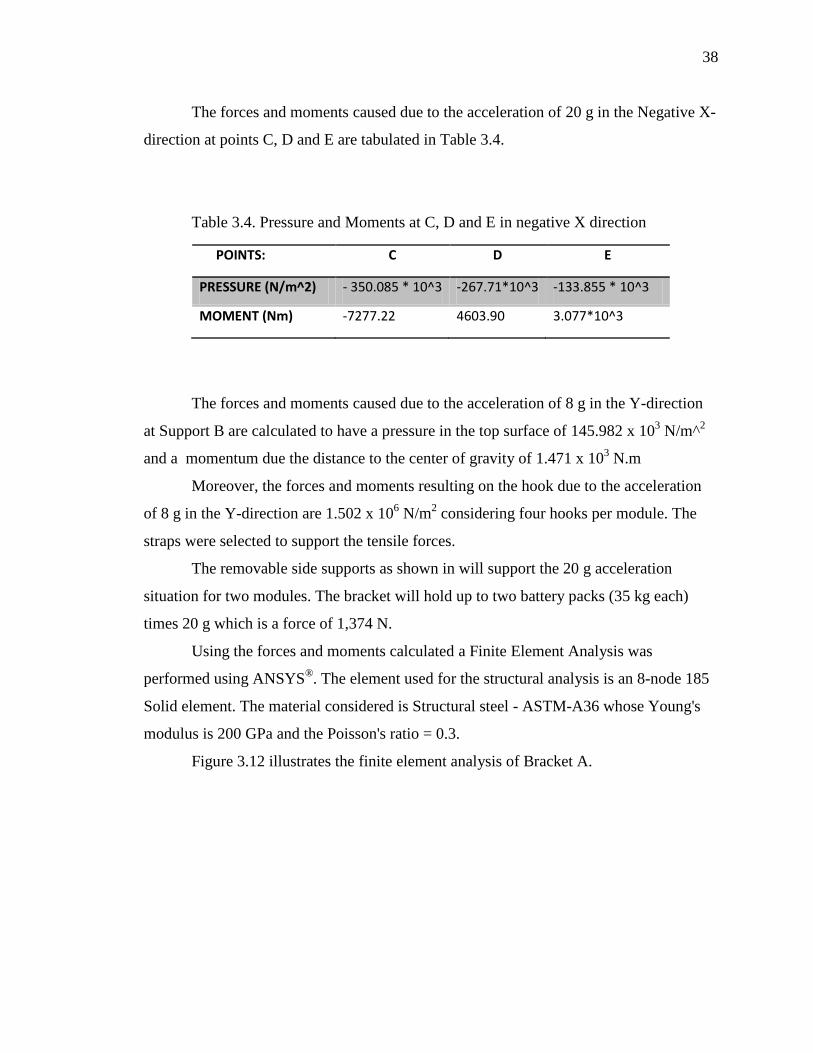
38
The forces and moments caused due to the acceleration of 20 g in the Negative X-
direction at points C, D and E are tabulated in Table 3.4.
Table 3.4. Pressure and Moments at C, D and E in negative X direction
POINTS: C D E
PRESSURE (N/m^2) - 350.085 * 10^3 -267.71*10^3 -133.855 * 10^3
MOMENT (Nm) -7277.22 4603.90 3.077*10^3
The forces and moments caused due to the acceleration of 8 g in the Y-direction
at Support B are calculated to have a pressure in the top surface of 145.982 x 10³ N/m^
2
and a momentum due the distance to the center of gravity of 1.471 x 10³ N.m
Moreover, the forces and moments resulting on the hook due to the acceleration
of 8 g in the Y-direction are 1.502 x 10⁶ N/m
2 considering four hooks per module. The
straps were selected to support the tensile forces.
The removable side supports as shown in will support the 20 g acceleration
situation for two modules. The bracket will hold up to two battery packs (35 kg each)
times 20 g which is a force of 1,374 N.
Using the forces and moments calculated a Finite Element Analysis was
performed using ANSYS®. The element used for the structural analysis is an 8-node 185
Solid element. The material considered is Structural steel - ASTM-A36 whose Young's
modulus is 200 GPa and the Poisson's ratio = 0.3.
Figure 3.12 illustrates the finite element analysis of Bracket A.
Page 50
39
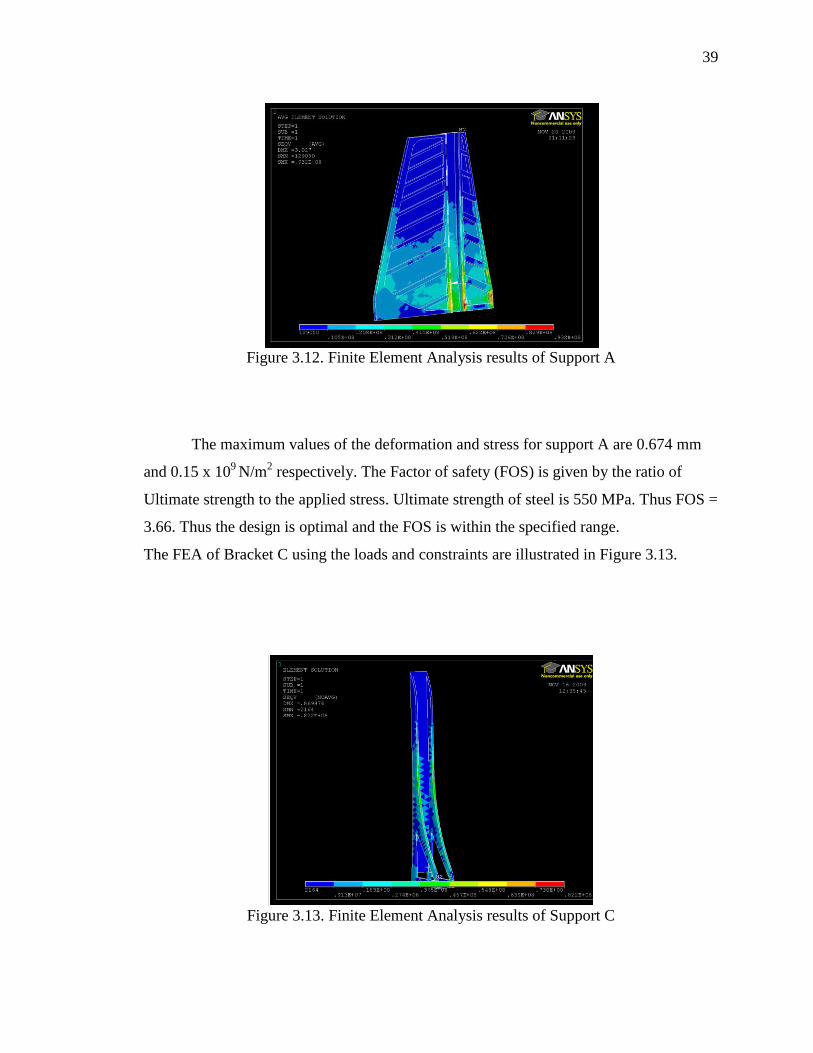
Figure 3.12. Finite Element Analysis results of Support A
The maximum values of the deformation and stress for support A are 0.674 mm
and 0.15 x 10⁹ N/m
2 respectively. The Factor of safety (FOS) is given by the ratio of
Ultimate strength to the applied stress. Ultimate strength of steel is 550 MPa. Thus FOS =
3.66. Thus the design is optimal and the FOS is within the specified range.
The FEA of Bracket C using the loads and constraints are illustrated in Figure 3.13.
Figure 3.13. Finite Element Analysis results of Support C
Page 51
40
The maximum values of the deformation, stress and strain for Support C are 2.162
mm and 0.822 x 10⁸
The Factor of safety (FOS) is given by the ratio of ultimate strength
to the applied stress. Ultimate strength of steel is 550 MPa. Thus FOS = (550 x
106)/(0.822x10
8) = 6.690. Thus the design is optimal.
The FEA of Bracket D using the loads and constraints are illustrated in Figure
3.14.
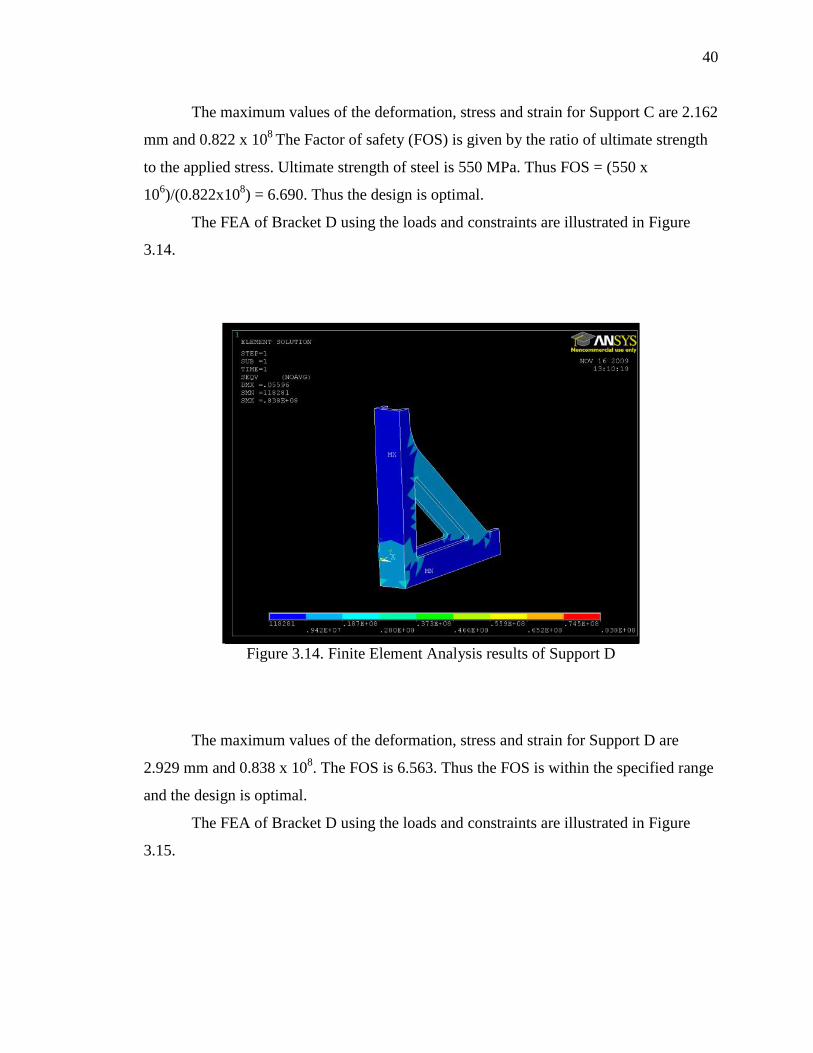
Figure 3.14. Finite Element Analysis results of Support D
The maximum values of the deformation, stress and strain for Support D are
2.929 mm and 0.838 x 10⁸. The FOS is 6.563. Thus the FOS is within the specified range
and the design is optimal.
The FEA of Bracket D using the loads and constraints are illustrated in Figure
3.15.
Page 52
41
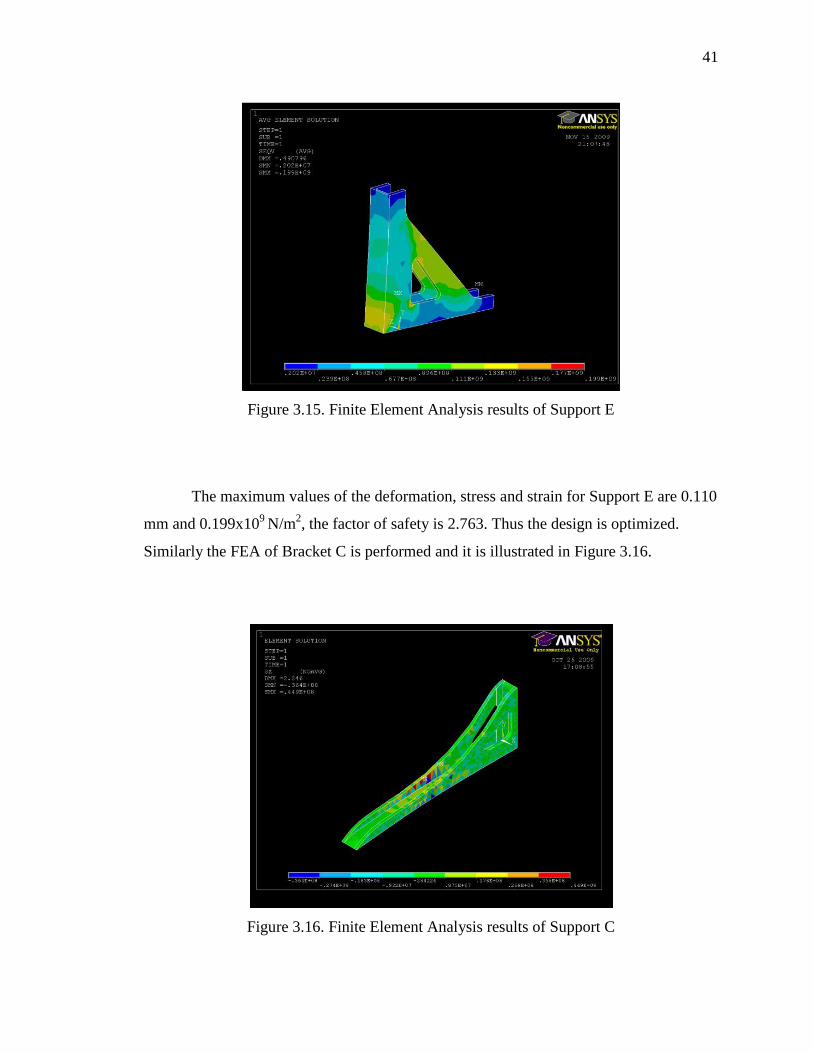
Figure 3.15. Finite Element Analysis results of Support E
The maximum values of the deformation, stress and strain for Support E are 0.110
mm and 0.199x10⁹
N/m2, the factor of safety is 2.763. Thus the design is optimized.
Similarly the FEA of Bracket C is performed and it is illustrated in Figure 3.16.
Figure 3.16. Finite Element Analysis results of Support C
Page 53
42
The maximum values of the deformation and stress for Support C are 7.06 mm
and 0.449 x10⁸ N/m
2. The Factor of safety (FOS) is 12.25. Thus the design of the Support
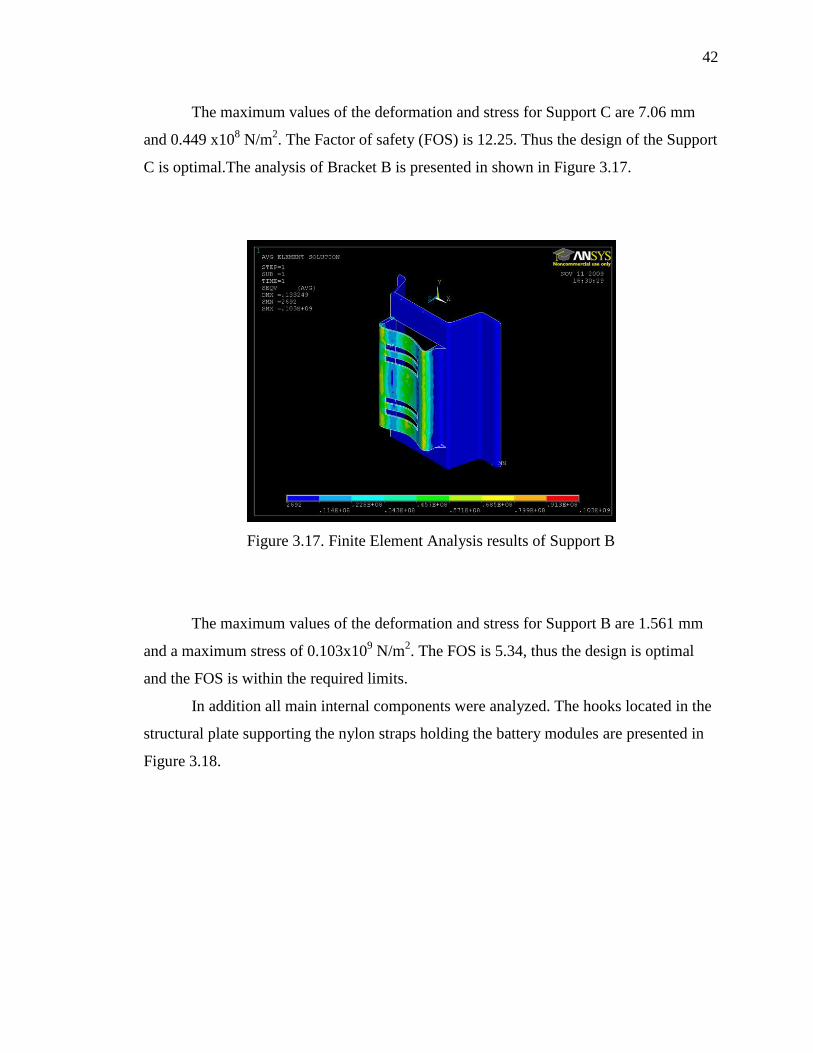
C is optimal.The analysis of Bracket B is presented in shown in Figure 3.17.
Figure 3.17. Finite Element Analysis results of Support B
The maximum values of the deformation and stress for Support B are 1.561 mm
and a maximum stress of 0.103x10⁹ N/m
2. The FOS is 5.34, thus the design is optimal
and the FOS is within the required limits.
In addition all main internal components were analyzed. The hooks located in the
structural plate supporting the nylon straps holding the battery modules are presented in
Figure 3.18.
Page 54
43
Figure 3.18. Finite Element Analysis results of the Hook
The maximum values of the deformation and stress for the hook are 1.766 mm
and 0.267x10⁹ N/m
2. The factor of safety is 2.06.
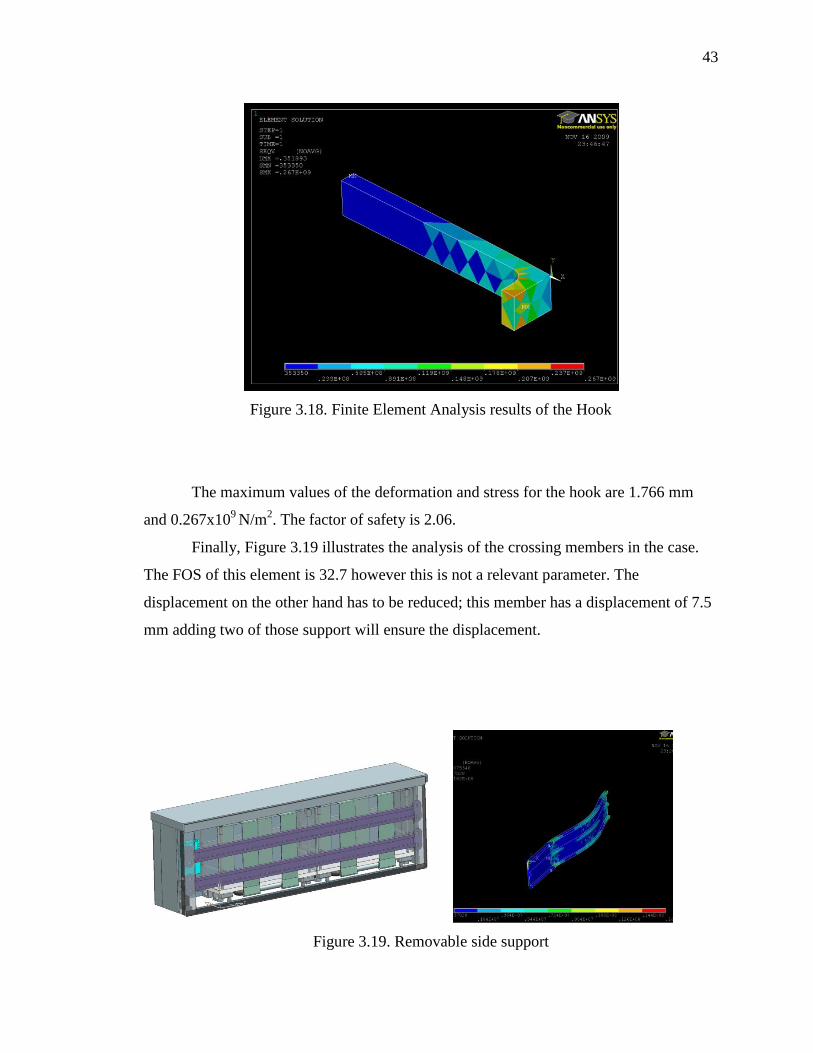
Finally, Figure 3.19 illustrates the analysis of the crossing members in the case.
The FOS of this element is 32.7 however this is not a relevant parameter. The
displacement on the other hand has to be reduced; this member has a displacement of 7.5
mm adding two of those support will ensure the displacement.
Figure 3.19. Removable side support
Page 55
44
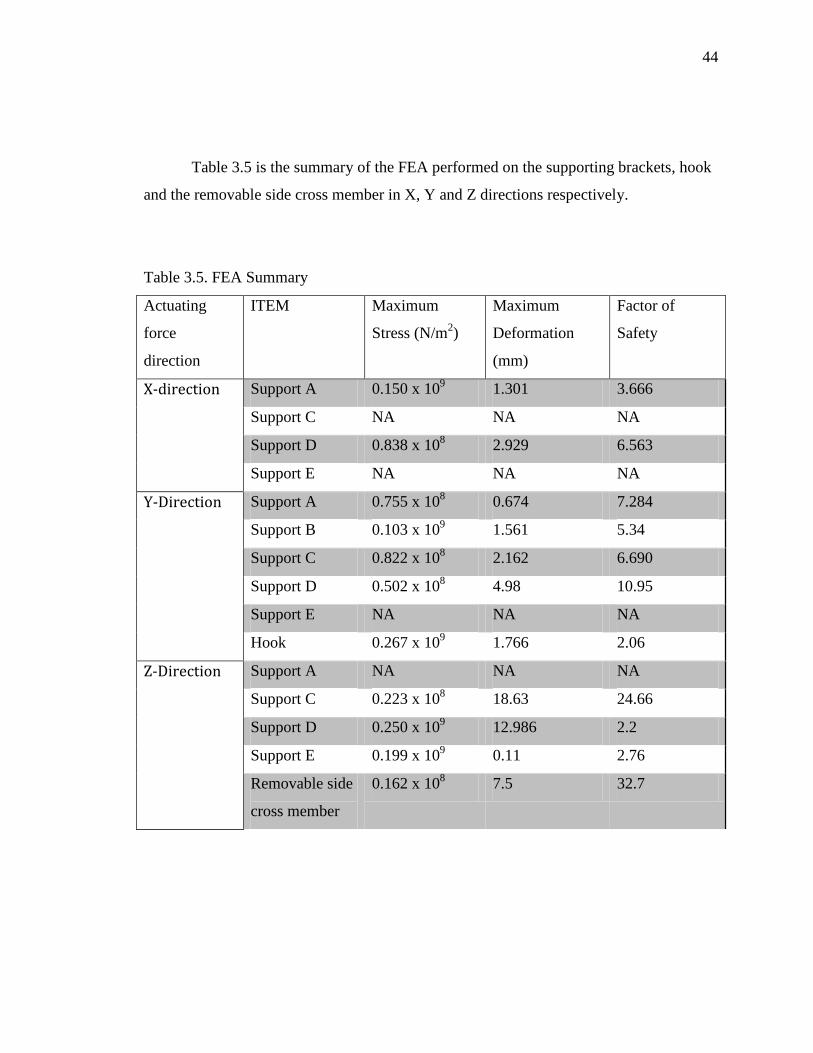
Table 3.5 is the summary of the FEA performed on the supporting brackets, hook
and the removable side cross member in X, Y and Z directions respectively.
Table 3.5. FEA Summary
Actuating
force
direction
ITEM Maximum
Stress (N/m2)
Maximum
Deformation
(mm)
Factor of
Safety
X-direction Support A 0.150 x 10⁹ 1.301 3.666
Support C NA NA NA
Support D 0.838 x 10⁸ 2.929 6.563
Support E NA NA NA
Y-Direction Support A 0.755 x 10⁸ 0.674 7.284
Support B 0.103 x 10⁹ 1.561 5.34
Support C 0.822 x 10⁸ 2.162 6.690
Support D 0.502 x 10⁸ 4.98 10.95
Support E NA NA NA
Hook 0.267 x 10⁹ 1.766 2.06
Z-Direction Support A NA NA NA
Support C 0.223 x 10⁸ 18.63 24.66
Support D 0.250 x 10⁹ 12.986 2.2
Support E 0.199 x 10⁹ 0.11 2.76
Removable side
cross member
0.162 x 10⁸ 7.5 32.7
Page 56
45
3.3.4. Vibration Analysis
The recommendation of the battery manufacture is to have a system of natural
frequency more than 50 Hz in combine with the vibration isolators. The team decided to
uses four vibration isolators per module. The weight of each module is almost 16 kg.
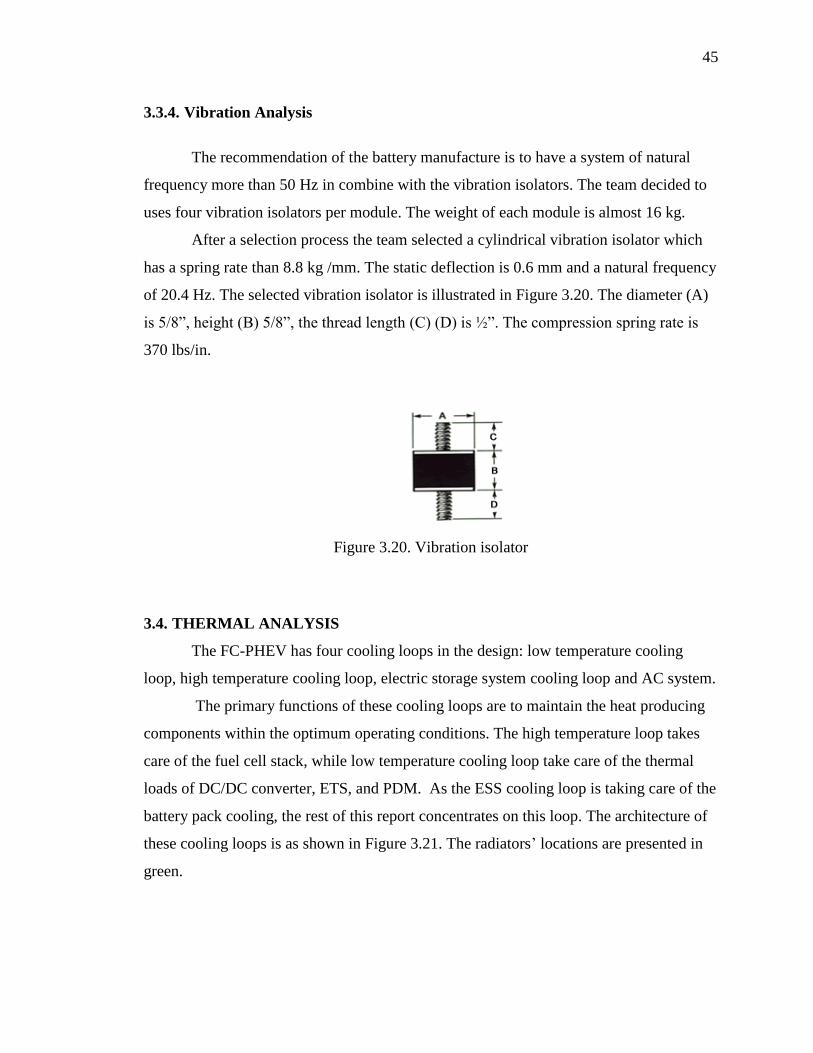
After a selection process the team selected a cylindrical vibration isolator which
has a spring rate than 8.8 kg /mm. The static deflection is 0.6 mm and a natural frequency
of 20.4 Hz. The selected vibration isolator is illustrated in Figure 3.20. The diameter (A)
is 5/8”, height (B) 5/8”, the thread length (C) (D) is ½”. The compression spring rate is
370 lbs/in.
Figure 3.20. Vibration isolator
3.4. THERMAL ANALYSIS
The FC-PHEV has four cooling loops in the design: low temperature cooling
loop, high temperature cooling loop, electric storage system cooling loop and AC system.
The primary functions of these cooling loops are to maintain the heat producing
components within the optimum operating conditions. The high temperature loop takes
care of the fuel cell stack, while low temperature cooling loop take care of the thermal
loads of DC/DC converter, ETS, and PDM. As the ESS cooling loop is taking care of the
battery pack cooling, the rest of this report concentrates on this loop. The architecture of
these cooling loops is as shown in Figure 3.21. The radiators’ locations are presented in
green.
Page 57
46
Figure 3.21. The ESS cooling loop
The high temperature flow which carries the heat produced from the battery
modules is fed directly to the radiator pack through a reducing valve. The function of the
reducing valve is to increase the heat transfer rate in the radiator. The radiator pack
consists of four different radiators and a fan to provide the necessary air flow rates into
the radiator. The stack consists of the ESS radiator, HVAC, Power electronics, and Fuel
cell radiator. All the radiators use water glycol mixture except the fuel cell radiator. Fuel
cell radiator is a custom build radiator which uses de ionized water as the coolant. All
other radiators are already installed in the Saturn VUE provided by GM to Missouri S&T.
In order to determine the heat loads of each battery module, a simulation based on
the drive cycle is done over a period of time. The drive cycle chosen is based on the
worst case scenario of producing maximum heat. The team ran the drive cycles in the
Simulink® model and determines the load requirements for the drive cycle at different
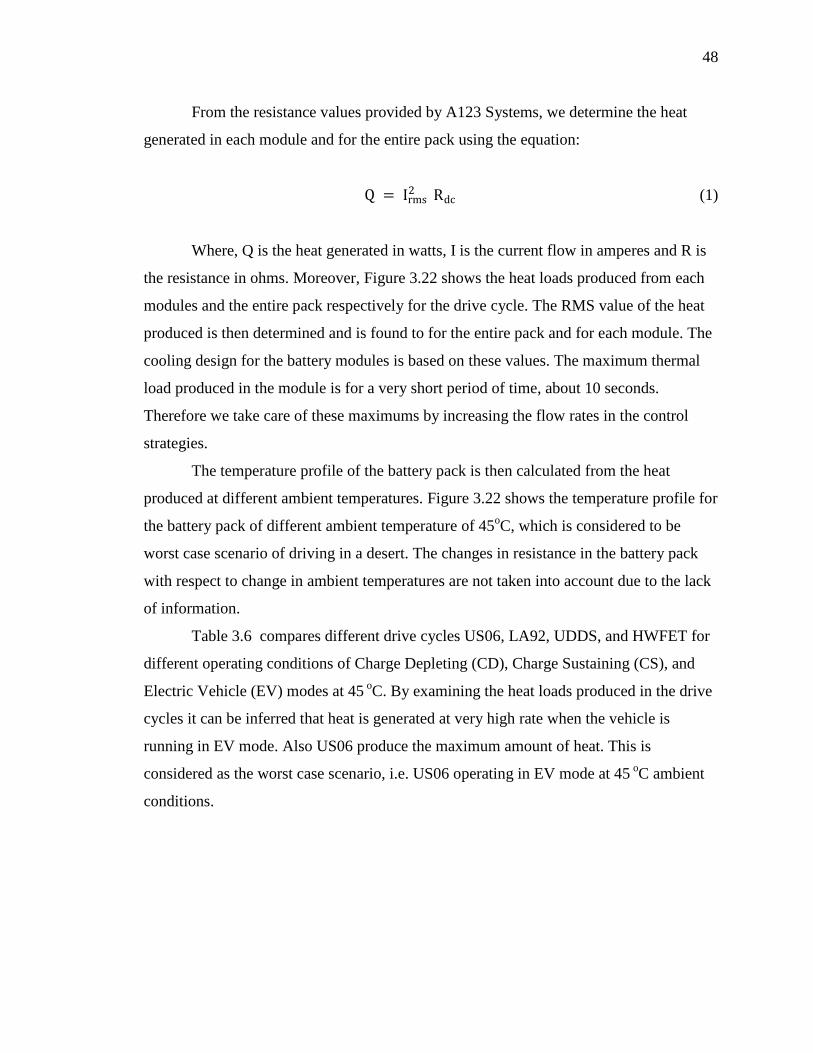
operating conditions. For example, the top graph in Figure 3.22 represents the power
requirement of the battery pack over the US06 drive cycle. The Powertrain System
Analysis Toolkit PSAT models were used to complement the conditions of the analysis.
Five cooling plates connected in
series
Page 58
47
Figure 3.22. US06 Drivecycle PSAT and Simulink Simulation
It can be inferred from the simulation that the RMS value of the power
requirement from the entire battery pack is 33 kW or a 2C discharge. Then the power
flow from the entire battery pack for the drive cycle is also determined as shown in
second graph.
0 200 400 600 800 1000 1200 14000
10
20
30Vehicle Linear Speed
Time (s)
Speed (
m/s
)
0 200 400 600 800 1000 1200 14000
1
2
3
4
5
x 104 Power of Energy Storage System (Red) vs Electric Traction System (Blue)
Time (s)
Pow
er
(W)
0 200 400 600 800 1000 1200 14000
200
400
600
800Heat Generated in One 25s2P Module
Time (s)
Heat
(W)
0 200 400 600 800 1000 1200 140045
45.5
46
46.5
47Temperature of One 25s2P Module
Time (s)
Tem
pera
ture
(C
)
Page 59
48
From the resistance values provided by A123 Systems, we determine the heat
generated in each module and for the entire pack using the equation:
Q = Irms2 Rdc (1)
Where, Q is the heat generated in watts, I is the current flow in amperes and R is
the resistance in ohms. Moreover, Figure 3.22 shows the heat loads produced from each
modules and the entire pack respectively for the drive cycle. The RMS value of the heat
produced is then determined and is found to for the entire pack and for each module. The
cooling design for the battery modules is based on these values. The maximum thermal
load produced in the module is for a very short period of time, about 10 seconds.
Therefore we take care of these maximums by increasing the flow rates in the control
strategies.
The temperature profile of the battery pack is then calculated from the heat
produced at different ambient temperatures. Figure 3.22 shows the temperature profile for
the battery pack of different ambient temperature of 45oC, which is considered to be
worst case scenario of driving in a desert. The changes in resistance in the battery pack
with respect to change in ambient temperatures are not taken into account due to the lack
of information.
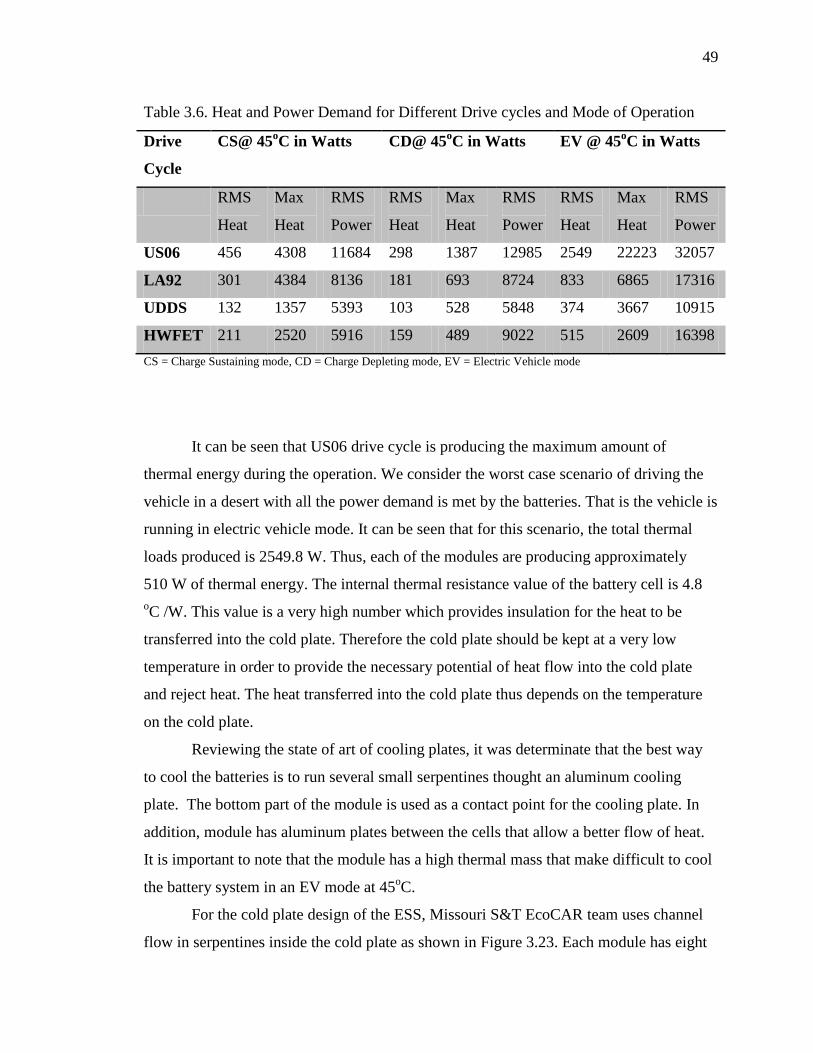
Table 3.6 compares different drive cycles US06, LA92, UDDS, and HWFET for
different operating conditions of Charge Depleting (CD), Charge Sustaining (CS), and
Electric Vehicle (EV) modes at 45 oC. By examining the heat loads produced in the drive
cycles it can be inferred that heat is generated at very high rate when the vehicle is
running in EV mode. Also US06 produce the maximum amount of heat. This is
considered as the worst case scenario, i.e. US06 operating in EV mode at 45 oC ambient
conditions.
Page 60
49
Table 3.6. Heat and Power Demand for Different Drive cycles and Mode of Operation
Drive
Cycle
CS@ 45oC in Watts CD@ 45
oC in Watts EV @ 45
oC in Watts
RMS
Heat
Max
Heat
RMS
Power
RMS
Heat
Max
Heat
RMS
Power
RMS
Heat
Max
Heat
RMS
Power
US06 456 4308 11684 298 1387 12985 2549 22223 32057
LA92 301 4384 8136 181 693 8724 833 6865 17316
UDDS 132 1357 5393 103 528 5848 374 3667 10915
HWFET 211 2520 5916 159 489 9022 515 2609 16398
CS = Charge Sustaining mode, CD = Charge Depleting mode, EV = Electric Vehicle mode
It can be seen that US06 drive cycle is producing the maximum amount of
thermal energy during the operation. We consider the worst case scenario of driving the
vehicle in a desert with all the power demand is met by the batteries. That is the vehicle is
running in electric vehicle mode. It can be seen that for this scenario, the total thermal
loads produced is 2549.8 W. Thus, each of the modules are producing approximately
510 W of thermal energy. The internal thermal resistance value of the battery cell is 4.8
oC /W. This value is a very high number which provides insulation for the heat to be
transferred into the cold plate. Therefore the cold plate should be kept at a very low
temperature in order to provide the necessary potential of heat flow into the cold plate
and reject heat. The heat transferred into the cold plate thus depends on the temperature
on the cold plate.
Reviewing the state of art of cooling plates, it was determinate that the best way
to cool the batteries is to run several small serpentines thought an aluminum cooling
plate. The bottom part of the module is used as a contact point for the cooling plate. In
addition, module has aluminum plates between the cells that allow a better flow of heat.
It is important to note that the module has a high thermal mass that make difficult to cool
the battery system in an EV mode at 45oC.
For the cold plate design of the ESS, Missouri S&T EcoCAR team uses channel
flow in serpentines inside the cold plate as shown in Figure 3.23. Each module has eight
Page 61
50
serpentines that are connect to a manifold. The plates are connected in series but the
serpentines are connected in parallel.
Figure 3.23. Cooling plate design for each module
3.5. FAILURE ANALYSIS
In order to perform a correct failure analysis of the Electrical Storage System,
Missouri S&T EcoCAR team is developing a Fault Tree Analysis to identify all the
possible events and the consequences in the ESS operation. Missouri S&T used
BLOCKSIMS 7® part of the family ReliaSoft Office as the software tool. Blocksims
allows the user to perform a deductive and inductive analysis. There are several blocks
that the software provide the users such as the "OR", "AND", "INHIBIT", "TRIGGER
EVENT". The top event is identified as the failure of the Electrical Storage System. Since
the ESS is an integration of several systems, some of them mechanical, electrical, and
controls the ESS failure has to be related with any of those systems. Figure 3.24 presents
the three first levels of failure of the Electrical Storage System. The ESS failure is
defined as failure in operation or safety. The assumptions of the ESS FTA are:
The FTA is considering a steady state of operation
Page 62
51
All the components will be assumed to be in the useful life in the bathlub curve,
the error of this assumption will cause a possible failure in the production part of
the curve.
The FTA is using a hardware approach.
The ESS is already located in the vehicle and operational.
Figure 3.24. FTA for ESS Failure
The six subsystems described above are detailed developed, they are: Cooling
System Failure, Other mechanical systems failure, control system hardware failure,
control system hardware failure, wiring system failure in the electrical system and
electrical components failure. Figure 3.25 presents the structural system failure, in this
FTA there are two trigger events that can required the actuation of two subsystems. The
first one is extreme structural conditions, i.e. the side or front crash collision that will
generate a side acceleration of 20g or a rollover accident which generates an acceleration
of 8g upside down. The second trigger accident would be the wrong operation of the
ESS modules which will partially o totally produce dangerous gases, this event will
required the operation of the venting system, the rupture disc/valve might be the critical
component in this scenario. The other sub-systems of failure are described in Figure 3.26-
30
Page 63
52
Figure 3.25. FTA for Mechanical Systems Failures
Page 64
53
Figure 3.26. FTA for Cooling System Failure
Page 65
54
Figure 3.27. FTA for ESS Controls Failure
Page 66
55
Figure 3.28. FTA for Control Hardware Failure
Page 67
56
Figure 3.29. FTA for Wiring Failure
Page 68
57
Figure 3.30. FTA for Electrical Devices Failure
There had been indentified 107 basic events between the threes system that may
cause the failure of the ESS. The interaction between the controls, electrical and
mechanical events are critical for the ESS. It is hard to isolate the events because one non
failure event in the mechanical system can cause a failure in the control system.
Page 69
58
4. COSTS ANALYSIS
The reason of the present chapter is to illustrate the current costs of developing a
high voltage electrical storage system for an extended range vehicle. The main
component, which is the lithium ion modules and the corresponding power electronics,
has been donated from A123 Systems®.
Moreover, the engineering of developing the cooling system, electrical system
and structural analysis is another factor no considered in this document. It took for to the
team almost a year to determinate the best location of the ESS in the vehicle and to
develop the casing going through several prototypes.
The other main components such as the DC/DC converter and the high voltage
charger were bought from BRUSA® accumulating a total cost of $35,000. These include
controls software and standard high voltage wiring. The ESS PDM was entirely
developed in the electrical area of the Missouri S&T EcoCAR team. The design was
perform for the engineering team as well as the electrical senior design team.
In the Mechanical point of view the original design presented in this document
was on steel basis with a total cost in material of $2,500 due the weight limit and
manufacturability the team decide to develop a second prototype in aluminum with a
materials cost of $5,000 the detailed description of material cost are presented in
APPENDIXE B. The team received the manufacturing of these components as a donation
of Bachman Machine Company. In addition, other minor costs for the case are the hex
bolts Grade 12.9 representing $300, vibration isolators $25, nylon straps $60, rupture disc
$80, and other minor accessories $100.
The total cost of the battery case was $40,656. This number represents an
important opportunity for future manufacturing research to reduce the cost and hence
make this technology commercial.
Page 70
59
5. CONCLUSIONS AND FUTURE WORK
An entire high voltage pack was develop in Missouri S&T as part of the EcoCAR:
The NeXt Challenge competition and it is presented in this document, the design
considered several aspects and requirements such as weight, exhaust venting, cooling
systems, electrical systems, vibration isolation and structural support. The ESS represents
one of the most important components in the develop of the Missouri S&T EcoCAR team
Fuel Cell Plug-in Hybrid Electric Vehicle.
The several pathways to produce hydrogen and electricity make the FC-PHEV an
ultimate vehicle and it represents a great opportunity of sustainable transportation. These
vehicles can run entirely by renewable energies and hence be a ZERO emissions vehicle
from Well to the Wheel.
There are several researches on extended range vehicles, some of the main
challenges are the cooling systems, battery chemical and increasing the efficiency of
power electronics such as inverters and DC/DC converters. Similarly to the PEM Fuel
Cell, the cost of manufacturing of this type in mass production represents a great
opportunity of future research.
The next step of this prototype is to develop a refrigerant cooling system to cool
the batteries in all EV mode, the goal is to increase the temperature difference. Another
possibility is to run the cooling system between the cells of the prismatic module to
reduce the thermal mass of the modules.
Moreover, the functionality of this ESS would increase if the team is able to
remove the air bag sensor to relocate under the ESS and relocate the ESS in a lower
position. Add ergonometric to the shape of the battery case to increase the consumer
acceptability is an important factor that can be improved in this prototype.
The original design of the ESS was on steel basis, but the team moves to
aluminum structure to reduce the weight of the case. The next step of this prototype is to
use carbon fiber or composite materials. In a mass production case the carbon fiber
option would be the most feasible solution.
Page 71
60
The objective of the Fault Tree Analysis is to identify all possible events that
might cause a system failure. This analysis can be improved if the probabilities of each
components failure are added. The software used for the team allows the user to calculate
the final probability of failure and move to a Design Failure Mode Effects Analysis
(DFMEA).
The total cost of the ESS is $40,656 however this price does not include the cost
of the lithium-ion modules which represents the main cost. The total weight of the system
is 322.65 kg which represents an energy/ weight ratio of 46.59 Wh/kg.
Page 72
61
APPENDIX A.
RUPTURE DISC FOR EXHAUST SYSTEM
Page 76
65
.
APPENDIX B.
MECHANICAL COMPONENTS FOR THE ESS
Page 77
66
Part Quantity
Dimensions
In. Description
Total
Price
4
8.26” x
2.36” x
25.75”
Thickness -
0.38”
4” x 3” x 240” Thickness-
3/8”
Two steel angles can be
placed side by side to get a
total of 8 inch. Accordingly
the length of 25.7” can be
cut apart. This is done both
horizontally and vertically.
The total 240” can be used
for all 4 beams.
$244.80
2
2.3” x 1.88”
x 51.6”
Thickness-
0.31”
3” x 2” x 48”
Thickness-3/8”
Two steel angles can be
placed one above the other
to get a U shape
$53.04
2
18.1” x
13.97” x
2.36”
Thickness-
0.38”
2” x 2” x 24”
Thickness - 3/8”
Two angles to be used one
in horizontal and another in
vertical direction and
are welded to get the
suitable dimensions.
$42.24
2
3.14” x 3.14”
x 31.5”
Thickness-
0..13”
3” x 2” x 72”
Thickness - ¼”
Two angles put side by side
are welded to get the
suitable dimensions.
$30.96
Page 78
67
1
3.14” x 3.14”
x 43.7”
Thickness-
0..15”
3” x 2” x 48”
Thickness - ¼”
Two angles put side by side
are welded to get the
suitable dimensions.
$20.64
1
8.54” x
19.68” x
11.81”
Two steels plates of
dimensions:
12” x 24” x ¼” and 12” x
12” x ¼”
are welded.
$52.16
2 25.7” x 10.1”
x 0.2” 24” x 12” x ¼” $62.88
2 28.74” x
13.07” x 0.2” 24” x 12” x ¼” $62.88
Page 79
68
1 46” x 13” x
8”
Two sheets are welded :
48” x 12” x 3/8” and 12” x
12” x 3/16”
$102.36
1 750” x 650”
x 209”
Three sheets are welded:
48” x 12” x ¼” $158.64
1 45.7” x 0.47”
x 0.78”
1-1/2” X ½” X 48”
Thickness-1/8” $10.08
2
2” x 2” x 46”
Thickness-
¼”
2” x 2” x 48”
Thickness-1/4” $31.36
Page 80
69
2
2” x 2” x
12.63”
Thickness-
¼”
2” x 2” x 24”
Thickness-1/4” $15.68
4 25.7” x 0.47”
x 0.78”
1-1/2” X 1/2” X 24”
Thickness-1/8” $20.16
2
45.2” x 7.9”
x 2”
Thickness-
¼”
48” x 12” x ¼” and 12” x
12” x ¼” welded together $147.20
2 37.2” x 6.53”
x 0.78” 48” X 12” X ¾” $576.54
1 13” X 7.9” X
0.35” 12” X 12” X 3/8” $36.08
Page 81
70
1
1.57” x 1.57”
x 7.5”
Thickness-
¼”
1.5” x 1.5” x 24”
Thickness-1/4” $5.84
2
29.7” X
0.78” X
0.39”
Thickness-
2.8”
1-1/2” X ½” X 48”
Thickness-1/8” $10.08
1 15.74” x 9.8”
x 0.19” 24” x 12” x ¼” $31.44
1
46.24” x
35.43” x
0.26”
48” x 48” x ¼” $114.24
2
24.54” x
20.27” x
1.06”
24” x 24” x 1” $530.08
2 21.45” x
0.46” x 0.35”
1-1/2” x ½” x 48”
Thickness-1/8” $10.08
Page 82
71
2 2” x 2” x
15.35”
2” x 2” x 24”
Thickness-1/4” $7.84
2 2” x 2” x
21.34”
2” x 2” x 24”
Thickness-1/4” $7.84
2 1.6” x 1.6” x
7.4”
2” x 2”x 24”
Thickness-1/4” $7.84
1 16.5” x 8.54”
x 0.39” 24” X 12” X 3/8” $52.16
2+2
21.45” x
0.59” x 0.25”
and
20.45” x
1.04” x
0.141”
12” x 12” x ¼” $20.72
Page 83
72
BIBLIOGRAPHY
[1] http://www.ecocarchallenge.org/ EcoCAR: The Next Challenge, February 2010.
[2] http://www.eia.doe.gov/oiaf/ieo/world.html U.S. Energy Information
Administration: Independent Statistics and Analysis, February 2010.
[3] http://www.eia.doe.gov/aer/pdf/pecss_diagram.pdf Primary Energy Consumption
by Sources and Sector 2008, February 2010.
[4] http://en.wikipedia.org/wiki/Oil_price_increases_since_2003 2000s energy crisis,
February 2010.
[5] http://en.wikipedia.org/wiki/Greenhouse_gas Greenhouse Gas. February 2010.
[6] Stern, Nicholas 2007. The Economics of Climate Change – The Stern Review
Cambridge, UK: Cambridge University Press. February, 2010.
[7] Alley, Richard; et al., “Climate Change 2007: The Physical Science Basis or
Policymakers”, 10th session of working group I of the IPCC, 2007.
[8] Yap, David; Reid, Neville; De Brou, Gary; Bloxam, Robert. “Transboundary Air
Pollution in Ontario Toronto” Ontario Ministry of Environment Report 2005.
[9] bp.com/statisticalreview BP Statistical Review of World Energy June 2009,
February 2010.
[10] http://web.mit.edu/mitei/research/spotlights/bandivadekar_thesis_final.pdf Anup
P. Bandivadekar “Evaluating the Impact of Advanced Vehicle and Fuel
Technologies in U.S. Light-Duty Vehicle Fleet.”, February 2010.
[11] BP Statistical Review of World Energy June 2009
http://www.bp.com/liveassets/bp_internet/globalbp/globalbp_uk_english/reports_
and_publications/statistical_energy_review_2008/STAGING/local_assets/2009_d
ownloads/statistical_review_of_world_energy_full_report_2009.pdf February
2010.
[12] BP Statistical Review of World Energy June 2009
http://www.bp.com/liveassets/bp_internet/globalbp/globalbp_uk_english/reports_
and_publications/statistical_energy_review_2008/STAGING/local_assets/2009_d
ownloads/statistical_review_of_world_energy_full_report_2009.pdf, February
2010.
[13] http://www.ieeeusa.org/policy/positions/PHEV0607.pdf , Position statement plug-
vehicles, February 2010.
Page 84
73
[14] http://en.wikipedia.org/wiki/Plug-in_hybri Plug-in hybrid, February 2010.
[15] http://www.gmvolt.com/img/upload/2011_chevy_volt_official10_.jpg Chevy
Volt, February 2010.
[16] http://image.motortrend.com/f/green/made-in-usa-gm-to-produce-2010-chevrolet-
volt-batteries-in-michigan/15564199+w750/2010-chevrolet-volt.jpg Chevy Volt,
February 2010.
[17] http://www.gm.com/experience/technology/fuel_cells/fact_sheets/equinox.html
Chevrolet Equinox Fuel Cell Spec Sheet, February 2010.
[18] http://i.livescience.com/images/071105-gm-equinox3-02.jpg, LiveSience,
February 2010.
[19] Erik Wilhelm, “Model-Based Validation of Fuel Cell Hybrid Vehicle Control
Systems Waterloo”, Ontario, Canada, 2007.
[20] Toshio Gonai, Takeshi Kiyokawa, Hiroyuki Yamazaki, Masayoshi Goto,
“Development of lithium ion battery system for space, report of the result on the
result of development of the lithium Ion battery system for space” Kamakura city,
Kanagawa, Japan 2003.
[21] Chris Mi, Ben Li , Derrick Buck, and Naoki Ota. “Advanced Electro-Thermal
um-ion Battery System for Hybrid Electric Vehicle Application” U.S.A 2007.
[22] http://www.ieahev.org/pdfs/annex_7/annex7_hev_final_rpt_110108.pdf Status
Overview of Hybrid and Electric Vehicle technology (2007), February 2010.
[23] http://en.wikipedia.org/wiki/Lithium-ion_battery, Lithium-ion batteries, February
2010.
[24] http://bioage.typepad.com/.a/6a00d8341c4fbe53ef01156ff5a3a8970b-800wi, a123
batteries, February 2010.
[25] http://content.edgar-online.com/edgar_conv_img/2009/09/24/0001047469-09-
008512_G692363.JPG , a123 batteries, February 2010.
[26] http://ecocarchallenge.mst.edu , Missouri S&T EcoCAR Team, February 2010.
[27] http://archive.ecocarphoto.com/c/ecocarphoto EcoCAR Pictures, February 2010.
[28] Andrew Meintz, Missouri S& EcoCAR Team, “EcoCAR progress report 4”,
Rolla Missouri December 2009.
Page 85
74
[29] Andrew Meintz, Mehdi Ferdowsi, Kevin B. Martin “Supervisory Control
Development of a Fuel Cell Plug-in Hybrid Electric Vehicle” IEEE, Missouri,
2009.
[30] Andrew Meintz, Joseph Ishaku, Edward Anculle, Kevin Martin Missouri S&T
EcoCAR Team, “EcoCAR progress report 4”, Rolla Missouri December 2009.
[31] http://green.autoblog.com/2006/11/06/gm-selects-quantum-fuel-systems-to-
produce-h2-storage-for-equino/ February 2010.
[32] http://www.blogcdn.com/green.autoblog.com/media/2006/11/qtww_tank.png
[33] Technical Session: Crash Safety Hydrogen Fuel Cell Vehicle: Safety &
Crashworthiness Mohammed Bahauddin, GM Javeed Mohammed, GM 2005 GM
Global CAE Conference, September 12-15, 2005.
[34] http://green.autoblog.com/gallery/general-motors-generation-v-fuel-cell-stack,
General Motors Generation V fuel cell stack, February, 2010.
[35] http://www.ecofriendlymag.com/wp-content/plugins/wp-o-
matic/cache/32db7_gen1-gen2-fcs-tale-of-tape1-copy.jpg GM Fuel Cell, February
2010.
[36] http://www.ecofriendlymag.com/wp-content/plugins/wp-o
matic/cache/32db7_gen1-gen2-fcs-tale-of-tape1-copy.jpg GM Fuel Cell,
February 2010.
[37] http://www.technologyreview.com/files/25804/auto_x600.jpg GM Fuel Cell,
February 2010.
[38] http://www.brusa.biz/products/e_nlg5112.htm high voltage charger, February
2010.
[39] http://www.brusa.biz/products/e_bdc412347.htm DC/DC converter, February
2010.
[40] http://www.fike.com/products/rdsrl.asp Fike rupture disc, March 2010.
[41] Christopher M. Huston, Murali Bottu, and Mehdi Ferdowsi , “Power Distribution
Module Design for the Energy Storage System in Missouri S&T’s EcoCAR”,
November 2009.
Page 86
75
VITA
Edward A. Anculle Arauco was born in Arequipa, Peru on June 15, 1984. He is a
Mechanical Engineer who grew up in Arequipa, Peru, a small city in the south of Peru
where he studied at De La Salle Private School. At 16 years old he was selected to
participate in a one-year high school exchange student program in California, U.S.
On May 2007, he received his Bachelor of Science in Mechanical Engineering from the
“Pontificia Universidad Catolica del Peru” in Lima, Peru where he was ranked 5th
in his
class. In order to obtain his Peruvian Engineering Degree he submitted and defended his
undergraduate thesis: “5.5 kW hydropower group using a centrifuge pump as a turbine”.
After working in several companies in Lima, Peru, he began his graduate studies in the
Mechanical and Aerospace Engineering Department at Missouri University of Science
and Technology, Rolla, Missouri. He serves as the Chief Technology Officer of the
Missouri S&T EcoCAR Team and Mechanical Team Leader. He received a Master
Degree in Mechanical Engineering on May 2010.