ANNUAL MEETING MASTER OF PETROLEUM ENGINEERING 03/May/2016 1 Integration of seismic interpretation in to geostatistical acoustic impedance Results presentation and discussion SERGIO CRUZ BARDERA Instituto Superior Técnico
Transcript
ANNUAL MEETING MASTER OF PETROLEUM ENGINEERING
03/May/2016 1
Integration of seismic interpretation in to geostatistical
acoustic impedance
Results presentation and discussion
SERGIO CRUZ BARDERA
Instituto Superior Técnico
Summary
03/May/2016 Instituto Superior Técnico 2
• Motivation
• Methodology
• Traditional Geostatistical seismic
inversion “GSI”
• GSI divided by zones
• Comparison of results
• Conclusion
• References
03/May/2016 Instituto Superior Técnico 3
Motivation
Traditional
GSI
It’s based on:
• 1 distribution function
• 1 variogram model
Distribution function of entire
Ip dataset
Horizontal variogram
Vertical variogram
Wells log data
Fullstack
03/May/2016 Instituto Superior Técnico 4
GSI
by zones
• It’s based on:
• 1 distribution function by zone
• 1 variogram model by zone
Distribution function
by zones
Set of
horizontal
variograms by
zones
Set of vertical
variograms by
zones
Motivation Wells log data
Fullstack in zones
03/May/2016 Instituto Superior Técnico 5
Methodology
• The traditional methodology GSI
(Geostatistical seismic inversion) allow the
inversion of post-stack reflection data,
directly for AI models.
• And uses a global optimizer based on a
cross-over genetic algorithm to converge
the simulated earth model, toward an
objective function, that consist on the
correlation coefficient between the real
seismic and the synthetic seismic volume.
03/May/2016 Instituto Superior Técnico 6
Dataset description
• 4 wells with Ip and Is, 3 wells assessed (A1,A3,A4) • Grid size: 398 x 598 x 200.
• Seismic volume of 794 inline by 1194
crossline
• sample rate of 4ms
Inline
Cro
sslin
e
03/May/2016 Instituto Superior Técnico 7
Model Definition for the traditional GSI
Inversion
area
H1
H1+100 ms
H1-700 ms
03/May/2016 Instituto Superior Técnico 8
Inversion
area
H1
H1+100 ms
H1-700 ms
Model Definition for the GSI by zones
03/May/2016 Instituto Superior Técnico 9
Inversion Parameterization
• 6 iterations between layers
• 32 models of Ip simulated at each iteration
• 3 well were used as conditioning data (A1, A3, A4)
• Spatial continuity pattern expressed by a variogram model with 2 structures – Vertical variogram from well-log data
– Horizontal variogram from seismic
• Cell thickness in k = 4 ms
03/May/2016 Instituto Superior Técnico 10
Inversion Parameterization:
Name Min Max Mean Std Var
Property 7214.42 11213.21 8266.45 659.52 434970.4
Well logs 6611.53 12019.38 8460.36 835.2 697563
Acoustic impedance values from the wells
Traditional GSI
03/May/2016 Instituto Superior Técnico 11
Results: best AI
model from last
iteration 6
Traditional GSI
Inline
Cro
sslin
e
03/May/2016 Instituto Superior Técnico 12
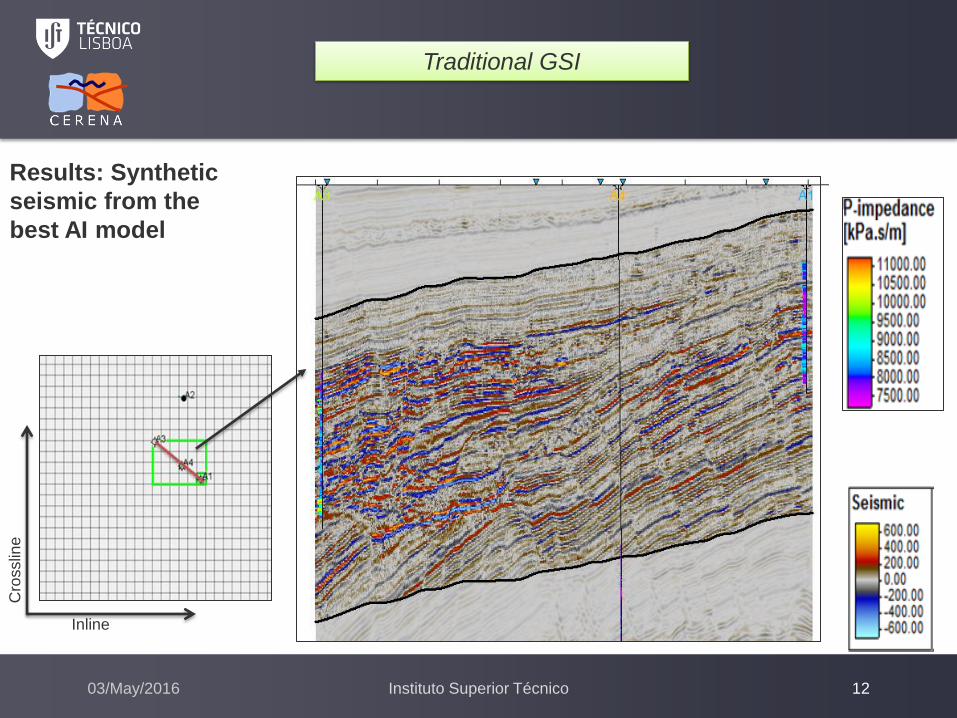
Results: Synthetic
seismic from the
best AI model
Traditional GSI
Inline
Cro
sslin
e
03/May/2016 Instituto Superior Técnico 13
Results: correlation between synthetic and real seismic
Global correlation coefficient between synthetic
computed from the best model of the last iteration
and real seismic ~0.951
Traditional GSI
03/May/2016 Instituto Superior Técnico 14
Results: local correlation coefficients from last iteration
Traditional GSI
Inline
Cro
sslin
e
03/May/2016 Instituto Superior Técnico 15
Results: standard deviation
Traditional GSI
Inline
Cro
sslin
e
03/May/2016 Instituto Superior Técnico 16
Results: mean AI
model from last
iteration
Traditional GSI
Inline
Cro
sslin
e
03/May/2016 Instituto Superior Técnico 17
Results: Synthetic
seismic from mean
AI model from last
iteration
Traditional GSI
Inline
Cro
sslin
e
03/May/2016 Instituto Superior Técnico 18
Results: correlation between synthetic and real seismic
Global correlation coefficient between synthetic
computed from mean model and real seismic
~0.946
Traditional GSI
03/May/2016 Instituto Superior Técnico 19
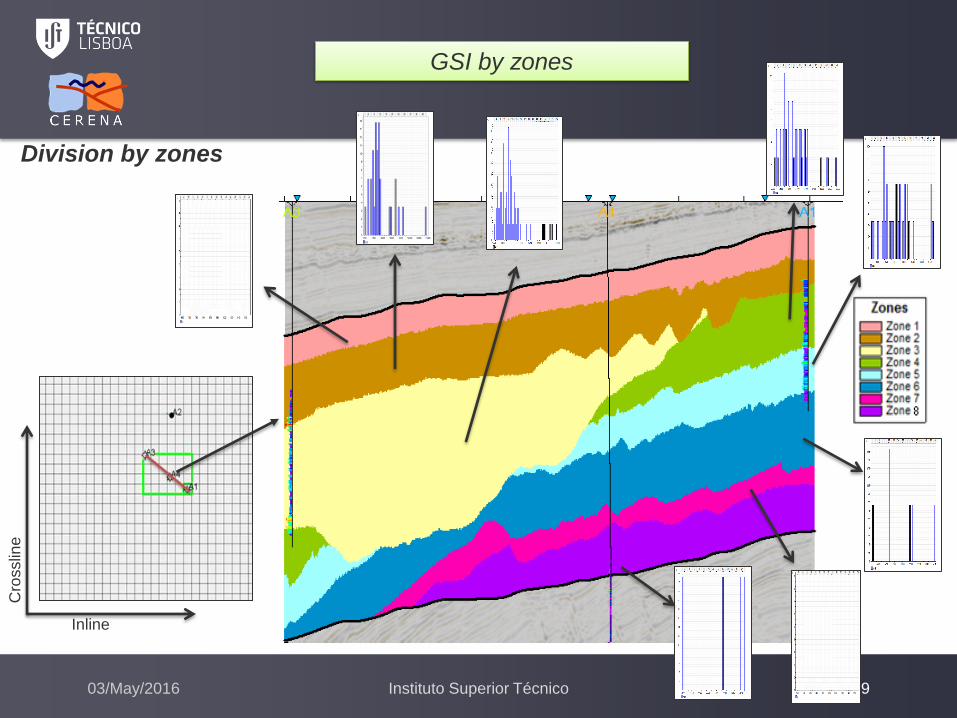
Division by zones
GSI by zones
Inline
Cro
sslin
e
03/May/2016 Instituto Superior Técnico 20
Inversion
Parameterizatio
n:
• Histograms of Ip dataset of
all zones 1-8.
• Zones 1 and 7 have the
same dataset with the
entire Ip data but with
coordinates far away from
the study area because
they had not any data.
Zone1 zone2 zone3 zone4
Zone5 zone6 zone7 zone8
• In zones 6 and 8 have
been included all dataset
of Ip as well, because
their dataset were not
enough to simulate the
methodology
GSI by zones
03/May/2016 Instituto Superior Técnico 21
Results: best AI
model from last
iteration 6
GSI by zones
Inline
Cro
sslin
e
03/May/2016 Instituto Superior Técnico 22
Results: Synthetic
seismic from the
best AI model
GSI by zones
Inline
Cro
sslin
e
03/May/2016 Instituto Superior Técnico 23
Results: correlation between synthetic and real seismic
Global correlation coefficient between synthetic
computed from the best model of the last iteration
and real seismic ~0.926
GSI by zones
03/May/2016 Instituto Superior Técnico 24
Results: local correlation coefficients from last iteration
GSI by zones
Inline
Cro
sslin
e
03/May/2016 Instituto Superior Técnico 25
Results: standard deviation
GSI by zones
Inline
Cro
sslin
e
03/May/2016 Instituto Superior Técnico 26
Results: mean AI
model from last
iteration
GSI by zones
Inline
Cro
sslin
e
03/May/2016 Instituto Superior Técnico 27
Results: Synthetic
seismic from mean
AI model from last
iteration
GSI by zones
Inline
Cro
sslin
e
03/May/2016 Instituto Superior Técnico 28
Results: correlation between synthetic and real seismic
Global correlation coefficient between synthetic
computed from mean model and real seismic
~0.922
GSI by zones
03/May/2016 Instituto Superior Técnico 29
Comparison of results
Best model by zones Best model without zones Fullstack seismic
Zone1
Zone2
Zone3
Zone4
Zone5
Zone6
Zone7
Zone8
03/May/2016 Instituto Superior Técnico 30
Comparison of results
Fullstack seismic Std desviation without zones Std desviation by zones
Zone1
Zone2
Zone3
Zone4
Zone5
Zone6
Zone7
Zone8
03/May/2016 Instituto Superior Técnico 31
Comparison of results
Best model by zones Best model without zones Fullstack seismic
Zone1
Zone2
Zone3
Zone4
Zone5
Zone6
Zone7
Zone8
03/May/2016 Instituto Superior Técnico 32
Comparison of results
Fullstack seismic Std desviation without zones Std desviation by zones
Zone1
Zone2
Zone3
Zone4
Zone5
Zone6
Zone7
Zone8
03/May/2016 Instituto Superior Técnico 33
Comparison of results in zone 4, more in detail
Traditional GSI GSI by zones Fullstack
03/May/2016 Instituto Superior Técnico 34
Conclusion
The ability to integrate data from others wells or taking the entire data
values of some property to incorporated in the different zones is an
advantage of the proposed methodolgy, since the values used to populate
the conditioning distribution are assigned to each seismic unit individually.
The methodology is very flexible allowing complex spatial regionalization to
be reproduce and simple enough to use, and allowing high numbers of
scenarios to be tested.
At the end, the retrieve inverse models are more geologically realistic since
incorporated the knowledge of the subsurface geology.
03/May/2016 Instituto Superior Técnico 35
• Thanks to Partex and CERENA/CMRP for supporting my
research work and for providing me the necessary datasets to
test and to implement the new algorithms presented in this
work.
• Thanks Schlumberger for the academic donation of Petrel®
license.
03/May/2016 Instituto Superior Técnico 36
References
• Avseth, Per, Tapan Mukerji, and Gary Mavko. 2005. Quantitative Seismic Interpretation. Cambrige University Press
• Azevedo,L. 2013 Thesis “Geostatistical methods for integrating seismic reflection data into subsurface Earth models”
• Azevedo,L., R.Nunes, A.Soares, C.Mundin.Evaldo, and N.Guenther Schwedersky, Integration of well data into geostatistical
seismic amplitude variation with angle inversion for facies estimation:Geophysic,80,no 6. Doi: 10.1190/GEO2015-0104.1
• Barclay,F., A.Bruun, J.Camara, A. Cooke, D.Cooke, F.Gonzalez…”Inversion sísmica: Lectura entre lineas” Publication