Enhancing Learning in Teaching via e-inquiries Intellectual Output 8 Evaluation and validation report of the ELITe's learning in teaching approach via e- inquiries VERSION: v. 4 Co-funded by the ERASMUS+ Programme of the European Union
Transcript
Enhancing Learning in Teaching via e-inquiries
Intellectual Output 8
Evaluation and validation report of the
ELITe's learning in teaching approach via e-
inquiries
VERSION: v. 4
Co-funded by the
ERASMUS+ Programme
of the European Union
ERASMUS+, KA2- Cooperation for innovation and the exchange of good practices, Strategic Partnerships for school education
ELITe. Enhancing Learning in Teaching via e-inquiries Grand Agreement: 2016-1-EL01-KA201-023647
This project has been co-funded from the Erasmus+ programme of the European Union. The European Commission support for
the production of this publication does not constitute an endorsement of the contents which reflects the views only of the authors,
and the Commission cannot be held responsible for any use which may be made of the information contained therein.
Intellectual Output: O8: Evaluation and validation report of the ELITe's learning in teaching
approach via e-inquiries
Output description: This report will document the process and outcomes of the evaluation of the
projects' earning in teaching approach via e-inquiries. Tasks leading to the
production of O8/Methodology: Development of the evaluation framework
(evaluation strategy and work plan, research questions for each stage of
evaluation, methodology, methods and tools); deployment of evaluation of
impact to participant teachers, partners and other stakeholders (i.e. participants to
multiplier events); drafting evaluation report; drafting an outline with key
The aim of the report and its role within the project ....................................................................................................... 8
Evaluation of the ELITe’s learning in teaching approach .................................................................................................. 8
Data Collection .............................................................................................................................................................. 8
Data Analysis Approach ................................................................................................................................................ 9
Sociodemographic data- Description of the sample ................................................................................................. 9
Evaluating the impact on the activities on teachers’ competence development .................................................... 9
Evaluating the process on the activities on teachers’ competence development ................................................. 10
Testing the project assumption .............................................................................................................................. 11
Evaluating the Course ............................................................................................................................................. 12
Description of the survey participants ........................................................................................................................ 12
Overal evaluation of the ELITe approach in all countries ....................................................................................... 21
Evaluation of the ELITe approach in Greece ........................................................................................................... 23
Evaluation of the ELITe approach in Spain .............................................................................................................. 24
Evaluation of the ELITe approach in Bulgaria ......................................................................................................... 26
Evaluation of the ELITe approach in the Netherlands ............................................................................................ 28
Evaluation of teachers’ competence development ........................................................................................................ 31
Evaluation of the process on the activities on teachers’ competence development ................................................. 38
Results 38
Contributed activities in the course ........................................................................................................................ 39
Planning the method ............................................................................................................................................... 40
Review and analyse data ......................................................................................................................................... 40
Hands on activities .................................................................................................................................................. 40
Communication ....................................................................................................................................................... 41
Perceived practiced skills in the course .................................................................................................................. 41
Information literacy ................................................................................................................................................ 42
Digital skills .............................................................................................................................................................. 44
Other research skills ................................................................................................................................................ 44
Testing the project assumption .................................................................................................................................. 45
Results on the relation of ELITe activities and practiced IBL ...................................................................................... 45
Information literacy ................................................................................................................................................ 48
Communication skills .............................................................................................................................................. 49
Digital skills .............................................................................................................................................................. 49
Metacognitive and reflection skills ......................................................................................................................... 50
Other research skills ................................................................................................................................................ 50
Evaluating the Course ................................................................................................................................................. 52
Relevance of the ELITe course thematics to teachers’ professional development needs ..................................... 52
Relevance of the ELITe course to teachers’ professional development needs through IBL approach .................. 54
Relevance of objectives to participants‘ professional needs – Countries comparison .......................................... 55
Most useful elements of the ELITe course .............................................................................................................. 56
Validation of the ELITe’s learning in teaching approach................................................................................................. 58
1. Results of the validation questionnaire .............................................................................................................. 58
1.1. Feasibility for adoption/adaptation of the ELITe approach - ideas for sustainable application of the ELITe
framework, provided by the participants ............................................................................................................... 63
1.2. Main challenges for adopting the ELITe approach and outcomes in Bulgarian national context .............. 64
1.3. Policy recommendations – added value ..................................................................................................... 65
Useful - Feasible – Pleasant ............................................................................................................................................ 69
Open questions ........................................................................................................................................................... 70
Pleasant (Prettig) ..................................................................................................................................................... 70
APPENDIX I – Sociodemographic data ............................................................................................................................ 90
APPENDIX II – Impact on teachers’ competence development .................................................................................... 106
APPENDIX III – Impact on teachers’ competence development – Coded and Specified .............................................. 117
APPENDIX IV – Process on the activities on teacher’s competence development ....................................................... 140
APPENDIX V – Testin the project assumption ............................................................................................................... 148
APPENDIX VI – Evaluation of the course ....................................................................................................................... 154
Executive Summary The overall goal of the ELITe project is to support teachers’ professional learning for competence development, targeting specifically in-service educators in the STEM domain. Innovation in the frame of the ELITe Strategic Partnership is mainly expressed by the adoption of inquiry methodologies in the context of teachers’ professional learning for competence development. The main aim of science education in the digital age through inquiry based learning is to make all students scientific literate, able to apply science knowledge to improve their own lives, deal with an increasingly complex technological world and make science-related decisions as responsible citizens. Consequently, during the last years, this approach has been proposed as a teachers training approach in acquiring the IBL methodology. However, the potential of the methodology as an approach for teacher professional development has not been exploited; teachers receive training on/for IBL but not via IBL. ELITe’s approach for professional leaning for competence development foresees teachers leaning activities taking place via the inquiry based learning (IBL) methodology, by the use of an on-line platform for facilitating personal and collaborative inquiry learning, developed in the frame of the weSPOT project (under FP7 framework). The ELITe approach has been evaluated in 4 different Euroepan countries and the results of this evaluation are presented here. The evaluation focused on the evidence-based framework for teacher’s competence development via inquiry methodology that was developed and the specific actions and competences that the framework helped developed. The results have shown that the ELITe approach, using the IBL methodology to deliver teachers’ IBL competence development, has yield significant results, considered by the vast majority of the participants as a crusial factor of their IBL competence development. The final part of this document presents the validation results of the multiplier events.
Introduction
There is a wide range and wide complexity of competences required for teaching in the 21st century: teachers are asked to teach in increasingly multicultural classrooms, integrate students with special needs, use ICT for teaching effectively, engage in evaluation and accountability processes and involve parents in schools (OECD, 2009). Furthermore, it is expected that they help students develop ways of thinking (creativity, critical thinking, problem-solving, decision-making; ways of working (communication and collaboration); use tools for working (ICT); and skills around citizenship and career (OECD, 2011). Teaching nowadays is more than a task and requires complex combinations of knowledge, skills, understandings, values and attitudes leading to effective practice. Supporting teachers’ professional learning for competence development is, therefore, not just a need but a must! The growing demand for Science, Technology, Engineering and Mathematics (STEM) education and people that possess STEM competence also underlines the need for supporting STEM teachers’ inquiry-based learning (IBL) professional development. Scientific inquiry answers the question of how phenomena are related: why things do happen. It is about cause-consequence relations, which can principally be tested in experiments. It is not about believes but about empirical evidence. Inquiry based learning is learning, which starts from a project idea and follows the rules of scientific inquiry. It leads finally to structure knowledge about a domain and develops skills and competences about how to carry out research which is efficient, scientifically sound and which can be communicated. Inquiry skills and competences are needed to carry out scientific research. Many more competences and skills are necessary to carry out meaningful inquiry. Against this background, the overall goal of the ELITe project is to support teachers’ professional learning for competence development, targeting specifically in-service educators in the STEM domain. The ELITe’s approach for professional learning propagates the adoption of the inquiry-based (IB) methodology in professional learning activities, under the assumption that teachers’ training via IB methodology supports the development of teacher competences. The main tangible outcome of the project will be the development of an evidence-based framework for STEM teachers’ competence development via inquiry methodology aiming to inform curriculum design for STEM secondary teachers’ continuous professional development and learning. Teacher leaning activities -that inform the development of the framework- take place in 4 countries of the ELITe consortium, namely: Greece, the Netherlands, Bulgaria and Spain, through an online platform, which facilitates personal and collaborative inquiry learning. For addressing the overall goal of the project, identified are the following challenges and the according implicit requirements:
1) From a conceptual perspective, wide variety prevails across European countries, in the current
approaches to teachers’ competences (EC, Education and Training, 2013). General guidelines about
the competences required for teaching are usually embedded in the national curricula and autonomy
is then left to university or college providers to develop and apply detailed competence requirements
in teacher education programs accordingly. Therefore, the ELITe approach advocates that efforts to
stimulate teachers’ competence development through professional learning opportunities need to be
place-based, taking into consideration the various interpretations and understandings not only among
the different EU educational systems, but also among different stakeholders in each country.
2) From a methodological perspective, current prevailing approaches in initial and continuous training
programs focus on subject knowledge, pedagogy and “practice“ (classroom-based training) (EC,
Education and Training, 2015). Such approaches, fail to recognize that teachers’ dispositions towards
learning and teaching - and as a consequence their practice - are highly influenced by the way
teachers have received training themselves. Knowledge and skills on/about teaching is developed by
teachers themselves, as they use theory and research to reflect upon their practices in professional
learning communities (Hagger & McIntyre, 2006). In addition, formal and traditional forms of in-service
training such as courses, workshops and conferences currently prevail in most educational systems.
However, many teachers either do not find suitable professional development or cannot attend due
to conflicting work schedules (OECD, 2009). ELITe argues that there is a need for providing flexible
professional development opportunities in which the training methodology has a prevailing role,
embedded on the concept of “change as professional learning perspective”, which sees teachers as
reflective practitioners, responsible for their own learning.
3) From a domain specific perspective, STEM education is currently defined as ‘creative education to
foster the future needs of society (Sutcliffe, 2011). STEM educators – under the Responsible
Research and Innovation (RRI) policy agenda- are expected to equip students as future citizens to
understand socio-scientific issues, applying science knowledge, ethical values and inquiry skills to
form evidence based opinions (EC, 2015). In addition, there are expected to aspire science related
careers to students and support students develop positive attitudes towards science. Therefore, the
thematic of the professional learning activities for STEM in-service teachers need to reflect current
policy orientations under the RRI agenda on the role of STEM education and help teachers to model
key competences required (knowledge, skills and attitudes) in order to help students to acquire them.
Bearing in mind the identified implicit requirements for achieving the project’s goal, the ELITe Strategic partnership seeks to address the following objectives:
1st objective: To deepen understandings on the requirements for STEM teachers’ competence
development at national levels, as conceptualized and expressed by policy makers, policy mediators
and practitioners;
2nd objective: To develop, deploy and evaluate the effectiveness of an innovative methodology - based
on inquiry-based (IB) methodology - for STEM teachers flexible and reflective professional learning΄
3rd objective: To support the uptake of the proposed innovative professional learning methodology by
teacher training curriculum stakeholders, for better alignment of policy envisions relating STEM
education to actual practice.
The aim of the report and its role within the project IO8 aims to document the process and outcomes of the evaluation of the projects' learning in teaching
approach via e-inquiries focusing on impact of the methodology in terms of teachers changing practice.
In the following, it will be described how the in IO2 “Context-based indicators for evaluation STEM teachers’
competence development” already elaborated research questions will be answered by the analysis of the
collected data. Accordingly, the data collection process is briefly described. Since this is a survey that was
carried out in several countries across several modules, these aspects are also outlined. Subsequently, the
different areas of evaluation (in relation to the process, outcome and project assumptions) are in the
foreground. The research questions are presented, the corresponding items in the questionnaires are listed
and the procedure of the analysis is defined.
Evaluation of the ELITe’s learning in teaching approach In each of the four partner countries (Greece, Bulgaria, Netherlands and Spain) 8 modules were
implemented. In each country three modules were carried out dealing with general learning issues, three with
STEM related issues and two with teachers - parents related issues. Accordingly, the focus in the following
is now on the evaluation of the 32 modules in total. To ensure this the research design was based on the
logic of the One-Group Pretest-Posttest Design. Participants filledin the questionnaires before (Pre-Test) and
after (Post-Test) completing the modules. The questionnaires were designed in such a way that a large
number of items could be adapted to the corresponding orientation of the modules.
The pre-test focused on questions about demographical data, data for testing the project assumptions,
insights about the expected learning outcomes of the participants and the evaluation of the course. The post-
test included evaluation of the impact, data on the development of teachers' competences, data on the
development of IBL skills within the framework of the course focused on IBL activities and also the testing of
project assumption and evaluation of the course.
Data Collection
In each of the four partner countries (Greece, Bulgaria, Netherlands and Spain) 8 modules were
implemented. In each country three modules were carried out dealing with general learning issues, three with
STEM related issues and two with teachers - parents related issues.
32 modules were evaluated in total. The questionnaires were designed in such a way that a large number of
items could be adapted to the corresponding orientation of the modules.
The questions in the questionnaires focus on the following areas:
Pre-Test
• Demographical data
• Data for testing course assumptions
• Insights on participants expected learning outcomes
• Evaluating the course
Post-Test
Evaluating the impact
Data on teachers’ development of competences
Testing the project assumption
Data on IBL skills development in the course aligned to the IBL activities
Evaluating the course
The aim of the evaluation approach was to interview 50 people in each partner country, making the target
sample 200 participants. Finally, 287 teachers took part in the survey.
Data Analysis Approach
The questionnaires focused on five different areas in order to analyse the research questions of the ELITe
Approach.
Sociodemographic data- Description of the sample
Socio-dem. Data
Age Pre-Item 1
Sex Pre-Item 2
Years of experience Pre-Item 3
What is my main teaching subject Pre-Item 4
The sample is analysed using descriptive statistical techniques related to age (25; 25-29; 30-39; 40-49; 50+),
gender (male; female, other) number of training experiences (1-2 years; 3-5 years; 6-10 years; 11-15 years;
16+ years) and main teaching subjects (secondary education Physic; Secondary education Biology;
education Technology; Primary education; Other (please comment)).
The main aim was to gain a comprehensive insight into the cohort surveyed by indicating frequencies (in
percent). The focus lies not only on a general description of the sample, but also to define the data in relation
to the individual countries. In this way it is possible to compare the total population in relation to the
participating countries and to obtain an all-encompassing view of the training participants. In the following,
the socodemographic results in relation to the participants will be briefly described.
Participants
A total of 287 people took part in the evaluation. In Greece, 44 persons were recruited for the survey (15.2%),
in Spain 60 persons (20.9%), in Bulgaria 128 persons (44.6%) and in the Netherlands 55 persons (19.2%).
The gender distribution was characterised by a high proportion of females (78.80%).
This distribution is also reflected in the years of training experience. 28.4% of respondents have more than
16 years of experience, while only 7.9% have not yet gained any experience in the teaching field. 15.8 % of
the respondents have 1 - 2 years of experience, 16.9 % have 3 to 5 years and 15.5 % each have 6 to 10
years or 11 - 15 years of professional experience.
The respondents, however, vary considerably between participating countries.
Table:1 Participants per country
Country
Frequency Percent Valid Percent
Cumulative
Percent
Valid Greece 44 15,3 15,3 15,3
Spain 60 20,9 20,9 36,2
Bulgaria 128 44,6 44,6 80,8
Netherlands 55 19,2 19,2 100,0
Total 287 100,0 100,0
Figure 1: participants per country
Age
An examination of the age distribution clearly shows that over half of all respondents are aged between 20
and 49 (30 - 39 years = 20.9% and 40 - 49 years = 33.1%). 18.5 % of the participants were under 25 at the
time of the survey; 12.2 % were between 25 and 29 and 13.9 % were over 50.
Table 2: Age distribution
Age
Frequency Percent Valid Percent
Cumulative
Percent
Valid < 25 53 18,5 18,7 18,7
25 - 29 35 12,2 12,4 31,1
30 - 39 60 20,9 21,2 52,3
40 - 49 95 33,1 33,6 85,9
50+ 40 13,9 14,1 100,0
Total 283 98,6 100,0
Missing no value 4 1,4
Total 287 100,0
A notable finding of the age distribution per country is that the majority of teachers (68,33%) from Spain were
below 25 years of age. This has to do with the fact that many of the Spanosh participants were pre-service
teachers at the time of the survey. In Bulgaria, the majority of teachers (53,17%) were between 40 and 45
years old. Figure 2 shows the age distribution per country.
Figure 2: Age distribution per country
Gender
Regarding the gender distribution of the participants, the majority of them were female, 223 participants (78,80%) while males were only 20,85% (59 participants), and one participant (0,35%) was self identified as other gender. Table 3: Gender distribution
Sex
Frequency Percent Valid Percent
Cumulative
Percent
Valid Male 59 20,6 20,8 20,8
Female 223 77,7 78,8 99,6
Other 1 ,3 ,4 100,0
Total 283 98,6 100,0
Missing no value 4 1,4
Total 287 100,0
Figure 3: Gender distribution
Figure 4: Gender distribution per country
Figure 4 shows the gender distribution per country, illustrating that female participants were the majority in all countries. In Greece, out of the 44 participants, 27 were female and 17 were male (see table 4).
Table 4: Gender distribution - Greece
Sexa
Frequency Percent Valid Percent
Cumulative
Percent
Valid Male 17 38,6 38,6 38,6
Female 27 61,4 61,4 100,0
Total 44 100,0 100,0
a. Country = Greece
In Spain, 46 participants were self identified as female, 13 as male and one as other (see table 5).
Table 5: Gender distribution – Spain
Sexa
Frequency Percent Valid Percent
Cumulative
Percent
Valid Male 13 21,7 21,7 21,7
Female 46 76,7 76,7 98,3
Other 1 1,7 1,7 100,0
Total 60 100,0 100,0
a. Country = Spain
In Bulgaria, 105 participants were female and 21 were male (see table 6).
Table 6: Gender distribution – Bulgaria
Sexa
Frequency Percent Valid Percent
Cumulative
Percent
Valid Male 21 16,4 16,7 16,7
Female 105 82,0 83,3 100,0
Total 126 98,4 100,0
Missing no value 2 1,6
Total 128 100,0
a. Country = Bulgaria
Finally, 45 of the Dutch teachers were females and 8 were males (see table 7). Table 7: Gender distribution – Netherlands
Sexa
Frequency Percent Valid Percent
Cumulative
Percent
Valid Male 8 14,5 15,1 15,1
Female 45 81,8 84,9 100,0
Total 53 96,4 100,0
Missing no value 2 3,6
Total 55 100,0
a. Country = Netherlands
Experience
Another characteristic of the sociodemografix data was, the years of experience that the participants had. The experience that the participants had was fairly equaly distributed. The majority of particiapnts (28,42%) had more than 16 years of experience while no teaching experience reported by the minority of the teachers (7,91%). These teachers were preservice teachers, but ELITE was keen to include them because they are going to be the ones teaching in schools, in the near future and they might be receptive and open to new approaches. The rest of the participants had experience ranging between 1-2 years (15,83%), 3-5 years (16,91%), 6-10 years (15,47%) and 11-16 years (15,47%). Table 8 and figure 5 below show the experience distribution of all participants. Table 8: Training experience in years
Years of training experience
Frequency Percent
Valid
Percent
Cumulative
Percent
Valid no teaching experience
yet 22 7,7 7,9 7,9
1-2 years 44 15,3 15,8 23,7
3-5 years 47 16,4 16,9 40,6
6-10 years 43 15,0 15,5 56,1
11-15 years 43 15,0 15,5 71,6
16+ years 79 27,5 28,4 100,0
Total 278 96,9 100,0
Missing no value 9 3,1
Total 287 100,0
Figure 5: Years of traning experience
The majority of teachers with no teaching experience came from Greece (30,77%), while 9,43% of the Dutch teachers had no experience and similarly 6,66% of the Spanish teachers. The majority of the Bulgarian teachers have more than 16 years of experience together with the 26,42% of the Dutch teachers. The majority of the Spanish teachers (46,67%) had 1-2 years of experience and 3-5 years of experience (40%). Figure 5 provides a detailed description of the participants’ experience in all countries. More details about the experience distribution per country can be found in Annex I at the end of theis document.
Figure 5: Years of traning experience per country
Teaching subject
The participants had a range of teaching subjects and came both from primary and secondary education. Participants in the survey included STEM and non-STEM teachers. The majority of STEM texhers came from secondary education and they were teaching Physics (10,83%), Biology (9,03%), Chemistry (9,75%), Maths (12,64%), Engineering (7,58%) and Technolog (12,64%). Additionally, 9,03% of the teachers were primary education teachers focusing on STEM subjects. Another 9,39% of the teachers were teaching Computer Science and ICT while the rest of them were non-STEM education. Full details can be seen in figure 6 and table 9.
Figure 6: Teaching subjects in all countries
Table 9: Teachers’ teaching subjects
The majority of non-STEM teachers came from the Netherlands (see figure 7), while the rest of the countries had predominatly teachers that work in the field of STEM education. Details of the subject disctribution per country can be seen in the Apendiy I at the end of this document.
Main teaching subject
Frequency Percent Valid Percent
Cumulative
Percent
Valid Secondary education
Physics 30 10,5 10,8 10,8
Secondary education
Biology 25 8,7 9,0 19,9
Secondary education
Chemistry 27 9,4 9,7 29,6
Secondary education Maths 35 12,2 12,6 42,2
Secondary education
Engineering 21 7,3 7,6 49,8
Secondary education
Technology 35 12,2 12,6 62,5
primary education 25 8,7 9,0 71,5
other 4 1,4 1,4 72,9
Primary Education - stem 9 3,1 3,2 76,2
Primary education - not stem 6 2,1 2,2 78,3
Secondary education - not
stem 3 1,0 1,1 79,4
Secondary education - stem 2 ,7 ,7 80,1
Adult education - not stem 1 ,3 ,4 80,5
4er Education - not stem 3 1,0 1,1 81,6
Higher Education -stem 3 1,0 1,1 82,7
Higher Education - not stem 3 1,0 1,1 83,8
Vocational education - stem 3 1,0 1,1 84,8
Vocational education - not
stem 7 2,4 2,5 87,4
Consultant teacher training 1 ,3 ,4 87,7
Student / PrSchool teacher
training 7 2,4 2,5 90,3
primary/student PRSchool
teacher training 1 ,3 ,4 90,6
Computer Science and ICT 26 9,1 9,4 100,0
Total 277 96,5 100,0
Missing no value 10 3,5
Total 287 100,0
Figure 7: Teaching subjects per country
Evaluating the impact on the activities on teacher’s competence development The aim of this evaluation is to reflect the change in the three areas of competences (knowledge &
understanding, skills, depositions and attitudes) as described in the ELITe approach. The question lies on
finding out, if there is an increase, decrease or no impact on the STEM teachers’ knowledge and
understanding, skills, and dispositions and attitudes. It was possible to adapt the items of the questionnaires
with regard to the corresponding relevant course aspects. The focus is on the following three research
questions:
To answer these research questions, participants were asked to assess their knowledge (RQ1a), their
ability (RQ1b) and the importance (RQ1c) in certain areas (adapted to the corresponding national
modules) before and after the ELITe course. A 5 point Likert scale was used to measure the
participants’ responces. The five scales, from 1-5 included: very poor (1) – poor (2) – medium (3) –
good (4) - RQ1a: What are the outcomes of the ELITe’s learning in teaching activities on enhancing
STEM teachers’ knowledge and understanding on teaching and learning?
RQ1b: What are the outcomes of the ELITe’s learning in teaching activities on STEM teachers’
development of skills for learning and teaching?
RQ1c: What are the outcomes of the ELITe’s learning in teaching activities on STEM teachers’
depositions and attitudes on learning and teaching?
very good (5), and were approapriate not at all (1) – to a small extent (2) – to some extent (3) – to a moderate
extent (4) – to a great extent (5).
The assessment of these research questions at the overall level, concerning ELITe training, is difficult due to
the adaptability of the items according to the modules. Not all items of the corresponding samples can be
summarized in this way without further ado. Accordingly, an analysis of the individual competence areas was
first carried out, independent of the adjustments.
The frequency distribution can be used to show how the various areas of competences are assessed before
and after completion of the modules. Three different items (adapted questions) have been used to asses the
knowledge and the skills and two for the dispossitions based on the indicators developed in IO3. The change
can then be measured by a Wilxocon test (e.g. between Post-Test-Item 1a before and Post-Test-Item 1a
after for all adapted questions).
Results
Overal evaluation of the ELITe approach in all countries
RQ1 (1a, 1b, 1c)
The figures showed that, the main effect of ELITe’s learning in teaching activities on enhancing STEM
teachers’ knowledge and understanding on teaching and learning (RQ1) was highly significant (1a, Z=-
12,415, p<0.001) in all different varations, (1b, Z=-12,403, p<0.001) and (1c, Z=-5,614, p<0.001). Meaning
that the development of knowledge and understanding among the teachers was due to ELITe’s approach.
Table 10: Wilxocon test mean and SD values of the RQ1a, RQ1b and RQ1c in all countries
Descriptive Statistics
N Mean Std. Deviation Minimum Maximum
1a My knowledge and understanding ... before the course was 279 3,265 ,8863 1,0 5,0
1a My knowledge and understanding ... after the course was 279 4,201 ,7266 1,0 5,0
1b My knowledge and understanding ... before the course was 235 3,026 ,9997 1,0 5,0
1b My knowledge and understanding ... after the course was 235 4,272 ,7470 2,0 5,0
1c My knowledge and understanding ... before the course was 54 2,241 1,0082 1,0 4,0
1c My knowledge and understanding ... after the course was 54 3,611 ,8990 1,0 5,0
Table 11: Wilxocon test significance on RQ1a, RQ1b and RQ1c in all countries Test Statisticsa
1a My knowledge
and understanding
... after the course
was - 1a My
knowledge and
understanding ...
before the course
was
1b My knowledge
and understanding
... after the course
was - 1b My
knowledge and
understanding ...
before the course
was
1c My knowledge
and understanding
... after the course
was - 1c My
knowledge and
understanding ...
before the course
was
Z -12,415b -12,403b -5,614b
Asymp. Sig. (2-tailed) ,000 ,000 ,000
a. Wilcoxon Signed Ranks Test
b. Based on negative ranks.
RQ2 (2a, 2b, 2c)
The results regarding the RQ2 showed that, the main effect of ELITe’s learning in teaching activities on
enhancing STEM teachers’ skills (RQ2) was highly significant (2a, Z=-12,334, p<0.001) in all 3 different
variations (2b, Z=-12,418, p<0.001) and (2c, Z=-4,336, p<0.001). That means that, following the ELITe’s IBL
approach in teachers’ professional development there was a statisticaly significant increase in their skills
regarding teaching and learning using IBL.
Table 12: Wilxocon test mean and SD values of the RQ2a, RQ2b and RQ2c in all countries
Descriptive Statistics
N Mean Std. Deviation Minimum Maximum
2a My ability to ... before the
course was 279 2,491 1,1119 1,0 5,0
2a My ability to ... after the
course was 279 3,591 1,0203 1,0 5,0
2b My ability to ... before the
course was 245 2,718 1,0742 1,0 5,0
2b My ability to ... after the
course was 245 4,057 ,7820 1,0 5,0
2c My ability to ... before the
course was 41 2,122 1,0294 1,0 4,0
2c My ability to ... after the
course was 41 3,366 ,9939 1,0 5,0
Table 13: Wilxocon test significance on RQ2a, RQ2b and RQ2c in all countries Test Statisticsa
2a My ability to ...
after the course was
- 2a My ability to ...
before the course
was
2b My ability to ...
after the course was
- 2b My ability to
... before the course
was
2c My ability to ...
after the course was
- 2c My ability to ...
before the course
was
Z -12,334b -12,418b -4,336b
Asymp. Sig. (2-tailed) ,000 ,000 ,000
a. Wilcoxon Signed Ranks Test
b. Based on negative ranks.
RQ3 (3a, 3b)
The results concerning the RQ3 showed that, the main effect of ELITe’s learning in teaching activities on
enhancing STEM teachers’ depositions and attitudes (RQ3) was highly significant (3a, Z=-11,875, p<0.001)
in all 2 different variations (3b, Z=-10,636, p<0.001). That means that, following the ELITe’s IBL approach in
teachers’ professional development there was a statisticaly significant increase in their depositions and
attitudes regarding teaching and learning using IBL.
Table 14: Wilxocon test mean and SD values of the RQ3a and RQ3b in all countries
Descriptive Statistics
N Mean Std. Deviation Minimum Maximum
3a How important for me is ...
before the course 278 3,371 1,1350 1,0 5,0
3a How important for me is ...
after the course 278 4,306 ,7432 1,0 5,0
3b How important for me is ...
before the course 238 3,294 1,0819 1,0 5,0
3b How important for me is ...
after the course 238 4,273 ,7498 1,0 5,0
Table 15: Wilxocon test significance on RQ3b and RQ3c in all countries Test Statisticsa
3a How important for me is ... after the
course - 3a How important for me is ...
before the course
3b How important for me is ... after the
course - 3b How important for me is ...
before the course
Z -11,875b -10,636b
Asymp. Sig. (2-tailed) ,000 ,000
a. Wilcoxon Signed Ranks Test
b. Based on negative ranks.
Evaluation of the ELITe approach in Greece
The pre and post questionnaire of the Greek teachers evaluated all the research questions (RQ1, RQ2, RQ3)
using the different questions (1a, 2a, 2b, 3a).
RQ1 (1a)
For the evaluation of knowledge and understanding the Greek teachers only used one variation of the
questions (1a). The results shown that, the main effect of ELITe’s learning in teaching activities on enhancing
STEM teachers’ knowledge and understanding on teaching and learning was highly significant (1a, Z=-5,454,
p<0.001). That means that, following the ELITe’s IBL approach in teachers’ professional development there
was a statisticaly significant increase in the Greek teachers’ knowledge and understanding on teaching and
learning using IBL.
Table 16: Wilxocon test mean and SD values of the RQ1a in Greece
Descriptive Statisticsa
N Mean Std. Deviation Minimum Maximum
1a My knowledge and understanding ... before the course was 44 3,273 ,7270 2,0 5,0
1b My knowledge and understanding ... before the course was 0 . . . .
1c My knowledge and understanding ... before the course was 0 . . . .
1a My knowledge and understanding ... after the course was 44 4,364 ,6135 3,0 5,0
1b My knowledge and understanding ... after the course was 0 . . . .
1c My knowledge and understanding ... after the course was 0 . . . .
a. Country = Greece
Table 17: Wilxocon test significance on RQ1a in Greece Test Statisticsa,b
1a My knowledge and
understanding ... after the course
was - 1a My knowledge and
understanding ... before the course
was
Z -5,454c
Asymp. Sig. (2-tailed) ,000
a. Country = Greece
b. Wilcoxon Signed Ranks Test
c. Based on negative ranks.
RQ2
Regarding the evaluation of the skills (RQ2) the Greek teachers used two different variations of the
questionnaires (2a, 2c). The results shown that, the main effect of ELITe’s learning in teaching activities on
enhancing STEM teachers’ skills on teaching and learning was highly significant with both variations of the
questions (2a, Z=-4,491, p<0.001) and (2b, Z=-4,233, p<0.001). That means, that following the ELITe’s IBL
approach in teachers’ professional development there was a statisticaly significant increase in the Greek
teachers’ skills on teaching and learning using IBL.
Table 18: Wilxocon test mean and SD values of the RQ2a and RQ2b in Greece
Descriptive Statisticsa
N Mean Std. Deviation Minimum Maximum
2a My ability to ... before the
course was 44 3,227 ,9115 2,0 5,0
2a My ability to ... after the
course was 44 3,727 ,8453 2,0 5,0
2b My ability to ... before the
course was 23 2,957 ,7674 2,0 4,0
2b My ability to ... after the
course was 23 4,000 ,6030 3,0 5,0
a. Country = Greece
Table 19: Wilxocon test significance on RQ1a and RQ2b in Greece Test Statisticsa,b
2a My ability to ...
after the course was
- 2a My ability to ...
before the course
was
2b My ability to ...
after the course was
- 2b My ability to
... before the course
was
Z -4,491c -4,233c
Asymp. Sig. (2-tailed) ,000 ,000
a. Country = Greece
b. Wilcoxon Signed Ranks Test
c. Based on negative ranks.
RQ3
For the evaluation of the depositions and attitudes the Greek teachers used two variations of the questions
(3a, 3b) however for the 3b there were only 5 teachers and therefore we cannot obtain conclusive results.
The results shown that, the main effect of ELITe’s learning in teaching activities on enhancing STEM
teachers’ depositions and attitudes on teaching and learning was highly significant (2a, Z=-2,556, p<0.001).
That means, that following the ELITe’s IBL approach in teachers’ professional development there was a
statisticaly significant increase in the Greek teachers’ depositions and attitudes on teaching and learning
using IBL.
Table 20: Wilxocon test mean and SD values of the RQ3a and RQ3b in Greece
Descriptive Statisticsa
N Mean Std. Deviation Minimum Maximum
3a How important for me is ... before the course 44 4,318 ,8004 2,0 5,0
3a How important for me is ... after the course 44 4,591 ,6928 2,0 5,0
3b How important for me is ... before the course 5 4,800 ,4472 4,0 5,0
3b How important for me is ... after the course 5 4,800 ,4472 4,0 5,0
a. Country = Greece
Table 21: Wilxocon test significance on RQ3a and RQ3b in Greece Test Statisticsa,b
3a How important
for me is ... after
the course - 3a
How important for
me is ... before the
course
3b How important
for me is ... after
the course - 3b
How important for
me is ... before the
course
Z -2,556c ,000d
Asymp. Sig. (2-tailed) ,011 1,000
a. Country = Greece
b. Wilcoxon Signed Ranks Test
c. Based on negative ranks.
d. The sum of negative ranks equals the sum of positive ranks.
Evaluation of the ELITe approach in Spain
The pre and post questionnaire of the Spanish teachers evaluated all the research questions (RQ1, RQ2,
RQ3) using the different questions (1a, 1b, 2a, 2b, 3a, 3b).
RQ1 (1a, 1b)
For the evaluation of knowledge and understanding the Spanish teachers only used two variations of the
questions (1a, 1b). The results shown that, the main effect of ELITe’s learning in teaching activities on
enhancing STEM teachers’ knowledge and understanding on teaching and learning was no significant for the
1a question (Z=-1,890, p<0.001) and highly significant for the second question 1b (Z=-6,031, p<0.001). That
means that, following the ELITe’s IBL approach in teachers’ professional development there was a statisticaly
significant increase in the Spanish teachers’ knowledge and understanding on teaching and learning using
IBL.
Table 22: Wilxocon test mean and SD values of the RQ1a in Spain
Descriptive Statisticsa
N Mean Std. Deviation Minimum Maximum
1a My knowledge and understanding ... before the course was 52 3,519 ,5420 2,0 4,0
1a My knowledge and understanding ... after the course was 52 3,712 ,5364 3,0 5,0
1b My knowledge and understanding ... before the course was 52 2,346 ,8606 1,0 4,0
1b My knowledge and understanding ... after the course was 52 4,096 ,6645 3,0 5,0
a. Country = Spain
Table 23: Wilxocon test significance on RQ1a in Spain Test Statisticsa,b
1a My knowledge and
understanding ... after the
course was - 1a My
knowledge and
understanding ... before the
course was
1b My knowledge and
understanding ... after the
course was - 1b My
knowledge and
understanding ... before the
course was
Z -1,890c -6,031c
Asymp. Sig. (2-tailed) ,059 ,000
a. Country = Spain
b. Wilcoxon Signed Ranks Test
c. Based on negative ranks.
RQ2
Regarding the evaluation of the skills (RQ2) the Spanish teachers used two different variations of the
questionnaires (2a, 2b). The results shown that, the main effect of ELITe’s learning in teaching activities on
enhancing STEM teachers’ skills on teaching and learning was highly significant with both variations of the
questions (2a, Z=-4,904, p<0.001) and (2b, Z=-4,986, p<0.001). This results shows, that following the ELITe’s
IBL approach in teachers’ professional development there was a statisticaly significant increase in the
Spanish teachers’ skills on teaching and learning.
Table 24: Wilxocon test mean and SD values of the RQ2a and RQ2b in Spain
Descriptive Statisticsa
N Mean Std. Deviation Minimum Maximum
2a My ability to ... before the course was 52 2,654 1,2506 1,0 5,0
2a My ability to ... after the course was 52 3,692 ,6116 2,0 5,0
2b My ability to ... before the course was 52 2,538 1,2597 1,0 5,0
2b My ability to ... after the course was 52 3,654 ,6827 2,0 5,0
a. Country = Spain
Table 25: Wilxocon test significance on RQ1a and RQ2b in Spain
Test Statisticsa,b
2a My ability to ...
after the course was
- 2a My ability to ...
before the course
was
2b My ability to ...
after the course was
- 2b My ability to
... before the course
was
Z -4,904c -4,986c
Asymp. Sig. (2-tailed) ,000 ,000
a. Country = Spain
b. Wilcoxon Signed Ranks Test
c. Based on negative ranks.
RQ3
For the evaluation of the depositions and attitudes the Spanish teachers used two variations of the questions
(3a, 3b).
The results shown that, the main effect of ELITe’s learning in teaching activities on enhancing STEM
teachers’ depositions and attitudes on teaching and learning was highly significant in both variation of the
questions (2a, Z=-2,556, p<0.001) and (2b, Z=-2,038, p<0.001). That means, that following the ELITe’s IBL
approach in teachers’ professional development there was a statisticaly significant increase in the Greek
teachers’ depositions and attitudes on teaching and learning.
Table 26: Wilxocon test mean and SD values of the RQ3a and RQ3b in Spain
Descriptive Statisticsa
N Mean Std. Deviation Minimum Maximum
3a How important for me is ...
before the course 52 2,500 1,3648 1,0 5,0
3a How important for me is ...
after the course 52 4,077 ,8128 3,0 5,0
3b How important for me is ...
before the course 52 2,519 1,1113 1,0 5,0
3b How important for me is ...
after the course 52 3,962 ,7399 2,0 5,0
a. Country = Spain
Table 27: Wilxocon test significance on RQ3a and RQ3b in Spain Test Statisticsa,b
3a How important
for me is ... after
the course - 3a
How important for
me is ... before the
course
3b How important
for me is ... after
the course - 3b
How important for
me is ... before the
course
Z -5,265c -5,038c
Asymp. Sig. (2-tailed) ,000 ,000
a. Country = Spain
b. Wilcoxon Signed Ranks Test
c. Based on negative ranks.
Evaluation of the ELITe approach in Bulgaria
The pre and post questionnaire of the Spanish teachers evaluated all the research questions (RQ1, RQ2,
RQ3) using the different questions (1a, 1b, 2a, 2b, 3a, 3b).
RQ1 (1a, 1b)
For the evaluation of knowledge and understanding the Bulgarian teachers only used two variations of the
questions (1a, 1b). The results shown that, the main effect of ELITe’s learning in teaching activities on
enhancing STEM teachers’ knowledge and understanding on teaching and learning was highly significant for
both questions (1a, Z=-9,410, p<0.001) and (1b, Z=-9,666, p<0.001). That means that, following the ELITe’s
IBL approach in teachers’ professional development there was a statisticaly significant increase in the
Bulgarian teachers’ knowledge and understanding on teaching and learning using IBL.
Table 28: Wilxocon test mean and SD values of the RQ1a and RQ1b in Bulgaria
Descriptive Statisticsa
N Mean Std. Deviation Minimum Maximum
1a My knowledge and understanding ... before the course was 128 3,414 ,8742 1,0 5,0
1a My knowledge and understanding ... after the course was 128 4,484 ,6273 3,0 5,0
1b My knowledge and understanding ... before the course was 128 3,391 ,8625 1,0 5,0
1b My knowledge and understanding ... after the course was 128 4,570 ,5977 3,0 5,0
a. Country = Bulgaria
Table 29: Wilxocon test significance on RQ1a and RQ1b in Bulgaria Test Statisticsa,b
1a My knowledge
and understanding
... after the course
was - 1a My
knowledge and
understanding ...
before the course
was
1b My knowledge
and understanding
... after the course
was - 1b My
knowledge and
understanding ...
before the course
was
Z -9,410c -9,666c
Asymp. Sig. (2-tailed) ,000 ,000
a. Country = Bulgaria
b. Wilcoxon Signed Ranks Test
c. Based on negative ranks.
RQ2 (2a, 2b)
Regarding the evaluation of the skills (RQ2) the Bulgarian teachers used two different variations of the
questionnaires (2a, 2b). The results shown that, the main effect of ELITe’s learning in teaching activities on
enhancing STEM teachers’ skills on teaching and learning was highly significant with both variations of the
questions (2a, Z=-9,303, p<0.001) and (2b, Z=-9,742, p<0.001). This results shows, that following the ELITe’s
IBL approach in teachers’ professional development there was a statisticaly significant increase in the
Spanish teachers’ skills on teaching and learning.
Table 30: Wilxocon test mean and SD values of the RQ2a and RQ2b in Bulgaria
Descriptive Statisticsa
N Mean Std. Deviation Minimum Maximum
2a My ability to ... before the
course was 128 2,141 1,0097 1,0 5,0
2a My ability to ... after the
course was 128 3,477 1,2034 1,0 5,0
2b My ability to ... before the
course was 128 2,891 1,0213 1,0 5,0
2b My ability to ... after the
course was 128 4,383 ,6655 3,0 5,0
a. Country = Bulgaria
Table 31: Wilxocon test significance on RQ1a and RQ2b in Bulgaria
Test Statisticsa,b
2a My ability to ...
after the course was
- 2a My ability to ...
before the course
was
2b My ability to ...
after the course was
- 2b My ability to
... before the course
was
Z -9,303c -9,742c
Asymp. Sig. (2-tailed) ,000 ,000
a. Country = Bulgaria
b. Wilcoxon Signed Ranks Test
c. Based on negative ranks.
RQ3 (3a, 3b)
For the evaluation of the depositions and attitudes the Bulgarian teachers used two variations of the questions
(3a, 3b).
The results shown that, the main effect of ELITe’s learning in teaching activities on enhancing STEM
teachers’ depositions and attitudes on teaching and learning was highly significant in both variation of the
questions (2a, Z=-9,477, p<0.001) and (2b, Z=-8,702, p<0.001). That means, that following the ELITe’s IBL
approach in teachers’ professional development there was a statisticaly significant increase in the Greek
teachers’ depositions and attitudes on teaching and learning.
Table 32: Wilxocon test mean and SD values of the RQ3a and RQ3b in Bulgaria
Descriptive Statisticsa
N Mean Std. Deviation Minimum Maximum
3a How important for me is ...
before the course 128 3,516 ,7528 1,0 5,0
3a How important for me is ...
after the course 128 4,445 ,5860 3,0 5,0
3b How important for me is ...
before the course 128 3,594 ,8365 1,0 5,0
3b How important for me is ...
after the course 128 4,516 ,5610 3,0 5,0
a. Country = Bulgaria
Table 33: Wilxocon test significance on RQ3a and RQ3b in Bulgaria Test Statisticsa,b
3a How important
for me is ... after
the course - 3a
How important for
me is ... before the
course
3b How important
for me is ... after
the course - 3b
How important for
me is ... before the
course
Z -9,477c -8,702c
Asymp. Sig. (2-tailed) ,000 ,000
a. Country = Bulgaria
b. Wilcoxon Signed Ranks Test
c. Based on negative ranks.
Evaluation of the ELITe approach in the Netherlands
The pre and post questionnaire of the Spanish teachers evaluated all the research questions (RQ1, RQ2,
RQ3) using the different questions (1a, 1b, 1c, 2a, 2b, 3a, 3b).
RQ1 (1a, 1b, 1c)
For the evaluation of knowledge and understanding the Duch teachers used three variations of the questions
(1a, 1b, 1c). The results shown that, the main effect of ELITe’s learning in teaching activities on enhancing
STEM teachers’ knowledge and understanding on teaching and learning was highly significant for all three
questions (1a, Z=-5,781, p<0.001), (1b, Z=-5,214, p<0.001) and (1c, Z=-5,614, p<0.001). That means that,
following the ELITe’s IBL approach in teachers’ professional development there was a statisticaly significant
increase in the Duch teachers’ knowledge and understanding on teaching and learning using IBL.
Table 34: Wilxocon test mean and SD values of the RQ1a, RQ1b, and RQ1c in the Netherlands
Descriptive Statisticsa
N Mean Std. Deviation Minimum Maximum
1a My knowledge and understanding ... before the
course was 55 2,673 1,0373 1,0 4,0
1a My knowledge and understanding ... after the
course was 55 3,873 ,8177 1,0 5,0
1b My knowledge and understanding ... before the
course was 55 2,818 1,0380 1,0 5,0
1b My knowledge and understanding ... after the
course was 55 3,745 ,7986 2,0 5,0
1c My knowledge and understanding ... before the
course was 54 2,241 1,0082 1,0 4,0
1c My knowledge and understanding ... after the
course was 54 3,611 ,8990 1,0 5,0
a. Country = Netherlands
Table 35: Wilxocon test significance on RQ1a, RQ1b, and RQ1c in the Nethelands Test Statisticsa,b
1a My knowledge
and understanding
... after the course
was - 1a My
knowledge and
understanding ...
before the course
was
1b My knowledge
and understanding
... after the course
was - 1b My
knowledge and
understanding ...
before the course
was
1c My knowledge
and understanding
... after the course
was - 1c My
knowledge and
understanding ...
before the course
was
Z -5,781c -5,214c -5,614c
Asymp. Sig. (2-tailed) ,000 ,000 ,000
a. Country = Netherlands
b. Wilcoxon Signed Ranks Test
c. Based on negative ranks.
RQ2 (2a, 2b, 2c)
Regarding the evaluation of the skills (RQ2) the Duch teachers used the three different variations of the
questionnaires (2a, 2b, 2c). The results shown that, the main effect of ELITe’s learning in teaching activities
on enhancing STEM teachers’ skills on teaching and learning was highly significant in all variations of the
questions (2a, Z=-5,353, p<0.001), (2b, Z=-4,722, p<0.001) and (2c, Z=-4,336, p<0.001. This results shows,
that following the ELITe’s IBL approach in teachers’ professional development there was a high statisticaly
significant increase in the Spanish teachers’ skills on teaching and learning.
Table 36: Wilxocon test mean and SD values of the RQ2a and RQ2b in the Nethelands
Descriptive Statisticsa
N Mean Std. Deviation Minimum Maximum
2a My ability to ... before the course was 55 2,564 1,0321 1,0 4,0
2a My ability to ... after the course was 55 3,655 ,9854 1,0 5,0
2b My ability to ... before the course was 42 2,286 ,9948 1,0 4,0
2b My ability to ... after the course was 42 3,595 ,8571 1,0 5,0
2c My ability to ... before the course was 41 2,122 1,0294 1,0 4,0
2c My ability to ... after the course was 41 3,366 ,9939 1,0 5,0
a. Country = Netherlands
Table 37: Wilxocon test significance on RQ1a and RQ2b in the Nethelands Test Statisticsa,b
2a My ability to ...
after the course was
- 2a My ability to ...
before the course
was
2b My ability to ...
after the course was
- 2b My ability to
... before the course
was
2c My ability to ...
after the course was
- 2c My ability to ...
before the course
was
Z -5,353c -4,722c -4,336c
Asymp. Sig. (2-tailed) ,000 ,000 ,000
a. Country = Netherlands
b. Wilcoxon Signed Ranks Test
c. Based on negative ranks.
RQ3 (3a, 3b, 3c)
For the evaluation of the depositions and attitudes the Duch teachers used two variations of the questions
(3a, 3b).
The results shown that, the main effect of ELITe’s learning in teaching activities on enhancing STEM
teachers’ depositions and attitudes on teaching and learning was highly significant in both variation of the
questions (3a, Z=-5,144, p<0.001) and (3b, Z=-4,144, p<0.001). That means, that following the ELITe’s IBL
approach in teachers’ professional development there was a statisticaly significant increase in the Duch
teachers’ depositions and attitudes on teaching and learning.
Table 38: Wilxocon test mean and SD values of the RQ3a and RQ3b in the Nethelands
Descriptive Statisticsa
N Mean Std. Deviation Minimum Maximum
3a How important for me is ... before the course 54 3,093 1,2017 1,0 5,0
3a How important for me is ... after the course 54 3,963 ,8679 1,0 5,0
3b How important for me is ... before the course 53 3,189 1,1612 1,0 5,0
3b How important for me is ... after the course 53 3,943 ,9285 1,0 5,0
a. Country = Netherlands
Table 39: Wilxocon test significance on RQ3a and RQ3b in the Nethelands Test Statisticsa,b
3a How important for me is ... after the course - 3a
How important for me is ... before the course
3b How important for me is ... after the course -
3b How important for me is ... before the course
Z -5,144c -4,479c
Asymp. Sig. (2-tailed) ,000 ,000
a. Country = Netherlands
b. Wilcoxon Signed Ranks Test
c. Based on negative ranks.
The full details of the data analysis can be found in Appendix II.
Evaluation of teachers’ competence development
In order to obtain results not only on a very general level regarding the influence of the ELITe approach on
the development of IBL competences, the corresponding items were further processed. Since the item
adjustments were very extensive, it was difficult to evaluate the results comparably. For this reason, the
corresponding items were assigned to the various roles that the learner can assume in the ELITe Approach.
In this way the ELITe consortium was able to evaluate the impact on the activities that techers undetook
inorder to develop their competences. For this purpose, the various activities that the teachers had to
undertake during the implementation of the ELITe approach, the different roles and corresponding
competences were first coded:
STEM teachers as lifelong learners are required by national policies to develop, practice, demonstrate:
Knowledge & Understanding
Learning skills
Dispositions & Attitudes
STE
M k
no
wle
dge
Ped
ago
gica
l C
on
ten
t k
no
wle
dge
Cu
rric
ula
r K
no
wle
dge
Dev
elo
pm
enta
l p
sych
olo
gy
Issu
es o
n
Incl
usi
on
an
d
div
ersi
ty
Use
, dev
elo
p,
crea
te r
esea
rch
k
no
wle
dge
Ref
lect
ive,
m
etac
ogn
itiv
e sk
ills
Inte
rper
son
al
skil
ls
Ep
iste
mo
logi
cal
awar
enes
s
Fle
xib
ilit
y,
on
goin
g le
arn
ing
Cri
tica
l att
itu
des
o
n o
wn
lear
nin
g
Code
LK
1
LK
2
LK
3
LK
4
LK
5
LS1
LS2
LS3
LD
1
LD
2
LD
3
STEM teachers as facilitators of students’ learning are required by national policies to develop, practice, demonstrate:
Knowledge & Understanding
Teaching skills
Dispositions & Attitudes
Ped
ago
gica
l k
no
wle
dge
Inn
ov
ativ
e ST
EM
m
eth
od
olo
gies
Ev
alu
atio
n a
nd
as
sess
men
t
New
tec
hn
olo
gies
Pla
n, m
anag
e, c
oo
rdin
ate
teac
hin
g
Use
tea
chin
g m
ater
ials
&
tech
no
logi
es
Man
age
stu
den
ts &
gr
ou
ps
Mo
nit
or,
ad
apt
& a
sses
s te
ach
ing
ob
ject
ives
Co
llec
t, a
nal
yze
, in
terp
ret
evid
ence
Tea
chin
g sk
ills
th
rou
gh c
on
ten
t
Tra
nsf
erab
le s
kil
ls
Pro
mo
te le
arn
ing
of
all
stu
den
ts
Pro
mo
te d
emo
crat
ic
atti
tud
es &
pra
ctic
es
Code
FK
1
FK
2
FK
3
FK
4
FS1
FS2
FS3
FS4
FS5
FD
1
FD
2
FD
3
FD
4
STEM teachers
as members of
educational
communities
are required by
national policies to
develop, practice,
demonstrate:
Knowledge &
Understanding
Professional skills
Dispositions & Attitudes
Ed
uca
tion
al S
cien
ce
foun
dat
ion
s
Co
nte
xtu
al,
inst
ituti
on
al a
nd
org
aniz
atio
nal
asp
ects
of
edu
cati
on
al p
oli
cies
Co
llab
ora
tion
sk
ills
Neg
oti
atio
n s
kil
ls
Ab
ilit
y t
o a
dap
t to
edu
cati
on
al c
on
tex
ts
Lif
e an
d c
aree
r
skil
ls
Dis
po
siti
on
s to
team
-wo
rkin
g,
coll
abo
rati
on a
nd
net
wo
rkin
g
Sen
se o
f se
lf-
effi
cacy
Code
MK
1
MK
2
MS
1
MS
2
MS
3
MS
4
MD
1
MD
2
Next, the multitude of adapted items were assign to these codes (an overview of this assignment can be
found in Appendix III, in the tables Knowledge and Understanding, Learning skills, Teaching skills and
Professional skils, and Disposition and attitudes). Thus it is possible to assess the increase, decrease or no
effect in the different roles and associated competences.
Knowledge and Understanding
CODE My knowledge and understanding before / after
Lifelong learners
Facilitators of students’
learning
Members of educational
communities Competence Country Module
LK5 on issues pertaing to inclusion and diversity GR 1 x
LK3 in terms of curricular knowledge on students skills that should be developed via STEM
GR 2 x
FK1, FK3 ** on methodologies and methods for planning, conducting and assessing an interdisciplinary project
GR 3 x
FK2 on teaching methodologies for dealing with socio-scientific issues in their classrooms
GR 4 x
FK4 on the potential of use of digital means for promoting students' learning
GR 5 x
FK2, FK4 ** on IB learning and teaching and on new technologies as a tool for orchestration students' learning
GR 6 x
MK2 on contextual aspects realting to gender-neutral approaches to STEM
GR 7 x
MK2 on how to contribute to overcoming personal bad experiences of parents for STEM success of their children
GR 8 x
FK2 about IBL methodology ES 1 x
FK4 about the potential of ICT to facilitate the learning process
ES 1 x
FK1 about using IBL learning strategies ES 2 x
FK2 about designing project based on IBL methodology ES 2 x
LK5 about dealing with diversity in STEM subjects ES 3 x
LK4 gender differences, learning styles, personalization. ES 3 x
LK2 about socio-scientific methodology issues ES 4 X
FK1 about the teaching-learning phases for activities based on socio-scientific issues
ES 4 x
FK2* about the key challenges and difficulties to implement STEM activities in the classroom using IBL methodologies.
ES 5 x
FK2* about designing teaching-learning sequences based on IBL
ES 5 x
FK4* about the emerging ICT tools in STEM to be used on STEM subjects
ES 6 x
FK2, FK4* ** about using computational thinking, robotics and game based learning for designing IBL activities
ES 6 x
LK5 about the different types of gender bias on classroom ES 7 x
MK2 about defining strategies to promote parental engagement on gender bias on STEM
ES 7 x
MK2* about the use of innovative teaching methodology and technology to change parents’ attitude about STEM subjects
ES 8 x
MK2* about strategies to overcome personal bad experiences of parents for STEM success of their children
ES 8 x
FK2 on application of IBL approach in teaching science BG 1 x
FK1 on use of various didactical tools and resources BG 1 x
FK3* on various methods and means of assessment in the context of IBL
BG 2 x
FK3* on assessment of individuals and team as a whole diring team work
BG 2 x
LK5 on limitations and needs of learners with different types of SEN
BG 3 x
LK2 on the role of the open air lessons for develoment of holistic picture of the relationships between STEM disciplines…
BG 4 x
LK1 on the role of interdisciplinary STEM learning… BG 4 x
FK2* on IBL approach and methodologies BG 5 x
FK2* on workflow of IBL design and implementation BG 5 x
LK3 on new concepts in the 8-th grade ICT curricula BG 6 x
FK4 on use of Web 2.0 (cloud) applications for working in shared environment and development common documents in teams
BG 6 x
MK1 on various methods and tools to present STEM to students and parents…
BG 7 x
MK2 of the causes of prejudices regarding the study of STEM sciences …
BG 7 x
MK2* on various methods and means of communication between teachers and parents…
BG 8 x
MK2* on the causes of broken communication between parents and teachers …
BG 8 x
FK2*
basic knowledge of the concept of seamless learning, learning in different contexts, contextualised, situated learning, in and throughout formal and informal learning environments with technology (technology-enhanced seamless learning)
NL 1 x
FK4 on tools and technologies for connecting learners and learning throughout contexts
NL 1 x
FK2* about possible applications of seamless learning in school education and learning
NL 1 x
LK2* knowledge and insights in applying seamless learning principles in education
NL 2 x
LK2* on knowledge and insights in research and new trends of learning in seamless way
NL 2 x
FK2 knowledge on design of seamless learning NL 2 x
LK2 knowledge of the topic of effective learning strategies NL 3 x
FK1 knowledge of state-of-the-art research on the topic of effective learning stategies
NL 3 x
FK2 knowledge on design of seamless learning NL 3 x
FK4* knowledge on the topic of feedback in teaching writing NL 4 x
FK4* knowledge on the topic of formative and summative assessment in teaching writing
NL 4 x
LK2 knowledge of the state-of the art research on writing pedagogies
NL 4 x
FK4* of media design principles NL 5 x
FK3 of evaluation principles and evaluation process steps NL 5 x
FK4* of software for app design (i.e., ARlearn) NL 5 x
Table 40: Wilxocon Signed Ranks Test in all countries
Ranks
N Mean Rank Sum of Ranks
LK-1-after - LK-1-before Negative Ranks 0a ,00 ,00 a. LK-1-after < LK-1-before b. LK-1-after > LK-1-before c. LK-1-after = LK-1-before d. LK-2-after < LK-2-before e. LK-2-after > LK-2-before f. LK-2-after = LK-2-before g. LK-3-after < LK-3-before h. LK-3-after > LK-3-before i. LK-3-after = LK-3-before j. LK-4-after < LK-4-before k. LK-4-after > LK-4-before l. LK-4-after = LK-4-before m. LK-5-after < LK-5-before n. LK-5-after > LK-5-before o. LK-5-after = LK-5-before p. LS-1-after < LS-1-before q. LS-1-after > LS-1-before r. LS-1-after = LS-1-before s. LS-2-after < LS-2-before t. LS-2-after > LS-2-before u. LS-2-after = LS-2-before v. LS-3-after < LS-3-before w. LS-3-after > LS-3-before x. LS-3-after = LS-3-before y. LD-2-after < LD-2-before z. LD-2-after > LD-2-before
Table 41: Wilxocon Signed Ranks Test statistics in all countries
Test Statisticsa
LK-1-after - LK-1-before
LK-2-after - LK-2-before
LK-3-after - LK-3-before
LK-4-after - LK-4-before
LK-5-after - LK-5-before
LS-1-after - LS-1-before
LS-2-after - LS-2-before
LS-3-after - LS-3-before
LD-2-after - LD-2-before
LD-3-after - LD-3-before
Z -2,271b -4,386b -6,278b -1,633b -2,640b -4,863b -3,932b -4,304b -4,755b -5,874b Asymp. Sig. (2-tailed)
,023 ,000 ,000 ,102 ,008 ,000 ,000 ,000 ,000 ,000
a. Wilcoxon Signed Ranks Test b. Based on negative ranks.
The results have shown that the ELITe approach has significantly improved the participants’ competence
development. More precisely, regarding the LK1, knowledge and understanding about using IBL startegies
in STEM the overall results shown significant improvement (Z=-2,271, p<0.05). Regarding the LK2,
knowledge and insights in applying seamless learning principles in education, the overal results were highly
significant (Z=-4,386, p<0.001). Furthermore, regarding the LK3, which represents curricular knowledge, the
participant improvement was highly significant (Z=-6,278, p<0.001). However, for the LK4, which represents
the knwoeldge and understanding on developmental psycology, the results shown not significant difference
(Z=-1,633, p>0.05). Similarly, the results shown not significant difference for LK5, issues on inclusion and
diversity. These two areas were the only ones that the participants did not show any improvement following
the ELITe approach. Nonetheless, for the LS1, use, develop and create research knowledge, the results
shown highly significant improvement (Z=-4,863, p<0.001), and similarly for the LS2, regarding the reflective
metacognitive skills (Z=-3,932, p<0.001). In the same vain, for the LS3, which represents the interpersonal
skills, the results also shown highly significan difference (Z=-4,304, p<0.001). Finally, regarding the
disposition and attitudes, which include flexibility and ongoing learning (LD2), and critical attitudes on own
learning (LD3), the results also shown higly significan improvement with (Z=-4,755, p<0.001) and (Z=-5,875,
p<0.001) respectively.
The full statistical analysis on the impact on the activities on teacher’s competence development with regard
to the different roles and ssociated competences can be found in Appendix III.
Greece
Regarding Greece, the results shown no significant diffence regarding the competences and activities tested. More specifically, regarding the LK3, which represents curricular knowledge, there was no significant difference in the results (Z=-1,732, p>0.05). Similarly, the results shown not significant difference for LK5,
issues on inclusion and diversity (Z=-1,633, p>0.05). Similarly, for the LS1, use, develop and create research knowledge, the results shown highly significant improvement (Z=-1,890, p>0.05), and for LS3, which represents the interpersonal skills, the results also shown highly significan difference (Z=-1,414, p>0.05). Finally, regarding the disposition and attitudes, which included flexibility and ongoing learning (LD2), and critical attitudes on own learning (LD3), the results also shown no significan differences in improvement with (Z=-1,518, p>0.05) and (Z=-1,732, p>0.05) respectively. Table 42: Wilxocon Signed Ranks Test-Greece
Ranksa
N Mean Rank Sum of Ranks
LK-3-after - LK-3-before Negative Ranks 0b ,00 ,00 a. Country = Greece b. LK-3-after < LK-3-before c. LK-3-after > LK-3-before d. LK-3-after = LK-3-before e. LK-5-after < LK-5-before f. LK-5-after > LK-5-before g. LK-5-after = LK-5-before h. LS-1-after < LS-1-before i. LS-1-after > LS-1-before j. LS-1-after = LS-1-before k. LS-3-after < LS-3-before l. LS-3-after > LS-3-before m. LS-3-after = LS-3-before n. LD-2-after < LD-2-before o. LD-2-after > LD-2-before p. LD-2-after = LD-2-before q. LD-3-after < LD-3-before r. LD-3-after > LD-3-before s. LD-3-after = LD-3-before
Table 43: Wilxocon Signed Ranks Test Statistics-Greece
Test Statisticsa,b
LK-3-after - LK-
3-before LK-5-after - LK-
5-before LS-1-after - LS-
1-before LS-3-after - LS-
3-before LD-2-after - LD-
2-before LD-3-after - LD-
3-before
Z -1,633c -1,732c -1,890c -1,414c -1,518c -1,732c Asymp. Sig. (2-tailed) ,102 ,083 ,059 ,157 ,129 ,083
a. Country = Greece b. Wilcoxon Signed Ranks Test c. Based on negative ranks.
Spain
The results conserning Spain shown highly significant difference in one area, LD2 which refers to disposition and attitudes, and focuses flexibility and ongoing learning (Z=-4,053, p<0.001). However, the main effect was statistically significant for two other interactions, LS1, use, develop and create research knowledge, the results shown highly significant improvement (Z=-2,285, p<0.05), and LS2, reflective metacognitive skills (Z=-2,285, p<0.05). However, there was no statistically significant main effect of other variables or interaction between variables (all p values > 0.10). Table 44: Wilxocon Signed Ranks Test-Spain
Ranksa
N Mean Rank
Sum of Ranks
LK-2-after - LK-2-before Negative Ranks 1b 1,50 1,50 a. Country = Spain b. LK-2-after < LK-2-before c. LK-2-after > LK-2-before d. LK-2-after = LK-2-before e. LK-4-after < LK-4-before f. LK-4-after > LK-4-before g. LK-4-after = LK-4-before h. LK-5-after < LK-5-before i. LK-5-after > LK-5-before j. LK-5-after = LK-5-before k. LS-1-after < LS-1-before l. LS-1-after > LS-1-before m. LS-1-after = LS-1-before n. LS-2-after < LS-2-before o. LS-2-after > LS-2-before p. LS-2-after = LS-2-before q. LD-2-after < LD-2-before r. LD-2-after > LD-2-before s. LD-2-after = LD-2-before t. LD-3-after < LD-3-before u. LD-3-after > LD-3-before v. LD-3-after = LD-3-before
Table 45: Wilxocon Signed Ranks Test Statistics-Greece
Test Statisticsa,b
LK-2-after - LK-2-before
LK-4-after - LK-4-before
LK-5-after - LK-5-before
LS-1-after - LS-1-before
LS-2-after - LS-2-before
LD-2-after - LD-2-before
LD-3-after - LD-3-before
Z -,816c -1,633c -1,414c -2,285c -2,285c -4,053c -1,382c Asymp. Sig. (2-tailed)
,414 ,102 ,157 ,022 ,022 ,000 ,167
a. Country = Spain b. Wilcoxon Signed Ranks Test c. Based on negative ranks.
Bulgaria
The results for the Bulgarian teachers have shown that the ELITe approach has significantly improved the
participants’ competence development. More precisely, regarding the LK1, knowledge and understanding
about using IBL startegies in STEM the overall results shown significant improvement (Z=-2,271, p<0.05),
while for the LK2, knowledge and insights in applying seamless learning principles in education, were also
significant (Z=-2,460, p<0.05). Additionally, regarding the LK3, which represents curricular knowledge, the
participant improvement was highly significant (Z=-6,087, p<0.001). However, the results shown not
significant difference for LK5, issues on inclusion and diversity (Z=-1,633, p>0.05). For the LS2, regarding
the reflective metacognitive skills and the LS3, which represents the interpersonal skills, the results also
shown a significan difference (Z=-2,236, p<0.05) for both. Finally, regarding the disposition and attitudes,
which include critical attitudes on own learning (LD3), the results also shown higly significan improvement
with (Z=-5,724, p<0.001).
Table 46: Wilxocon Signed Ranks Test-Bulgaria
Ranksa
N Mean Rank Sum of Ranks
LK-1-after - LK-1-before Negative Ranks 0b ,00 ,00 a. Country = Bulgaria b. LK-1-after < LK-1-before c. LK-1-after > LK-1-before d. LK-1-after = LK-1-before e. LK-2-after < LK-2-before f. LK-2-after > LK-2-before g. LK-2-after = LK-2-before h. LK-3-after < LK-3-before i. LK-3-after > LK-3-before j. LK-3-after = LK-3-before k. LK-5-after < LK-5-before l. LK-5-after > LK-5-before m. LK-5-after = LK-5-before n. LS-2-after < LS-2-before o. LS-2-after > LS-2-before p. LS-2-after = LS-2-before q. LS-3-after < LS-3-before r. LS-3-after > LS-3-before s. LS-3-after = LS-3-before t. LD-3-after < LD-3-before u. LD-3-after > LD-3-before v. LD-3-after = LD-3-before
Table 47: Wilxocon Signed Ranks Test Statistics-Bulgaria
Test Statisticsa,b
LK-1-after - LK-1-before
LK-2-after - LK-2-before
LK-3-after - LK-3-before
LK-5-after - LK-5-before
LS-2-after - LS-2-before
LS-3-after - LS-3-before
LD-3-after - LD-3-before
Z -2,271c -2,460c -6,087c -1,633c -2,236c -2,236c -5,724c Asymp. Sig. (2-tailed)
,023 ,014 ,000 ,102 ,025 ,025 ,000
a. Country = Bulgaria b. Wilcoxon Signed Ranks Test c. Based on negative ranks.
Netherlands
The results for Netherlands have shown that the ELITe approach has either significantly or highly significantly
improved the participants’ competence development. More precisely, regarding LK2, knowledge and insights
in applying seamless learning principles in education, the results were highly significant (Z=-3,618, p<0.001).
Nevertheless, for the LS1, use, develop and create research knowledge, the results shown highly significant
difference (Z=-4,024, p<0.001), and similarly for the LS2, regarding the reflective metacognitive skills (Z=-
2,736, p<0.01). Finally, regarding the disposition and attitudes, which focused on flexibility and ongoing
learning (LD2), the results shown significan improvement with (Z=-2,032, p<0.05).
Table 48: Wilxocon Signed Ranks Test-Netherlands
Ranksa
N Mean Rank Sum of Ranks
LK-2-after - LK-2-before Negative Ranks 1b 22,00 22,00 a. Country = Netherlands b. LK-2-after < LK-2-before Positive Ranks 22c 11,55 254,00
Ties 4d c. LK-2-after > LK-2-before d. LK-2-after = LK-2-before e. LS-1-after < LS-1-before f. LS-1-after > LS-1-before g. LS-1-after = LS-1-before h. LS-2-after < LS-2-before i. LS-2-after > LS-2-before j. LS-2-after = LS-2-before k. LS-3-after < LS-3-before l. LS-3-after > LS-3-before m. LS-3-after = LS-3-before n. LD-2-after < LD-2-before o. LD-2-after > LD-2-before p. LD-2-after = LD-2-before
Total 27 LS-1-after - LS-1-before Negative Ranks 1e 14,50 14,50
Table 49: Wilxocon Signed Ranks Test Statistics-Netherlands
Test Statisticsa,b
LK-2-after - LK-2-
before LS-1-after - LS-1-
before LS-2-after - LS-2-
before LS-3-after - LS-3-
before LD-2-after - LD-2-
before
Z -3,618c -4,024c -2,736c -3,573c -2,032c Asymp. Sig. (2-tailed) ,000 ,000 ,006 ,000 ,042
a. Country = Netherlands b. Wilcoxon Signed Ranks Test c. Based on negative ranks.
Evaluation of the process on the activities on teachers’ competence development The aim here is to reflect the correlation between activities and IBL skills practiced. The question is whether
the activities applied in the modules (e.g. Questioning; Planning the method; Review an analyse data; Hands-
on activity; Communication) affect the IBL skills practiced (e.g. Critical thinking; Information literacy; Analytical
skills; Communication skills; Digital skills; Metacognitive and reflection skills; Other research skills). It was
possible to adapt the elements of the questionnaires to the corresponding activities being relevant to the
course. The focus is on the following seven research questions:
RQ2a: Have critical thinking competences been practiced by learners and if yes by which IBL
activities?
RQ2b: Have information literacy skills been practiced by learners and if yes by which IBL activities?
RQ2c: Have analytical skills been practiced by learners and if yes by which IBL activities?
RQ2d: Have communication skills been practiced by learners and if yes by which IBL activities?
RQ2e: Have digital skills been practiced by learners and if yes by which IBL activities?
RQ2f: Have metacognitive and reflection skills been practiced by learners and if yes by which IBL
activities?
RQ2g: Have other research skills been practiced by learners and if yes by which IBL activities?
The assessment of participants of the extent (not at all – to a small extent – to some extent – to a moderate
extent – to a great extent) to which they think they have developed appropriate IBL skills can be illustrated at
the overall levels by frequency distributions.
Results
The results shown that the the activities that teachers undertook as part of the ELITe course were grately appriaciated. The vast majority of the participants thought that the activities either contributed to a
moderate extend or to a great extend in the development of their competences and that they developed a range of IBL skills.
Contributed activities in the course
Figure 8: Contributed activities in the course – General
Table 50: Contributing activities of the ELITe course to the IBL skills
Descriptive Statistics
Contributed activities in the
course N Mean
Questioning 276 3,786
Planning the method 276 3,438
Review and analyze data 276 3,641
Hands-on activity 276 4,156
Communication 276 3,975
Valid N (listwise) 276
Questionning
Regarding the activity of “questioning” 22,6% of the teachers thought that the activities contributed in the
improvement of their questioning skills to some extent, 47,7% to a moderate extent and 18,8% to a great
extent.
Table 51: Contributing activities of the ELITe course to the IBL skills - Questionning
Contributed activities in the course - planning the method
Frequency Percent Valid Percent
Cumulative
Percent
Valid not at all 11 3,8 4,0 4,0
to a small extent 32 11,1 11,6 15,6
so some extent 96 33,4 34,8 50,4
to a moderate extent 99 34,5 35,9 86,2
to a great extent 38 13,2 13,8 100,0
Total 276 96,2 100,0
Missing no value 11 3,8
Total 287 100,0
Planning the method
Regarding the “planning the method” activities, the results shown that the vast majority of the participants
thought that the activities contributed into the development of their corresponding competences. More
specifically, 33,4% of the teachers thought that the activities contributed in the improvement of their planning
skills to some extent, 34,5% to a moderate extent and 13,2 % to a great extent.
Table 52: Contributing activities of the ELITe course to the IBL skills – Planning the method
Contributed activities in the course - planning the method
Frequency Percent Valid Percent
Cumulative
Percent
Valid not at all 11 3,8 4,0 4,0
to a small extent 32 11,1 11,6 15,6
so some extent 96 33,4 34,8 50,4
to a moderate extent 99 34,5 35,9 86,2
to a great extent 38 13,2 13,8 100,0
Total 276 96,2 100,0
Missing no value 11 3,8
Total 287 100,0
Review and analyse data
Regarding the “review and analyse data” activities, the results shown that the vast majority of the participants
thought that the ELITe activities contributed into the development of their corresponding competences. More
specifically, 25,1% of the teachers thought that the activities contributed in the improvement of their planning
skills to some extent, 38,3% to a moderate extent and 19,9% to a great extent.
Table 53: Contributing activities of the ELITe course to the IBL skills – Review and analyse data
Contributed activities in the course - review and analyze data
Frequency Percent Valid Percent
Cumulative
Percent
Valid not at all 10 3,5 3,6 3,6
to a small extent 27 9,4 9,8 13,4
so some extent 72 25,1 26,1 39,5
to a moderate extent 110 38,3 39,9 79,3
to a great extent 57 19,9 20,7 100,0
Total 276 96,2 100,0
Missing no value 11 3,8
Total 287 100,0
Hands on activities
Regarding the “hands on activities” activities, the results also shown that the overwhelmly the participants
thought that the ELITe activities contributed into the development of their corresponding competences. More
precisely, 11,5% of the teachers thought that the activities contributed in the improvement of their relevant
skills to some extent, while 37,6% to a moderate extent and 41,1% to a great extent. Overaly, more than 78%
of the participants thought that the ELITe hands on activities contributed grately to the development of their
IBL skills relevant to data review and analysis.
Table 54: Contributing activities of the ELITe course to the IBL skills – Review and analyse data
Contributed activities in the course - hands-on activity
Frequency Percent Valid Percent
Cumulative
Percent
Valid not at all 8 2,8 2,9 2,9
to a small extent 9 3,1 3,3 6,2
so some extent 33 11,5 12,0 18,1
to a moderate extent 108 37,6 39,1 57,2
to a great extent 118 41,1 42,8 100,0
Total 276 96,2 100,0
Missing no value 11 3,8
Total 287 100,0
Communication
As far as the “communication” activities conserns, the results shown that the vast majority of the participants
thought that the ELITe activities contributed into the development of their communication competences. More
precisely, 19,2% of the teachers thought that the activities contributed in the improvement of their
communicationt skills to some extent, while 36,6% to a moderate extent and 33,4% to a great extent. Overaly,
70% of the participants thought that the ELITe communication activities contributed grately to the
development of their IBL skills relevant to comminication.
Table 55: Contributing activities of the ELITe course to the IBL skills – Communication
Contributed activities in the course - communication
Frequency Percent Valid Percent
Cumulative
Percent
Valid not at all 8 2,8 2,9 2,9
to a small extent 12 4,2 4,3 7,2
so some extent 55 19,2 19,9 27,2
to a moderate extent 105 36,6 38,0 65,2
to a great extent 96 33,4 34,8 100,0
Total 276 96,2 100,0
Missing no value 11 3,8
Total 287 100,0
Perceived practiced skills in the course
Participants were asked to self evaluate the skills they to perceived they practiced while taking part in the
ELITe course. The skills that the participants had to choose from can be seen in table 56. The majority of the
participants believed that the ELITe course helped them to develop all the skills that the course targeted.
Figure 9: to Perceived practiced skills in the course – General
Table 56: Perceived practiced skills in the course
Descriptive Statistics
Perceived practiced skills in the course N Mean
Critikal thinking
276 3,909
Information literacy
275 4,058
Analytical skills
275 3,927
Communication skills
276 4,069
Digital skills
276 4,098
Metacognitive and reflection skills
276 3,725
Other research skills
273 3,407
Valid N (listwise) 272
Critical thinking
As far as the “critical thinking” skills conserns, the results shown that the vast majority of the participants
thought that the ELITe course contributed into the development of their critical thinking skills. More precisely,
18,8% of the teachers thought that the ELITe course contributed in the improvement of their critical thinking
skills to some extent, while 50,2% to a moderate extent and 22,3% to a great extent. Overaly, 72,5% of the
participants thought that the ELITe course contributed to either moderate or to a great extent to the
development of their critical thinking in relation to IBL.
Table 57: Perceived practiced skills in the course – Critical thinking
Perceived practiced skills in the course - critikal thinking
Frequency Percent Valid Percent
Cumulative
Percent
Valid not at all 7 2,4 2,5 2,5
to a small extent 7 2,4 2,5 5,1
so some extent 54 18,8 19,6 24,6
to a moderate extent 144 50,2 52,2 76,8
to a great extent 64 22,3 23,2 100,0
Total 276 96,2 100,0
Missing no value 11 3,8
Total
287 100,0
Information literacy
As far as the “information literacy” skills conserns, the results shown that the vast majority of the participants
thought that the ELITe course contributed into the development of their information literacy skills. Specifically,
17,1% of the teachers thought that the ELITe course contributed in the improvement of their information
litearcy skills to some extent, while 37,3% to a moderate extent and 35,5% to a great extent. Overaly, 72,8%
of the participants thought that the ELITe course contributed to either moderate or to a great extent to the
development of their information literacy skills in relation to IBL.
Table 58: Perceived practiced skills in the course – Information literacy
Perceived practiced skills in the course - information literacy
Frequency Percent Valid Percent
Cumulative
Percent
Valid not at all 3 1,0 1,1 1,1
to a small extent 14 4,9 5,1 6,2
so some extent 49 17,1 17,8 24,0
to a moderate extent 107 37,3 38,9 62,9
to a great extent 102 35,5 37,1 100,0
Total 275 95,8 100,0
Missing no value 12 4,2
Total 287 100,0
Analytical skills
As far as the “analytical skills” conserns, the results shown that the vast majority of the participants thought
that the ELITe course contributed into the development of those skills. Specifically, 21,3% of the teachers
thought that the ELITe course contributed in the improvement of their information litearcy skills to some
extent, while 42,2% to a moderate extent and 26,8% to a great extent. Overaly, 69% of the participants
thought that the ELITe course contributed to either moderate or to a great extent to the development of their
information literacy skills in relation to IBL.
Table 58: Perceived practiced skills in the course – Analytical skills
Perceived practiced skills in the course - analytical skills
Frequency Percent Valid Percent
Cumulative
Percent
Valid not at all 4 1,4 1,5 1,5
to a small extent 12 4,2 4,4 5,8
so some extent 61 21,3 22,2 28,0
to a moderate extent 121 42,2 44,0 72,0
to a great extent 77 26,8 28,0 100,0
Total 275 95,8 100,0
Missing no value 12 4,2
Total 287 100,0
Comminication skills
As far as the “communication skills” conserns, the results shown that the majority of the participants thought
that the ELITe course contributed into the development of those skills. Specifically, 18,8% of the teachers
thought that the ELITe course contributed in the improvement of their communication skills to some extent,
while 36,2% to a moderate extent and 36,2% to a great extent. Overaly, 72,4% of the participants thought
that the ELITe course contributed to either moderate or to a great extent to the development of their
communication skills.
Table 59: Perceived practiced skills in the course –Communication skills
Perceived practiced skills in the course - communication skills
Frequency Percent Valid Percent
Cumulative
Percent
Valid not at all 3 1,0 1,1 1,1
to a small extent 11 3,8 4,0 5,1
so some extent 54 18,8 19,6 24,6
to a moderate extent 104 36,2 37,7 62,3
to a great extent 104 36,2 37,7 100,0
Total 276 96,2 100,0
Missing no value 11 3,8
Total 287 100,0
Digital skills
Regarding the “digital skills”, the results shown that the large majority of the participants thought that the
ELITe course contributed into the development of those skills. Specifically, 12,5% of the teachers thought
that the ELITe course contributed in the improvement of their digital skills to some extent, while 27,5% to a
moderate extent and 46% to a great extent. Overaly, 73,5% of the participants thought that the ELITe course
contributed to either moderate or to a great extent to the development of their digital skills.
Table 59: Perceived practiced skills in the course –Digital skills
Perceived practiced skills in the course - digital skills
Frequency Percent Valid Percent
Cumulative
Percent
Valid not at all 11 3,8 4,0 4,0
to a small extent 18 6,3 6,5 10,5
so some extent 36 12,5 13,0 23,6
to a moderate extent 79 27,5 28,6 52,2
to a great extent 132 46,0 47,8 100,0
Total 276 96,2 100,0
Missing no value 11 3,8
Total 287 100,0
Metacognitive skills
Regarding the “metacognitive skills”, the results shown that the overwhelming majority of the participants
thought that the ELITe course contributed into the development of their metacognitive skills. Specifically,
30,7% of the teachers thought that the ELITe course contributed in the improvement of their metacognitive
skills to some extent, while 37,3% to a moderate extent and 20,6% to a great extent. Overaly, 57,9% of the
participants thought that the ELITe course contributed to either moderate or to a great extent to the
development of their metacognitive skills.
Table 59: Perceived practiced skills in the course –Metacognitivel skills
Perceived practiced skills in the course - metacognitive and reflection skills
Frequency Percent Valid Percent
Cumulative
Percent
Valid not at all 3 1,0 1,1 1,1
to a small extent 19 6,6 6,9 8,0
so some extent 88 30,7 31,9 39,9
to a moderate extent 107 37,3 38,8 78,6
to a great extent 59 20,6 21,4 100,0
Total 276 96,2 100,0
Missing no value 11 3,8
Total 287 100,0
Other research skills
Regarding the “other research skills”, the results shown that the overwhelming majority of the participants
thought that the ELITe course contributed into the development of other research skills. Specifically, 35,9%
of the participants thought that the ELITe course contributed in the improvement of their other research skills
to some extent, while 29,3% to a moderate extent and 15% to a great extent.
Table 60: Perceived practiced skills in the course –Other research skills
Perceived practiced skills in the course - other research skills
Frequency Percent Valid Percent Cumulative
Percent
Valid not at all 16 5,6 5,9 5,9
to a small extent 27 9,4 9,9 15,8
so some extent 103 35,9 37,7 53,5
to a moderate extent 84 29,3 30,8 84,2
to a great extent 43 15,0 15,8 100,0
Total 273 95,1 100,0
Missing no value 14 4,9
Total 287 100,0
In the Appendix IV more detailed result can be found.
Testing the project assumption
The aim here is to examinet the correlation between competences improvement and IBL skills practiced. The
question is whether the IBL skills practiced (e.g. Critical thinking; Information literacy; Analytical skills;
Communication skills; Digital skills; Metacognitive and reflection skills; Other research skills) affect the
competence improvement (in the areas of knowledge and understanding, skills, and dispositions and
attitudes). The elements of the questionnaires were adapted to the corresponding competences being
relevant to the course and that in return allowed us to examine their correlation. The focus is on the following
Results on the relation of ELITe activities and practiced IBL The results here show the relation between the ELITe course activities and the development of the relevant IBL skills. The correlation analyisis revealed a direct relationship between the ELITe activities and the development of specific IBL skills. More precicely, there was a strong, positive correlation between “questioning” and the development of critical thinking, which was statistically highly significant (Tb =.308, p=.000). Furthermore, there was was a strong, positive correlation between “questioning” and four other activities, planning the method, review and analyse data, hands on activities and communication, which were statistically highly significant (Tb =.252, p=.000), (Tb =.288, p=.000), (Tb =.354, p=.000), and (Tb =.316, p=.000) respectively. These results reveal that there is a strong positive relationship between the activities of questioning, planning, reviewing and analysing data, hands on and communication performed during the ELITe course and the development of critical thinking (Table 61). Regarding the information literacy skills, three ELITe course activities have been shown to have a positive effect towards the development of the information literacy skills. More precisely, the results shown that questionning, hands on activity and communication have a highly statistical significant effect on the development of information literacy skill, with the correlation between questioning and information literacy to be (Tb =.143, p=.006), hands on activity and informationliteracy (Tb =.334, p=.000), and communication and information literacy (Tb =.212, p=.000). Furthermore, the relation between analytical skills and the ELITe course activities also have been reveared to have a strong correlation. The results shown that there is a highly significant effect between questioning and analytical skills (Tb =.168, p=.001), planning the method and analytical skills (Tb =.235, p=.000), reviewing and analysing data and analytical skills (Tb =.318, p=.000), hands on activity and analytical skills (Tb =.221, p=.000), communication and analytical skills (Tb =.212, p=.000). Next, the results shown that there is a highly significant effect between the communication skill and four ELITe course activities. The results shown that there is a highly significant effect between questioning and communication skills (Tb =.184, p=.000), planning the method and communication skills (Tb =.150, p=.004), reviewing and analysing data and communication skills (Tb =.127, p=.015), hands on activity and
communication skills (Tb =.325, p=.000), communication activities and communication skills (Tb =.212, p=.000). Regarding the digital skills, three ELITe course activities have been shown to have a positive effect on their development. More precisely, the results shown that questionning, hands on activity and communication have a highly statistical significant effect on the development of information literacy skill, with the correlation between questioning and information literacy to be (Tb =.143, p=.006), hands on activity and informationliteracy (Tb =.334, p=.000), and communication and information literacy (Tb =.212, p=.000). The last skill that the ELITe course activities seem to effect its development is the metacognitive and reflecion skill. The results shown that there is a highly significant correclation between metacognitive and reflective skills and questioning skills (Tb =.164, p=.002), planning the method and metacognitive and reflective skills (Tb =.225, p=.000), reviewing and analysing data and metacognitive and reflective skills (Tb =.323, p=.000), hands on activity and metacognitive and reflective skills (Tb =.133, p=.012), communication activities and metacognitive and reflective skills (Tb =.321, p=.000). Finally, for the reviewing data and analyse and interpret data ELITe activities, the sample of the participants was to small (n=5) to draw meaningfull conclusions. Table 61: Correlation of activities and practiced skills in the course
**. Correlation is significant at the 0.01 level (2-tailed).
*. Correlation is significant at the 0.05 level (2-tailed). A This item was only queried in the 1st module in Greece, thus a small number of cases. Result is not perfectly interpretable and
comparable with the other items.
Kendals tau b
Contributed
activities in the
course -
questioning
Contributed
activities in the
course -
planning the
method
Contributed
activities in the
course - review
and analyze
data
Contributed
activities in the
course - hand-
on activity
Contributed
activities in the
course -
communication
Contributed
activities in the
course - review
data
Contributed
activities in the
course -
Analyze and
interpret data
Believed practiced skills
in the course - critikal
thinking
Correlation
Coefficient ,308
** ,252
** ,288
** ,354
** ,316
** ,000 ,000
Sig. (2-tailed) ,000 ,000 ,000 ,000 ,000 1,000 1,000
N 276 276 271 271 276 5 5
Believed practiced skills
in the course -
information literacy
Correlation
Coefficient ,143
** ,036 ,081 ,334
** ,212
** -,250 -,408
Sig. (2-tailed) ,006 ,482 ,122 ,000 ,000 ,617 ,414
N 275 275 270 270 275 5 5
Believed practiced skills
in the course - analytical
skills
Correlation
Coefficient ,168
** ,235
** ,318
** ,221
** ,402
** 1,000
** 1,000
**
Sig. (2-tailed) ,001 ,000 ,000 ,000 ,000 . .
N 275 275 271 271 275 4 4
Believed practiced skills
in the course -
communication skills
Correlation
Coefficient ,184
** ,150
** ,127
* ,325
** ,347
** -,408 ,167
Sig. (2-tailed) ,000 ,004 ,015 ,000 ,000 ,414 ,739
N 276 276 271 271 276 5 5
Believed practiced skills
in the course - digital
skills
Correlation
Coefficient ,103
* -,009 -,070 ,356
** ,150
** -,408 -,667
Sig. (2-tailed) ,049 ,855 ,177 ,000 ,004 ,414 ,182
N 276 276 271 271 276 5 5
Believed practiced skills
in the course -
metacognitive and
reflection skills
Correlation
Coefficient ,164
** ,225
** ,322
** ,133
* ,321
** ,408 ,667
Sig. (2-tailed) ,002 ,000 ,000 ,012 ,000 ,414 ,182
N 276 276 271 271 276 5 5
Table 62: Correlation of activities and practiced skills in the course
Contributed activities in the course
questioning
planning
the
method
review
and
analyze
data
hand-on
activity communication
review
data A
Analyze
and
interpret
data A
Per
ceiv
ed p
ract
iced
sk
ills
in
the
cou
rse
critikal thinking ** **
** **
**
information
literacy
** **
**
analytical skills ** **
** **
** **
**
communication
skills
** **
* **
**
digital skills *
** **
metacognitive
and reflection
skills
**
** **
* **
other research
skills
** **
** *
**
**. Correlation is significant at the 0.01 level (2-tailed).
*. Correlation is significant at the 0.05 level (2-tailed). A This item was only queried in the 1st module in Greece, thus a small number of cases. Result is not perfectly interpretable and
comparable with the other items.
However, the correlation analysis between perceived practiced skills and the ELITe contributed activities in
the course only has shown if there a correlation between the different items and not the relation of cause and
effect between the variables. To achieve this a multiple lineare regression analysis was performed. The
dependent variable is regarded as an effect (perceived practices skills in the course) in relation to the
indepentend variable as a cause (contributed activities in the course).
Critical thinking
Regarding the development of the critical thinking skill, the results shown that there is highly statistically
significant effect of the questioning activity and the development of the skill (Beta=.183, p<.005), of the hands
on activity and the skill (Beta=,253, p<.001), and of communication activities and the skill (Beta=.200,
p<.001). There was not statisticaly significant effect between any other activity and critical thinking.
Table 63: Correlation of ELITe course activities and critical thinking skill
Information literacy
The results shown that the development of information literacy skills was statistically significantly effected by
the ELITe course activities. More precisely, there is highly statistically significant effect of the hands on activity
and the development of the information literacy skill (Beta=,370, p<.001). There was not statistically
significant effect between any other activity and critical thinking.
Table 64: Correlation of ELITe course activities and information literacy skill
Analytical skills
The results shown that the development of analytical skills was statistically significantly effected by two of the
ELITe course activities. More precisely, there is highly statistical significant effect of the review and analyse
data activity and the development of analytical skills (Beta=,257, p<.001), and communication activities and
the development of the skill (Beta=,393, p<.001). There was not statistically significant effect between any
other activity and critical thinking.
Table 65: Correlation of ELITe course activities and analytical skills
Communication skills
The results have shown that the communication skills were statistically significantly effected by two ELITe
course activities. The hands on activities have a highly statistical significance on the development of the
communication skills (Beta=,225, p<.002), and similarly the communication activities have a highly
statistically significance on the development of the communication skills (Beta=,267, p<.001). The results
also shown that no other activity effects the development of the communication skills.
Table 66: Correlation of ELITe course activities and communication skills
Digital skills
Regarding the development of digital skills, the results have shown that the was statistically significant effect
between the review and analyse data, hands on activities and the development of the skill. The analysis
shown that the review and analyse data and the hands on activities have a highly statistically significant effect
on the development of the digital skills, (Beta=,289, p<.001), and (Beta=,410, p<.001). The results also shown
that no other ELITe activity had effected the development of the digital skills.
Table 67: Correlation of ELITe course activities and digital skills
Metacognitive and reflection skills
As far as the development of metacognitive and reflection skills concerns, the results have shown that the
was statistically significant effect between the review and analyse data, communication activities and the
development of the skill. The analysis shown that the review and analyse data have a highly statistically
significant effect on the development of the metacognitive and reflection skills (Beta=,293, p<.001), and
similarly, the communication activities have a highly statistical significant effect on the development of the
metacognitive and reflection skills (Beta=,321, p<.001). The results also shown that no other ELITe activity
had effected the development of the metacognitive and reflection skills.
Table 68: Correlation of ELITe course activities and metacognitive and reflection skills
Other research skills
Finally, regarding the development of other research skills, the results have shown that the was statistically
significant effect between planning the method, review and analyse data, and communication activities and
the development of the skill. The analysis shown that the planning the method activity has highly statistically
significant effect. Similarly, the review and analyse data have a highly statistically significant effect on the
development of other research skills (Beta=,271, p<.001), and similarly, the communication activities have a
highly statistically significant effect on the development of the other research skills (Beta=,260, p<.001). The
results also shown that no other ELITe activity had effected the development of other research skills.
Table 69: Correlation of ELITe course activities and other research skills
Table 70: Summary of the Regression Analysis between perceived practiced skills and ELITe contributed
activities in the course
Further information about the correlation analysis and the complete graphical results can be found in
Appendix IV.
Evaluating the Course
Here the evaluation of the ELITe teachers training course is presented. In order to assess the relevance and
value of the individual modules, the participants were asked to assess the different aspects of the courses in
the pre- and post-tests questionnaires. The findings will be used to improve the modules and provide more
effective teacher training courses in the future. The questions below were used to evaluate the courses:
How relevant is for participants the thematic of the module(s)?
How relevant is for participants to learn through IBL?
How relevant are the objectives to participants’ professional needs?
What do the participants aim to gain from the course?
Which were the most useful elements of the course?
To what extent the module (course) succeeded in relation to the participants learning outcomes?
Interest in follow-up modules/activities through the ELITe approach?
By analysing the frequency distributions, the courses from national and overall level can be evaluated. The
focus is on measuring the extent (Not at all – to a small extent – to some extent – to a moderate extent – to
a great extent) to which participants value the relevance of module topics, the importance of learning through
IBL and how the objectives meet their needs; and on assessing the usefulness of different course elements
(Learning through inquiry; Self-regulated learning; Learning with peers; Hands-on learning; Reflection &
metacognition); and the rating of their own learning outcomes (This is a new information/ experience to me
and I need some time to process it – I have connected the new information to my previous learning – I
understand now how this new information fits into the bigger picture – I am ready to share my new learning
with others – I can explain the new information to others and help them to understand it).
Relevance of the ELITe course thematics to teachers’ professional development needs
The results shown that the participants were overwhelmingly positive towards the ELITe approach. The
participants thought that the thematic areas of the ELITe modules were highly relevant to their professional
development needs. More precisely, more than 54% of the participants thought that the ELITe thematic
modules were relevant to their needs to a great extent, while another 21,35% thought that the teacher
participants thought that the ELITe thematic modules were relevant to their needs to a moderate extent. Less
than 1% of the participants thought that the thought that the ELITe thematic modules were not relevant at all.
Figure 10: Evaluation of the ELITe course thematics and their relevance to teachers’ professional development needs
The thematic relevance of the ELITe course was also evedent in the analysis per country (see Figure 11).
The highest percentage of relevance was seen in Bulgaria, were 82,54% thought that the ELITe thematic
areas of the modules contributed to a great extent to their professional learning needs, while in Greece
54,55% thought that the ELITe thematic areas of the modules contributed to a great extent to their
professional learning needs. In the Netherlands, 47.06% of the participants thought that the ELITe thematic
areas of the modules contributed to a great extent to their professional learning needs and 45,1% to a
moderate extent. Only in Spain, 58,33% of the participants considered that the the ELITe thematic areas of
the modules contributed to some extent to their professional learning needs and 38,33% to a small extent.
Further details about the evaluation of the ELITe’s thematic areas per country can be found in the Appendix
VI.
Figure 11: Evaluation of the ELITe course thematics and their relevance to teachers’ professional development needs
Relevance of the ELITe course to teachers’ professional development needs through IBL approach
The participants were also evaluated the relvance of the ELITe’ IBL approach to their professional learning
needs. The vast majority of the participants thought that the IBL approach is relevant to their professional
needs. More precisely, 25,64% of the participants thought that the ELITe’s IBL approach is relevant to a great
extent to their needs, while 17,95% thought that it was revant to a mpoderate extent, and 35,53% thought
that it was relevant to some extent. Only, 9,16% of the participants thought that the ELITe’s IBL approach
was not relevant at all.
Figure 12: Evaluation of the ELITe course relevance to teachers’ professional development needs through IBL
Similar results were obtained when the analysis was performed to identify the differences per country. In the
Netherlands, 34,09% of the participants thought that the ELITe IBL approach was to a great extent relevant
to their learning needs and 45,45% to a moderate extent. In a similar fashion, in Greece 36,64% of the
teachers thought that the ELITe IBL approach was to a great extent relevant to their learning needs and
34,09% to a moderate extent. In Bulgaria, 30,4% of the teachers thought that the ELITe IBL approach was
to a great extent relevant to their learning needs, 11,2% to a moderate extent and 48% to some extent. The
less supportive results towards the ELITe’s IBL approach were reveled in Spain, where none of the
participants thought that that the ELITe IBL approach was to a great exten or to a moderate extent relevant
to their learning needs. More details about the analysis per country can be found in the Appendix VI.
Figure 13: Evaluation of the ELITe course relevance to teachers’ professional development needs through IBL per
country
Relevance of objectives to participants‘ professional needs – Countries comparison
Another area that the evaluation examined was the relevance of the objectives to participants’ professional
needs. In the Netherlands, 36,36% of the participants thought that the ELITe’s objectives were to a great
extent relevant to their professional needs and 56,82% to a moderate extent. In Greece 56,62% of the
teachers thought that the ELITe’s objectives were to a great extent relevant to their professional needs and
40,91% to a moderate extent. In Bulgaria, 76,19% of the teachers thought that the ELITe’s objectives were
to a great extent relevant to their professional needs, 21,43% to a moderate extent and only 2,38% to some
extent. The less supportive results towards the ELITe’s objectives were reveled in Spain, where none of the
participants thought that that the ELITe’s objectives were to a great exten relevant to their professional needs,
5% to a moderate extent, 65% to some extent and 30% to a small extent. None of the participants thought
that the ELITe objectives were not relevant at all. More details about the analysis per country can be found
in the Appendix VI.
Figure 14: Evaluation of the ELITe’s objectives relevance to teachers’ professional development needs
Most useful elements of the ELITe course
The participants also were asked to evaluate the usefulness of ELITe’ course elements. Four elements were under investigation: learning through inquiry, self-regulated learning, learning with peers and reflexion and metacognition. These elements were evident in the 8 differen modules that the ELITe consortium has developed. The results were vastly positive towards the usefulness of all the course elements (see Figure 13). Overaly, the mean for the learning through inquiry element was M = 3,935 (N=276) showing that the participants considered it to be usefull at a moderate and at a great extent. Similarly, for the self-regulated learning element the participants thought again that to be usefull at a moderate and at a great extent (M = 3,924, N=276). Regarding the learning with peers’ element of the ELITe approach, the participants also thought it to be usefull at a moderate and at a great extent (M = 4,065, N=276) and the same for the hands on element (M = 4,211, N=270). Finally, for the reflexion and metacognition element the participants thought that to be usefull at a moderate and at a great extent (M = 3,826, N=276). Overaly, the ELITe’s elemnts of the teachers’ professional development course found to be very usefull by the participants. Table 71: Means of ELITe’s course elements
Descriptive Statistics
N Mean
Usefulness of course
elements - learning through
inquiry 276 3,935
Usefulness of course
elements - self-regulated
learning 276 3,924
Usefulness of course
elements - learning with
peers 276 4,065
Usefulness of course
elements - Hand-on learning 270 4,211
Usefulness of course
elements - reflextion &
metacognition 276 3,826
Valid N (listwise) 270
The Figure 15 describes the differnces among the countries, showing that there were not major differences in the way that the different countries considered the usefulness of the ELITe’s course elements. More details about the participant countries analysis can be found at Appendix VI
Figure 15: Evaluation of the most useful elements of the ELITe’s cpourse
Validation of the ELITe’s learning in teaching approach
The validation questionnaire is filled in by 38 participants in total. They were divided into three groups– policy makers and policy mediators: 10, teachers’ educators: 11, STEM teachers: 17 with a different focus on validated dimensions, although most of them share more than one role – teacher and mezzo level policy maker, teacher and teacher educator, teacher educator and policy maker (Figure 6).
Figure 6. Roles distribution
33 female and 5 male participants filed in the questionnaire. The years of professional experience are distributed as follows (Figure 7):
Teachers
Teachers' Educators
Policy Makers & mediators
8
9 3
4
6
3
5
Figure 7. Professional experience distribution
Contextual Dimension
The relevancy Contextual Dimension is evaluated from all of the participants while the task for validation of the usefulness of the resources and the feasibility for adoption/adaption resources in this dimension is given only to the policy makers group. Some of the teachers’ educators also interested in there and responded to the questions, so in this group the number of answers are more than the volume of the groups of the policy makers and vary. The results are (Table 3):
Table 3. Contextual dimension validation
Contextual dimension validation 1 2 3 4 5
Not answered Mean
The development of STEM teachers'training activities should take into consideration national policy requirements and contexual factors.
0 0 3 16 18 1 4,41
Comparative insights on national requirements for STEM teachers’ competence development
0 0 0 3 9 -3 4,75
Critical factors affecting STEM teachers’ professional learning in my country
0 0 0 3 9 -3 4,75
Recommendations for improving national policies for STEM teachers’ competence development
0 0 0 3 9 -3 4,75
Comparative insights on national requirements for STEM teachers’ competence development
0 0 2 6 7 -6 4,33
Critical factors affecting STEM teachers’ professional learning in my country
0 0 1 3 8 -3 4,58
Recommendations for improving national policies for STEM teachers’ competence development
0 0 1 4 7 -3 4,50
The average rating of each aspect of the Contextual Dimension is shown on the Figure 8:
02468
1012
1-5years
6-10years
11-15years
16-20years
21 andaboveyears
N.A.
Nu
mb
er o
f p
arti
cip
ants
Years of professional experience as a teacher
Professional experience as teacher
02468
1012
1-5years
6-10years
11-15years
16-20years
21 andaboveyears
N.A.
Nu
mb
er o
f p
arti
cip
ants
Years of professional experience as a teachers' educator
Professional experience as a teachers' educator
Figure 8. Contextual dimension mean values
Thematic dimension
The Figure 9 shows that all the thematic areas are relevant to the Bulgarian stakeholders; more over – most of the areas are welcome for more than 2/3 of the participants. ICT enhanced STEM learning and teaching, Innovative STEM methodologies, Opening Up school science and Teaching STEM for skill development are the most relevant for the multiplier event participants.
Figure 9. The most relevant thematic areas
The Table 4 represents high level of relevance and feasibility for adoption and adaptation of the scenarios by the groups of teachers’ educators and teachers. The results are supported also by the participants’ feedback, listed in the next section.
Table 4. Thematic dimension validation
Thematic dimension validation
1 2 3 4 5 Not answered
Mean
Sample digital scenarios for STEM teacher training under an inquiry based learning (IBL) methodology: Usefulness
0 0 0 6 18 14 4,75
Sample digital scenarios for STEM teacher training under an inquiry based learning (IBL) methodology: Feasibility for adoption
0 0 2 8 13 15 4,48
The average rating of each aspect of the Contextual Dimension is shown on the Figure 10:
1,00 2,00 3,00 4,00 5,00
The development of STEM teachers'training activities shouldtake into consideration national policy requirements and…
Comparative insights on national requirements for STEM teachers’ competence development
Critical factors affecting STEM teachers’ professional learning in my country
Recommendations for improving national policies for STEM teachers’ competence development
Comparative insights on national requirements for STEM teachers’ competence development
Critical factors affecting STEM teachers’ professional learning in my country
Recommendations for improving national policies for STEM teachers’ competence development
Contextual dimension - Mean value
0 5 10 15 20 25 30 35
Dealing with inclusion and diversity
Teaching STEM for skill development
Dealing with socio-scientific issues
Innovative STEM methodologies
Enhancing teachers-parents collaboration
Opening up school science
Assessment challenges in STEM
ICT enhanced STEM learning and teaching
Confronting challenges of new curricula
Number of participants
Which of the following thematic areas are most relevant for STEM teachers’ training in my country? Please tick as many as needed(V)
Figure 10. Thematic dimension mean values
Methodological dimension
The results of the validation of the Methodological dimension are listed in the Table 5. The Sample digital scenarios, Guidelines for STEM teachers’ inquiry and reflective practice, and Process indicators for inquiry skills development in professional learning activities, were provided only to the groups of the teachers’ educators and teachers as direct providers of trainings.
Table 5. Methodological dimension validation
Methodological dimension validation
1 2 3 4 5 Not answered
Mean
Promoting professional learning
through inquiry and reflective
approaches is relevant to teacher
training.
0 0 0 11 27 0 4,71
Sample digital scenarios for STEM
teacher training under an inquiry
based learning (IBL) methodology
0 0 0 6 18 4 4,75
Guidelines for STEM teachers’
inquiry and reflective practice 0 0 1 12 25 0 4,63
Process indicators for inquiry skills
development in professional learning
activities
0 0 2 13 23 0 4,55
Sample digital scenarios for STEM
teacher training under an inquiry
based learning (IBL) methodology
0 0 2 8 13 5 4,48
Guidelines for STEM teachers’
inquiry and reflective practice 0 0 3 10 12 3 4,36
Process indicators for inquiry skills
development in professional learning
activities
0 0 2 8 15 3 4,52
The Figure 11 illustrates the high level of evaluation of different aspects of the Methodological dimension:
Sample digital scenarios for STEM teacher training under aninquiry based learning (IBL) methodology: Usefulness
Sample digital scenarios for STEM teacher training under aninquiry based learning (IBL) methodology: Feasibility for
adoption
Thematic dimension validation - Mean values
Figure 11. Methodological dimension mean values
Outcome dimension
For Outcome dimension validation, the Outcome indicators for assessing the impact of STEM professional learning activities on competence development was provided only to the policy makers and teachers’ educators groups, while the other questions were provided to all of the participants. Some of the teachers have shown interest to this particular outcome and also provided an answer (Table 6).
Table 6. Outcome dimension validation
Outcome dimension validation 1 2 3 4 5 Not answered
Mean
STEM professional learning activities should aim at supporting the development of teachers’ competences as lifelong learners, facilitators of learning and members of educational communities.
0 0 0 8 30 0 4,79
Outcome indicators for assessing the
impact of STEM professional learning
activities on competence development 0 0 0 5 22 -6 4,81
Self-evaluation tool for assessing the
impact of STEM professional learning
activities on competence development
0 0 0 13 25 0 4,66
Outcome indicators for assessing the
impact of STEM professional learning
activities on competence development
0 0 1 10 7 3 4,33
Self-evaluation tool for assessing the
impact of STEM professional learning
activities on competence development
0 0 1 14 11 12 4,38
The average results are shown on the Figure 12.
0,00 1,00 2,00 3,00 4,00 5,00
Promoting professional learning through inquiry andreflective approaches is relevant to teacher training.
Sample digital scenarios for STEM teacher training under aninquiry based learning (IBL) methodology
Guidelines for STEM teachers’ inquiry and reflective practice
Process indicators for inquiry skills development inprofessional learning activities
Sample digital scenarios for STEM teacher training under aninquiry based learning (IBL) methodology
Guidelines for STEM teachers’ inquiry and reflective practice
Process indicators for inquiry skills development inprofessional learning activities
Methodological dimension validaton - Mean values
Figure 12. Outcome dimension mean values
Cross-dimensional validation
The cross-dimensional validation is presented by the question How feasible is to adopt/adapt the following elements of the ELITe approach in STEM professional learning activities in your country? which answers are provided on the Table 7
Table 7. Feasibility for adoption of the ELITe approach and outcomes
How feasible is to adopt/adapt the
following elements of the ELITe
approach in STEM professional
learning activities in your country?
1 2 3 4 5 Not answered
Mean
Aiming towards teachers’ competence
development rather than subject-
oriented training
0 1 4 15 18 0 4,32
Using inquiry based learning
methodological approaches rather than
traditional instruction
0 0 0 4 6 0 4,60
The results show (Figure 13) that the stakeholders are ready and value highly innovative learning and teaching methods but, thinking on the focus on the training, some of them are still bounded to the traditional subject-oriented approach.
Figure 13. Adoption / Adaptation of the ELITe approach - mean values
1.1. Feasibility for adoption/adaptation of the ELITe approach - ideas for sustainable application of the ELITe
framework, provided by the participants
● Ideas for direct transfer of scenarios for local teacher training. In this case, scenarios related to
communications with parents:
o National Science and Math Gimnasium (NSMG): I am responsible for conducting an
educational team building at the school. The subject of working with parents is very hot for
us. Providing that I participated in the current event, and I am very impressed with the results
Aiming towards teachers’ competence development rather than subject-oriented training
Using inquiry based learning methodological approachesrather than traditional instruction
Adoption / Adaptation of the ELITe approach - Mean values
of working on scenarios related to teacher-parent communication, I was happy to re-create it
in our school. (Nelly Georgieva, Deputy Director, NSMG)
Note: Neli Georgieva transferred the scenario “Let your father come to
school!”(Implementation of the scenario #8: Overcoming personal bad experiences of
parents for STEM success of their children) to their team-building event. We received
very positive feedback from her, right after the training.
o Math Gymnasium Varna (MG Varna): A targeted training of pedagogical staff is planned to
overcome barriers to the IBL approach in STEM training. The school will apply directly the
described as a good practice scenario (Eleonora Pavlova, Deputy Headmaster, MG Varna)
● Together, we will design and implement a scenario of a science competition during the European
Scientists' Night. The competition will involve teachers and pupils together. As a basis, we plan to
use the Open Air Lessons scenario. (Milena Kirova, Faculty of Chemistry and Pharmacy, Sofia
University, and Diana Petrova, FPMG).
● During the presentations of good practices, it has come to our minds to realise a similar scenario for
inquiry-based training of mathematics teachers by creating a pano that is an application of
geometric figures. (Daniela Dureva, FMI, SWU - Blagoevgrad, Margarita Teoharova, Director of
secondary school for foreign language learning, Blagoevgrad)
● I have an idea to apply the methodology of career guidance for our pupils. We have good contacts
with the local business - Pharmacy, ICT. I am thinking of a joint development, together with
business, of such career orientation scenarios. (Eleonora Pavlova, Deputy Director of MG Varna.)
● Idea for scenario for students according to the model of the proposed "Garden of the Herbs on the
Roof" - landscaping the roof, care of the plants, conformation to the climatic conditions, etc. (107th
Primary School, Sofia)
● Development of training scenarios for organising meetings with established specialists in a given
field for better motivation of learners. NHSMS has the idea to adapt its own best practices to the
ELITe methodology by using its existing experience (with Chemistry class they had meetings with
professionally engaged chemists; several Math classes are visiting leading IT companies).
● The Deputy Rector of the Shumen University offered an opportunity to adapt the "Space Safari"
(implementation of the #1: “Dream” and Reality scenario) example with by providing opportunity
for remote access and time-slots reservation to the telescopes of the Astronomical Laboratory
"Shumen Plateau", led by him.
1.2. Main challenges for adopting the ELITe approach and outcomes in Bulgarian national context
● Regulation at national level of the out-of-lecture halls / fieldwork training to all students prepared for
STEM teachers (and in Bulgaria - from the specialties with the code 1.3. Pedagogy of the training
in <subject domain>...).
● Introducing a metric to measure the different competency groups of STEM teachers. It is also
possible to do this through the students' STEM external assessment
● For the teachers’ training institutions – expanding curricula themes by including:
o Developing basic digital competencies for STEM teachers.
o Developing competencies for participation in IBL research processes.
o Developing competencies for conducting negotiations (between different stakeholder groups,
between different institutions, etc.)
● Support of national initiatives for collaborative research activities between universities / academic
units and schools with academic facilities - laboratories, equipment, appliances. Such trainings
could be used both in teacher trainings and in pupils’ education under the guidance of university
lecturers.
● The Ordinance № 12 (about the teachers’ professional development) needs an update by allowing
the acquisition of Professional Qualification Degrees (PCD) through design, experimental training
and analysis of results of application the IBL approach at schools.
● Mixed/Blended training is recommended as a form of teacher training - short (1-2 days of face-to-
face sessions) followed by a longer distance/e-learning form.
● The application of IBL & Reflective practices in teachers’ trainings has an extremely powerful
effect and should be promoted and supported by regulatory documents.
● Targeted creation of connections / relationships:
o Among various institutions that offer teachers’ trainings (universities, schools, NGOs) and
institutions that can offer an environment for applying the ELITe methodology - museums,
laboratories for young people, observatories, etc.
o Creating bridges / synergies between projects at European level to see how they
complement and enrich each other.
o Visible, publicly communicated links to different ELITe’s implementation options for other
innovative teacher training approaches, as well as sample scenarios, with the aims to be
easily available to MSc and PhD students, and young scientists as a good practice or
material for use in their scientific works.
● Changes, based on the Comparative insights on national requirements for STEM teachers'
competence development, are proposed at the national policies, adding requirements for:
o professional skills - negotiation skills (considered necessary in forming partnerships with
other institutions as well as in working with parents and students)
o positive attitudes – performance effectiveness
● The knowledge, mastering and application of IBL should be included as a requirement (at least for
STEM teachers and for acquiring First and Second Professional Qualification Degrees /PCD/) in
Ordinance № 12 (The Teacher Qualification Regulation).
● An important aspect of the implementation of the IBL approach is to provide appropriate training for
teachers to implement new curricular programmes by clearly showing the places where the IBL
implementation is appropriate and possible.
1.3. Policy recommendations – added value
● To the Regional Councils for Methodology: direct use of the scenarios related to school-parent communication
for trainings of school managers (two of the headmasters have already made such proposals in
their regions - Sofia and Varna).
● In the official STEM teachers’ training programs - to have a regulated number of training hours to
apply such innovative practices, as they require more time for design and implementation, as well as
the provision of the necessary number of credits for out-of-lecture halls study and work for learners
and trainers.
● The dissemination of the project results - it is important that the results, achieved by the project, and
the created materials and scenarios, will reach as many potential users, since the created materials
and practical examples are very useful. It is important to make them available to the public, to have a
place where it is possible to share freely experience in this domain.
Greece Demographic information The validation questionnaire was filled in by 21 participants, 13 female and 8 male. Twelve participants are up to 30 years old, and nine participants from 31-60 years old. Ten participants are STEM teachers, two participants are primary education teachers (one of which in special education), and nine participants have working experience or currently work as teachers’ educators (two of which also reported working experience as a researcher).
0 1 2 3 4 5 6 7 8
up to 25
26-30
31-40
41-50
51-60
Age and sex distibution
female male total
Validation Results a) Relevancy of the ELITe approach
How relevant was considered by the participants that CPD STEM programmes to: take into consideration policy requirements; to embed IBL methods; to focus on competence development?
The vast majority of the participants reported that they agree or totally agree that these three elements of the ELITe approach are of relevance for the development of STEM CPD programmes (see chart above)
Policy requirements Inquiry based Learning Competency development
As shown in the chart above, among the three elements of the ELITe approach, most relevant was found the focus on competence development, while IBL method was also reported as of high relevance. In relation to the thematic, most relevant hematic areas are: dealing with socio-scientific issues, ICT in STEM teaching and learning, teaching STEM for skill development, confronting challenges of new curricula, dealing with inclusion and diversity and teachers’ parents collaboration.
Most useful resources: Guidelines for inquiry and reflective practice; Recommendations for improving educational policies; digital scenarios under IBL methodology
c) Feasibility for adoption/ adaption of ELITe approach and resources
Dimension Elements/Resources Mean value (from 1-5)
Approach Competence oriented 3,7
Embedment of IBL 3,6
Resources Digital scenarios 3,8
Guidelines 3,3
Outcome indicators 3,2
Self-evaluation tool 3,2
d) Challenges
Current training modes in STEM teachers CPD (lecture type, too theoretical); Curricula for pre-service teachers at universities; educational policies; lack of intensives for CPD, lack of inquiry based learning culture.
Netherlands
Useful - Feasible – Pleasant To what extent can this tool be useful for you in the context of your own professionalisation (for you as a learner) on a scale of 1 (not at all useful) to 5 (very useful).
Perspective Option Useful M (SD) FeasibleM (SD) Pleasant M (SD)
0% 20% 40% 60% 80% 100%
Competency oriented
IBL embedment
Feasibility of adoption/adaption of elements of the ELITe approach
Especially the questions regarding new knowledge (first question) and the question about personal contributions I find very useful to interpret personal learning experiences, the desired level is not mentioned. This makes the second question (where am I?) difficult to answer since the desired level is not explicitly mentioned here, it is not possible to say where you stand with regard to the desired level. You can say "the level you would like to achieve yourself, the questions between before and after the course give insight into the way of development. I do wonder if the questions are not very general and specific enough to provide information. In addition, I actually missed some open questions that would bring out qualitative information.
Feasible (Haalbaar)
I have achieved more reflection with this than with a standard evaluation form. The character of non-open questions (not "what did you learn") nor a "scale question" (how much did you learn on a scale of 1 to 5) but the use of descriptions from which you have to choose helps me to think better about where I stand. In my opinion, it must really be embedded in the cycle of professionalization (R & D conversations, etc.) in order to be used. I didn't see any level descriptions but only a comparison with before the course so that the difference becomes clear.
Pleasant (Prettig)
No, I'm really positive! Much better than standard evaluation tool. I am also curious about how others judge this instrument. Layout is also good! I do think it can be a useful and pleasant instrument. It all depends on the type of questions. These should be specific. Because of this, it can happen that you get a long list of questions which makes the instrument less valuable.
I would like to mention that so far I have not been in contact with various questionnaires that would allow a reflection on the gained and desired level of knowledge. But from the personal perspective of a student and teacher I can summarize: I believe that this instrument is very useful, feasible and pleasant. However, I have not been able to determine or compare the relationship between them (i.e. whether it is more feasible or more pleasant etc). I think that the questions are precisely formulated, that they are not with double meaning, and it is very easy to put them in a particular context (course, programme, ...). The use of this tool would be of great value from the teacher's perspective (to be used by his or her students) and to be used in his or her teaching. This is also based on the fact that the main strength of this tool (in my opinion) is that it can be very well used to reflect on a learning experience. The points related to this purpose in the instrument dominate (4, 5, and 6). This can also say a lot about the perception of the pupils during the learning experience, but also about the usefulness of specific elements of the learning environment. See previous remark about specificity, lack of an ideal standard and compare with the initial situation, so that only development becomes visible.
Spain Demographic information The validation questionnaire was filled in by 25 participants, 20 female and 5 male. One participant was up to 30 years old, 13 participants were 31-40 years old, 9 were 41-50, years old, and 2 were 51-60 years old. Twelve participants had no training experience, five had 1-5 years of experience as trainers, six had 6-10 years of experience, and two had 11-15 years of experience as trainners.
0
0,5
1
1,5
2
2,5
3
3,5
4
4,5
5
TO leert: reflectieover eigen kennis
TO leert: reflectieover waar ik sta
TO als docent:reflectie over wat
mijn studentenweten
TO als docent:reflectie over waar
studenten staan
Studentperspective:
Reflectie over deleerervaring
Studentperspective:
reflectie over waarik sta
Evaluation of the Elite instrument
Nuttig Haalbaar Prettig
References EC, (2013) Education and Training Monitoring. ec.europa.eu/education/monitor EC, (2015) Education and Training Monitoring, ec.europa.eu/education/monitor OECD (2009). Annual Report. https://www.oecd.org/newsroom/43125523.pdf OECD (2011). Annual Report. https://www.oecd.org/education/skills-beyond-school/48631582.pdf Sutcliffe, H. (2011) A report on Responsible Research and Innovation for the European Commission. Retrieved from https://ec.europa.eu/research/science-society/document_library/pdf_06/rri-report-hilary-sutcliffe_en.pdf
APPENDIX II – Impact on teachers’ competence development
Comparison Items 1 a b c - General
Descriptive Statistics
N Mean Std. Deviation Minimum Maximum
1a My knowledge and understanding ... before the course was 279 3,265 ,8863 1,0 5,0
1a My knowledge and understanding ... after the course was 279 4,201 ,7266 1,0 5,0
1b My knowledge and understanding ... before the course was 235 3,026 ,9997 1,0 5,0
1b My knowledge and understanding ... after the course was 235 4,272 ,7470 2,0 5,0
1c My knowledge and understanding ... before the course was 54 2,241 1,0082 1,0 4,0
1c My knowledge and understanding ... after the course was 54 3,611 ,8990 1,0 5,0
Ranks
N Mean Rank
Sum of
Ranks
1a My knowledge and understanding ... after
the course was - 1a My knowledge and
understanding ... before the course was
Negative Ranks 10a 78,00 780,00
Positive Ranks 203b 108,43 22011,00
Ties 66c
Total 279
1b My knowledge and understanding ... after
the course was - 1b My knowledge and
understanding ... before the course was
Negative Ranks 3d 62,00 186,00
Positive Ranks 196e 100,58 19714,00
Ties 36f
Total 235
1c My knowledge and understanding ... after
the course was - 1c My knowledge and
understanding ... before the course was
Negative Ranks 1g 43,50 43,50
Positive Ranks 46h 23,58 1084,50
Ties 7i
Total 54
a. 1a My knowledge and understanding ... after the course was < 1a My knowledge and understanding ... before the course was
b. 1a My knowledge and understanding ... after the course was > 1a My knowledge and understanding ... before the course was
c. 1a My knowledge and understanding ... after the course was = 1a My knowledge and understanding ... before the course was
d. 1b My knowledge and understanding ... after the course was < 1b My knowledge and understanding ... before the course was
e. 1b My knowledge and understanding ... after the course was > 1b My knowledge and understanding ... before the course was
f. 1b My knowledge and understanding ... after the course was = 1b My knowledge and understanding ... before the course was
g. 1c My knowledge and understanding ... after the course was < 1c My knowledge and understanding ... before the course was
h. 1c My knowledge and understanding ... after the course was > 1c My knowledge and understanding ... before the course was
i. 1c My knowledge and understanding ... after the course was = 1c My knowledge and understanding ... before the course was
Test Statisticsa
1a My knowledge
and understanding
... after the course
was - 1a My
knowledge and
understanding ...
before the course
was
1b My knowledge
and understanding
... after the course
was - 1b My
knowledge and
understanding ...
before the course
was
1c My knowledge
and understanding
... after the course
was - 1c My
knowledge and
understanding ...
before the course
was
Z -12,415b -12,403b -5,614b
Asymp. Sig. (2-tailed) ,000 ,000 ,000
a. Wilcoxon Signed Ranks Test
b. Based on negative ranks.
Comparison Items 1 a b c - Greece
Descriptive Statisticsa
N Mean Std. Deviation Minimum Maximum
1a My knowledge and understanding ... before the course was 44 3,273 ,7270 2,0 5,0
1b My knowledge and understanding ... before the course was 0 . . . .
1c My knowledge and understanding ... before the course was 0 . . . .
1a My knowledge and understanding ... after the course was 44 4,364 ,6135 3,0 5,0
1b My knowledge and understanding ... after the course was 0 . . . .
1c My knowledge and understanding ... after the course was 0 . . . .
a. Country = Greece
Ranksa
N Mean Rank Sum of Ranks
1a My knowledge and understanding ... after
the course was - 1a My knowledge and
understanding ... before the course was
Negative Ranks 0b ,00 ,00
Positive Ranks 36c 18,50 666,00
Ties 8d
Total 44
a. Country = Greece
b. 1a My knowledge and understanding ... after the course was < 1a My knowledge and understanding ... before the course was
c. 1a My knowledge and understanding ... after the course was > 1a My knowledge and understanding ... before the course was
d. 1a My knowledge and understanding ... after the course was = 1a My knowledge and understanding ... before the course was
Test Statisticsa,b
1a My knowledge and
understanding ... after the course
was - 1a My knowledge and
understanding ... before the course
was
Z -5,454c
Asymp. Sig. (2-tailed) ,000
a. Country = Greece
b. Wilcoxon Signed Ranks Test
c. Based on negative ranks.
Comparison Items 1 a b c - Spain
Descriptive Statisticsa
N Mean Std. Deviation Minimum Maximum
1a My knowledge and understanding ... before the course was 52 3,519 ,5420 2,0 4,0
1a My knowledge and understanding ... after the course was 52 3,712 ,5364 3,0 5,0
1b My knowledge and understanding ... before the course was 52 2,346 ,8606 1,0 4,0
1b My knowledge and understanding ... after the course was 52 4,096 ,6645 3,0 5,0
a. Country = Spain
Ranksa
N Mean Rank Sum of Ranks
1a My knowledge and understanding ... after the
course was - 1a My knowledge and understanding ...
before the course was
Negative Ranks 8b 12,50 100,00
Positive Ranks 17c 13,24 225,00
Ties 27d
Total 52
1b My knowledge and understanding ... after the
course was - 1b My knowledge and understanding
... before the course was
Negative Ranks 2e 11,50 23,00
Positive Ranks 48f 26,08 1252,00
Ties 2g
Total 52
Test Statisticsa,b
1a My knowledge and
understanding ... after the
course was - 1a My
knowledge and
understanding ... before the
course was
1b My knowledge and
understanding ... after the
course was - 1b My
knowledge and
understanding ... before the
course was
Z -1,890c -6,031c
Asymp. Sig. (2-tailed) ,059 ,000
a. Country = Spain
b. Wilcoxon Signed Ranks Test
c. Based on negative ranks.
Comparison Items 1 a b c - Bulgaria
Descriptive Statisticsa
N Mean Std. Deviation Minimum Maximum
1a My knowledge and understanding ... before the course was 128 3,414 ,8742 1,0 5,0
1a My knowledge and understanding ... after the course was 128 4,484 ,6273 3,0 5,0
1b My knowledge and understanding ... before the course was 128 3,391 ,8625 1,0 5,0
1b My knowledge and understanding ... after the course was 128 4,570 ,5977 3,0 5,0
a. Country = Bulgaria
Ranksa
N Mean Rank Sum of Ranks
1a My knowledge and
understanding ... after the
course was - 1a My knowledge
and understanding ... before the
course was
Negative Ranks 1b 41,00 41,00
Positive Ranks 107c 54,63 5845,00
Ties 20d
Total 128
1b My knowledge and
understanding ... after the
course was - 1b My knowledge
and understanding ... before the
course was
Negative Ranks 0e ,00 ,00
Positive Ranks 113f 57,00 6441,00
Ties 15g
Total 128
a. Country = Bulgaria
b. 1a My knowledge and understanding ... after the course was < 1a My knowledge and understanding ... before the course was
c. 1a My knowledge and understanding ... after the course was > 1a My knowledge and understanding ... before the course was
d. 1a My knowledge and understanding ... after the course was = 1a My knowledge and understanding ... before the course was
e. 1b My knowledge and understanding ... after the course was < 1b My knowledge and understanding ... before the course was
f. 1b My knowledge and understanding ... after the course was > 1b My knowledge and understanding ... before the course was
g. 1b My knowledge and understanding ... after the course was = 1b My knowledge and understanding ... before the course was
Test Statisticsa,b
1a My knowledge
and understanding
... after the course
was - 1a My
knowledge and
understanding ...
before the course
was
1b My knowledge
and understanding
... after the course
was - 1b My
knowledge and
understanding ...
before the course
was
Z -9,410c -9,666c
Asymp. Sig. (2-tailed) ,000 ,000
a. Country = Bulgaria
b. Wilcoxon Signed Ranks Test
c. Based on negative ranks.
Comparison Items 1 a b c – Netherlands
Descriptive Statisticsa
N Mean Std. Deviation Minimum Maximum
1a My knowledge and understanding ... before the
course was 55 2,673 1,0373 1,0 4,0
1a My knowledge and understanding ... after the
course was 55 3,873 ,8177 1,0 5,0
1b My knowledge and understanding ... before the
course was 55 2,818 1,0380 1,0 5,0
1b My knowledge and understanding ... after the
course was 55 3,745 ,7986 2,0 5,0
1c My knowledge and understanding ... before the
course was 54 2,241 1,0082 1,0 4,0
1c My knowledge and understanding ... after the
course was 54 3,611 ,8990 1,0 5,0
a. Country = Netherlands
Ranksa
N Mean Rank Sum of Ranks
1a My knowledge and understanding ... after the
course was - 1a My knowledge and
understanding ... before the course was
Negative Ranks 1b 13,50 13,50
Positive Ranks 43c 22,71 976,50
Ties 11d
Total 55
1b My knowledge and understanding ... after
the course was - 1b My knowledge and
understanding ... before the course was
Negative Ranks 1e 11,50 11,50
Positive Ranks 35f 18,70 654,50
Ties 19g
Total 55
1c My knowledge and understanding ... after the
course was - 1c My knowledge and
understanding ... before the course was
Negative Ranks 1h 43,50 43,50
Positive Ranks 46i 23,58 1084,50
Ties 7j
Total 54
a. Country = Netherlands
b. 1a My knowledge and understanding ... after the course was < 1a My knowledge and understanding ... before the course was
c. 1a My knowledge and understanding ... after the course was > 1a My knowledge and understanding ... before the course was
d. 1a My knowledge and understanding ... after the course was = 1a My knowledge and understanding ... before the course was
e. 1b My knowledge and understanding ... after the course was < 1b My knowledge and understanding ... before the course was
f. 1b My knowledge and understanding ... after the course was > 1b My knowledge and understanding ... before the course was
g. 1b My knowledge and understanding ... after the course was = 1b My knowledge and understanding ... before the course was
h. 1c My knowledge and understanding ... after the course was < 1c My knowledge and understanding ... before the course was
i. 1c My knowledge and understanding ... after the course was > 1c My knowledge and understanding ... before the course was
j. 1c My knowledge and understanding ... after the course was = 1c My knowledge and understanding ... before the course was
Test Statisticsa,b
1a My knowledge
and understanding
... after the course
was - 1a My
knowledge and
understanding ...
before the course
was
1b My knowledge
and understanding
... after the course
was - 1b My
knowledge and
understanding ...
before the course
was
1c My knowledge
and understanding
... after the course
was - 1c My
knowledge and
understanding ...
before the course
was
Z -5,781c -5,214c -5,614c
Asymp. Sig. (2-tailed) ,000 ,000 ,000
a. Country = Netherlands
b. Wilcoxon Signed Ranks Test
c. Based on negative ranks.
Comparison Items 2 a b c – General
Descriptive Statistics
N Mean Std. Deviation Minimum Maximum
2a My ability to ... before the
course was 279 2,491 1,1119 1,0 5,0
2a My ability to ... after the
course was 279 3,591 1,0203 1,0 5,0
2b My ability to ... before the
course was 245 2,718 1,0742 1,0 5,0
2b My ability to ... after the
course was 245 4,057 ,7820 1,0 5,0
2c My ability to ... before the
course was 41 2,122 1,0294 1,0 4,0
2c My ability to ... after the
course was 41 3,366 ,9939 1,0 5,0
Ranks
N Mean Rank Sum of Ranks
2a My ability to ... after the
course was - 2a My ability to ...
before the course was
Negative Ranks 7a 53,00 371,00
Positive Ranks 199b 105,28 20950,00
Ties 73c
Total 279
2b My ability to ... after the
course was - 2b My ability to
... before the course was
Negative Ranks 7d 67,50 472,50
Positive Ranks 206e 108,34 22318,50
Ties 32f
Total 245
2c My ability to ... after the
course was - 2c My ability to ...
before the course was
Negative Ranks 2g 17,75 35,50
Positive Ranks 30h 16,42 492,50
Ties 9i
Total 41
a. 2a My ability to ... after the course was < 2a My ability to ... before the course was
b. 2a My ability to ... after the course was > 2a My ability to ... before the course was
c. 2a My ability to ... after the course was = 2a My ability to ... before the course was
d. 2b My ability to ... after the course was < 2b My ability to ... before the course was
e. 2b My ability to ... after the course was > 2b My ability to ... before the course was
f. 2b My ability to ... after the course was = 2b My ability to ... before the course was
g. 2c My ability to ... after the course was < 2c My ability to ... before the course was
h. 2c My ability to ... after the course was > 2c My ability to ... before the course was
i. 2c My ability to ... after the course was = 2c My ability to ... before the course was
Test Statisticsa
2a My ability to ...
after the course was
- 2a My ability to ...
before the course
was
2b My ability to ...
after the course was
- 2b My ability to
... before the course
was
2c My ability to ...
after the course was
- 2c My ability to ...
before the course
was
Z -12,334b -12,418b -4,336b
Asymp. Sig. (2-tailed) ,000 ,000 ,000
a. Wilcoxon Signed Ranks Test
b. Based on negative ranks.
Comparison Items 2 a b c – Greece
Descriptive Statisticsa
N Mean Std. Deviation Minimum Maximum
2a My ability to ... before the
course was 44 3,227 ,9115 2,0 5,0
2a My ability to ... after the
course was 44 3,727 ,8453 2,0 5,0
2b My ability to ... before the
course was 23 2,957 ,7674 2,0 4,0
2b My ability to ... after the
course was 23 4,000 ,6030 3,0 5,0
a. Country = Greece
Ranksa
N Mean Rank Sum of Ranks
2a My ability to ... after the
course was - 2a My ability to ...
before the course was
Negative Ranks 0b ,00 ,00
Positive Ranks 21c 11,00 231,00
Ties 23d
Total 44
2b My ability to ... after the
course was - 2b My ability to ...
before the course was
Negative Ranks 0e ,00 ,00
Positive Ranks 20f 10,50 210,00
Ties 3g
Total 23
a. Country = Greece
b. 2a My ability to ... after the course was < 2a My ability to ... before the course was
c. 2a My ability to ... after the course was > 2a My ability to ... before the course was
d. 2a My ability to ... after the course was = 2a My ability to ... before the course was
e. 2b My ability to ... after the course was < 2b My ability to ... before the course was
f. 2b My ability to ... after the course was > 2b My ability to ... before the course was
g. 2b My ability to ... after the course was = 2b My ability to ... before the course was
Test Statisticsa,b
2a My ability to ...
after the course was
- 2a My ability to ...
before the course
was
2b My ability to ...
after the course was
- 2b My ability to
... before the course
was
Z -4,491c -4,233c
Asymp. Sig. (2-tailed) ,000 ,000
a. Country = Greece
b. Wilcoxon Signed Ranks Test
c. Based on negative ranks.
Comparison Items 2 a b c – Spain
Descriptive Statisticsa
N Mean Std. Deviation Minimum Maximum
2a My ability to ... before the course was 52 2,654 1,2506 1,0 5,0
2a My ability to ... after the course was 52 3,692 ,6116 2,0 5,0
2b My ability to ... before the course was 52 2,538 1,2597 1,0 5,0
2b My ability to ... after the course was 52 3,654 ,6827 2,0 5,0
a. Country = Spain
Ranksa
N Mean Rank Sum of Ranks
2a My ability to ... after the
course was - 2a My ability to
... before the course was
Negative Ranks 6b 7,00 42,00
Positive Ranks 32c 21,84 699,00
Ties 14d
Total 52
2b My ability to ... after the
course was - 2b My ability to
... before the course was
Negative Ranks 6e 8,00 48,00
Positive Ranks 34f 22,71 772,00
Ties 12g
Total 52
a. Country = Spain
b. 2a My ability to ... after the course was < 2a My ability to ... before the course was
c. 2a My ability to ... after the course was > 2a My ability to ... before the course was
d. 2a My ability to ... after the course was = 2a My ability to ... before the course was
e. 2b My ability to ... after the course was < 2b My ability to ... before the course was
f. 2b My ability to ... after the course was > 2b My ability to ... before the course was
g. 2b My ability to ... after the course was = 2b My ability to ... before the course was
Test Statisticsa,b
2a My ability to ...
after the course was
- 2a My ability to ...
before the course
was
2b My ability to ...
after the course was
- 2b My ability to
... before the course
was
Z -4,904c -4,986c
Asymp. Sig. (2-tailed) ,000 ,000
a. Country = Spain
b. Wilcoxon Signed Ranks Test
c. Based on negative ranks.
Comparison Items 2 a b c – Bulgaria
Descriptive Statisticsa
N Mean Std. Deviation Minimum Maximum
2a My ability to ... before the
course was 128 2,141 1,0097 1,0 5,0
2a My ability to ... after the
course was 128 3,477 1,2034 1,0 5,0
2b My ability to ... before the
course was 128 2,891 1,0213 1,0 5,0
2b My ability to ... after the
course was 128 4,383 ,6655 3,0 5,0
a. Country = Bulgaria
Ranksa
N Mean Rank Sum of Ranks
2a My ability to ... after the
course was - 2a My ability to
... before the course was
Negative Ranks 0b ,00 ,00
Positive Ranks 109c 55,00 5995,00
Ties 19d
Total 128
2b My ability to ... after the
course was - 2b My ability to
... before the course was
Negative Ranks 0e ,00 ,00
Positive Ranks 120f 60,50 7260,00
Ties 8g
Total 128
a. Country = Bulgaria
b. 2a My ability to ... after the course was < 2a My ability to ... before the course was
c. 2a My ability to ... after the course was > 2a My ability to ... before the course was
d. 2a My ability to ... after the course was = 2a My ability to ... before the course was
e. 2b My ability to ... after the course was < 2b My ability to ... before the course was
f. 2b My ability to ... after the course was > 2b My ability to ... before the course was
g. 2b My ability to ... after the course was = 2b My ability to ... before the course was
Test Statisticsa,b
2a My ability to ...
after the course was
- 2a My ability to ...
before the course
was
2b My ability to ...
after the course was
- 2b My ability to
... before the course
was
Z -9,303c -9,742c
Asymp. Sig. (2-tailed) ,000 ,000
a. Country = Bulgaria
b. Wilcoxon Signed Ranks Test
c. Based on negative ranks.
Comparison Items 2 a b c – Netherlands
Descriptive Statisticsa
N Mean Std. Deviation Minimum Maximum
2a My ability to ... before the course was 55 2,564 1,0321 1,0 4,0
2a My ability to ... after the course was 55 3,655 ,9854 1,0 5,0
2b My ability to ... before the course was 42 2,286 ,9948 1,0 4,0
2b My ability to ... after the course was 42 3,595 ,8571 1,0 5,0
2c My ability to ... before the course was 41 2,122 1,0294 1,0 4,0
2c My ability to ... after the course was 41 3,366 ,9939 1,0 5,0
a. Country = Netherlands
Ranksa
N Mean Rank Sum of Ranks
2a My ability to ... after the
course was - 2a My ability to
... before the course was
Negative Ranks 1b 9,50 9,50
Positive Ranks 37c 19,77 731,50
Ties 17d
Total 55
2b My ability to ... after the
course was - 2b My ability to
... before the course was
Negative Ranks 1e 20,50 20,50
Positive Ranks 32f 16,89 540,50
Ties 9g
Total 42
2c My ability to ... after the
course was - 2c My ability to
... before the course was
Negative Ranks 2h 17,75 35,50
Positive Ranks 30i 16,42 492,50
Ties 9j
Total 41
a. Country = Netherlands
b. 2a My ability to ... after the course was < 2a My ability to ... before the course was
c. 2a My ability to ... after the course was > 2a My ability to ... before the course was
d. 2a My ability to ... after the course was = 2a My ability to ... before the course was
e. 2b My ability to ... after the course was < 2b My ability to ... before the course was
f. 2b My ability to ... after the course was > 2b My ability to ... before the course was
g. 2b My ability to ... after the course was = 2b My ability to ... before the course was
h. 2c My ability to ... after the course was < 2c My ability to ... before the course was
i. 2c My ability to ... after the course was > 2c My ability to ... before the course was
j. 2c My ability to ... after the course was = 2c My ability to ... before the course was
Test Statisticsa,b
2a My ability to ...
after the course was
- 2a My ability to ...
before the course
was
2b My ability to ...
after the course was
- 2b My ability to
... before the course
was
2c My ability to ...
after the course was
- 2c My ability to ...
before the course
was
Z -5,353c -4,722c -4,336c
Asymp. Sig. (2-tailed) ,000 ,000 ,000
a. Country = Netherlands
b. Wilcoxon Signed Ranks Test
c. Based on negative ranks.
Comparison Items 3 a b – General
Descriptive Statistics
N Mean Std. Deviation Minimum Maximum
3a How important for me is ...
before the course 278 3,371 1,1350 1,0 5,0
3a How important for me is ...
after the course 278 4,306 ,7432 1,0 5,0
3b How important for me is ...
before the course 238 3,294 1,0819 1,0 5,0
3b How important for me is ...
after the course 238 4,273 ,7498 1,0 5,0
Ranks
N Mean Rank Sum of Ranks
3a How important for me is ...
after the course - 3a How
important for me is ... before
the course
Negative Ranks 7a 68,00 476,00
Positive Ranks 183b 96,55 17669,00
Ties 88c
Total 278
3b How important for me is ...
after the course - 3b How
important for me is ... before
the course
Negative Ranks 5d 93,10 465,50
Positive Ranks 158e 81,65 12900,50
Ties 75f
Total 238
a. 3a How important for me is ... after the course < 3a How important for me is ... before the course
b. 3a How important for me is ... after the course > 3a How important for me is ... before the course
c. 3a How important for me is ... after the course = 3a How important for me is ... before the course
d. 3b How important for me is ... after the course < 3b How important for me is ... before the course
e. 3b How important for me is ... after the course > 3b How important for me is ... before the course
f. 3b How important for me is ... after the course = 3b How important for me is ... before the course
Test Statisticsa
3a How important for me is ... after the
course - 3a How important for me is ...
before the course
3b How important for me is ... after the
course - 3b How important for me is ...
before the course
Z -11,875b -10,636b
Asymp. Sig. (2-tailed) ,000 ,000
a. Wilcoxon Signed Ranks Test
b. Based on negative ranks.
Comparison Items 3 a b – Greece
Descriptive Statisticsa
N Mean Std. Deviation Minimum Maximum
3a How important for me is ... before the course 44 4,318 ,8004 2,0 5,0
3a How important for me is ... after the course 44 4,591 ,6928 2,0 5,0
3b How important for me is ... before the course 5 4,800 ,4472 4,0 5,0
3b How important for me is ... after the course 5 4,800 ,4472 4,0 5,0
a. Country = Greece
N Mean Rank Sum of Ranks
3a How important for
me is ... after the course
- 3a How important for
me is ... before the
course
Negative Ranks 3b 7,50 22,50
Positive Ranks 13c 8,73 113,50
Ties 28d
Total 44
3b How important for
me is ... after the course
- 3b How important for
me is ... before the
course
Negative Ranks 1e 1,50 1,50
Positive Ranks 1f 1,50 1,50
Ties 3g
Total 5
a. Country = Greece
b. 3a How important for me is ... after the course < 3a How important for me is ... before the course
c. 3a How important for me is ... after the course > 3a How important for me is ... before the course
d. 3a How important for me is ... after the course = 3a How important for me is ... before the course
e. 3b How important for me is ... after the course < 3b How important for me is ... before the course
f. 3b How important for me is ... after the course > 3b How important for me is ... before the course
g. 3b How important for me is ... after the course = 3b How important for me is ... before the course
Test Statisticsa,b
3a How important
for me is ... after
the course - 3a
How important for
me is ... before the
course
3b How important
for me is ... after
the course - 3b
How important for
me is ... before the
course
Z -2,556c ,000d
Asymp. Sig. (2-tailed) ,011 1,000
a. Country = Greece
b. Wilcoxon Signed Ranks Test
c. Based on negative ranks.
d. The sum of negative ranks equals the sum of positive ranks.
Comparison Items 3 a b – Spain
Descriptive Statisticsa
N Mean Std. Deviation Minimum Maximum
3a How important for me is ...
before the course 52 2,500 1,3648 1,0 5,0
3a How important for me is ...
after the course 52 4,077 ,8128 3,0 5,0
3b How important for me is ...
before the course 52 2,519 1,1113 1,0 5,0
3b How important for me is ...
after the course 52 3,962 ,7399 2,0 5,0
a. Country = Spain
Ranksa
N Mean Rank Sum of Ranks
3a How important for me is ...
after the course - 3a How
important for me is ... before
the course
Negative Ranks 4b 7,00 28,00
Positive Ranks 37c 22,51 833,00
Ties 11d
Total 52
3b How important for me is ...
after the course - 3b How
important for me is ... before
the course
Negative Ranks 4e 21,38 85,50
Positive Ranks 42f 23,70 995,50
Ties 6g
Total 52
a. Country = Spain
b. 3a How important for me is ... after the course < 3a How important for me is ... before the course
c. 3a How important for me is ... after the course > 3a How important for me is ... before the course
d. 3a How important for me is ... after the course = 3a How important for me is ... before the course
e. 3b How important for me is ... after the course < 3b How important for me is ... before the course
f. 3b How important for me is ... after the course > 3b How important for me is ... before the course
g. 3b How important for me is ... after the course = 3b How important for me is ... before the course
Test Statisticsa,b
3a How important
for me is ... after
the course - 3a
How important for
me is ... before the
course
3b How important
for me is ... after
the course - 3b
How important for
me is ... before the
course
Z -5,265c -5,038c
Asymp. Sig. (2-tailed) ,000 ,000
a. Country = Spain
b. Wilcoxon Signed Ranks Test
c. Based on negative ranks.
Comparison Items 3 a b – Bulgaria
Descriptive Statisticsa
N Mean Std. Deviation Minimum Maximum
3a How important for me is ...
before the course 128 3,516 ,7528 1,0 5,0
3a How important for me is ...
after the course 128 4,445 ,5860 3,0 5,0
3b How important for me is ...
before the course 128 3,594 ,8365 1,0 5,0
3b How important for me is ...
after the course 128 4,516 ,5610 3,0 5,0
a. Country = Bulgaria
Ranksa
N Mean Rank Sum of Ranks
3a How important for me is ...
after the course - 3a How
important for me is ... before
the course
Negative Ranks 0b ,00 ,00
Positive Ranks 101c 51,00 5151,00
Ties 27d
Total 128
3b How important for me is ...
after the course - 3b How
important for me is ... before
the course
Negative Ranks 0e ,00 ,00
Positive Ranks 90f 45,50 4095,00
Ties 38g
Total 128
a. Country = Bulgaria
b. 3a How important for me is ... after the course < 3a How important for me is ... before the course
c. 3a How important for me is ... after the course > 3a How important for me is ... before the course
d. 3a How important for me is ... after the course = 3a How important for me is ... before the course
e. 3b How important for me is ... after the course < 3b How important for me is ... before the course
f. 3b How important for me is ... after the course > 3b How important for me is ... before the course
g. 3b How important for me is ... after the course = 3b How important for me is ... before the course
Test Statisticsa,b
3a How important
for me is ... after
the course - 3a
How important for
me is ... before the
course
3b How important
for me is ... after
the course - 3b
How important for
me is ... before the
course
Z -9,477c -8,702c
Asymp. Sig. (2-tailed) ,000 ,000
a. Country = Bulgaria
b. Wilcoxon Signed Ranks Test
c. Based on negative ranks.
Comparison Items 3 a b – Netherlands
Descriptive Statisticsa
N Mean Std. Deviation Minimum Maximum
3a How important for me is ... before the course 54 3,093 1,2017 1,0 5,0
3a How important for me is ... after the course 54 3,963 ,8679 1,0 5,0
3b How important for me is ... before the course 53 3,189 1,1612 1,0 5,0
3b How important for me is ... after the course 53 3,943 ,9285 1,0 5,0
a. Country = Netherlands
Ranksa
N Mean Rank
Sum of
Ranks
3a How important for me is ...
after the course - 3a How
important for me is ... before the
course
Negative Ranks 0b ,00 ,00
Positive Ranks 32c 16,50 528,00
Ties 22d
Total 54
3b How important for me is ...
after the course - 3b How
important for me is ... before the
course
Negative Ranks 0e ,00 ,00
Positive Ranks 25f 13,00 325,00
Ties 28g
Total 53
a. Country = Netherlands
b. 3a How important for me is ... after the course < 3a How important for me is ... before the course
c. 3a How important for me is ... after the course > 3a How important for me is ... before the course
d. 3a How important for me is ... after the course = 3a How important for me is ... before the course
e. 3b How important for me is ... after the course < 3b How important for me is ... before the course
f. 3b How important for me is ... after the course > 3b How important for me is ... before the course
Test Statisticsa,b
3a How important for me is ... after the course - 3a
How important for me is ... before the course
3b How important for me is ... after the course -
3b How important for me is ... before the course
Z -5,144c -4,479c
Asymp. Sig. (2-tailed) ,000 ,000
a. Country = Netherlands
b. Wilcoxon Signed Ranks Test
c. Based on negative ranks.
APPENDIX III – Impact on teachers’ competence development – Coded and Specified
Knowledge and Understanding
CODE My knowledge and understanding before / after
Lifelong learners
Facilitators of students’
learning
Members of educational
communities Competence Country Modul
LK5 on issues pertaing to inclusion and diversity GR 1 x
LK3 in terms of curricular knowledge on students skills that should be developed via STEM
GR 2 x
FK1, FK3 ** on methodologies and methods for planning, conducting and assessing an interdisciplinary project
GR 3 x
FK2 on teaching methodologies for dealing with socio-scientific issues in their classrooms
GR 4 x
FK4 on the potential of use of digital means for promoting students' learning
GR 5 x
FK2, FK4 ** on IB learning and teaching and on new technologies as a tool for orchestration students' learning
GR 6 x
MK2 on contextual aspects realting to gender-neutral approaches to STEM
GR 7 x
MK2 on how to contribute to overcoming personal bad experiences of parents for STEM success of their children
GR 8 x
FK2 about IBL methodology ES 1 x
FK4 about the potential of ICT to facilitate the learning process
ES 1 X
FK1 about using IBL learning strategies ES 2 X
FK2 about designing project based on IBL methodology ES 2 x
LK5 about dealing with diversity in STEM subjects ES 3 x
LK4 gender differences, learning styles, personalization. ES 3 x
LK2 about socio-scientific methodology issues ES 4 X
FK1 about the teaching-learning phases for activities based on socio-scientific issues
ES 4 x
FK2* about the key challenges and difficulties to implement STEM activities in the classroom using IBL methodologies.
ES 5 X
FK2* about designing teaching-learning sequences based on IBL
ES 5 X
FK4* about the emerging ICT tools in STEM to be used on STEM subjects
ES 6 x
FK2, FK4* ** about using computational thinking, robotics and game based learning for designing IBL activities
ES 6 x
LK5 about the different types of gender bias on classroom ES 7 X
MK2 about defining strategies to promote parental engagement on gender bias on STEM
ES 7 x
MK2* about the use of innovative teaching methodology and technology to change parents’ attitude about STEM subjects
ES 8 x
MK2* about strategies to overcome personal bad experiences of parents for STEM success of their children
ES 8 x
FK2 on application of IBL approach in teaching science BG 1 x
FK1 on use of various didactical tools and resources BG 1 x
FK3* on various methods and means of assessment in the context of IBL
BG 2 x
FK3* on assessment of individuals and team as a whole diring team work
BG 2 x
LK5 on limitations and needs of learners with different types of SEN
BG 3 x
LK2 on the role of the open air lessons for develoment of holistic picture of the relationships between STEM disciplines…
BG 4 x
LK1 on the role of interdisciplinary STEM learning… BG 4 x
FK2* on IBL approach and methodologies BG 5 x
FK2* on workflow of IBL design and implementation BG 5 x
LK3 on new concepts in the 8-th grade ICT curricula BG 6 x
FK4 on use of Web 2.0 (cloud) applications for working in shared environment and development common documents in teams
BG 6 x
MK1 on various methods and tools to present STEM to students and parents…
BG 7 x
MK2 of the causes of prejudices regarding the study of STEM sciences …
BG 7 x
MK2* on various methods and means of communication between teachers and parents…
BG 8 x
MK2* on the causes of broken communication between parents and teachers …
BG 8 x
FK2*
basic knowledge of the concept of seamless learning, learning in different contexts, contextualised, situated learning, in and throughout formal and informal learning environments with technology (technology-enhanced seamless learning)
NL 1 X
FK4 on tools and technologies for connecting learners and learning throughout contexts
NL 1 X
FK2* about possible applications of seamless learning in school education and learning
NL 1 X
LK2* knowledge and insights in applying seamless learning principles in education
NL 2 x
LK2* on knowledge and insights in research and new trends of learning in seamless way
NL 2 X
FK2 knowledge on design of seamless learning NL 2 X
LK2 knowledge of the topic of effective learning strategies NL 3 X
FK1 knowledge of state-of-the-art research on the topic of effective learning stategies
NL 3 X
FK2 knowledge on design of seamless learning NL 3 X
FK4* knowledge on the topic of feedback in teaching writing NL 4 X
FK4* knowledge on the topic of formative and summative assessment in teaching writing
NL 4 X
LK2 knowledge of the state-of the art research on writing pedagogies
NL 4 X
FK4* of media design principles NL 5 x
FK3 of evaluation principles and evaluation process steps NL 5 x
FK4* of software for app design (i.e., ARlearn) NL 5 x
CODE My ability before / after
Lifelong learners
Facilitators of students’
learning
Members of educational
communities Competence Country Modul
LS1, LS2 ** to use padagogical strategies in STEM to deal with issues on inlusion and diversity
GR 1 x
FS1 to design learning activities that tackle diversity issues in the classroom
GR 1 x
FS4 adapt and assess teaching/learning objectives and processes
GR 2 x
LS3 for learning in professional communities GR 3 x
FS3 to managing students and groups GR 3 x
FS1 to teach socioscientific issues GR 4 x
FS3 to managing students and groups GR 4 x
LS1 utilize informal science resources for professional decisions and teaching/learning improvement
GR 5 x
FS1 teach through IBL GR 6 x
FS4 confront with IBL assessment challenges GR 6 x
MS1, MS2 ** to engage parents in STEM teaching GR 7 x
MS1, MS2 ** to contribute personal bad experiences of parents for STEM success of their children
GR 8 x
FSI,FS2* ** design IBL activities on digital environments ES 1 x
FSI,FS2* ** planning, coordinating and adapting teaching-learning activities in a digital environment
ES 1 x
FS3 to design and manage STEM project using IBL methodology
ES 2 x
LS1, LS2** to promote learning involving real problems with different sources of information using IBL methodology
ES 2 x
LS1, LS2** to use pedagogical strategies on STEM to deal with diversity in the classroom
ES 3 X
FS1 to design activities considering gender differences and learning styles
ES 3 X
FS1 designing teaching-learning activities based on socio-scientific issues
ES 4 x
FS2 using strategies for introducing socio-scientific issues in the classroom on STEM subjects
ES 4 x
FS2 to deal with difficulties implementing STEM activities in the classroom using IBL methodologies
ES 5 x
FS4 facing the challenges on the application of teaching sequences based on IBL
ES 5 x
FS2* designing STEM activities IBL-based using emerging digital tools
ES 6 x
FS2* using the game-based learning methodology in the classroom
ES 6 x
MS1, MS2* ** training parents for knowing strategies to avoid gender bias
ES 7 x
MS1, MS2* ** to promote parents’ engagement on actively dealing with gender bias on STEM
ES 7 x
MS1, MS2** helping parents to overcome personal bad experiences for STEM success of their children
ES 8 x
MS3 using innovative teaching methodology and technology to change parents’ attitude about STEM subjects
ES 8 x
FS2* to prepapre and use variety of learning materials/resoures for lab classes in science
BG 1 x
FS2* to design and conduct IBL process, involving work with different learning resources (paper resources, VR, cloud apps dor collaborative work)…
BG 1 x
FS4 to use proposed methods and tools for assessment in the context of team work during IBL
BG 2 x
FS5 to evaluate and adequately apply the proposed methods and tools (harnessing experience)
BG 2 x
FS2 to use different specialized tools in work with SEN students
BG 3 x
FS1 to apply different methods to teach SEN students BG 3 x
Learning skills, Teaching skills, Professional skills
Dispositions and attitudes
CODE How important for me is ... (before/after) Lifelong
learners
Facilitators of students’
learning
Members of educational
communities Competence Country Modul
LD3 to have critical attitudes to my own learning and teaching practice
GR 1 X
FD3 to promote learning for all students GR 1 X
LD2 to have positive dispositions towards change and flexibility
GR 2 X
MD1 to have positive dispositions to team working, collaboration and networking
GR 3 X
FD1 to incorporate socio-scientific issues in classrooms GR 4 x
LD2 to be open an flexible to new ideas and approached in my teaching
GR 5 x
FS1* to prepare the documentation needed to deliver open air lesson
BG 4 x
FS1* to plan interdisciplinary open air lessons BG 4 x
FS5 to use others teachers' IBL experience in my own classroom
BG 5 x
FS4 to design and conduct IBL, and assess students' achievment in the context of my sublect(s)
BG 5 x
FS2* to use of virtual machines for management of special students’ tasks, required administrative rights on computers
BG 6 x
FS2* to design and manage of educational process working in a cloud
BG 6 x
FS2 to use variety of interactive teaching methods in STEM area…
BG 7 x
LS3, LS2** to evaluate adequately achievements / behaviour / attitude of students and parents and to apply different methods for overcoming biases…
BG 7 X
MS2 to use different methods for effective comminication with the other side…
BG 8 X
MS1 to adequately evaluate the behavior of the other party and to apply methods for effective communication with it…
BG 8 X
FS1 to give and discuss examples of seamless learning in educational practice
NL 1 x
FS5 to analyse learning-rich (seamless learning) contexts outside classroom
NL 1 X
LS2 to analyse the potential of seamless learning on one's own educational practice
NL 1 X
LS1* to produce a schematic representation of seamless learning design in practice
NL 2 X
LS1* to analyse state of the art literature on seamless learning thematics
NL 2 Χ
LS1* to describe a possible application of a tool for seamless learning
NL 2 X
LS1 to give examples of effective learning strategies NL 3 X
LS1, LS2* to apply knowledge of feedback principles in teaching writing
NL 4 X
LS1, LS2* to apply knowledge of assessment techniques in teaching writing
NL 4 X
LS1, LS2* to use theoretical knowledge on feedback and assessment for teaching writing in one's teaching
NL 4 X
FS2 to plan, organize, implement and evaluate a media design product
NL 5 x
FS2 to design an app using dedicated software (i.e., ARLearn)
NL 5 x
LS3 to work together on an international project in an online environment
NL 5 X
LD3 to adopt innovative teaching methodologies GR 6 x
MD1 to communicate effectively with parents for supporting gender-neutral approaches to STEM at home
GR 7 X
MD2 to communicate effectivley with parents to engage them in STEM teaching
GR 8 X
LD2 to have a positive attitude towards the use of new methodologies on my teaching.
ES 1 X
MD1 to teamwork in the design of activities ES 1 X
FD1 to have positive disposition towards using PBL in my classroom.
ES 2 X
MD1 to collaborate with colleagues in designing learning projects.
ES 2 X
FC3 to have positive attitude towards differences in the students learning.
ES 3 X
MD1 to work with colleagues in promoting students personalization.
ES 3 x
LD2 to be open to understand the connections between science and society.
ES 4 X
MD1 to collaborate with the scientific community in my teaching practice.
ES 4 X
LD3 to have disposition to solve the difficulties of IBL implementation.
ES 5 X
MD1 to teamwork with colleagues and students to face the practical challenges of IBL in the classroom.
ES 5 X
LD2 to be open to new digital approaches to teach STEM. ES 6 X
MD1 teamwork for trialing new digital technologies. ES 6 X
LD3 to have a critical attitide in terms of gender differences. ES 7 X
MD1 to teamwork with parents, students and colleagues in reducing gender gap in STEM.
ES 7 X
MD1* to have good disposition to collaborate with parents in my STEM clasrooms.
ES 8 X
MD1* to teamwork with parents to solve difficulties in the students learning.
ES 8 X
FD1 the role of traditional and modern tools (incl. ICT), used to develop inquiry students' competences…
BG 1 x
MD1 team working, collaboration & networking with othe STEM teachers and academic community…
BG 1 x
LD3 having critical attitudes to assessing all achievements, results and individual growth in IBL
BG 2 x
MD1 team working, collaboration & networking with othe STEM teachers and academic community…
BG 2 x
FD3 creating of learning design, adapted to involve SEN learners in trainings based on IBL approach
BG 3 x
MD1 team working, collaboration & networking in the context of working with SEN students
BG 3 x
FD1 interdisciplinary IBL among nature BG 4 x
MD1 the team work during the process of the design of the interdisciplinary open air lessons
BG 4 x
FD1 application of the IBL approach in my teaching practice BG 5 x
MD1 team working, collaboration & networking in the context of IBL appkication in the STEM classroom
BG 5 x
FD2
the modern ICTs used in life and the need of development students’ competences to use them in ethical and creative way for life, learning, self-expression, entertainment, etc.
BG 6 x
MD1 my particiption in team working, collaboration & networking with other ICT and STEM teachers
BG 6 x
LD3 the critical attitude, the individual peculiarities and the motives of the other participants in the triangle teacher-student-parent ..
BG 7 x
MD1 teamwork, interaction and networking with scientists, other teachers and parenting communities ...
BG 7 x
LD3 critical attitude, the individual peculiarities and the motives of the other side in the teacher-parent communication ...
BG 8 x
MD1 teamwork, interaction and networking with other teachers and parenting communities ...
BG 8 x
FD1* the value of different perspectives on classroom and outside of classroom learning
NL 1 X
FD1* the value and limitations of using tools and technology for learning in and outside the classroom
NL 1 X
MD1* the value of different perspectives on seamless learning among the stakeholders
NL 2 x
MD1* the value of participative design NL 2 x
FD1 Understanding of importance of using effective learning strategies in teaching
3
FD2 The value of evidence based research for practice 3
LD2* the value of writing pedagogies in general and feedback practices in teaching writing in particular
NL 4 X
LD2* the value of writing pedagogies in general and formative and summative assessment practices in teaching writing in particular
NL 4 X
FD2* The value I put on intercultural communication skills NL 5 X
FD2* The value I put on project management in design and evaluation
NL 5 X
* In this case, the same role/competence was surveyed with both Items in one questionnaire. In this case, the mean of both items were used for further analyses. ** In this case, the item has been assigned to multiple roles/competencies.
LK-1-after - LK-1-before Negative Ranks 0a ,00 ,00 a. LK-1-after < LK-1-before b. LK-1-after > LK-1-before c. LK-1-after = LK-1-before d. LK-2-after < LK-2-before e. LK-2-after > LK-2-before f. LK-2-after = LK-2-before g. LK-3-after < LK-3-before h. LK-3-after > LK-3-before i. LK-3-after = LK-3-before j. LK-4-after < LK-4-before
LK-3-after - LK-3-before Negative Ranks 0b ,00 ,00 a. Country = Greece b. LK-3-after < LK-3-before c. LK-3-after > LK-3-before d. LK-3-after = LK-3-before e. LK-5-after < LK-5-before f. LK-5-after > LK-5-before g. LK-5-after = LK-5-before h. LS-1-after < LS-1-before i. LS-1-after > LS-1-before j. LS-1-after = LS-1-before k. LS-3-after < LS-3-before l. LS-3-after > LS-3-before m. LS-3-after = LS-3-before n. LD-2-after < LD-2-before o. LD-2-after > LD-2-before p. LD-2-after = LD-2-before q. LD-3-after < LD-3-before r. LD-3-after > LD-3-before s. LD-3-after = LD-3-before
1b 1,50 1,50 a. Country = Spain b. LK-2-after < LK-2-before c. LK-2-after > LK-2-before d. LK-2-after = LK-2-before e. LK-4-after < LK-4-before f. LK-4-after > LK-4-before g. LK-4-after = LK-4-before h. LK-5-after < LK-5-before i. LK-5-after > LK-5-before j. LK-5-after = LK-5-before k. LS-1-after < LS-1-before l. LS-1-after > LS-1-before m. LS-1-after = LS-1-before n. LS-2-after < LS-2-before o. LS-2-after > LS-2-before p. LS-2-after = LS-2-before q. LD-2-after < LD-2-before r. LD-2-after > LD-2-before s. LD-2-after = LD-2-before t. LD-3-after < LD-3-before u. LD-3-after > LD-3-before v. LD-3-after = LD-3-before
Positive Ranks 2c 2,25 4,50
Ties 13d Total 16
LK-4-after - LK-4-before Negative Ranks
0e ,00 ,00
Positive Ranks 3f 2,00 6,00
Ties 0g Total 3
LK-5-after - LK-5-before Negative Ranks
0h ,00 ,00
Positive Ranks 2i 1,50 3,00
Ties 1j Total 3
LS-1-after - LS-1-before Negative Ranks
3k 3,50 10,50
Positive Ranks 9l 7,50 67,50
Ties 3m Total 15
LS-2-after - LS-2-before Negative Ranks
3n 3,50 10,50
Positive Ranks 9o 7,50 67,50
Ties 3p Total 15
LD-2-after - LD-2-before Negative Ranks
1q 3,00 3,00
Positive Ranks 21r 11,90 250,00
Ties 4s Total 26
LD-3-after - LD-3-before Negative Ranks
2t 2,00 4,00
Positive Ranks 4u 4,25 17,00
Ties 2v Total 8
Test Statisticsa,b
LK-2-after - LK-2-before
LK-4-after - LK-4-before
LK-5-after - LK-5-before
LS-1-after - LS-1-before
LS-2-after - LS-2-before
LD-2-after - LD-2-before
LD-3-after - LD-3-before
Z -,816c -1,633c -1,414c -2,285c -2,285c -4,053c -1,382c Asymp. Sig. (2-tailed)
LK-1-after - LK-1-before Negative Ranks 0b ,00 ,00 a. Country = Bulgaria b. LK-1-after < LK-1-before c. LK-1-after > LK-1-before d. LK-1-after = LK-1-before e. LK-2-after < LK-2-before f. LK-2-after > LK-2-before g. LK-2-after = LK-2-before h. LK-3-after < LK-3-before i. LK-3-after > LK-3-before j. LK-3-after = LK-3-before k. LK-5-after < LK-5-before l. LK-5-after > LK-5-before m. LK-5-after = LK-5-before n. LS-2-after < LS-2-before o. LS-2-after > LS-2-before p. LS-2-after = LS-2-before q. LS-3-after < LS-3-before r. LS-3-after > LS-3-before s. LS-3-after = LS-3-before t. LD-3-after < LD-3-before u. LD-3-after > LD-3-before v. LD-3-after = LD-3-before
LK-2-after - LK-2-before Negative Ranks 1b 22,00 22,00 a. Country = Netherlands b. LK-2-after < LK-2-before c. LK-2-after > LK-2-before d. LK-2-after = LK-2-before e. LS-1-after < LS-1-before f. LS-1-after > LS-1-before g. LS-1-after = LS-1-before h. LS-2-after < LS-2-before i. LS-2-after > LS-2-before j. LS-2-after = LS-2-before k. LS-3-after < LS-3-before l. LS-3-after > LS-3-before m. LS-3-after = LS-3-before n. LD-2-after < LD-2-before o. LD-2-after > LD-2-before p. LD-2-after = LD-2-before
Positive Ranks 22c 11,55 254,00
Ties 4d Total 27
LS-1-after - LS-1-before Negative Ranks 1e 14,50 14,50
FK-1-after - FK-1-before Negative Ranks 4a 12,00 48,00 a. FK-1-after < FK-1-before b. FK-1-after > FK-1-before c. FK-1-after = FK-1-before d. FK-2-after < FK-2-before e. FK-2-after > FK-2-before f. FK-2-after = FK-2-before g. FK-3-after < FK-3-before h. FK-3-after > FK-3-before i. FK-3-after = FK-3-before j. FK-4-after < FK-4-before k. FK-4-after > FK-4-before l. FK-4-after = FK-4-before m. FS-1-after < FS-1-before n. FS-1-after > FS-1-before o. FS-1-after = FS-1-before
Positive Ranks 40b 23,55 942,00
Ties 9c Total 53
FK-2-after - FK-2-before Negative Ranks 3d 16,67 50,00
FK-1-after - FK-1-before Negative Ranks 0b ,00 ,00 a. Country = Greece b. FK-1-after < FK-1-before c. FK-1-after > FK-1-before d. FK-1-after = FK-1-before e. FK-2-after < FK-2-before f. FK-2-after > FK-2-before g. FK-2-after = FK-2-before h. FK-3-after < FK-3-before i. FK-3-after > FK-3-before j. FK-3-after = FK-3-before k. FK-4-after < FK-4-before l. FK-4-after > FK-4-before m. FK-4-after = FK-4-before n. FS-1-after < FS-1-before o. FS-1-after > FS-1-before p. FS-1-after = FS-1-before q. FS-3-after < FS-3-before r. FS-3-after > FS-3-before s. FS-3-after = FS-3-before t. FS-4-after < FS-4-before u. FS-4-after > FS-4-before v. FS-4-after = FS-4-before w. FD-1-after < FD-1-before x. FD-1-after > FD-1-before y. FD-1-after = FD-1-before z. FD-3-after < FD-3-before aa. FD-3-after > FD-3-before ab. FD-3-after = FD-3-before
FK-1-after - FK-1-before Negative Ranks 4b 5,00 20,00 a. Country = Spain b. FK-1-after < FK-1-before c. FK-1-after > FK-1-before d. FK-1-after = FK-1-before e. FK-2-after < FK-2-before f. FK-2-after > FK-2-before
g. FK-2-after = FK-2-before h. FK-4-after < FK-4-before i. FK-4-after > FK-4-before j. FK-4-after = FK-4-before k. FS-1-after < FS-1-before l. FS-1-after > FS-1-before
m. FS-1-after = FS-1-before n. FS-2-after < FS-2-before o. FS-2-after > FS-2-before p. FS-2-after = FS-2-before q. FS-3-after < FS-3-before r. FS-3-after > FS-3-before s. FS-3-after = FS-3-before t. FS-4-after < FS-4-before
Positive Ranks 18c 12,94 233,00
Ties 6d Total 28
FK-2-after - FK-2-before Negative Ranks 2e 8,50 17,00
FK-1-after - FK-1-before Negative Ranks 0b ,00 ,00 a. Country = Bulgaria b. FK-1-after < FK-1-before c. FK-1-after > FK-1-before d. FK-1-after = FK-1-before e. FK-2-after < FK-2-before f. FK-2-after > FK-2-before
g. FK-2-after = FK-2-before h. FK-3-after < FK-3-before i. FK-3-after > FK-3-before j. FK-3-after = FK-3-before k. FK-4-after < FK-4-before l. FK-4-after > FK-4-before
m. FK-4-after = FK-4-before n. FS-1-after < FS-1-before o. FS-1-after > FS-1-before p. FS-1-after = FS-1-before q. FS-2-after < FS-2-before r. FS-2-after > FS-2-before s. FS-2-after = FS-2-before t. FS-4-after < FS-4-before
u. FS-4-after > FS-4-before v. FS-4-after = FS-4-before w. FS-5-after < FS-5-before x. FS-5-after > FS-5-before y. FS-5-after = FS-5-before z. FD-1-after < FD-1-before
FK-1-after - FK-1-before Negative Ranks 0b ,00 ,00 a. Country = Netherlands b. FK-1-after < FK-1-before c. FK-1-after > FK-1-before d. FK-1-after = FK-1-before e. FK-2-after < FK-2-before f. FK-2-after > FK-2-before
g. FK-2-after = FK-2-before h. FK-3-after < FK-3-before i. FK-3-after > FK-3-before j. FK-3-after = FK-3-before k. FK-4-after < FK-4-before l. FK-4-after > FK-4-before
m. FK-4-after = FK-4-before n. FS-1-after < FS-1-before o. FS-1-after > FS-1-before p. FS-1-after = FS-1-before q. FS-2-after < FS-2-before r. FS-2-after > FS-2-before s. FS-2-after = FS-2-before t. FS-5-after < FS-5-before
u. FS-5-after > FS-5-before v. FS-5-after = FS-5-before
w. FD-1-after < FD-1-before x. FD-1-after > FD-1-before y. FD-1-after = FD-1-before z. FD-2-after < FD-2-before
aa. FD-2-after > FD-2-before ab. FD-2-after = FD-2-before
MK-2-after - MK-2-before Negative Ranks 0b ,00 ,00 a. Country = Greece b. MK-2-after < MK-2-before c. MK-2-after > MK-2-before d. MK-2-after = MK-2-before e. MS-1-after < MS-1-before f. MS-1-after > MS-1-before
g. MS-1-after = MS-1-before h. MS-2-after < MS-2-before i. MS-2-after > MS-2-before j. MS-2-after = MS-2-before
k. MD-1-after < MD-1-before l. MD-1-after > MD-1-before
MK-2-after - MK-2-before Negative Ranks 0b ,00 ,00 a. Country = Spain b. MK-2-after < MK-2-before c. MK-2-after > MK-2-before d. MK-2-after = MK-2-before e. MS-1-after < MS-1-before f. MS-1-after > MS-1-before
g. MS-1-after = MS-1-before h. MS-2-after < MS-2-before i. MS-2-after > MS-2-before j. MS-2-after = MS-2-before
k. MS-3-after < MS-3-before l. MS-3-after > MS-3-before
m. MS-3-after = MS-3-before n. MD-1-after < MD-1-before o. MD-1-after > MD-1-before p. MD-1-after = MD-1-before
Positive Ranks 8c 4,50 36,00
Ties 0d Total 8
MS-1-after - MS-1-before Negative Ranks 1e 1,00 1,00
MK-1-after - MK-1-before Negative Ranks 0b ,00 ,00 a. Country = Bulgaria b. MK-1-after < MK-1-before c. MK-1-after > MK-1-before d. MK-1-after = MK-1-before e. MK-2-after < MK-2-before f. MK-2-after > MK-2-before
g. MK-2-after = MK-2-before h. MS-1-after < MS-1-before i. MS-1-after > MS-1-before j. MS-1-after = MS-1-before
k. MS-2-after < MS-2-before l. MS-2-after > MS-2-before
m. MS-2-after = MS-2-before n. MD-1-after < MD-1-before o. MD-1-after > MD-1-before p. MD-1-after = MD-1-before
MD-1-after - MD-1-before Negative Ranks 0b ,00 ,00 a. Country = Netherlands b. MD-1-after < MD-1-before c. MD-1-after > MD-1-before d. MD-1-after = MD-1-before
Positive Ranks 7c 4,00 28,00
Ties 0d Total 7
Test Statisticsa,b
MD-1-after - MD-
1-before
Z -2,384c Asymp. Sig. (2-tailed) ,017
a. Country = Netherlands b. Wilcoxon Signed Ranks Test c. Based on negative ranks.
APPENDIX IV – Process on the activities on teacher’s competence development
Contributed activities in the course – General
Descriptive Statistics
N Mean
Contributed activities in the
course - questioning 276 3,786
Contributed activities in the
course - planning the method 276 3,438
Contributed activities in the
course - review and analyze
data
276 3,641
Contributed activities in the
course - hand-on activity 276 4,156
Contributed activities in the
course - communication 276 3,975
Valid N (listwise) 276
Contributed activities in the course – Questioning
Contributed activities in the course - questioning
Frequency Percent Valid Percent
Cumulative
Percent
Valid not at all 8 2,8 2,9 2,9
to a small extent 12 4,2 4,3 7,2
so some extent 65 22,6 23,6 30,8
to a moderate extent 137 47,7 49,6 80,4
to a great extent 54 18,8 19,6 100,0
Total 276 96,2 100,0
Missing no value 11 3,8
Total 287 100,0
Contributed activities in the course – Planning the method
Contributed activities in the course - planning the method
Frequency Percent Valid Percent
Cumulative
Percent
Valid not at all 11 3,8 4,0 4,0
to a small extent 32 11,1 11,6 15,6
so some extent 96 33,4 34,8 50,4
to a moderate extent 99 34,5 35,9 86,2
to a great extent 38 13,2 13,8 100,0
Total 276 96,2 100,0
Missing no value 11 3,8
Total 287 100,0
Contributed activities in the course – Review and analyse
Contributed activities in the course - review and analyze data
Frequency Percent Valid Percent
Cumulative
Percent
Valid not at all 10 3,5 3,6 3,6
to a small extent 27 9,4 9,8 13,4
so some extent 72 25,1 26,1 39,5
to a moderate extent 110 38,3 39,9 79,3
to a great extent 57 19,9 20,7 100,0
Total 276 96,2 100,0
Missing no value 11 3,8
Total 287 100,0
Contributed activities in the course – Hand-on activity
Contributed activities in the course - hand-on activity
Frequency Percent Valid Percent
Cumulative
Percent
Valid not at all 8 2,8 2,9 2,9
to a small extent 9 3,1 3,3 6,2
so some extent 33 11,5 12,0 18,1
to a moderate extent 108 37,6 39,1 57,2
to a great extent 118 41,1 42,8 100,0
Total 276 96,2 100,0
Missing no value 11 3,8
Total 287 100,0
Contributed activities in the course – Communication
Contributed activities in the course - communication
Frequency Percent Valid Percent
Cumulative
Percent
Valid not at all 8 2,8 2,9 2,9
to a small extent 12 4,2 4,3 7,2
so some extent 55 19,2 19,9 27,2
to a moderate extent 105 36,6 38,0 65,2
to a great extent 96 33,4 34,8 100,0
Total 276 96,2 100,0
Missing no value 11 3,8
Total 287 100,0
Perceived practiced skills in the course – General
Descriptive Statistics
N Mean
Perceived practiced skills in the course
- critikal thinking 276 3,909
Perceived practiced skills in the course
- information literacy 275 4,058
Perceived practiced skills in the course
- analytical skills 275 3,927
Perceived practiced skills in the course
- communication skills 276 4,069
Perceived practiced skills in the course
- digital skills 276 4,098
Perceived practiced skills in the course
- metacognitive and reflection skills 276 3,725
Perceived practiced skills in the course
- other research skills 273 3,407
Valid N (listwise) 272
Perceived practiced skills in the course – Critical thinking
Perceived practiced skills in the course - critikal thinking
Frequency Percent Valid Percent
Cumulative
Percent
Valid not at all 7 2,4 2,5 2,5
to a small extent 7 2,4 2,5 5,1
so some extent 54 18,8 19,6 24,6
to a moderate extent 144 50,2 52,2 76,8
to a great extent 64 22,3 23,2 100,0
Total 276 96,2 100,0
Missing no value 11 3,8
Total
287 100,0
Perceived practiced skills in the course – Information literacy
Perceived practiced skills in the course - information literacy
Frequency Percent Valid Percent
Cumulative
Percent
Valid not at all 3 1,0 1,1 1,1
to a small extent 14 4,9 5,1 6,2
so some extent 49 17,1 17,8 24,0
to a moderate extent 107 37,3 38,9 62,9
to a great extent 102 35,5 37,1 100,0
Total 275 95,8 100,0
Missing no value 12 4,2
Total 287 100,0
Pereceived practiced skills in the course – Analytical skills
Perceived practiced skills in the course - analytical skills
Frequency Percent Valid Percent
Cumulative
Percent
Valid not at all 4 1,4 1,5 1,5
to a small extent 12 4,2 4,4 5,8
so some extent 61 21,3 22,2 28,0
to a moderate extent 121 42,2 44,0 72,0
to a great extent 77 26,8 28,0 100,0
Total 275 95,8 100,0
Missing no value 12 4,2
Total 287 100,0
Perceived practiced skills in the course – Communication skills
Perceived practiced skills in the course - communication skills
Frequency Percent Valid Percent
Cumulative
Percent
Valid not at all 3 1,0 1,1 1,1
to a small extent 11 3,8 4,0 5,1
so some extent 54 18,8 19,6 24,6
to a moderate extent 104 36,2 37,7 62,3
to a great extent 104 36,2 37,7 100,0
Total 276 96,2 100,0
Missing no value 11 3,8
Total 287 100,0
Perceived practiced skills in the course – Digital skills
Perceived practiced skills in the course - digital skills
Frequency Percent Valid Percent
Cumulative
Percent
Valid not at all 11 3,8 4,0 4,0
to a small extent 18 6,3 6,5 10,5
so some extent 36 12,5 13,0 23,6
to a moderate extent 79 27,5 28,6 52,2
to a great extent 132 46,0 47,8 100,0
Total 276 96,2 100,0
Missing no value 11 3,8
Total 287 100,0
Perceived practiced skills in the course – Metacognitive skills
Perceived practiced skills in the course - metacognitive and reflection skills
Frequency Percent Valid Percent
Cumulative
Percent
Valid not at all 3 1,0 1,1 1,1
to a small extent 19 6,6 6,9 8,0
so some extent 88 30,7 31,9 39,9
to a moderate extent 107 37,3 38,8 78,6
to a great extent 59 20,6 21,4 100,0
Total 276 96,2 100,0
Missing no value 11 3,8
Total 287 100,0
Perceivedpracticed skills in the course – Other research skills
Perceived practiced skills in the course - other research skills
Frequency Percent Valid Percent Cumulative
Percent
Valid not at all 16 5,6 5,9 5,9
to a small extent 27 9,4 9,9 15,8
so some extent 103 35,9 37,7 53,5
to a moderate extent 84 29,3 30,8 84,2
to a great extent 43 15,0 15,8 100,0
Total 273 95,1 100,0
Missing no value 14 4,9
Total 287 100,0
APPENDIX V – Testin the project assumption
Correlation between perceived practiced skills and contributed activities in the course
Contributed activities in the course
questioning
planning
the
method
review
and
analyze
data
hand-on
activity communication
review
data A
Analyze
and
interpret
data A
Per
ceiv
ed p
ract
iced
sk
ills
in
the
cou
rse
critikal thinking ** **
** **
**
information
literacy
** **
**
analytical skills ** **
** **
** **
**
communication
skills
** **
* **
**
digital skills *
** **
metacognitive
and reflection
skills
**
** **
* **
other research
skills
** **
** *
**
**. Correlation is significant at the 0.01 level (2-tailed).
*. Correlation is significant at the 0.05 level (2-tailed). A This item was only queried in the 1st module in Greece, thus a small number of cases. Result is not perfectly interpretable and
comparable with the other items.
Kendals tau b
Contributed
activities in the
course -
questioning
Contributed
activities in the
course -
planning the
method
Contributed
activities in the
course - review
and analyze
data
Contributed
activities in the
course - hand-
on activity
Contributed
activities in the
course -
communication
Contributed
activities in the
course - review
data
Contributed
activities in the
course -
Analyze and
interpret data
Believed practiced skills
in the course - critikal
thinking
Correlation
Coefficient ,308
** ,252
** ,288
** ,354
** ,316
** ,000 ,000
Sig. (2-tailed) ,000 ,000 ,000 ,000 ,000 1,000 1,000
N 276 276 271 271 276 5 5
Believed practiced skills
in the course -
information literacy
Correlation
Coefficient ,143
** ,036 ,081 ,334
** ,212
** -,250 -,408
Sig. (2-tailed) ,006 ,482 ,122 ,000 ,000 ,617 ,414
N 275 275 270 270 275 5 5
Believed practiced skills
in the course - analytical
skills
Correlation
Coefficient ,168
** ,235
** ,318
** ,221
** ,402
** 1,000
** 1,000
**
Sig. (2-tailed) ,001 ,000 ,000 ,000 ,000 . .
N 275 275 271 271 275 4 4
Believed practiced skills
in the course -
communication skills
Correlation
Coefficient ,184
** ,150
** ,127
* ,325
** ,347
** -,408 ,167
Sig. (2-tailed) ,000 ,004 ,015 ,000 ,000 ,414 ,739
N 276 276 271 271 276 5 5
Believed practiced skills
in the course - digital
skills
Correlation
Coefficient ,103
* -,009 -,070 ,356
** ,150
** -,408 -,667
Sig. (2-tailed) ,049 ,855 ,177 ,000 ,004 ,414 ,182
N 276 276 271 271 276 5 5
Believed practiced skills
in the course -
metacognitive and
reflection skills
Correlation
Coefficient ,164
** ,225
** ,322
** ,133
* ,321
** ,408 ,667
Sig. (2-tailed) ,002 ,000 ,000 ,012 ,000 ,414 ,182
N 276 276 271 271 276 5 5
Correlation – Critical thinking
Correlation – Information literacy
Model Summary
Model R R Square
Adjusted R
Square
Std. Error of the
Estimate
1 ,579a ,335 ,322 ,7169
a. Predictors: (Constant), Contributed activities in the course - communication,
Contributed activities in the course - questioning, Contributed activities in the
course - review and analyze data, Contributed activities in the course -
planning the method, Contributed activities in the course - hand-on activity
Correlation – Analytical skills
Correlation – Communication skills
Correlation – Digital skills
Correlation – Metacognitive and reflection skills
Correlation – Other research skills
Regression Analysis between perceived practiced skills and contributed activities in the course
APPENDIX VI – Evaluation of the course
Thematic of the module – General
Relevance to professional learning needs - thematic of the module
Frequency Percent Valid Percent
Cumulative
Percent
Valid not at all 1 ,3 ,4 ,4
to a small extent 25 8,7 8,9 9,3
so some extent 43 15,0 15,3 24,6
to a moderate extent 60 20,9 21,4 45,9
to a great extent 152 53,0 54,1 100,0
Total 281 97,9 100,0
Missing no value 6 2,1
Total 287 100,0
Thematic of the module – Countries comparison
Thematic of the module – Greece
Relevance to professional learning needs - thematic of the modulea
Frequency Percent Valid Percent
Cumulative
Percent
Valid so some extent 1 2,3 2,3 2,3
to a moderate
extent 19 43,2 43,2 45,5
to a great extent 24 54,5 54,5 100,0
Total 44 100,0 100,0
a. Country = Greece
Thematic of the module – Spain
Relevance to professional learning needs - thematic of the modulea
Frequency Percent Valid Percent
Cumulative
Percent
Valid not at all 1 1,7 1,7 1,7
to a small extent 23 38,3 38,3 40,0
so some extent 35 58,3 58,3 98,3
to a moderate
extent 1 1,7 1,7 100,0
Total 60 100,0 100,0
a. Country = Spain
Thematic of the module – Bulgaria
Relevance to professional learning needs - thematic of the modulea
Frequency Percent Valid Percent
Cumulative
Percent
Valid to a small extent 1 ,8 ,8 ,8
so some extent 4 3,1 3,2 4,0
to a moderate extent 17 13,3 13,5 17,5
to a great extent 104 81,3 82,5 100,0
Total 126 98,4 100,0
Missing no value 2 1,6
Total 128 100,0
a. Country = Bulgaria
Thematic of the module – Netherlands
Relevance to professional learning needs - thematic of the modulea
Frequency Percent Valid Percent
Cumulative
Percent
Valid to a small extent 1 1,8 2,0 2,0
so some extent 3 5,5 5,9 7,8
to a moderate extent 23 41,8 45,1 52,9
to a great extent 24 43,6 47,1 100,0
Total 51 92,7 100,0
Missing no value 4 7,3
Total 55 100,0
a. Country = Netherlands
Relevance of learning through IBL – General
Relevance to professional learning needs - learning through inquiry methodology
Frequency Percent Valid Percent
Cumulative
Percent
Valid not at all 25 8,7 9,2 9,2
to a small extent 32 11,1 11,7 20,9
so some extent 97 33,8 35,5 56,4
to a moderate extent 49 17,1 17,9 74,4
to a great extent 70 24,4 25,6 100,0
Total 273 95,1 100,0
Missing no value 14 4,9
Total 287 100,0
Relevance of learning through IBL – Countries comparison
Relevance of learning through IBL – Greece
Relevance to professional learning needs - learning through inquiry methodologya
Frequency Percent Valid Percent
Cumulative
Percent
Valid so some extent 12 27,3 27,3 27,3
to a moderate extent 15 34,1 34,1 61,4
to a great extent 17 38,6 38,6 100,0
Total 44 100,0 100,0
a. Country = Greece
Relevance of learning through IBL – Spain
Relevance to professional learning needs - learning through inquiry methodologya
Frequency Percent Valid Percent
Cumulative
Percent
Valid not at all 19 31,7 31,7 31,7
to a small extent 20 33,3 33,3 65,0
so some extent 21 35,0 35,0 100,0
Total 60 100,0 100,0
a. Country = Spain
Relevance of learning through IBL – Bulgaria
Relevance to professional learning needs - learning through inquiry methodologya
Frequency Percent Valid Percent
Cumulative
Percent
Valid not at all 6 4,7 4,8 4,8
to a small extent 7 5,5 5,6 10,4
so some extent 60 46,9 48,0 58,4
to a moderate extent 14 10,9 11,2 69,6
to a great extent 38 29,7 30,4 100,0
Total 125 97,7 100,0
Missing no value 3 2,3
Total 128 100,0
a. Country = Bulgaria
Relevance of learning through IBL – Netherlands
Relevance to professional learning needs - learning through inquiry methodologya
Frequency Percent Valid Percent
Cumulative
Percent
Valid to a small extent 5 9,1 11,4 11,4
so some extent 4 7,3 9,1 20,5
to a moderate extent 20 36,4 45,5 65,9
to a great extent 15 27,3 34,1 100,0
Total 44 80,0 100,0
Missing no value 11 20,0
Total 55 100,0
a. Country = Netherlands
Relevance of objectives to participants‘ professional needs - General
Relevance to professional learning needs - expected learning outcomes as in the module
Frequency Percent Valid Percent
Cumulative
Percent
Valid to a small extent 18 6,3 6,6 6,6
so some extent 46 16,0 16,8 23,4
to a moderate extent 73 25,4 26,6 50,0
to a great extent 137 47,7 50,0 100,0
Total 274 95,5 100,0
Missing no value 13 4,5
Total 287 100,0
Relevance of objectives to participants‘ professional needs – Countries comparison
Relevance of objectives to participants‘ professional needs - Greece
Relevance to professional learning needs - expected learning outcomes as in the modulea
Frequency Percent Valid Percent
Cumulative
Percent
Valid so some extent 1 2,3 2,3 2,3
to a moderate extent 18 40,9 40,9 43,2
to a great extent 25 56,8 56,8 100,0
Total 44 100,0 100,0
a. Country = Greece
Relevance of objectives to participants‘ professional needs - Spain
Relevance to professional learning needs - expected learning outcomes as in the modulea
Frequency Percent Valid Percent
Cumulative
Percent
Valid to a small extent 18 30,0 30,0 30,0
so some extent 39 65,0 65,0 95,0
to a moderate extent 3 5,0 5,0 100,0
Total 60 100,0 100,0
a. Country = Spain
Relevance of objectives to participants‘ professional needs - Bulgaria
Relevance to professional learning needs - expected learning outcomes as in the modulea
Frequency Percent Valid Percent
Cumulative
Percent
Valid so some extent 3 2,3 2,4 2,4
to a moderate extent 27 21,1 21,4 23,8
to a great extent 96 75,0 76,2 100,0
Total 126 98,4 100,0
Missing no value 2 1,6
Total 128 100,0
a. Country = Bulgaria
Relevance of objectives to participants‘ professional needs - Netherlands
Relevance to professional learning needs - expected learning outcomes as in the modulea
Frequency Percent Valid Percent
Cumulative
Percent
Valid so some extent 3 5,5 6,8 6,8
to a moderate extent 25 45,5 56,8 63,6
to a great extent 16 29,1 36,4 100,0
Total 44 80,0 100,0
Missing no value 11 20,0
Total 55 100,0
a. Country = Netherlands
Most useful elements of the course – General / Countries comparison
Descriptive Statistics
N Mean
Usefulness of course
elements - learning through
inquiry 276 3,935
Usefulness of course
elements - self-regulated
learning 276 3,924
Usefulness of course
elements - learning with
peers 276 4,065
Usefulness of course
elements - Hand-on learning 270 4,211
Usefulness of course
elements - reflextion &
metacognition 276 3,826
Valid N (listwise) 270
Most useful elements of the course – Greece
Most useful elements of the course – Spain
Most useful elements of the course – Bulgaria
Most useful elements of the course – Netherlands
Most useful elements of the course – Learning through inquiry - General
Usefulness of course elements - learning through inquiry
Frequency Percent Valid Percent
Cumulative
Percent
Valid not at all 4 1,4 1,4 1,4
to a small extent 9 3,1 3,3 4,7
so some extent 59 20,6 21,4 26,1
to a moderate extent 133 46,3 48,2 74,3
to a great extent 71 24,7 25,7 100,0
Total 276 96,2 100,0
Missing no value 11 3,8
Total 287 100,0
Most useful elements of the course – Learning through inquiry – Countries comparison
Most useful elements of the course – Learning through inquiry – Greece
Usefulness of course elements - learning through inquirya
Frequency Percent Valid Percent
Cumulative
Percent
Valid to a small extent 4 9,1 9,3 9,3
so some extent 4 9,1 9,3 18,6
to a moderate extent 19 43,2 44,2 62,8
to a great extent 16 36,4 37,2 100,0
Total 43 97,7 100,0
Missing no value 1 2,3
Total 44 100,0
a. Country = Greece
Most useful elements of the course – Learning through inquiry - Spain
Usefulness of course elements - learning through inquirya
Frequency Percent Valid Percent
Cumulative
Percent
Valid not at all 1 1,7 1,9 1,9
to a small extent 1 1,7 1,9 3,8
so some extent 26 43,3 50,0 53,8
to a moderate extent 21 35,0 40,4 94,2
to a great extent 3 5,0 5,8 100,0
Total 52 86,7 100,0
Missing no value 8 13,3
Total 60 100,0
a. Country = Spain
Most useful elements of the course – Learning through inquiry - Bulgaria
Usefulness of course elements - learning through inquirya
Frequency Percent Valid Percent
Cumulative
Percent
Valid to a small extent 1 ,8 ,8 ,8
so some extent 10 7,8 7,8 8,6
to a moderate extent 73 57,0 57,0 65,6
to a great extent 44 34,4 34,4 100,0
Total 128 100,0 100,0
a. Country = Bulgaria
Most useful elements of the course – Learning through inquiry - Netherlands
Usefulness of course elements - learning through inquirya
Frequency Percent Valid Percent
Cumulative
Percent
Valid not at all 3 5,5 5,7 5,7
to a small extent 3 5,5 5,7 11,3
so some extent 19 34,5 35,8 47,2
to a moderate extent 20 36,4 37,7 84,9
to a great extent 8 14,5 15,1 100,0
Total 53 96,4 100,0
Missing no value 2 3,6
Total 55 100,0
a. Country = Netherlands
Most useful elements of the course – self regulated learning - General
Usefulness of course elements - self-regulated learning
Frequency Percent Valid Percent
Cumulative
Percent
Valid not at all 2 ,7 ,7 ,7
to a small extent 17 5,9 6,2 6,9
so some extent 67 23,3 24,3 31,2
to a moderate extent 104 36,2 37,7 68,8
to a great extent 86 30,0 31,2 100,0
Total 276 96,2 100,0
Missing no value 11 3,8
Total 287 100,0
Most useful elements of the course – self regulated learning – Countries comparison
Most useful elements of the course – self regulated learning - Greece
Usefulness of course elements - self-regulated learninga
Frequency Percent Valid Percent
Cumulative
Percent
Valid to a small extent 4 9,1 9,3 9,3
so some extent 11 25,0 25,6 34,9
to a moderate extent 16 36,4 37,2 72,1
to a great extent 12 27,3 27,9 100,0
Total 43 97,7 100,0
Missing no value 1 2,3
Total 44 100,0
a. Country = Greece
Most useful elements of the course – self regulated learning - Spain
Usefulness of course elements - self-regulated learninga
Frequency Percent Valid Percent
Cumulative
Percent
Valid so some extent 21 35,0 40,4 40,4
to a moderate extent 15 25,0 28,8 69,2
to a great extent 16 26,7 30,8 100,0
Total 52 86,7 100,0
Missing no value 8 13,3
Total 60 100,0
a. Country = Spain
Most useful elements of the course – self regulated learning - Bulgaria
Usefulness of course elements - self-regulated learninga
Frequency Percent Valid Percent
Cumulative
Percent
Valid to a small extent 9 7,0 7,0 7,0
so some extent 29 22,7 22,7 29,7
to a moderate extent 54 42,2 42,2 71,9
to a great extent 36 28,1 28,1 100,0
Total 128 100,0 100,0
a. Country = Bulgaria
Most useful elements of the course – self regulated learning - Netherlands
Usefulness of course elements - self-regulated learninga
Frequency Percent Valid Percent
Cumulative
Percent
Valid not at all 2 3,6 3,8 3,8
to a small extent 4 7,3 7,5 11,3
so some extent 6 10,9 11,3 22,6
to a moderate extent 19 34,5 35,8 58,5
to a great extent 22 40,0 41,5 100,0
Total 53 96,4 100,0
Missing no value 2 3,6
Total 55 100,0
a. Country = Netherlands
Most useful elements of the course – learning with peers – General
Usefulness of course elements - learning with peers
Frequency Percent Valid Percent
Cumulative
Percent
Valid not at all 3 1,0 1,1 1,1
to a small extent 12 4,2 4,3 5,4
so some extent 44 15,3 15,9 21,4
to a moderate extent 122 42,5 44,2 65,6
to a great extent 95 33,1 34,4 100,0
Total 276 96,2 100,0
Missing no value 11 3,8
Total 287 100,0
Most useful elements of the course – learning with peers – Countries comparison
Most useful elements of the course – learning with peers – Greece
Usefulness of course elements - learning with peersa
Frequency Percent Valid Percent
Cumulative
Percent
Valid to a small extent 3 6,8 7,0 7,0
so some extent 1 2,3 2,3 9,3
to a moderate extent 27 61,4 62,8 72,1
to a great extent 12 27,3 27,9 100,0
Total 43 97,7 100,0
Missing no value 1 2,3
Total 44 100,0
a. Country = Greece
Most useful elements of the course – learning with peers – Spain
Usefulness of course elements - learning with peersa
Frequency Percent Valid Percent
Cumulative
Percent
Valid so some extent 12 20,0 23,1 23,1
to a moderate extent 31 51,7 59,6 82,7
to a great extent 9 15,0 17,3 100,0
Total 52 86,7 100,0
Missing no value 8 13,3
Total 60 100,0
a. Country = Spain
Most useful elements of the course – learning with peers – Bulgaria
Usefulness of course elements - learning with peersa
Frequency Percent Valid Percent
Cumulative
Percent
Valid so some extent 20 15,6 15,6 15,6
to a moderate extent 49 38,3 38,3 53,9
to a great extent 59 46,1 46,1 100,0
Total 128 100,0 100,0
a. Country = Bulgaria
Most useful elements of the course – learning with peers - Netherlands
Usefulness of course elements - learning with peersa
Frequency Percent Valid Percent
Cumulative
Percent
Valid not at all 3 5,5 5,7 5,7
to a small extent 9 16,4 17,0 22,6
so some extent 11 20,0 20,8 43,4
to a moderate extent 15 27,3 28,3 71,7
to a great extent 15 27,3 28,3 100,0
Total 53 96,4 100,0
Missing no value 2 3,6
Total 55 100,0
a. Country = Netherlands
Most useful elements of the course – hand-on learning – General
Usefulness of course elements - Hand-on learning
Frequency Percent Valid Percent
Cumulative
Percent
Valid not at all 8 2,8 3,0 3,0
to a small extent 10 3,5 3,7 6,7
so some extent 36 12,5 13,3 20,0
to a moderate extent 79 27,5 29,3 49,3
to a great extent 137 47,7 50,7 100,0
Total 270 94,1 100,0
Missing no value 17 5,9
Total 287 100,0
Most useful elements of the course – hand-on learning – Countries comparison
Most useful elements of the course – hand-on learning – Greece
Usefulness of course elements - Hand-on learninga
Frequency Percent Valid Percent
Cumulative
Percent
Valid not at all 4 9,1 10,8 10,8
to a small extent 4 9,1 10,8 21,6
so some extent 5 11,4 13,5 35,1
to a moderate extent 8 18,2 21,6 56,8
to a great extent 16 36,4 43,2 100,0
Total 37 84,1 100,0
Missing no value 7 15,9
Total 44 100,0
a. Country = Greece
Most useful elements of the course – hand-on learning – Spain
Usefulness of course elements - Hand-on learninga
Frequency Percent Valid Percent
Cumulative
Percent
Valid not at all 1 1,7 1,9 1,9
to a small extent 1 1,7 1,9 3,8
so some extent 19 31,7 36,5 40,4
to a moderate extent 23 38,3 44,2 84,6
to a great extent 8 13,3 15,4 100,0
Total 52 86,7 100,0
Missing no value 8 13,3
Total 60 100,0
a. Country = Spain
Most useful elements of the course – hand-on learning – Bulgaria
Usefulness of course elements - Hand-on learninga
Frequency Percent Valid Percent
Cumulative
Percent
Valid so some extent 2 1,6 1,6 1,6
to a moderate extent 25 19,5 19,5 21,1
to a great extent 101 78,9 78,9 100,0
Total 128 100,0 100,0
a. Country = Bulgaria
Most useful elements of the course – hand-on learning - Netherlands
Usefulness of course elements - Hand-on learninga
Frequency Percent Valid Percent
Cumulative
Percent
Valid not at all 3 5,5 5,7 5,7
to a small extent 5 9,1 9,4 15,1
so some extent 10 18,2 18,9 34,0
to a moderate extent 23 41,8 43,4 77,4
to a great extent 12 21,8 22,6 100,0
Total 53 96,4 100,0
Missing no value 2 3,6
Total 55 100,0
a. Country = Netherlands
Most useful elements of the course – reflection and metacognition – General
Usefulness of course elements - reflextion & metacognition
Frequency Percent Valid Percent
Cumulative
Percent
Valid not at all 4 1,4 1,4 1,4
to a small extent 25 8,7 9,1 10,5
so some extent 63 22,0 22,8 33,3
to a moderate extent 107 37,3 38,8 72,1
to a great extent 77 26,8 27,9 100,0
Total 276 96,2 100,0
Missing no value 11 3,8
Total 287 100,0
Most useful elements of the course – reflection and metacognition – Countries comparison
Most useful elements of the course – reflection and metacognition – Greece
Usefulness of course elements - reflextion & metacognitiona
Frequency Percent Valid Percent
Cumulative
Percent
Valid to a small extent 4 9,1 9,3 9,3
to a moderate extent 17 38,6 39,5 48,8
to a great extent 22 50,0 51,2 100,0
Total 43 97,7 100,0
Missing no value 1 2,3
Total 44 100,0
a. Country = Greece
Most useful elements of the course – reflection and metacognition – Spain
Usefulness of course elements - reflextion & metacognitiona
Frequency Percent Valid Percent
Cumulative
Percent
Valid so some extent 19 31,7 36,5 36,5
to a moderate extent 25 41,7 48,1 84,6
to a great extent 8 13,3 15,4 100,0
Total 52 86,7 100,0
Missing no value 8 13,3
Total 60 100,0
a. Country = Spain
Most useful elements of the course – reflection and metacognition – Bulgaria
Usefulness of course elements - reflextion & metacognitiona
Frequency Percent Valid Percent
Cumulative
Percent
Valid not at all 2 1,6 1,6 1,6
to a small extent 16 12,5 12,5 14,1
so some extent 34 26,6 26,6 40,6
to a moderate extent 36 28,1 28,1 68,8
to a great extent 40 31,3 31,3 100,0
Total 128 100,0 100,0
a. Country = Bulgaria
Most useful elements of the course – reflection and metacognition - Netherlands
Usefulness of course elements - reflextion & metacognitiona


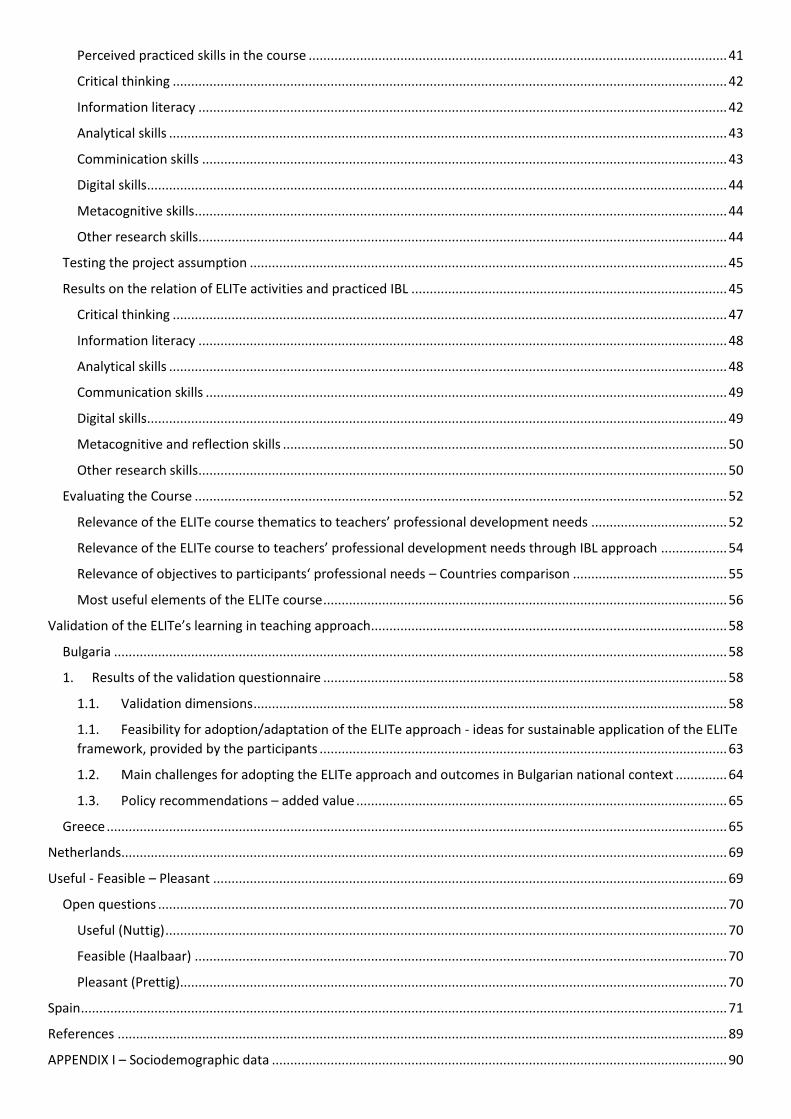


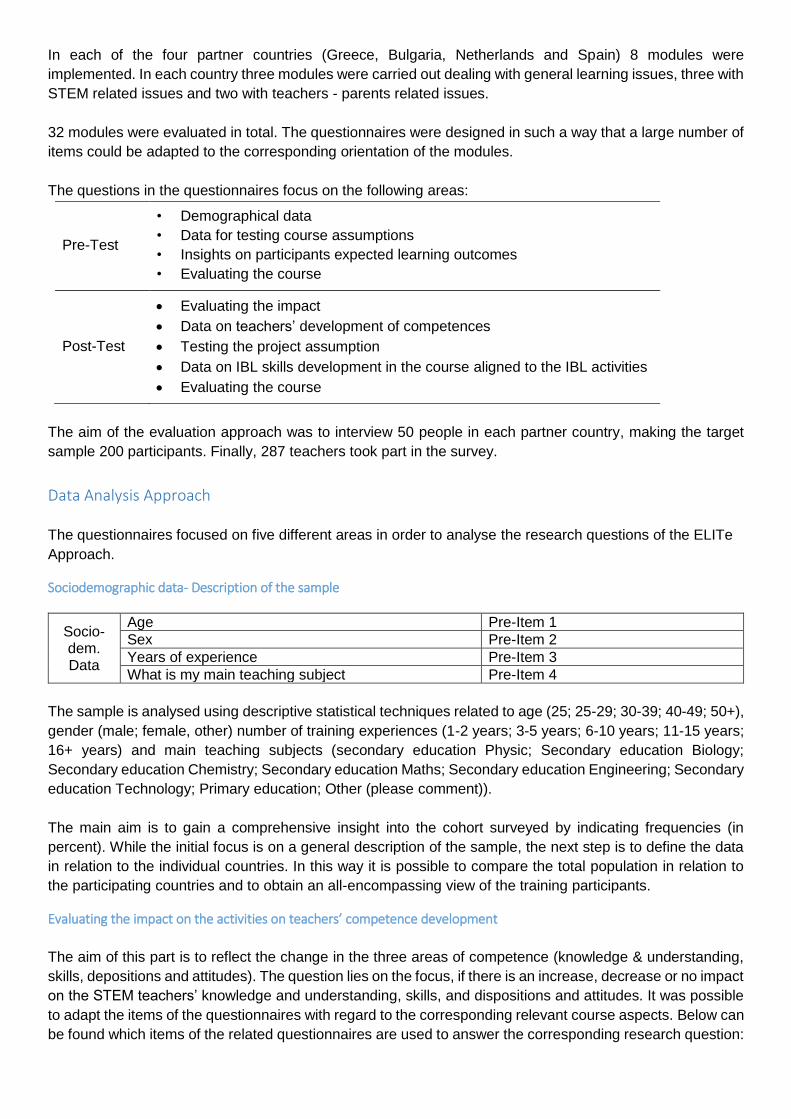

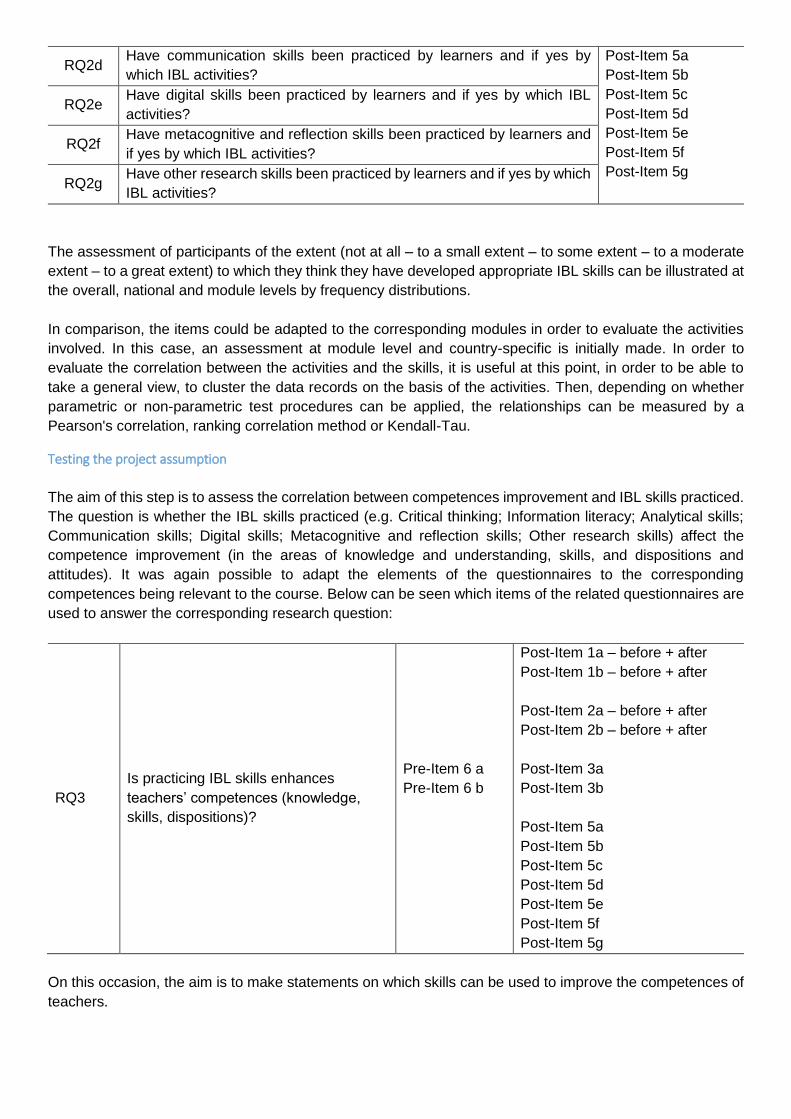


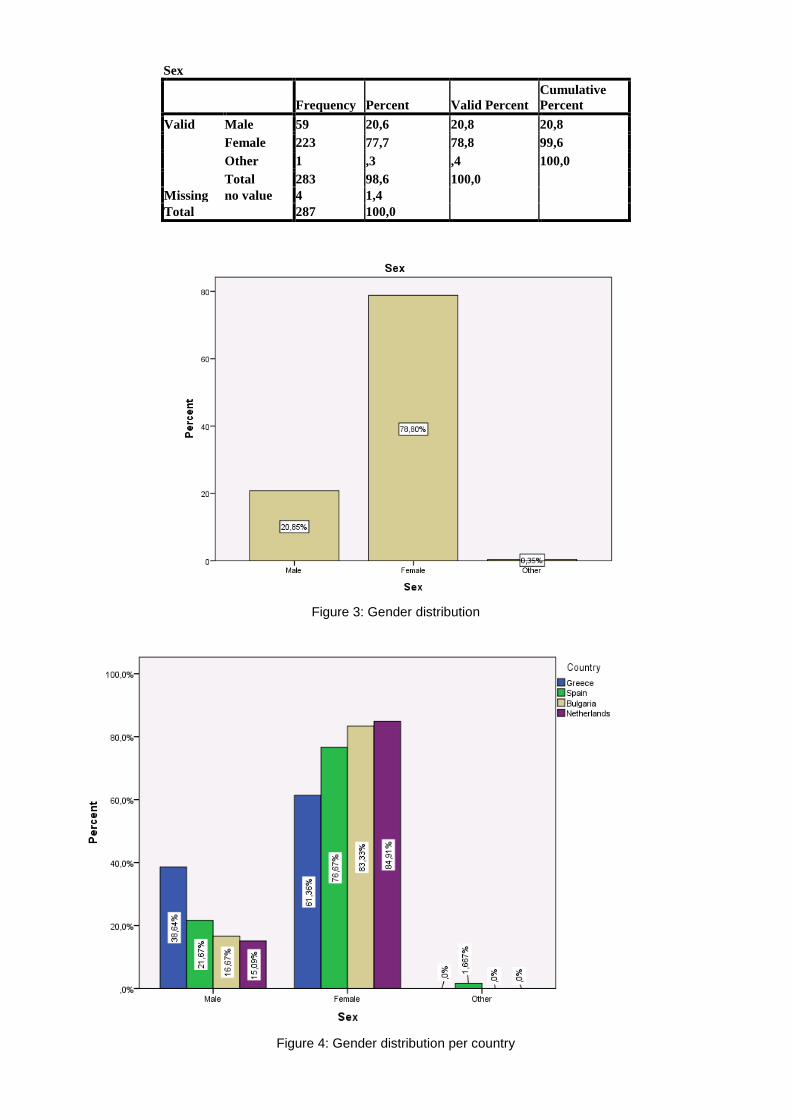
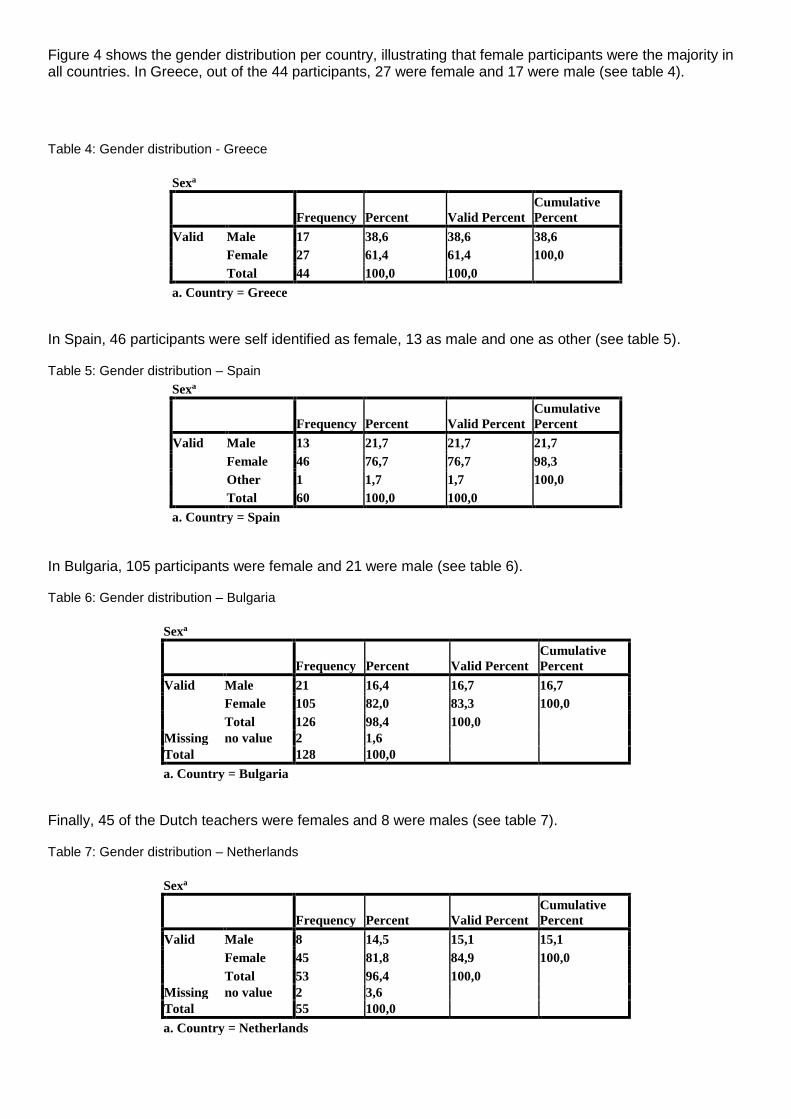


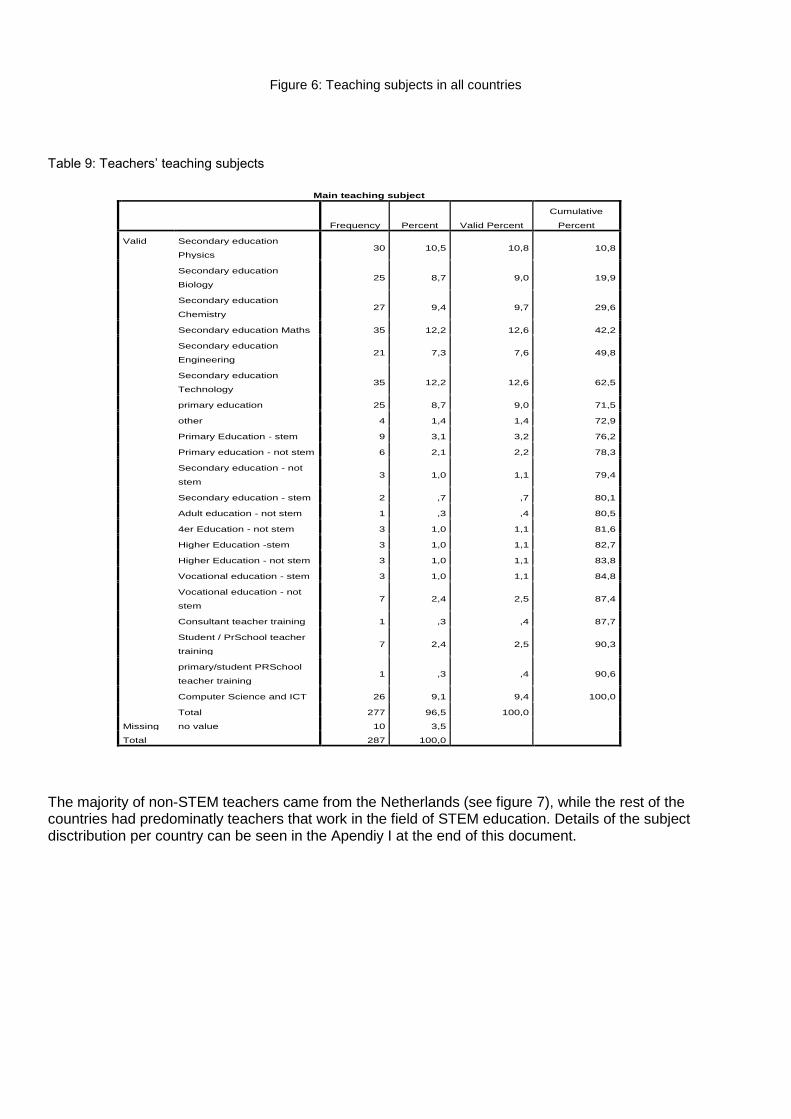
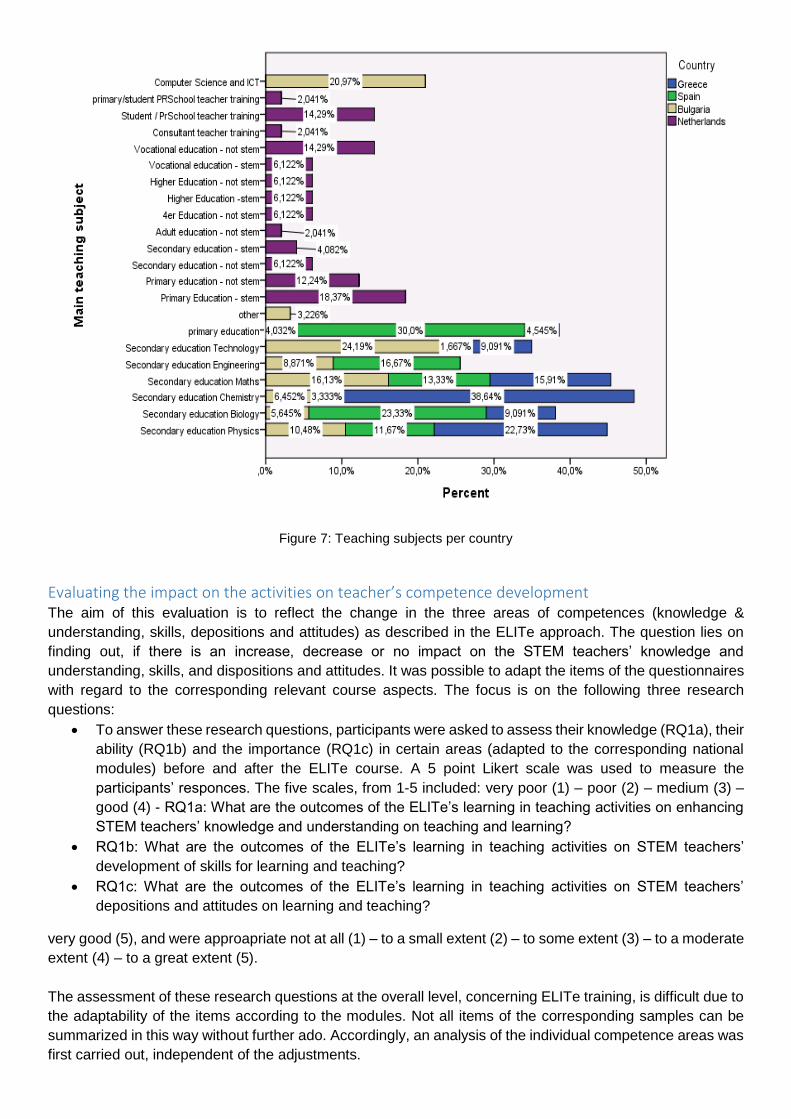
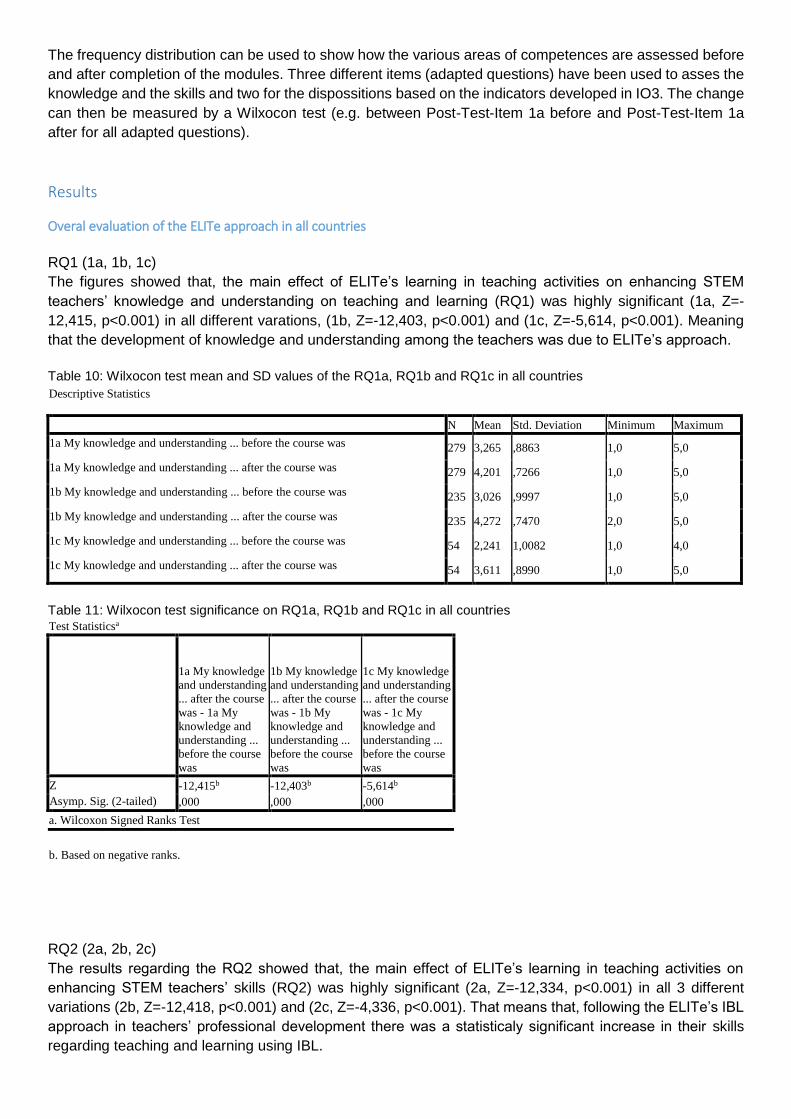
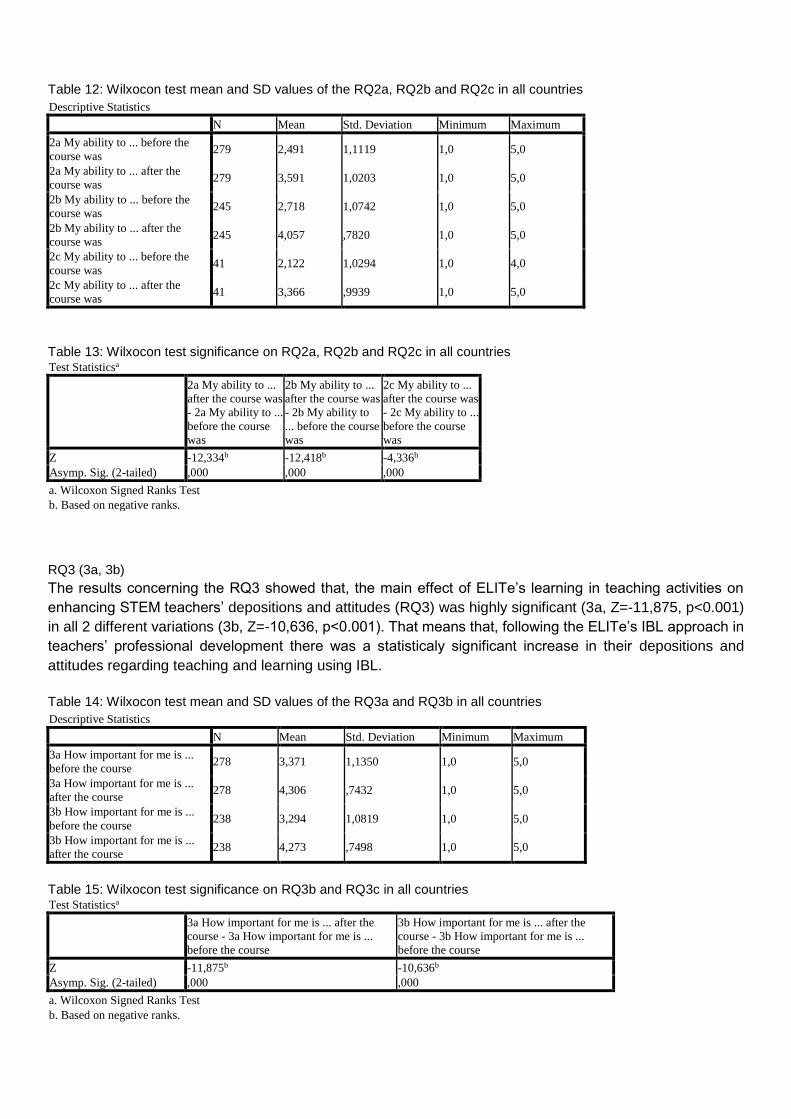

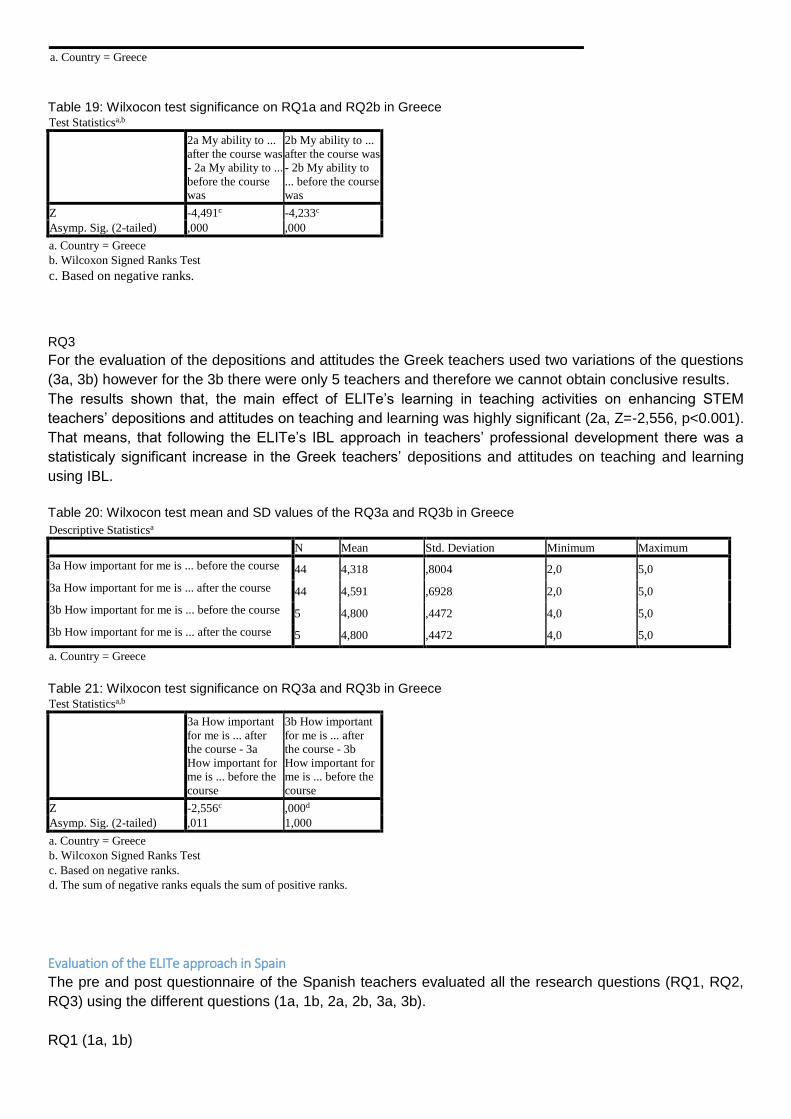


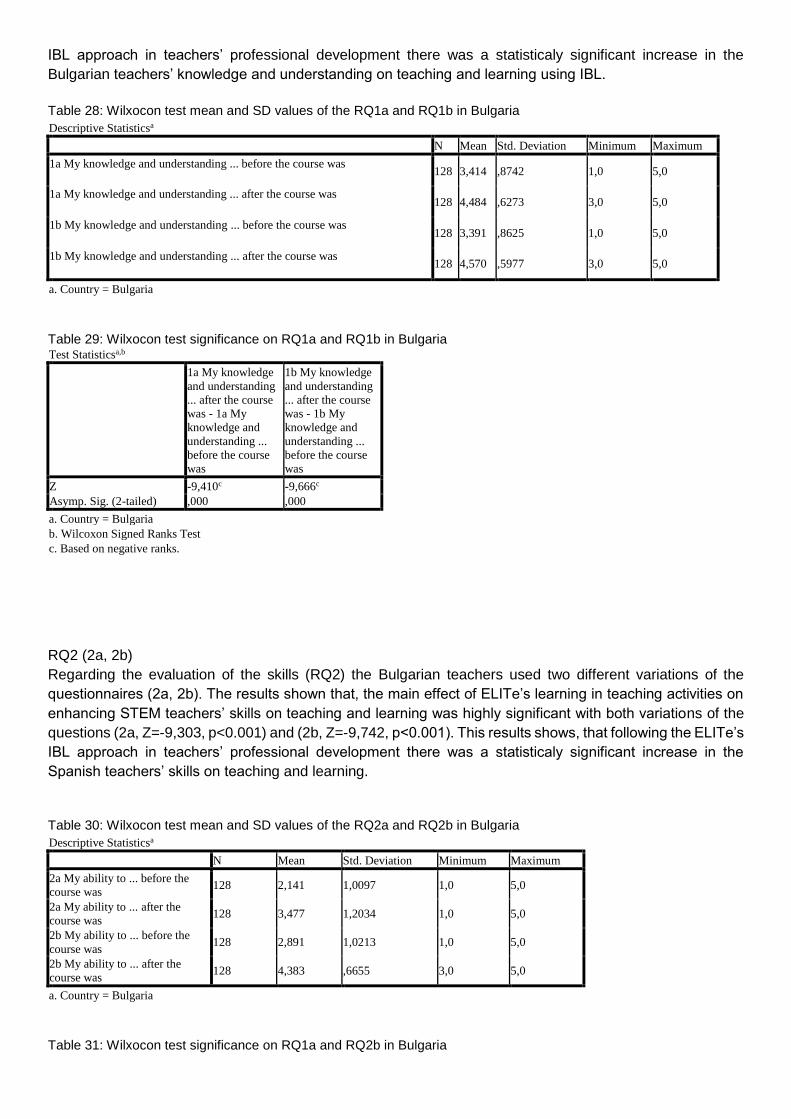


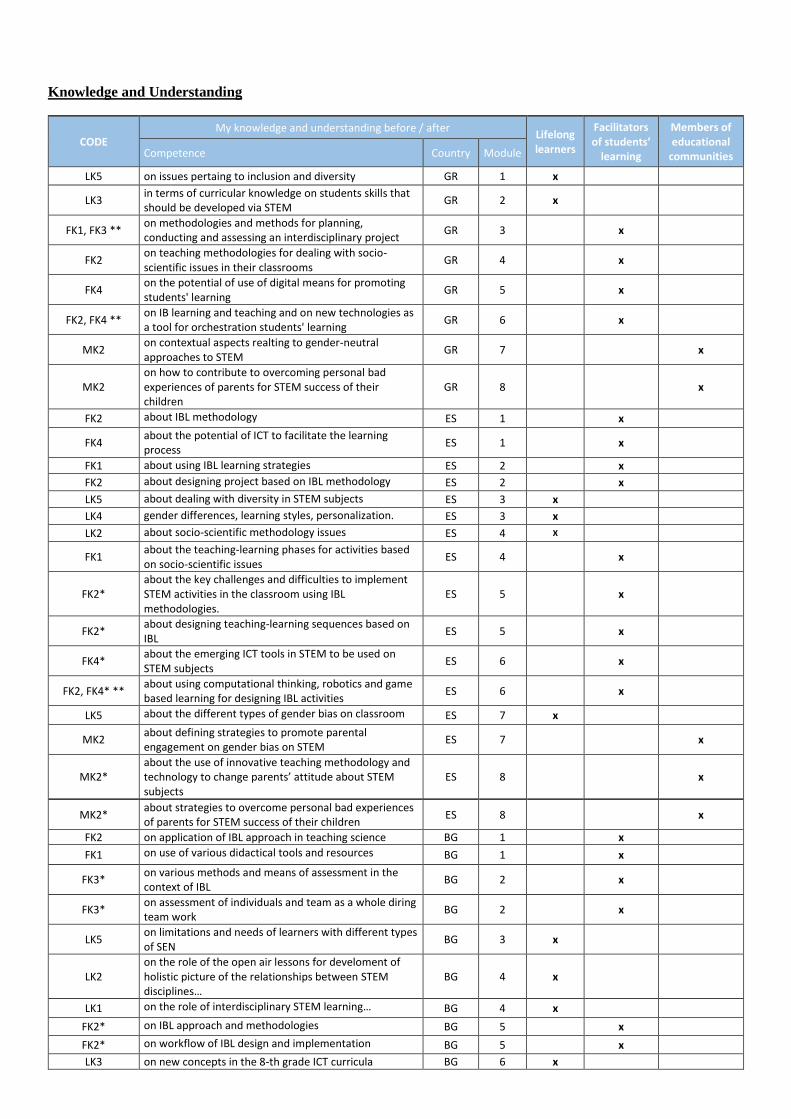

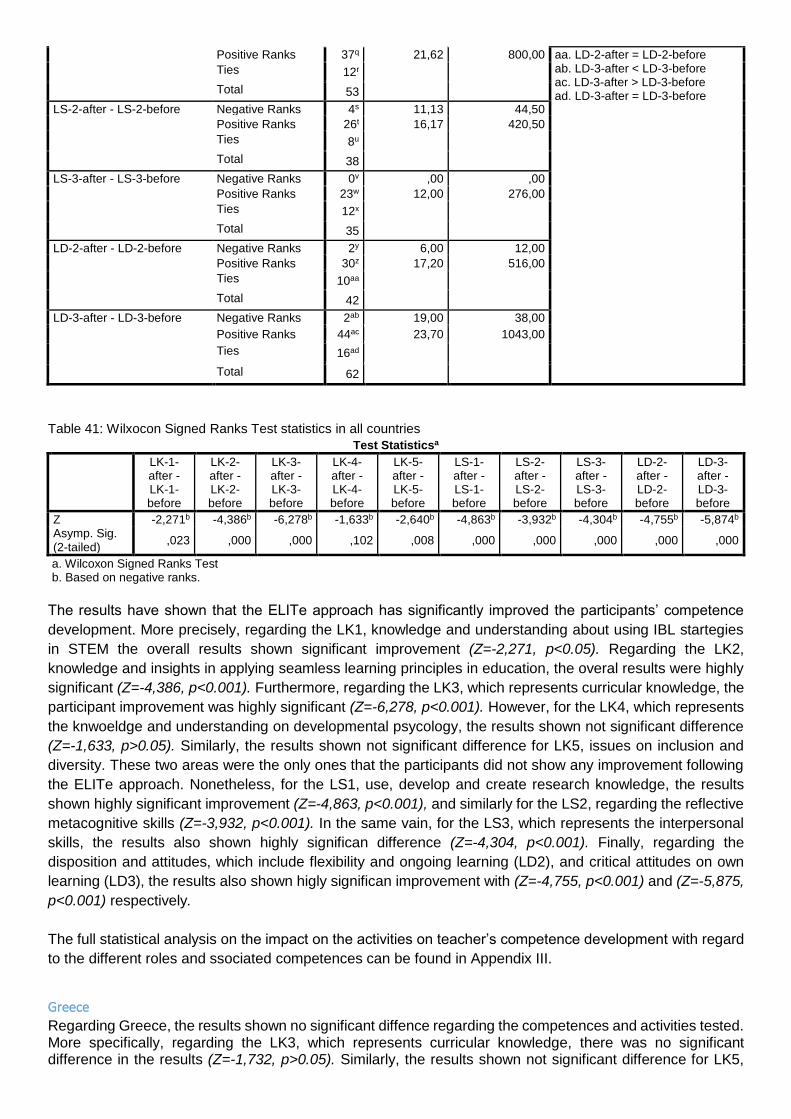
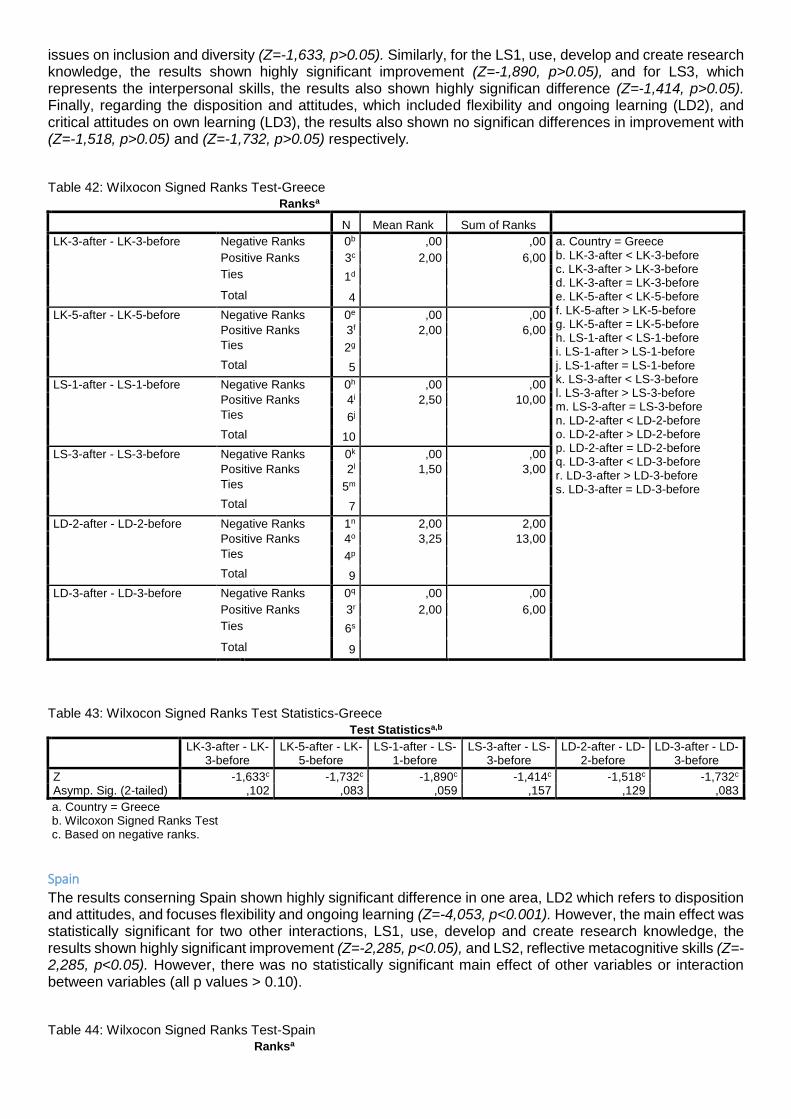


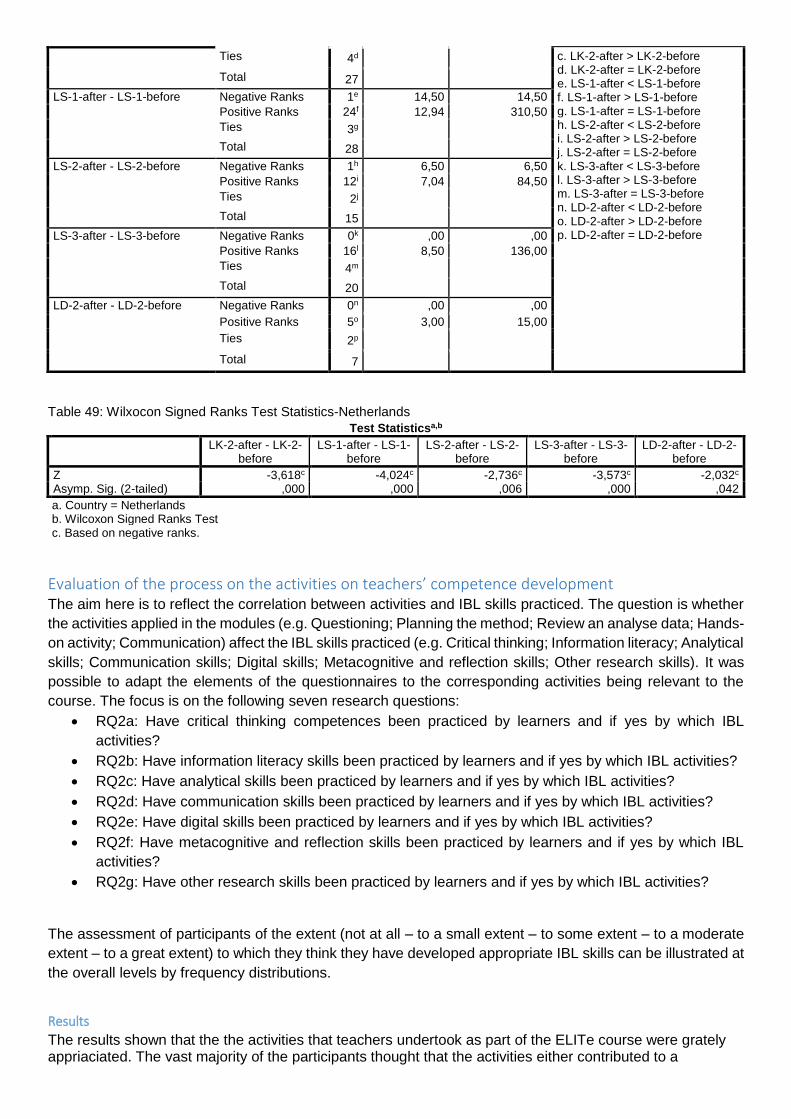


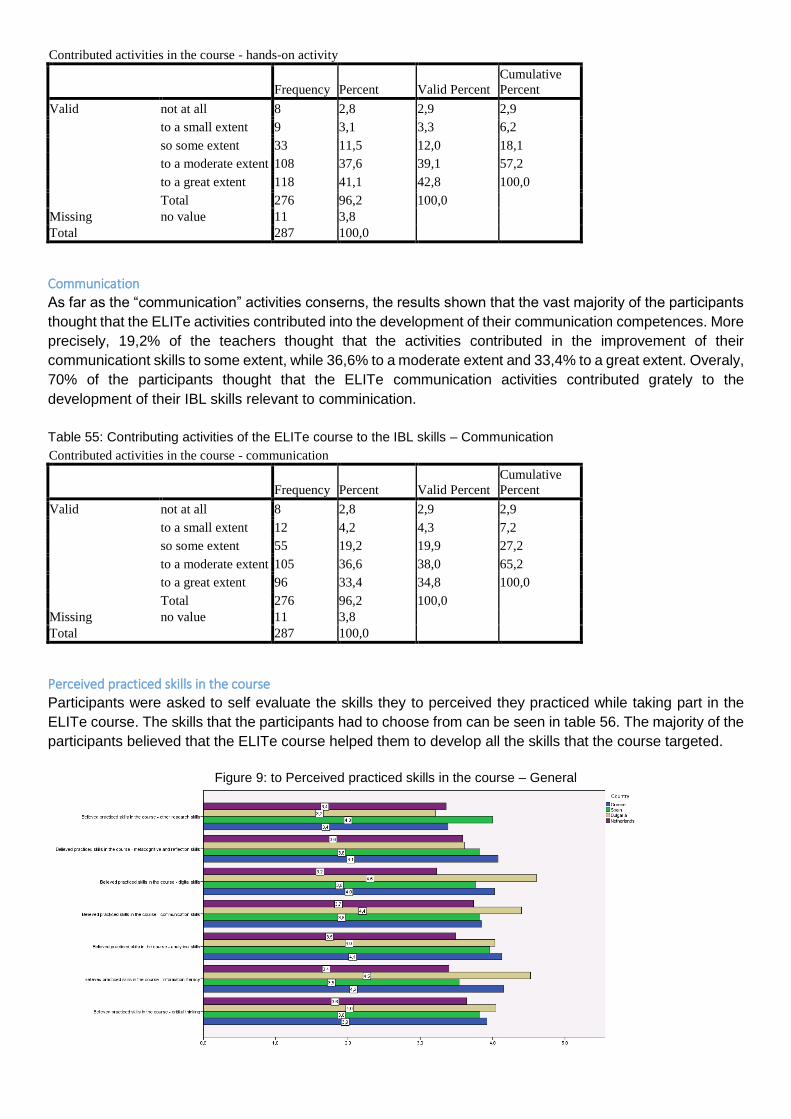


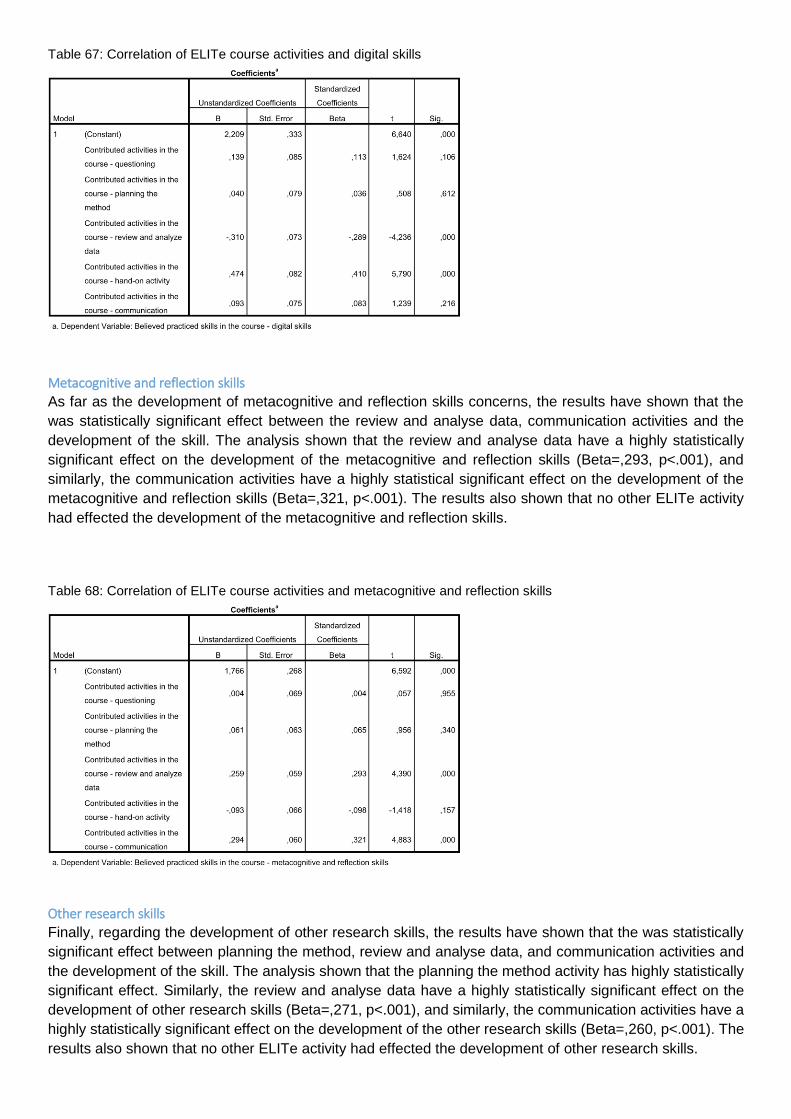


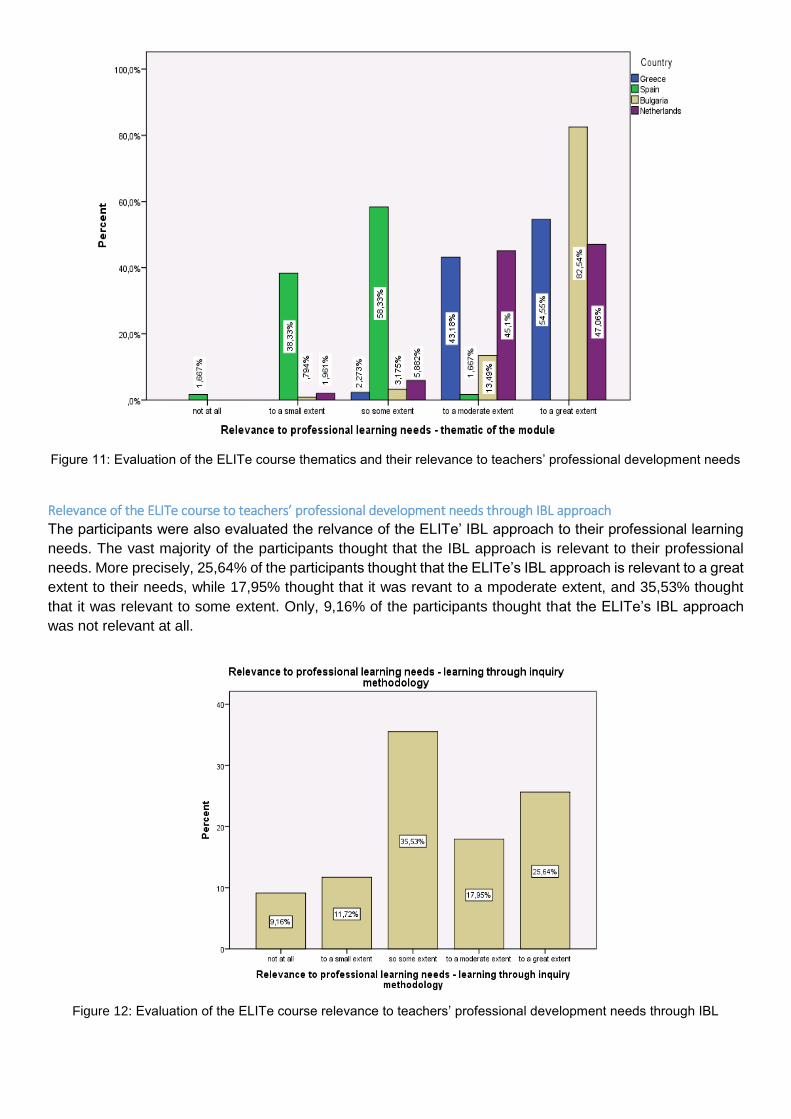

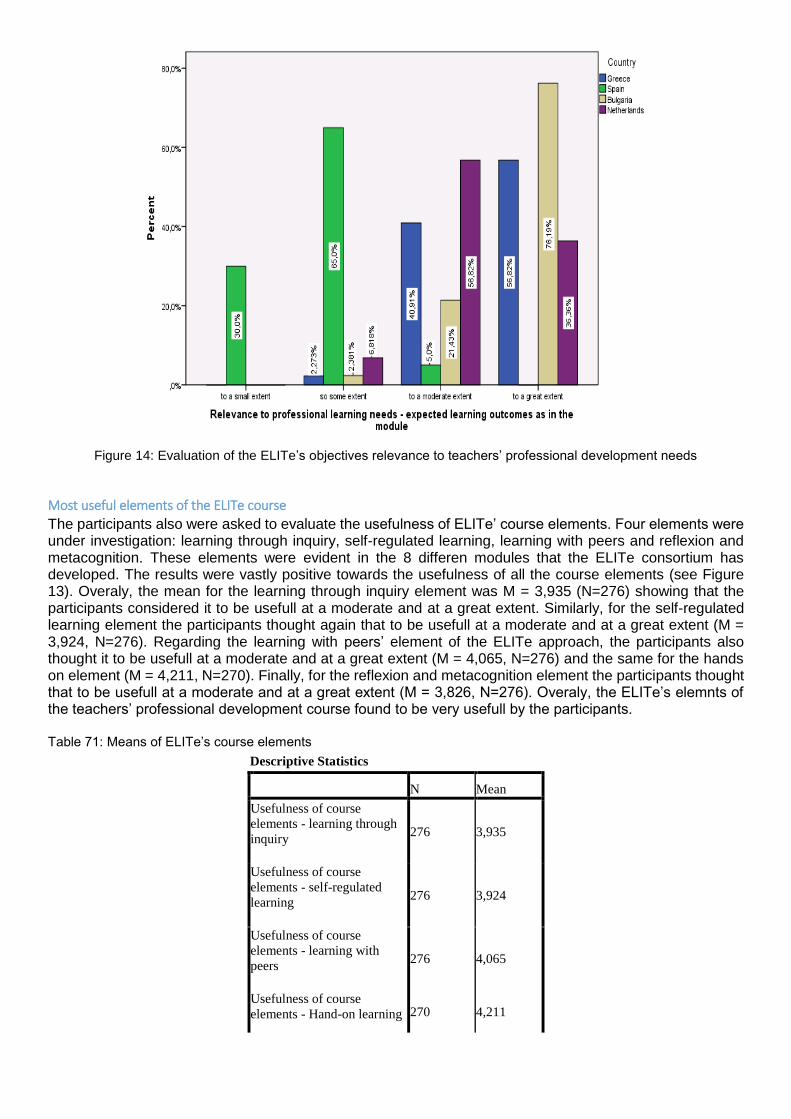


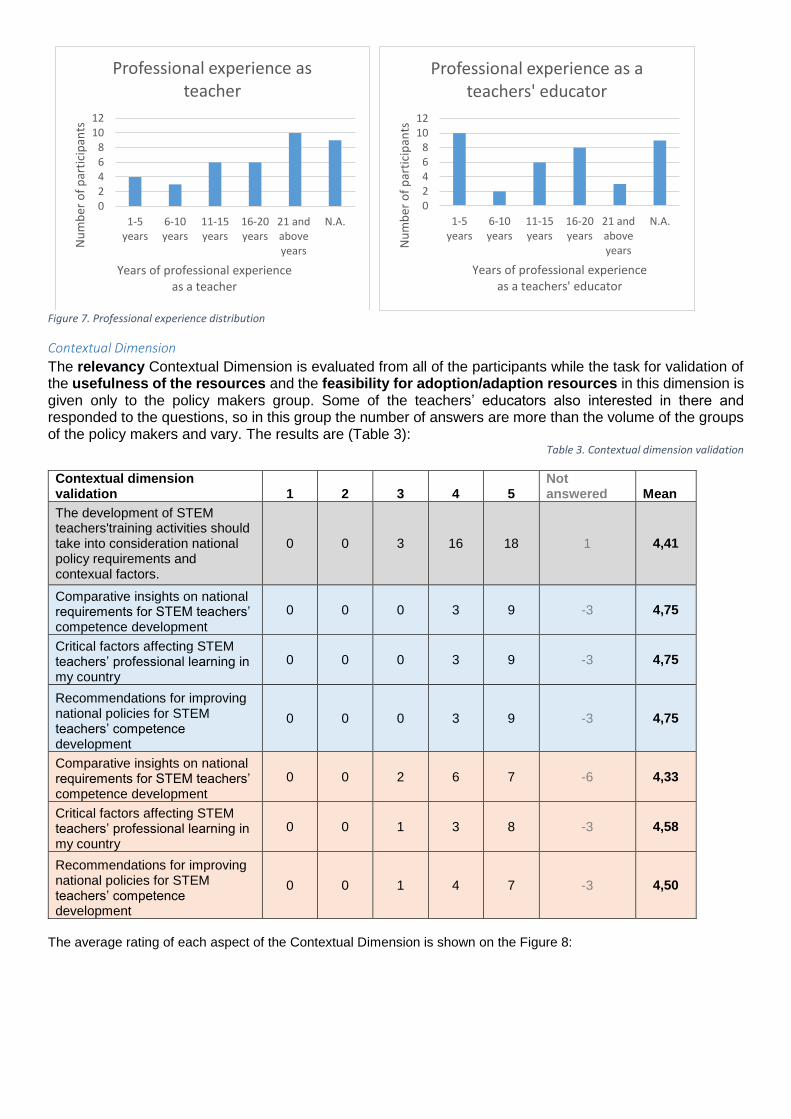


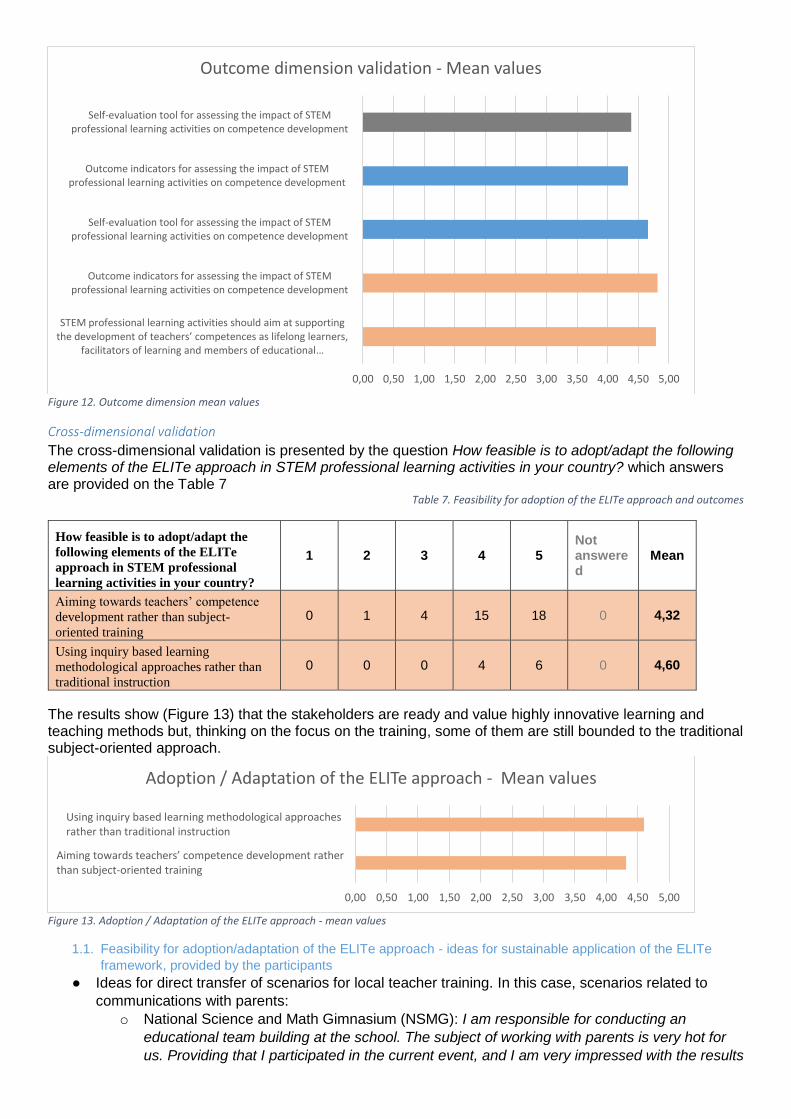


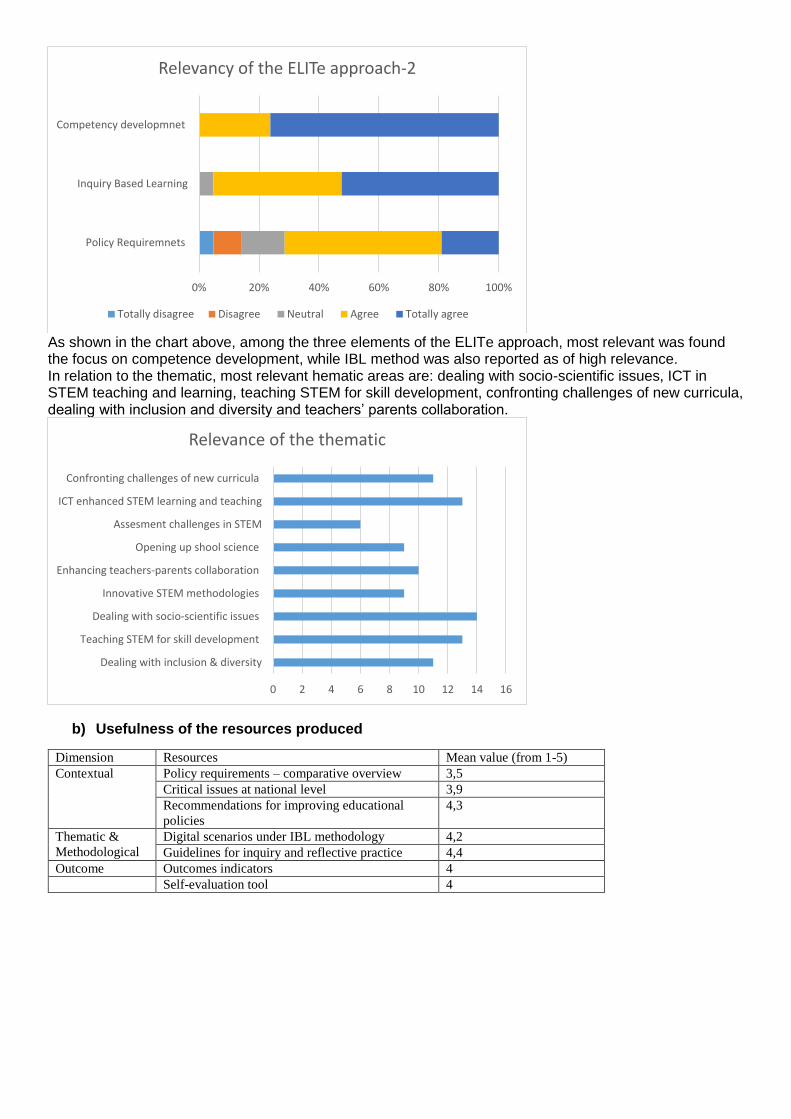


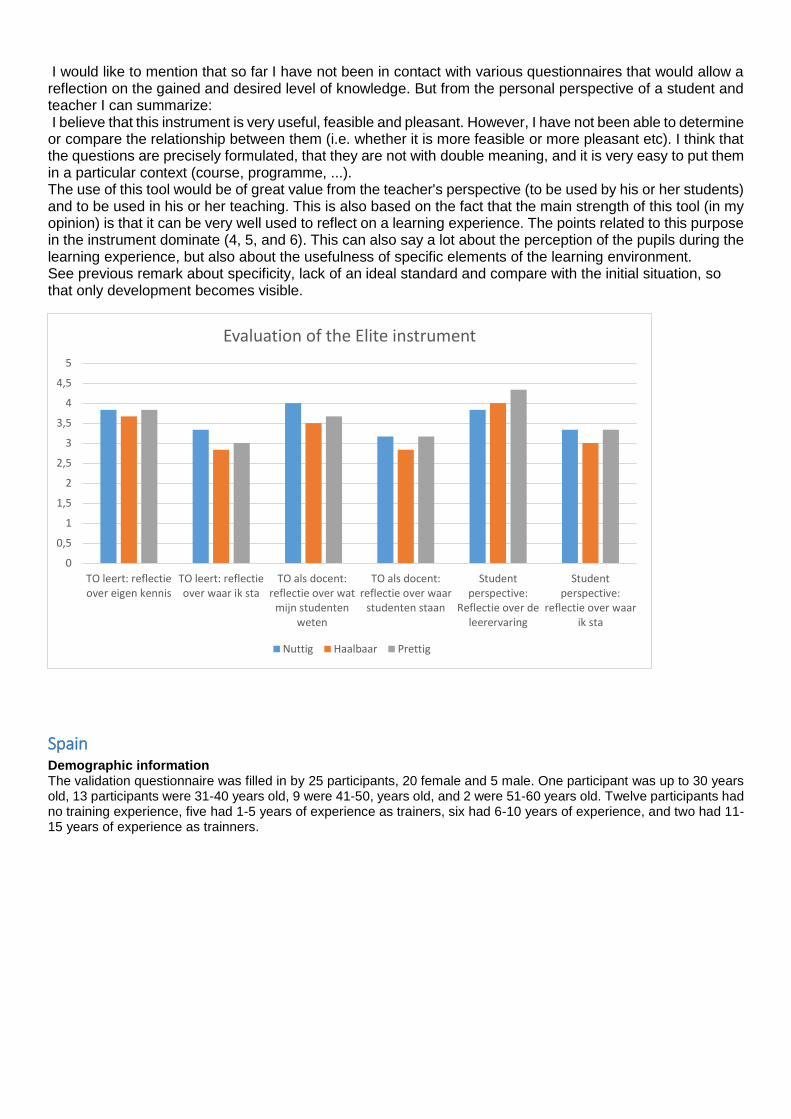


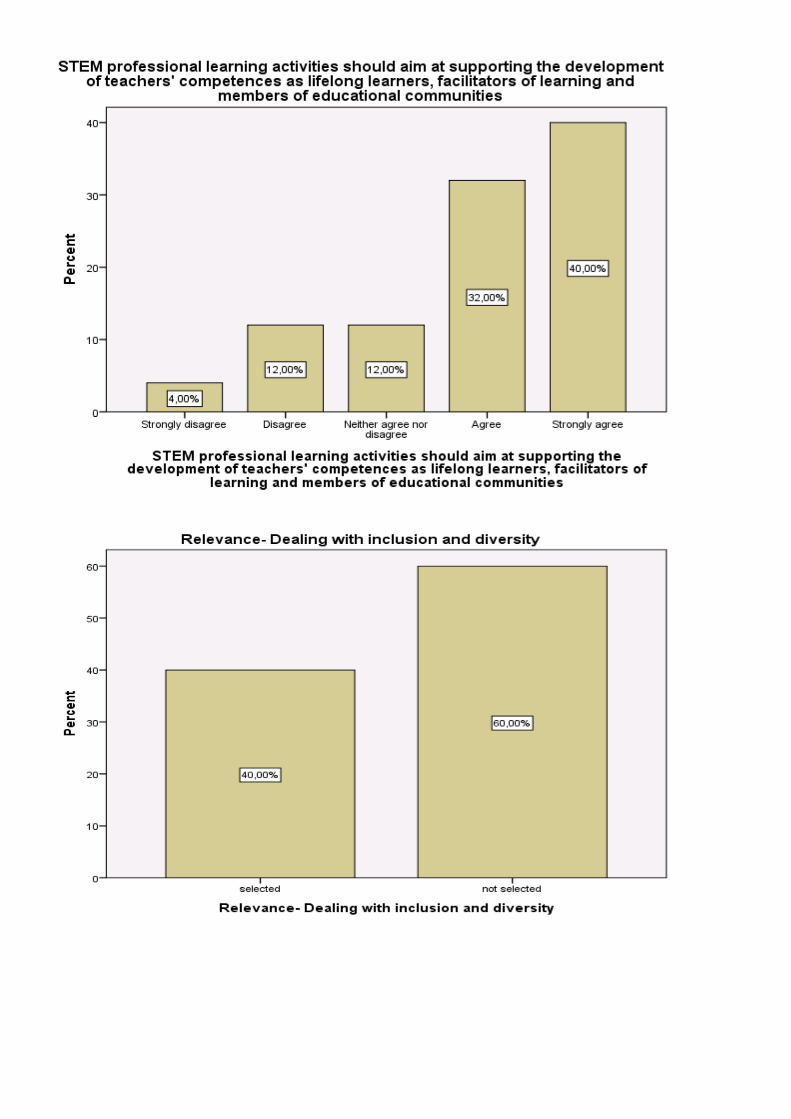
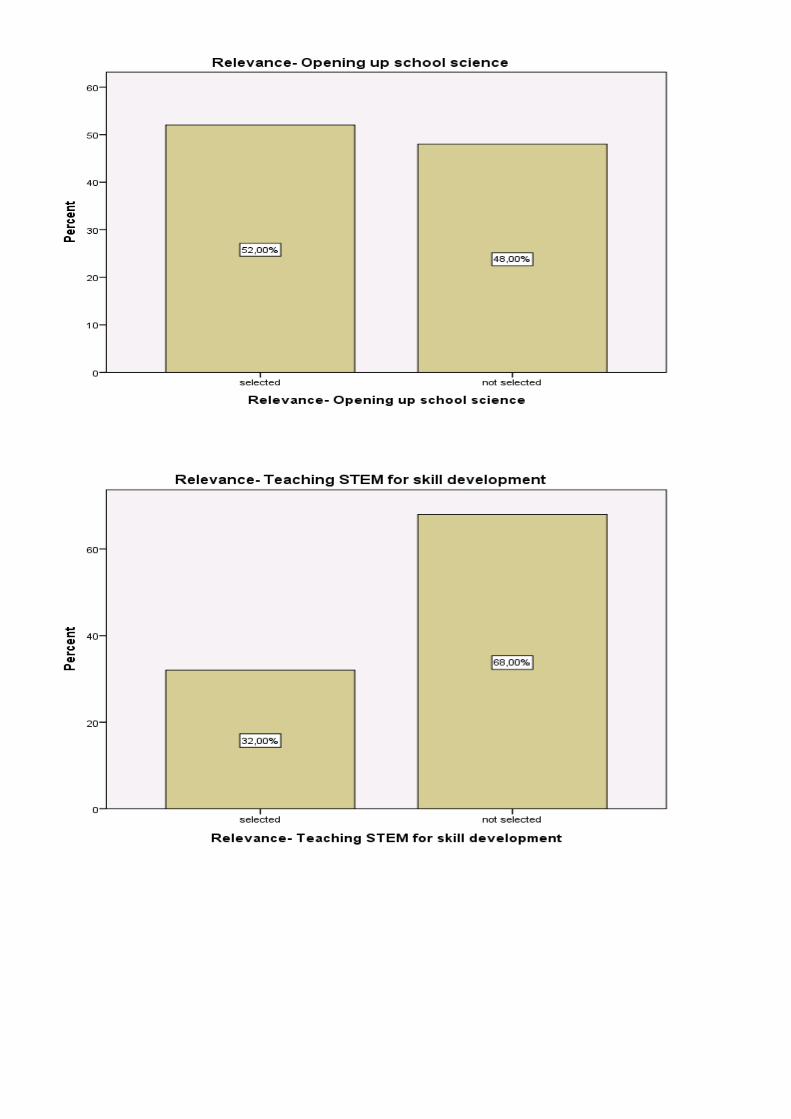


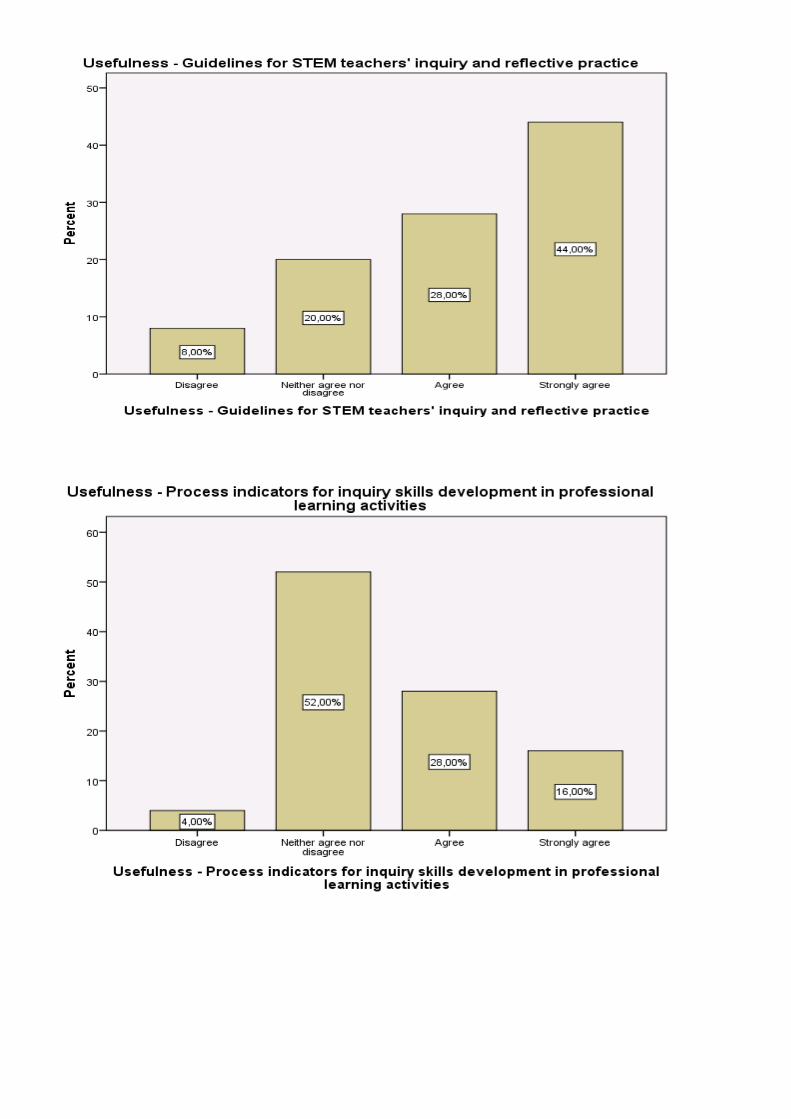


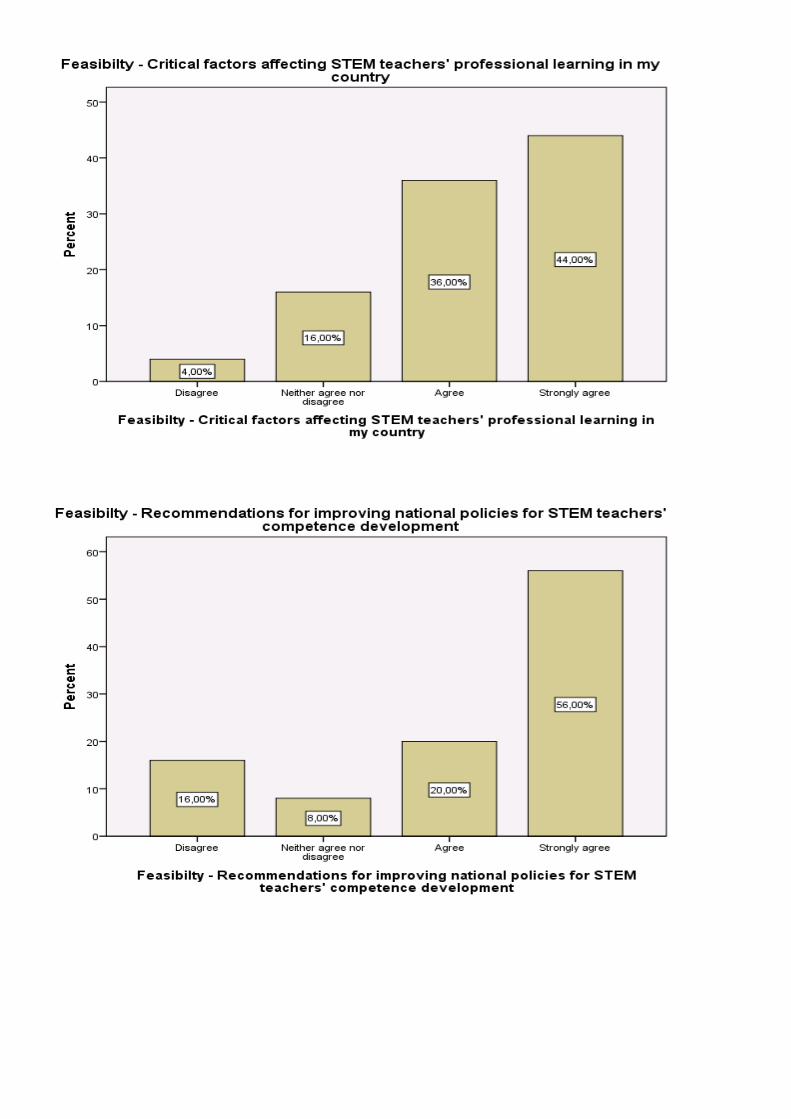


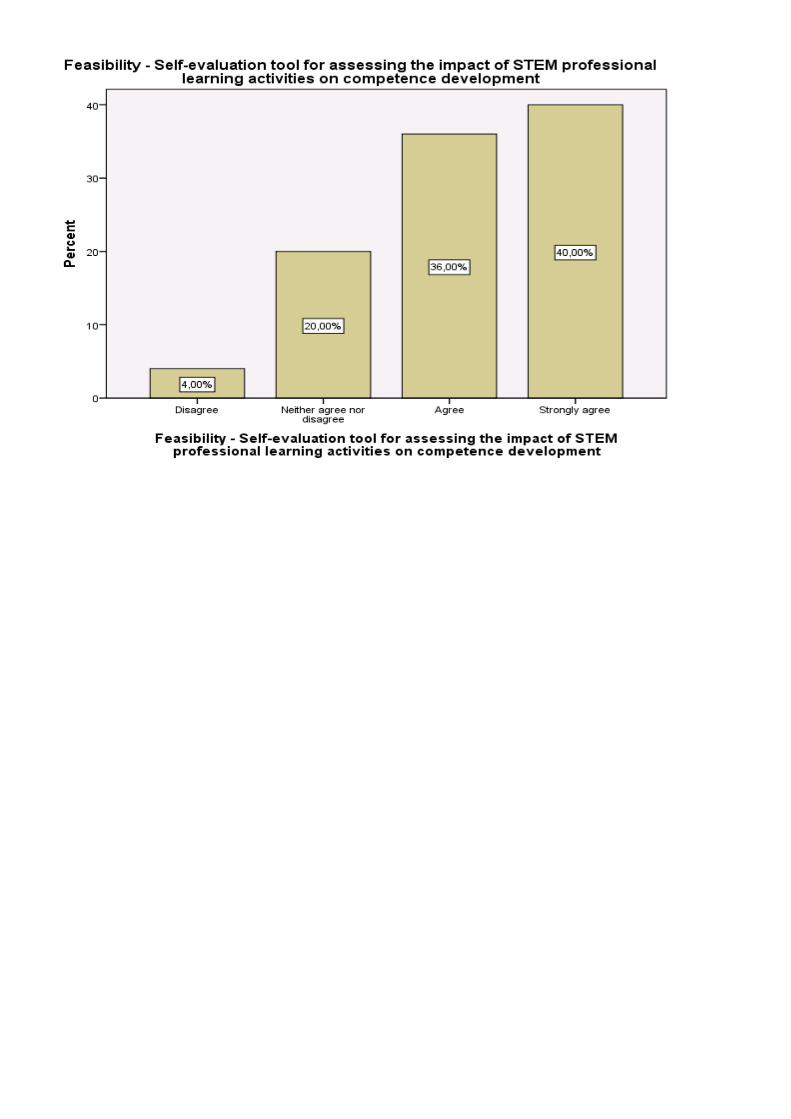


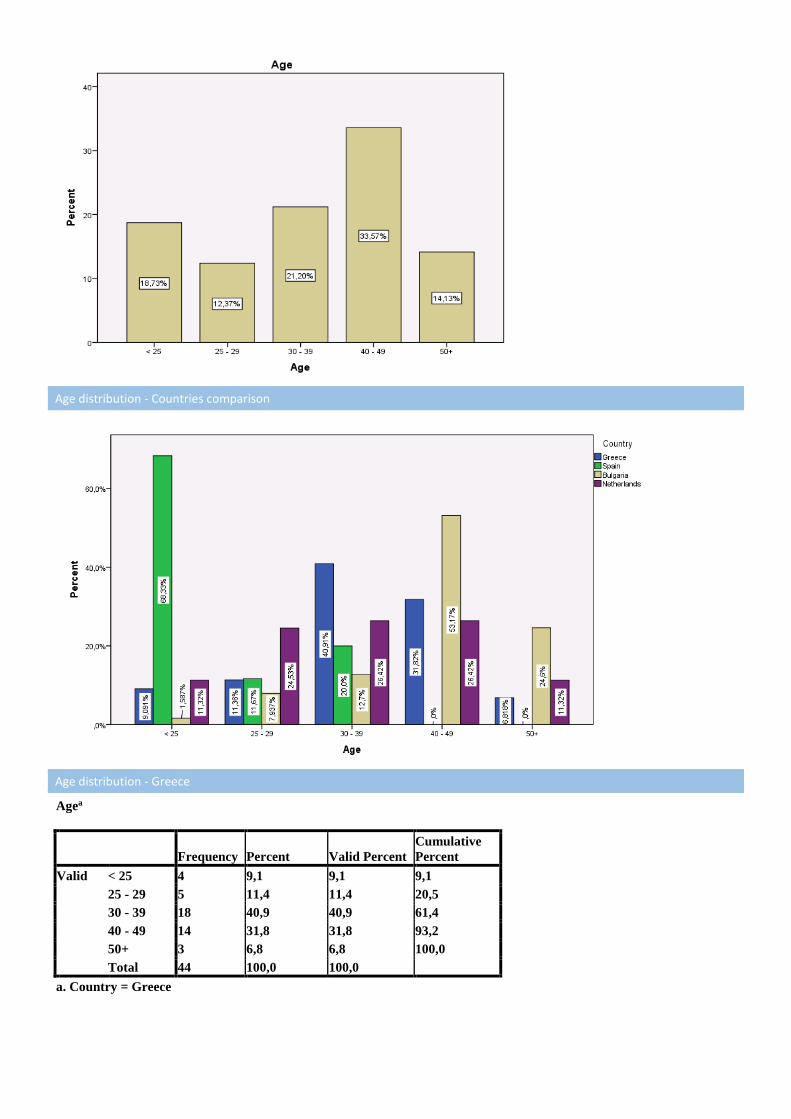


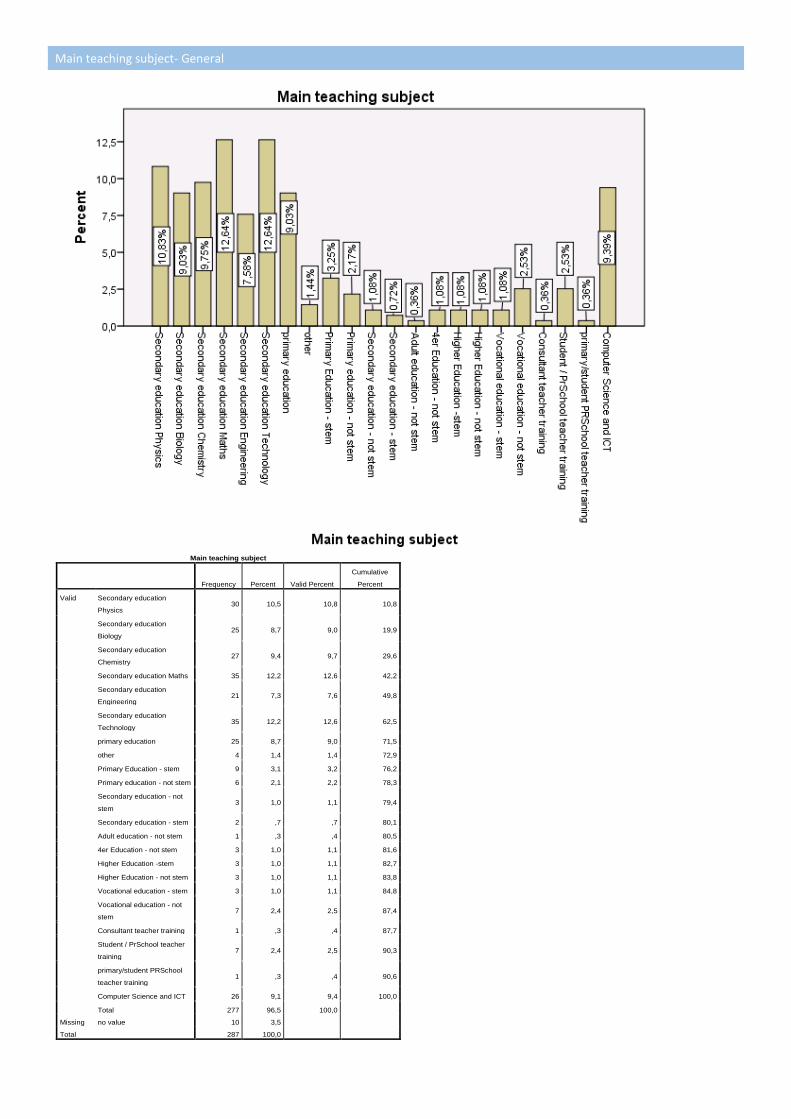
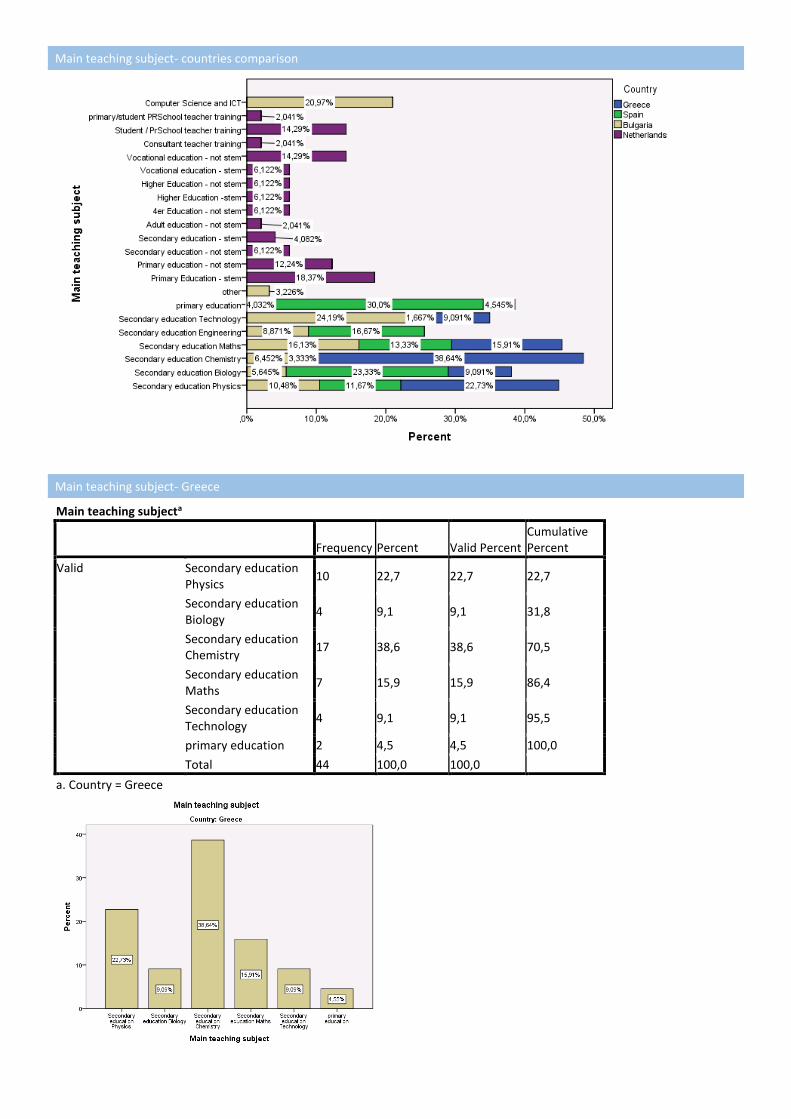


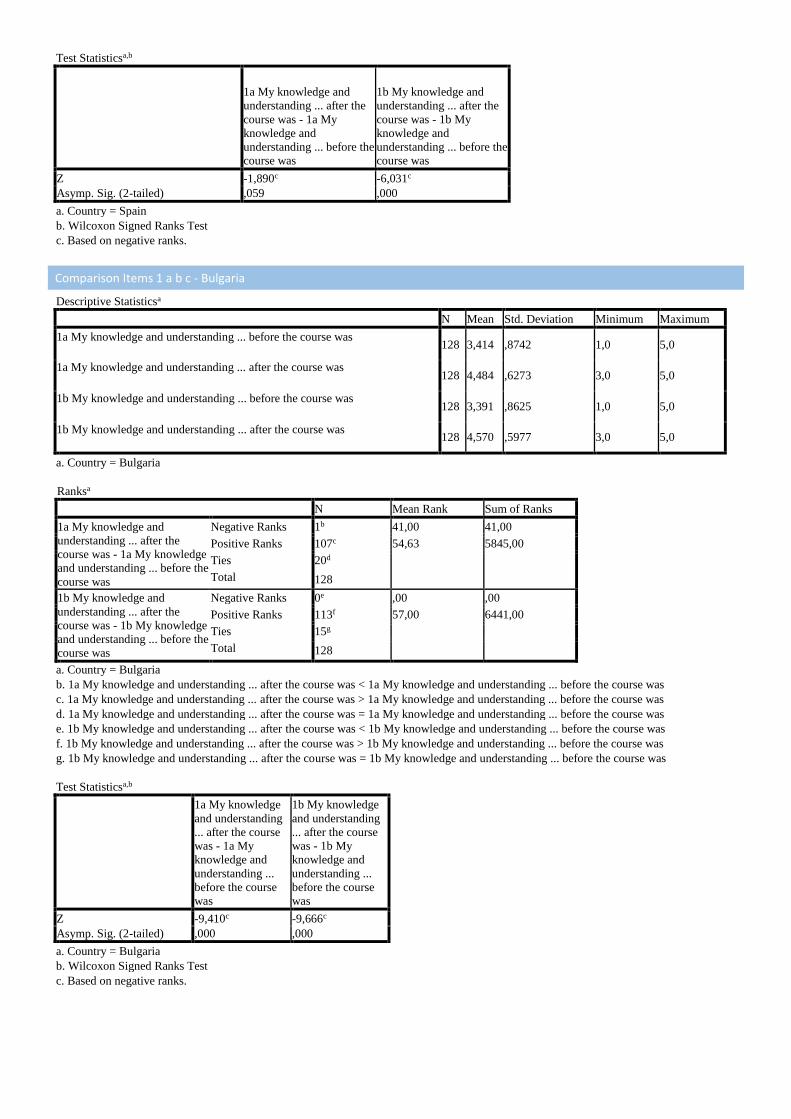


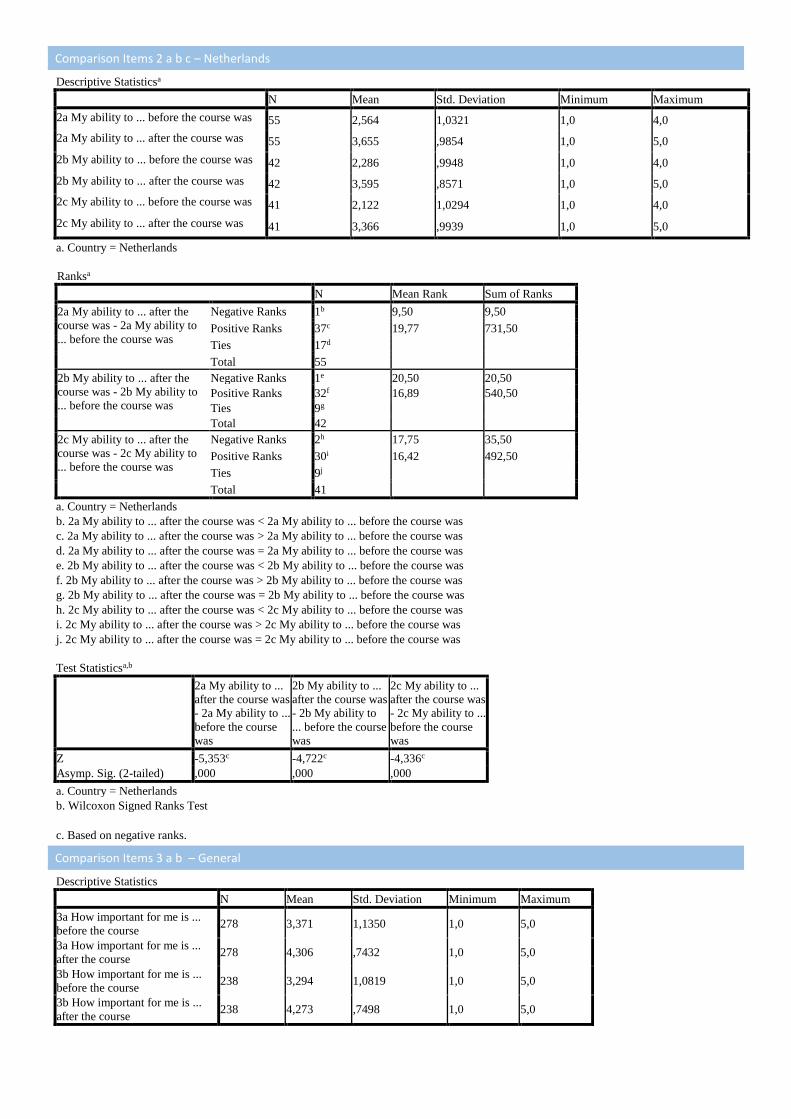


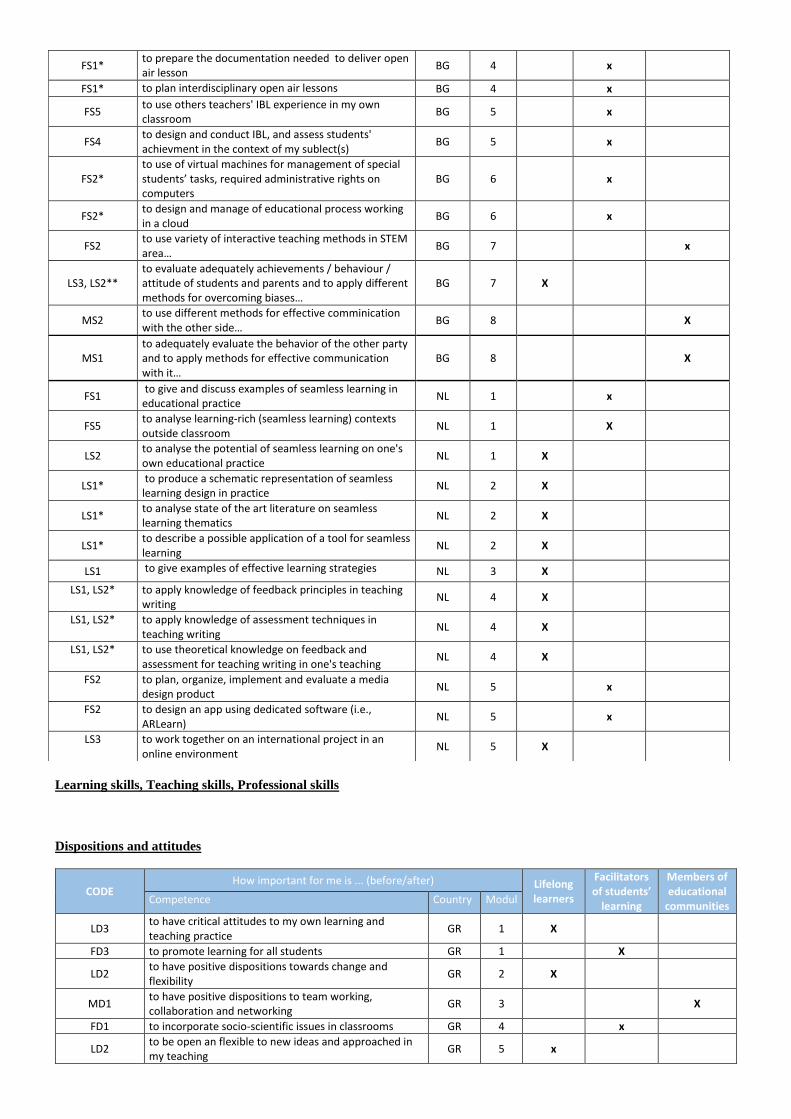

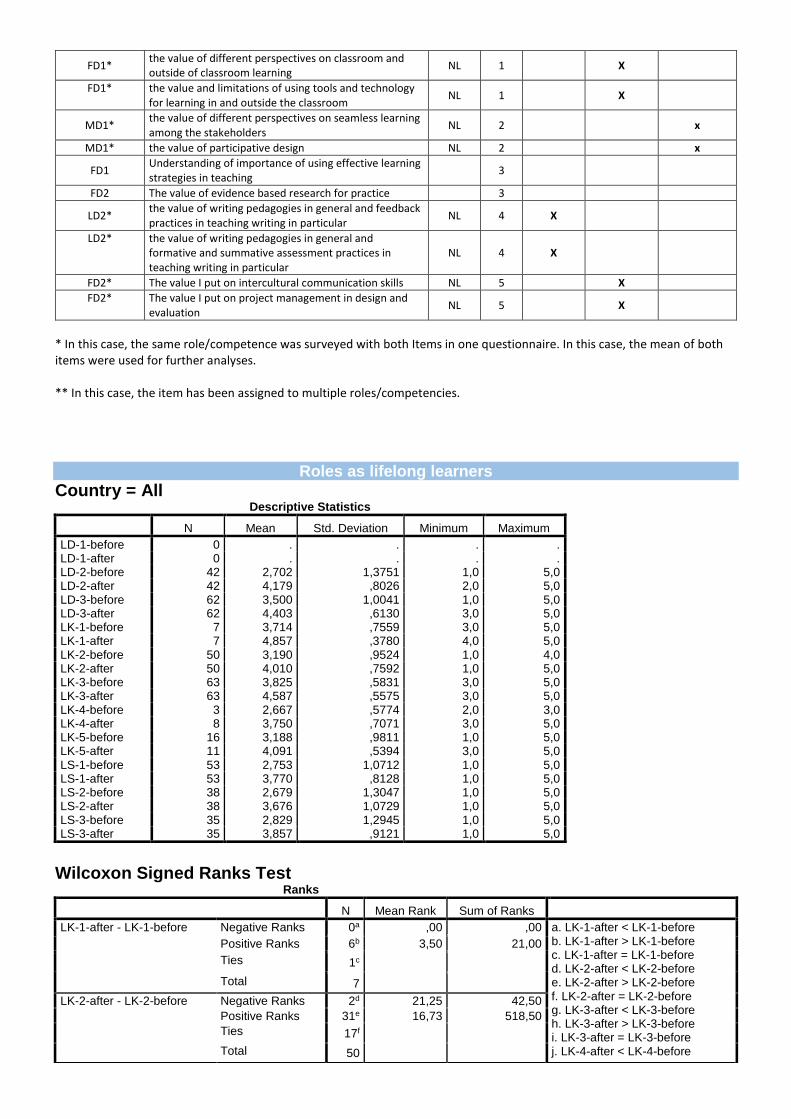


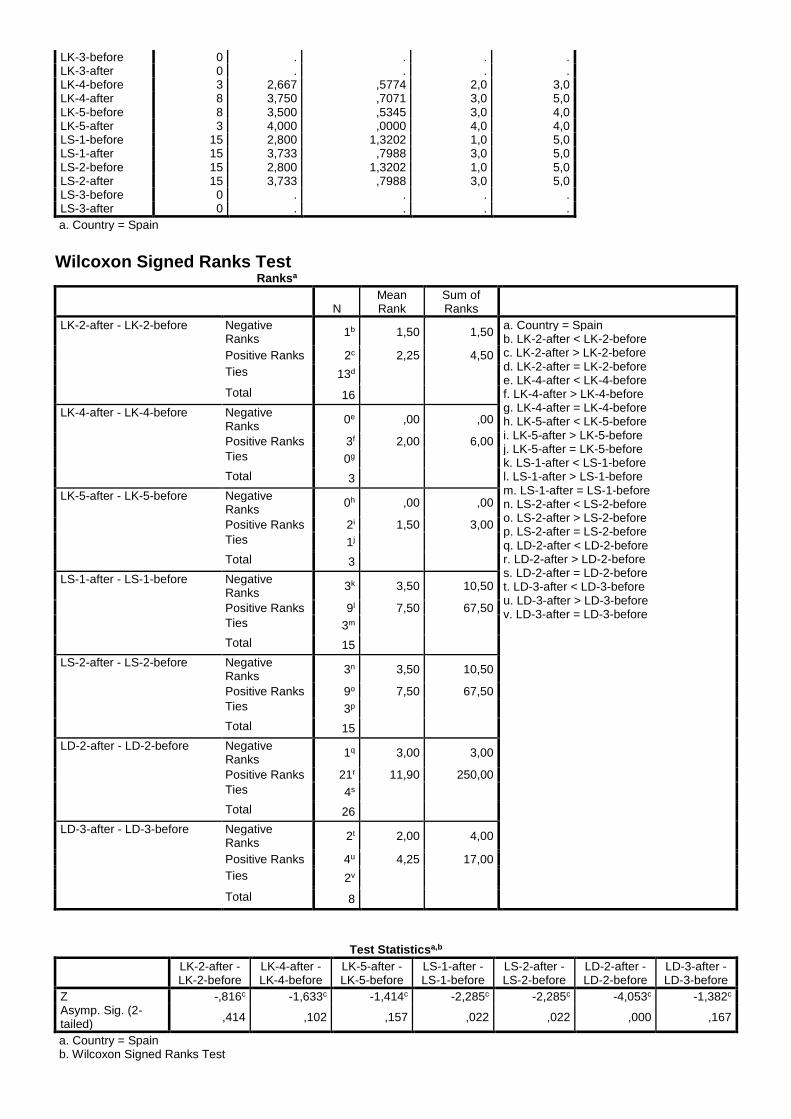
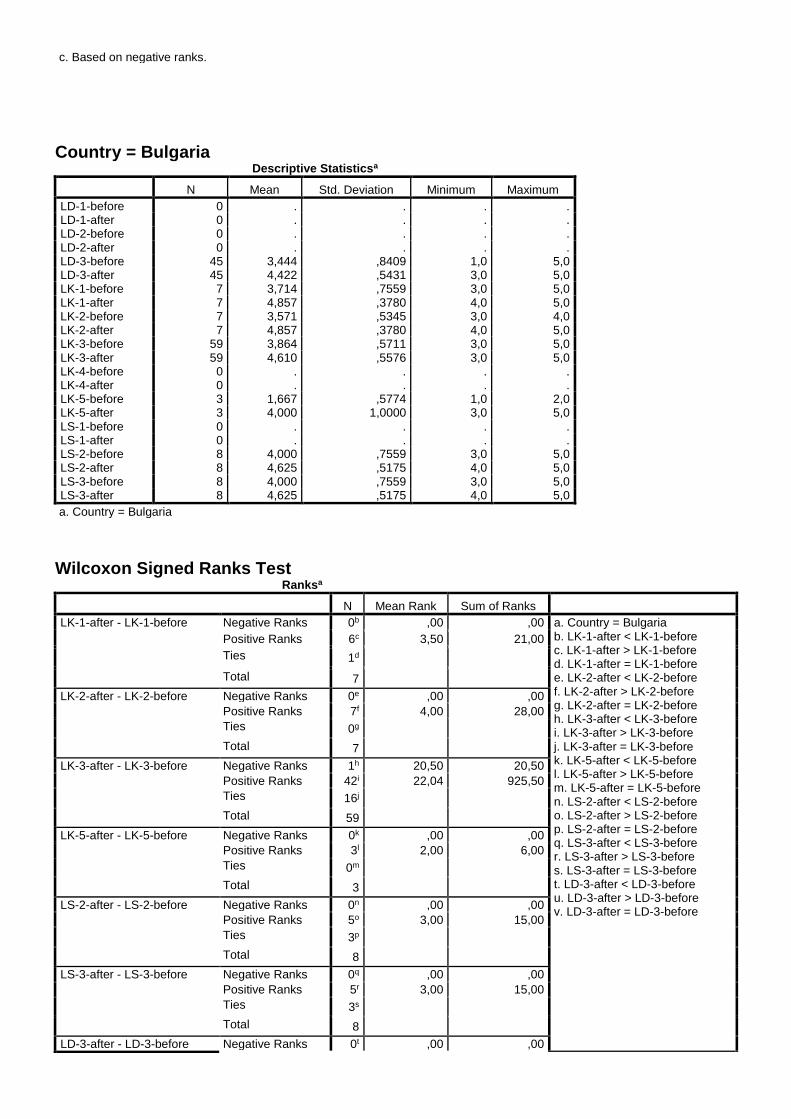


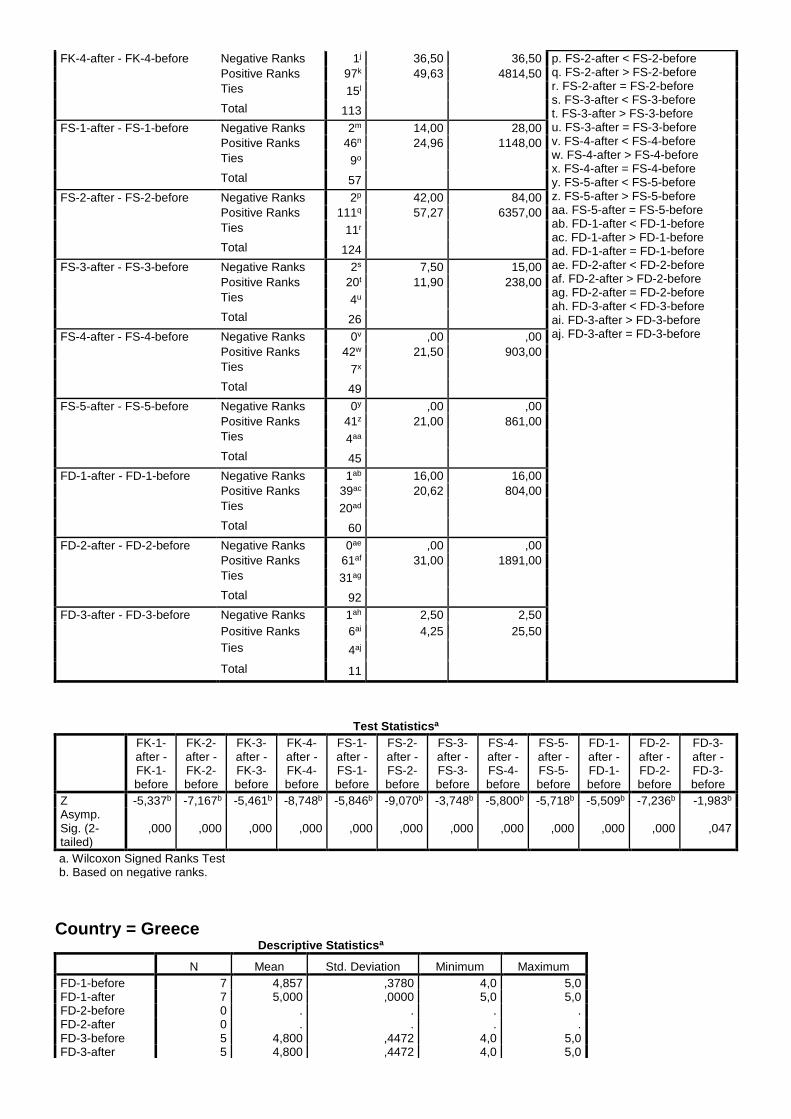

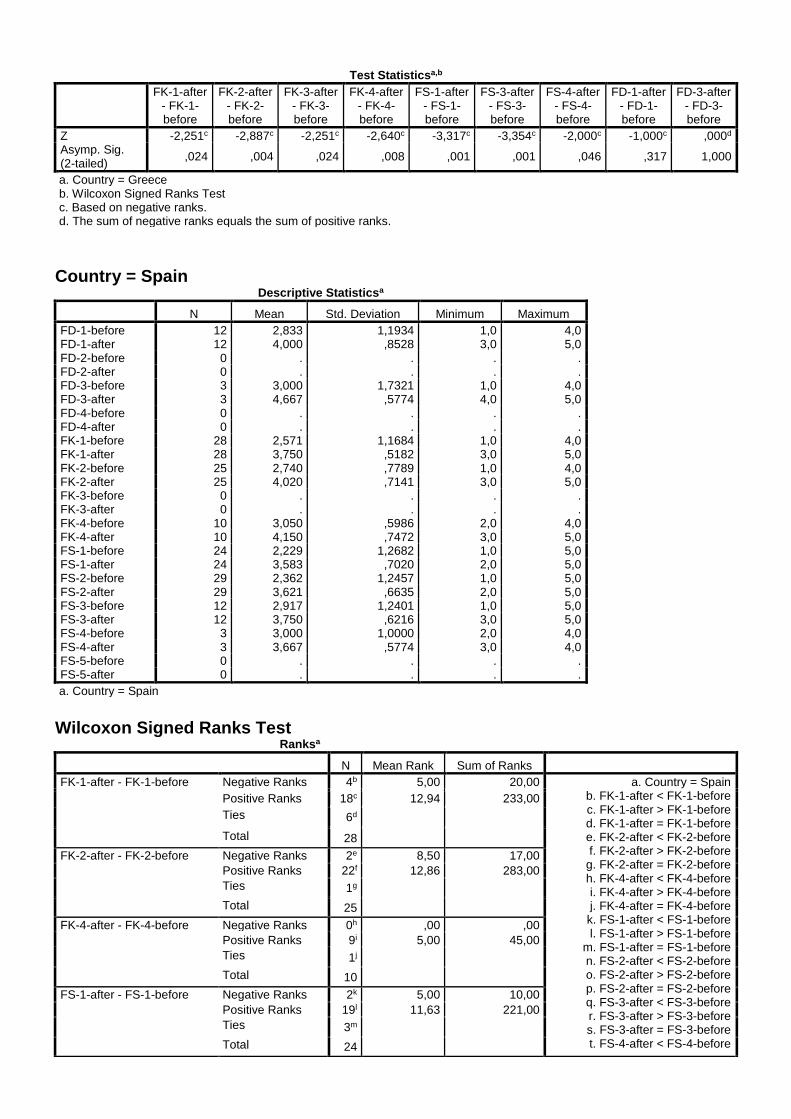

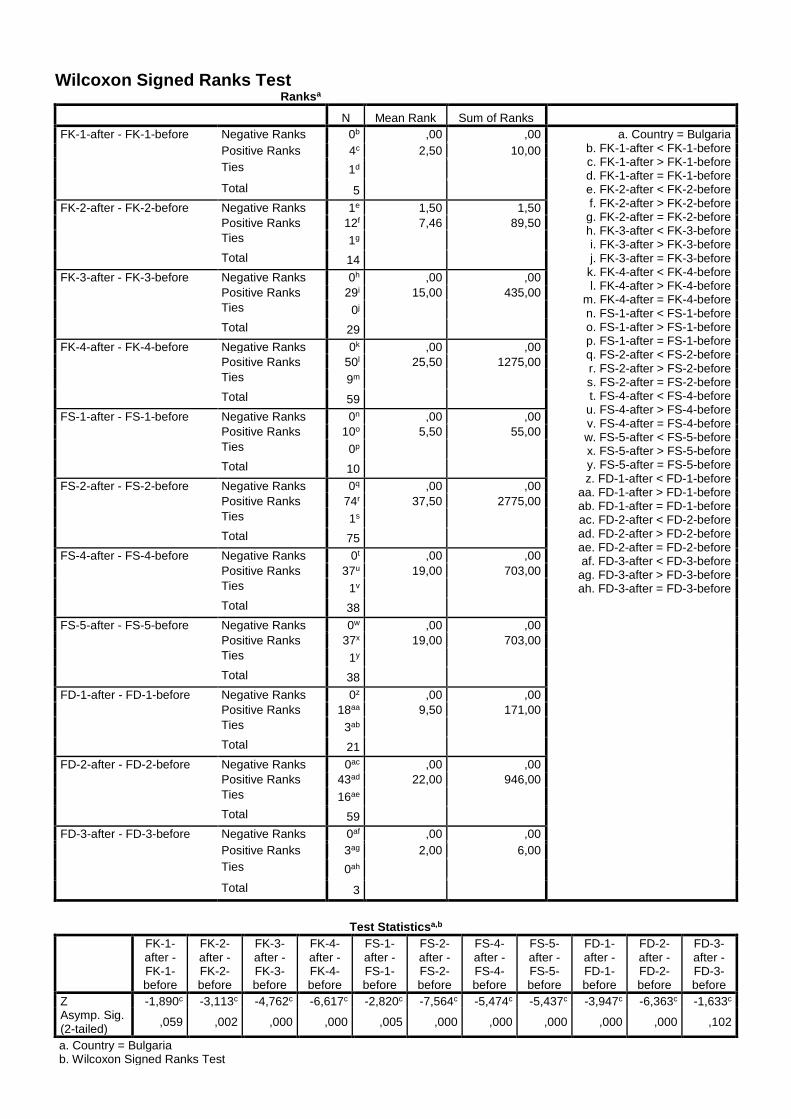

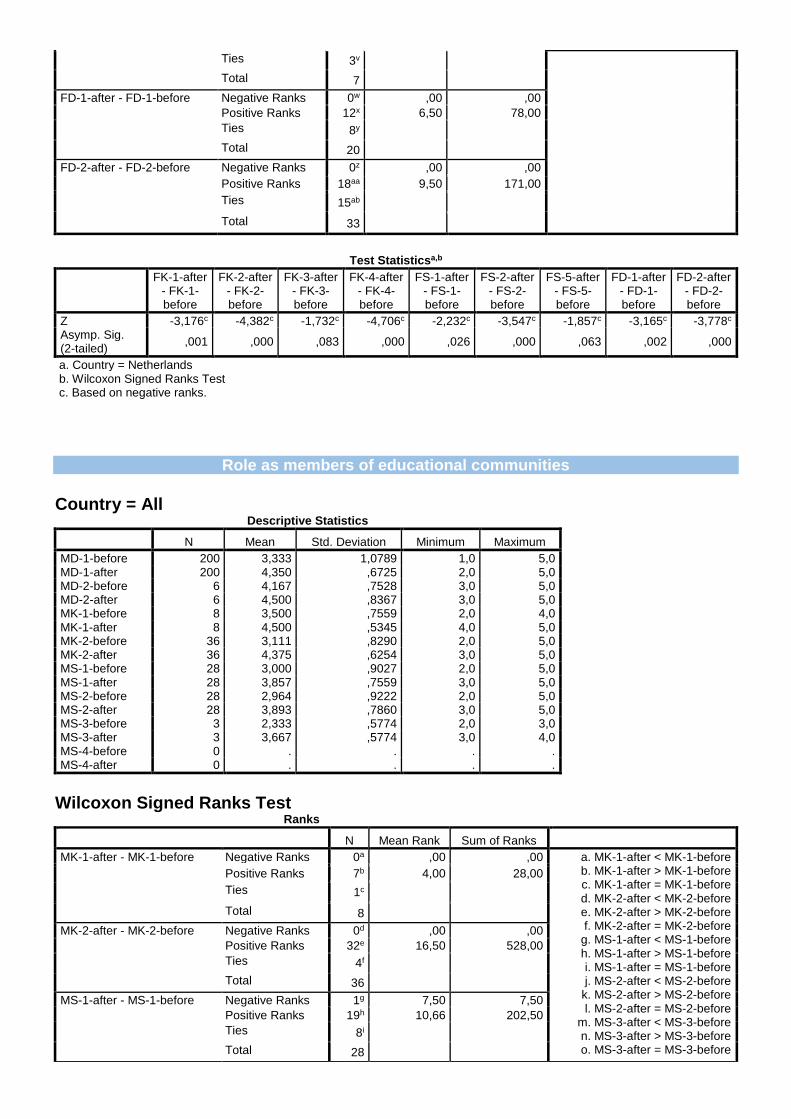


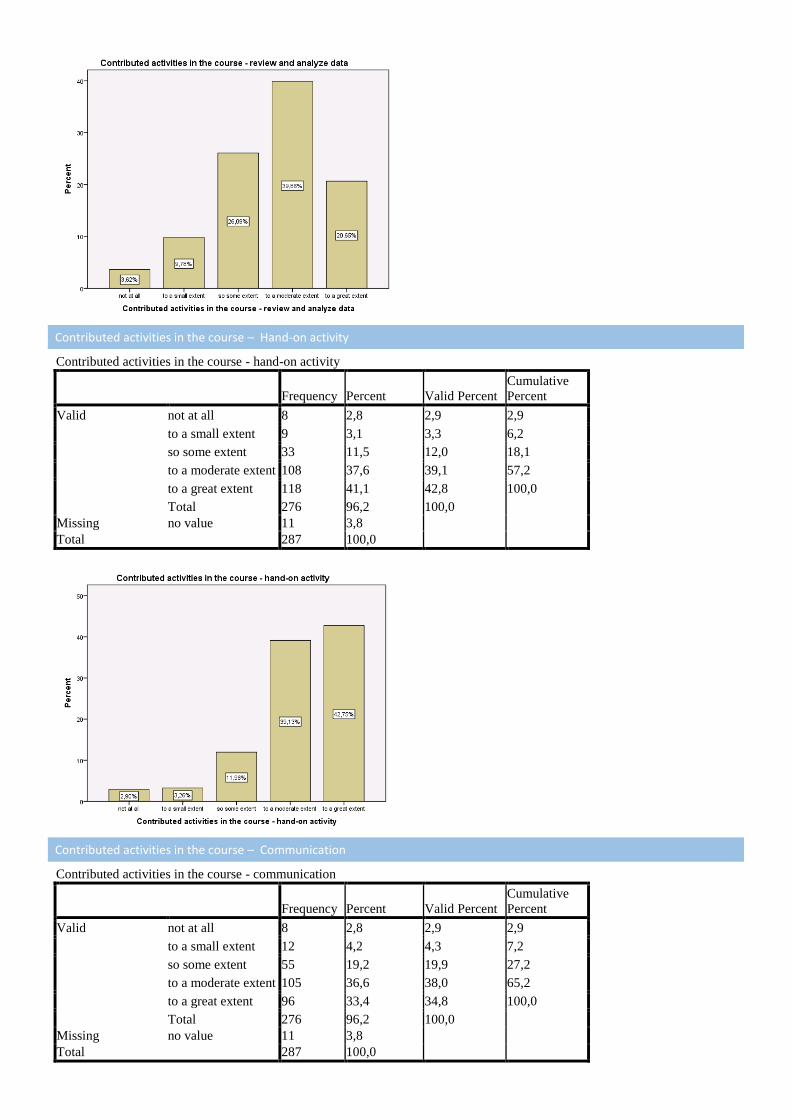
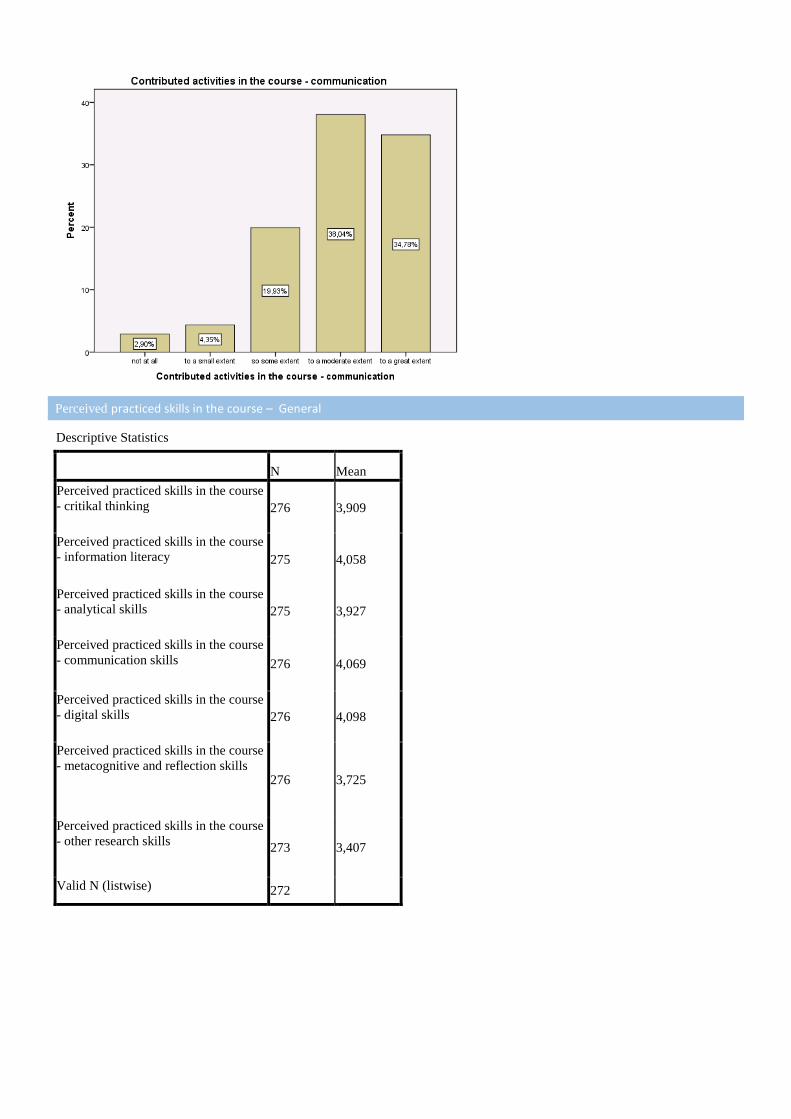


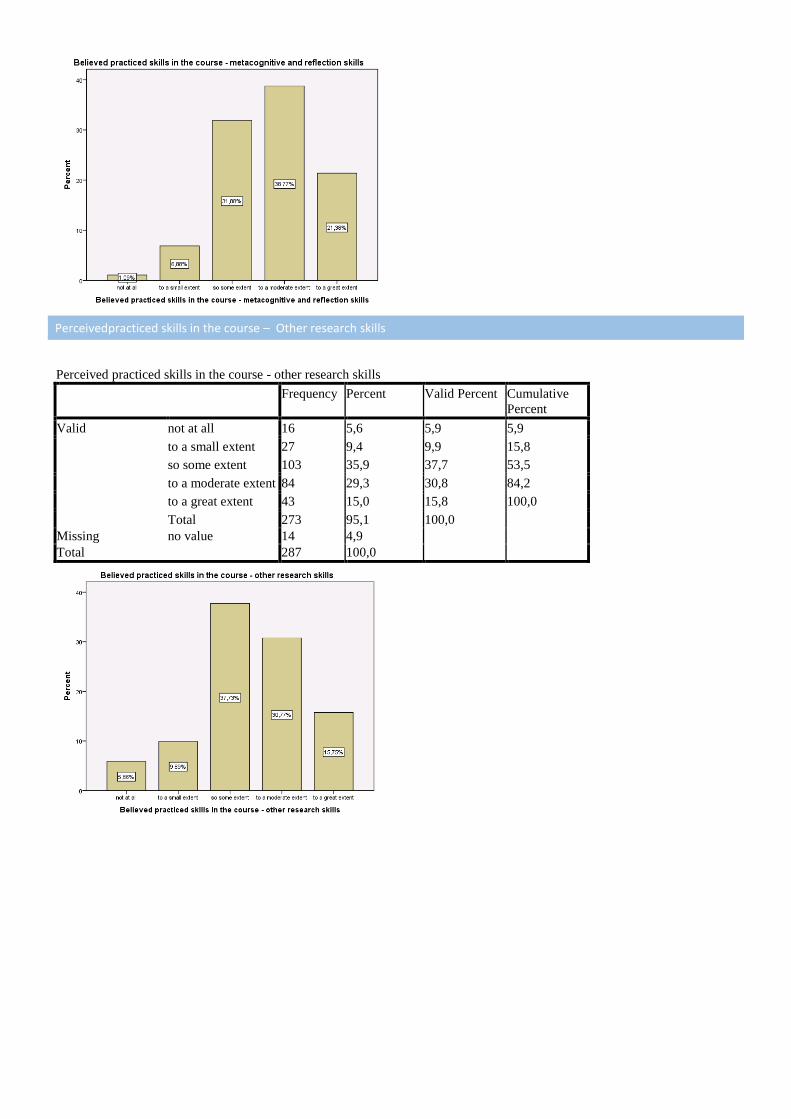


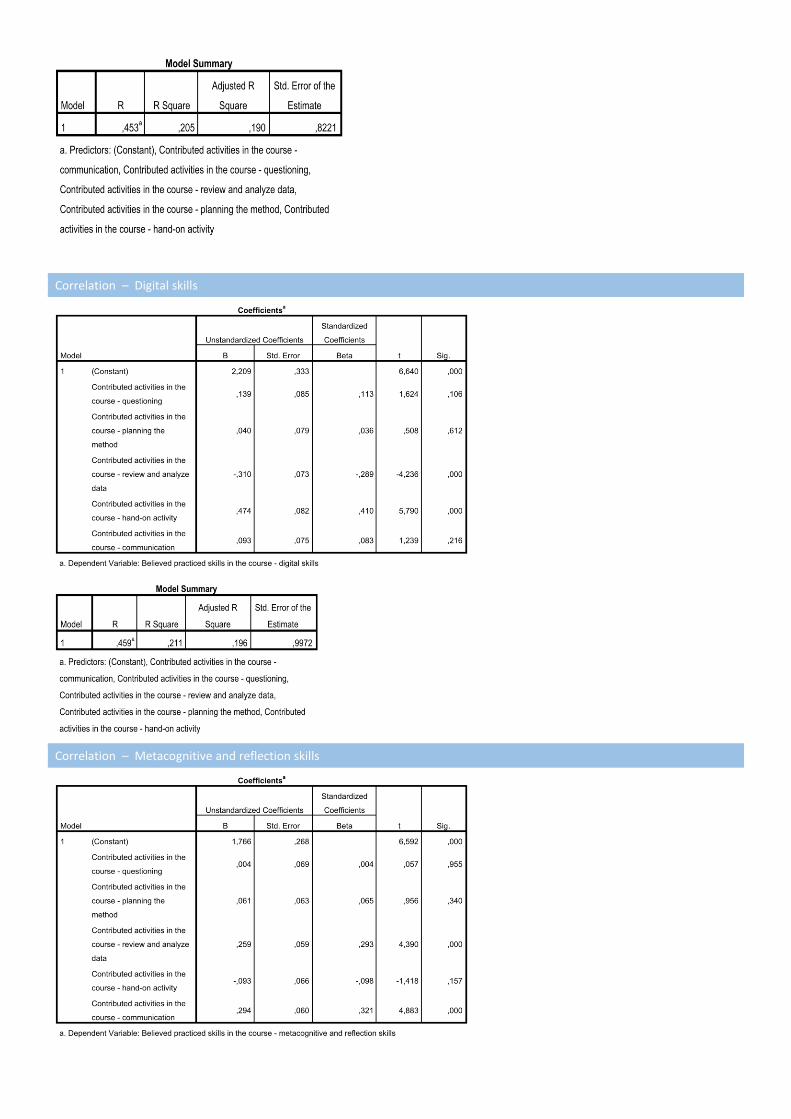

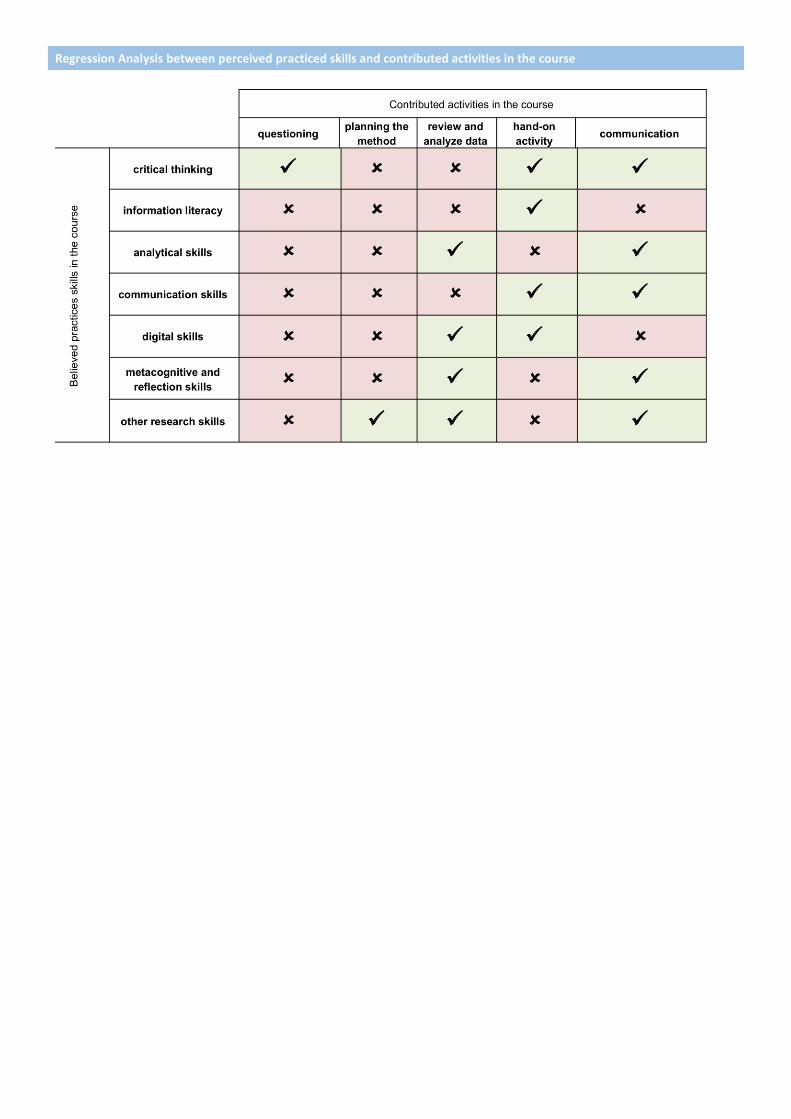


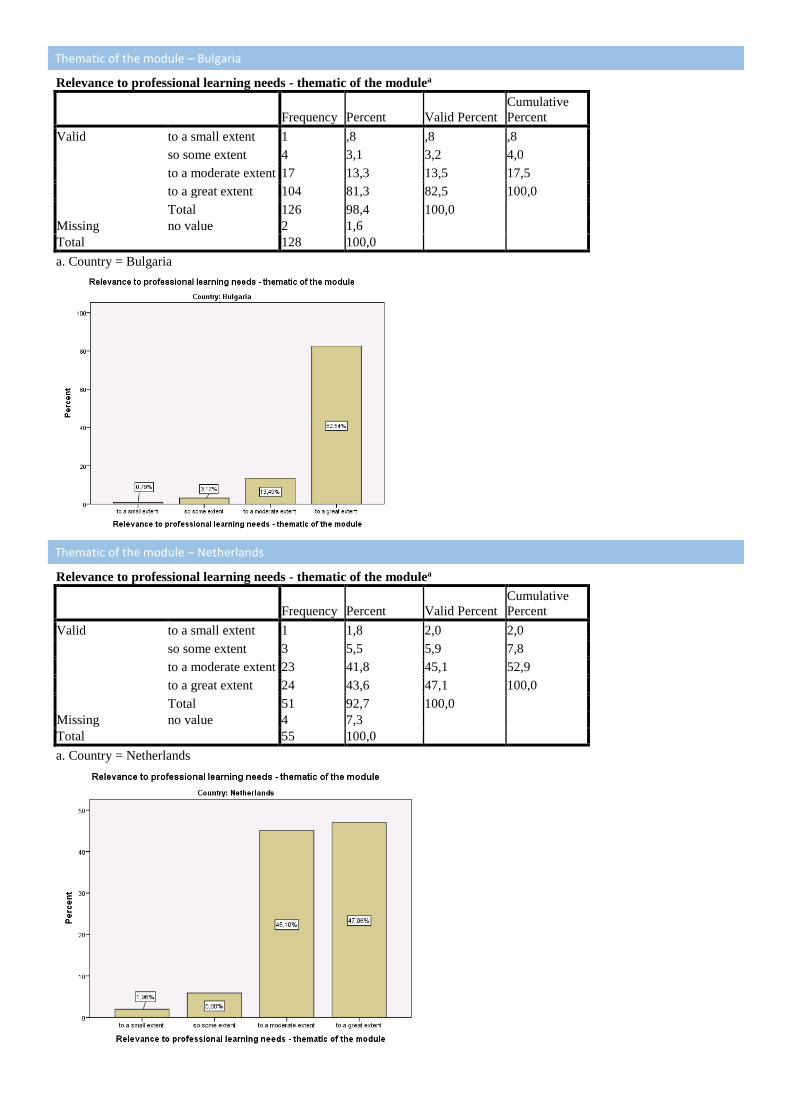


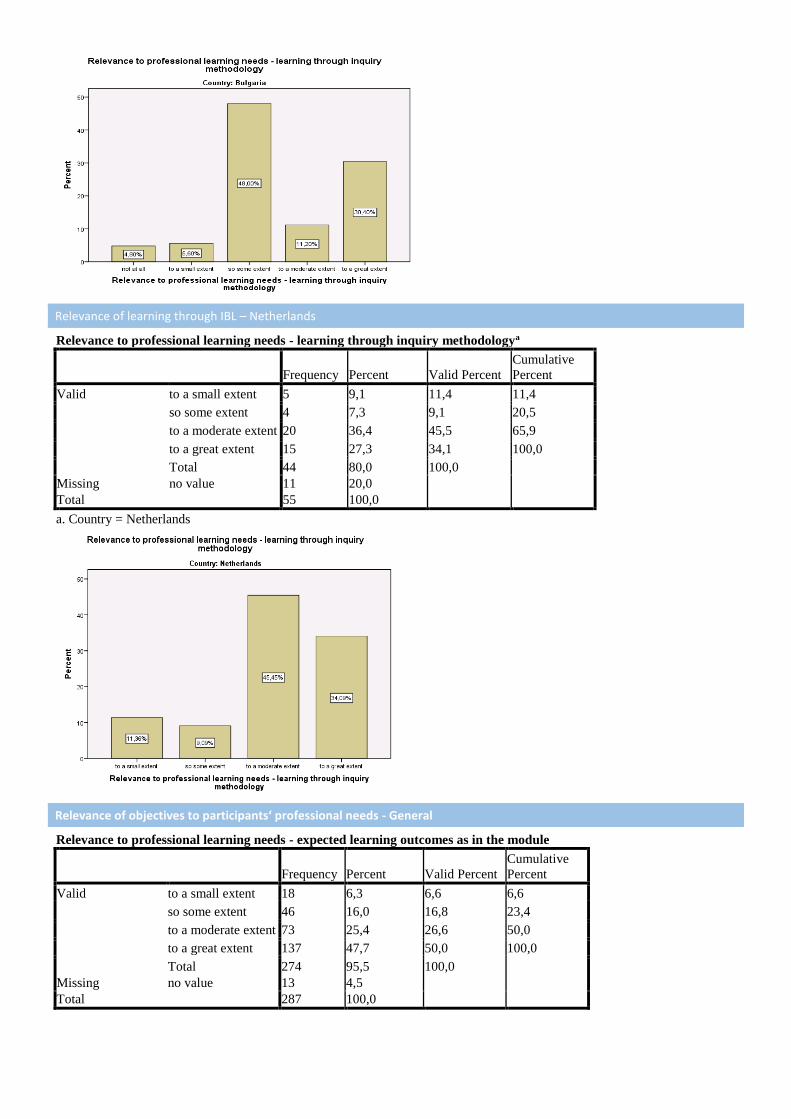
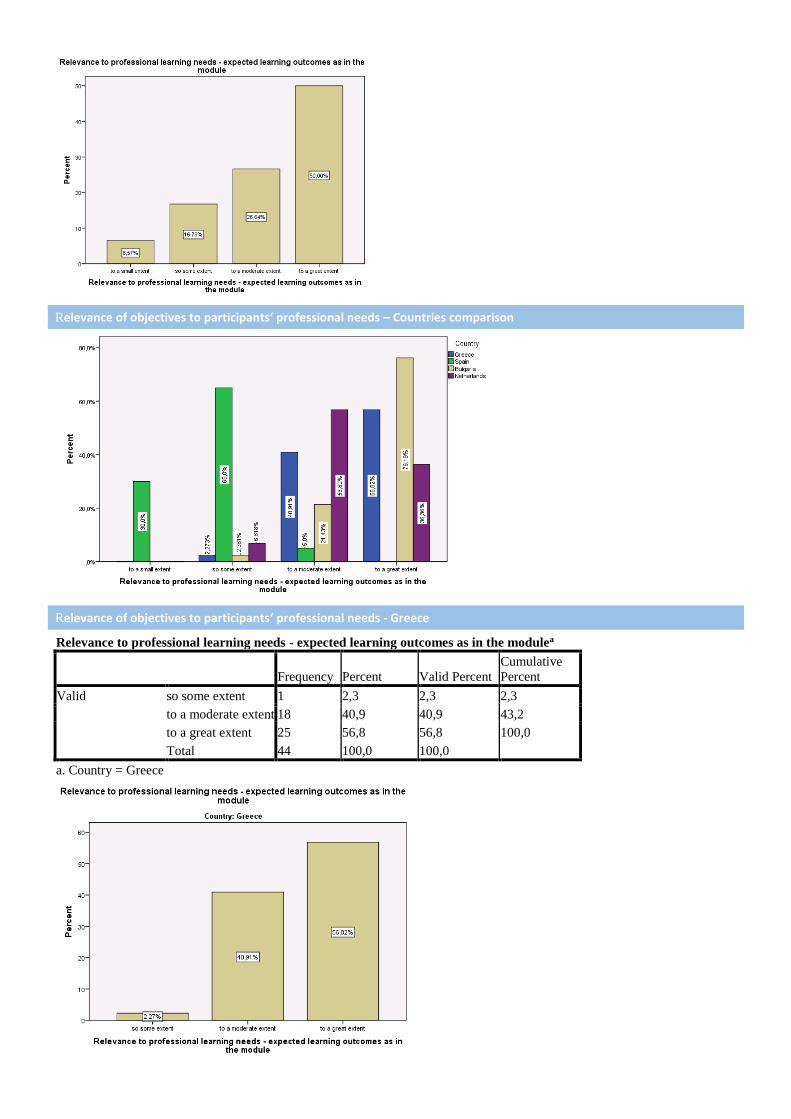


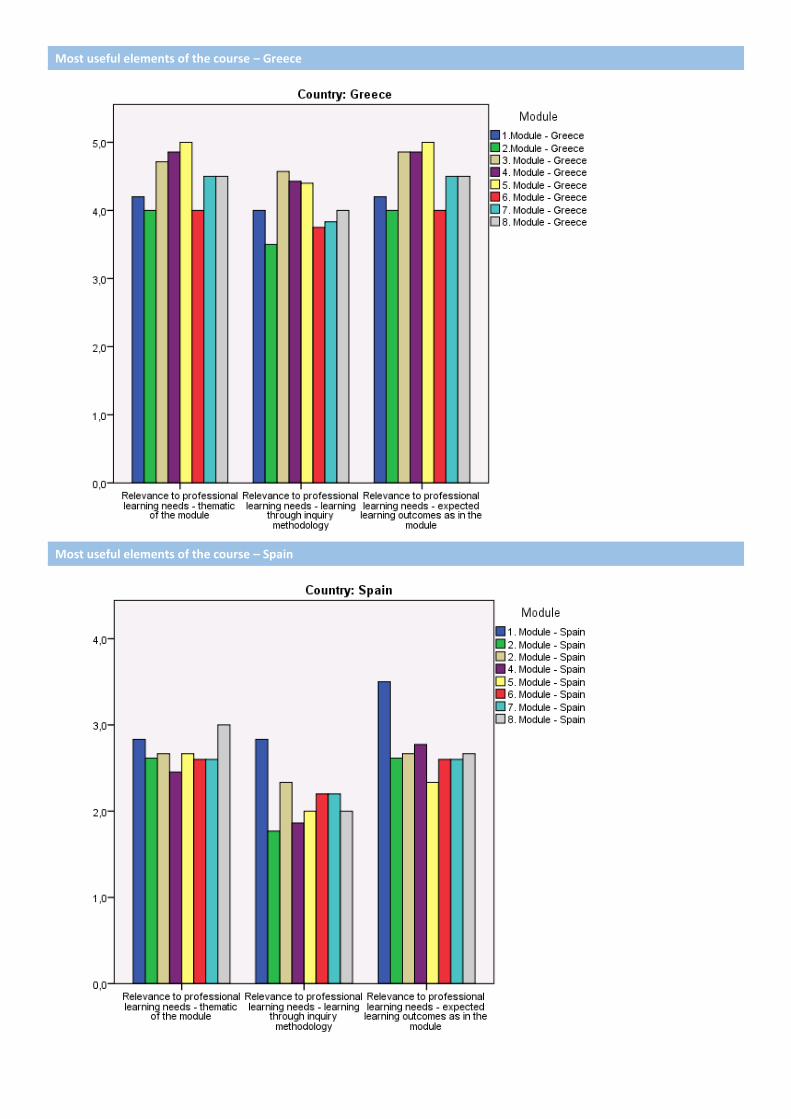


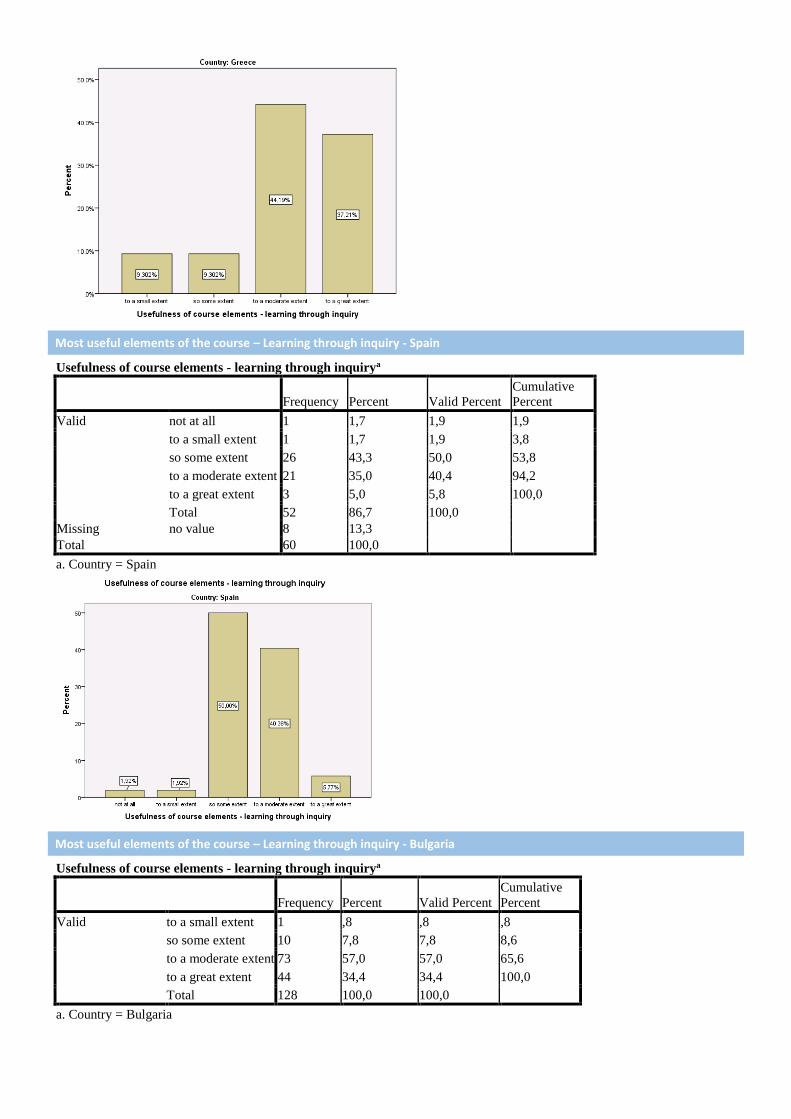
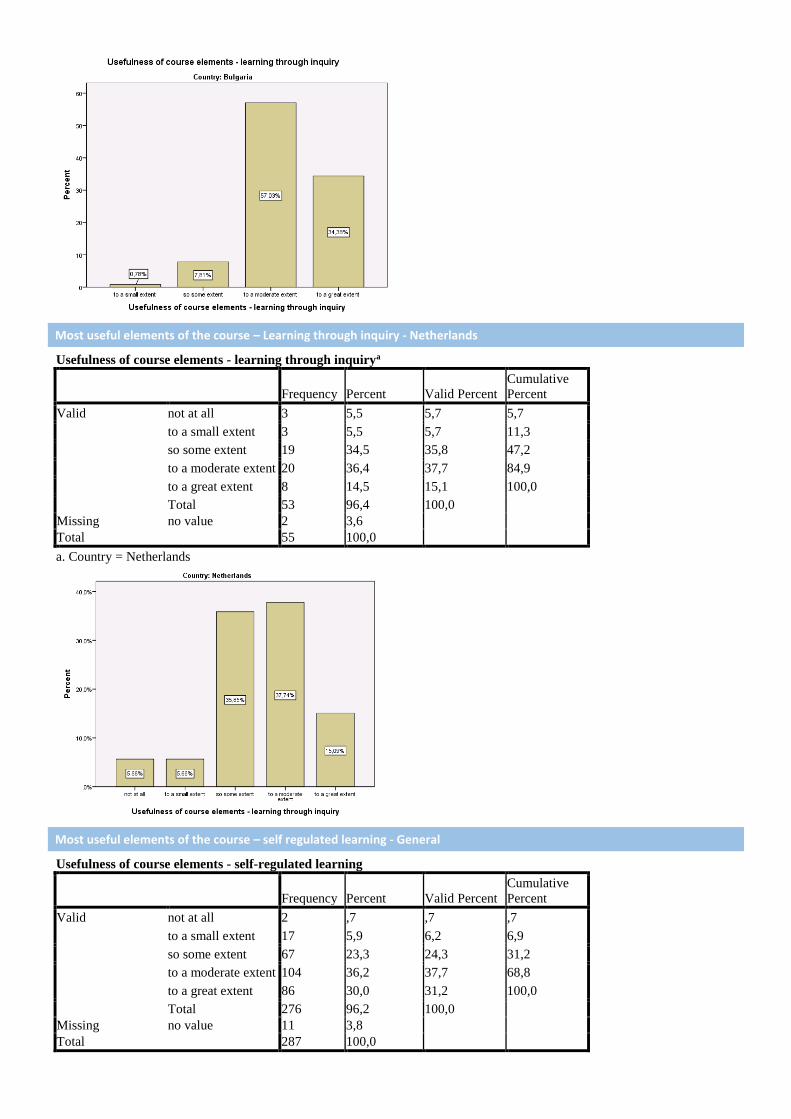
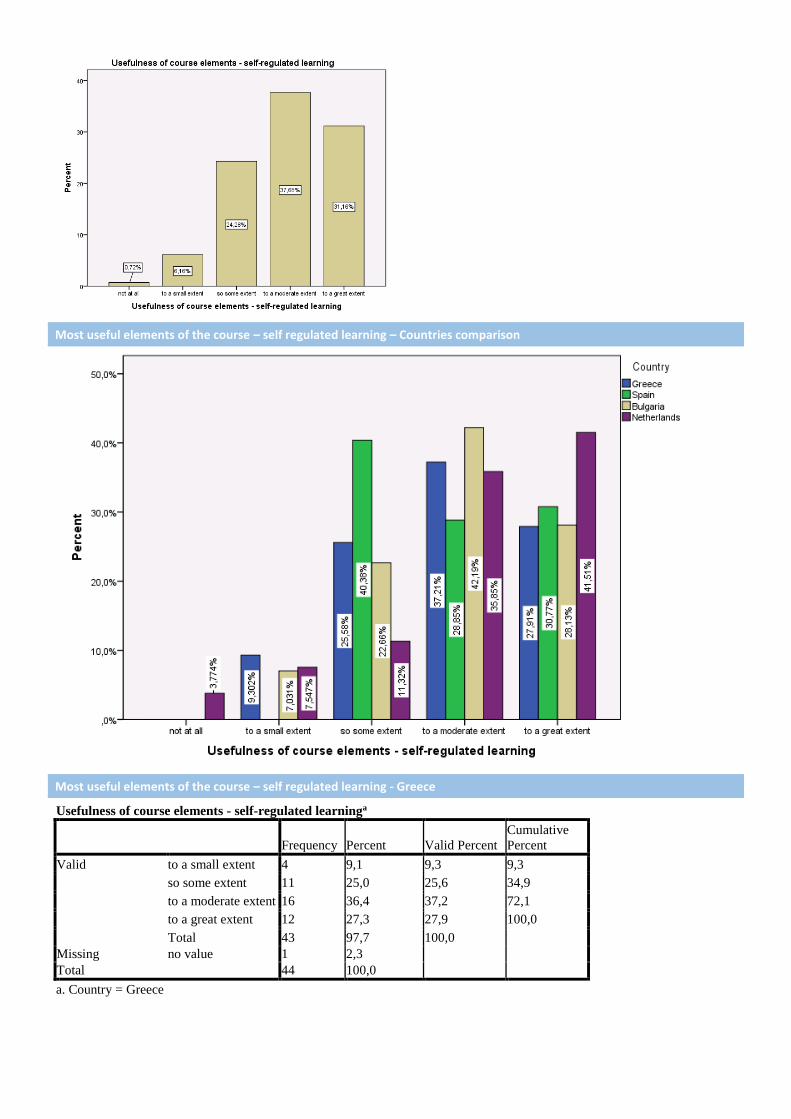
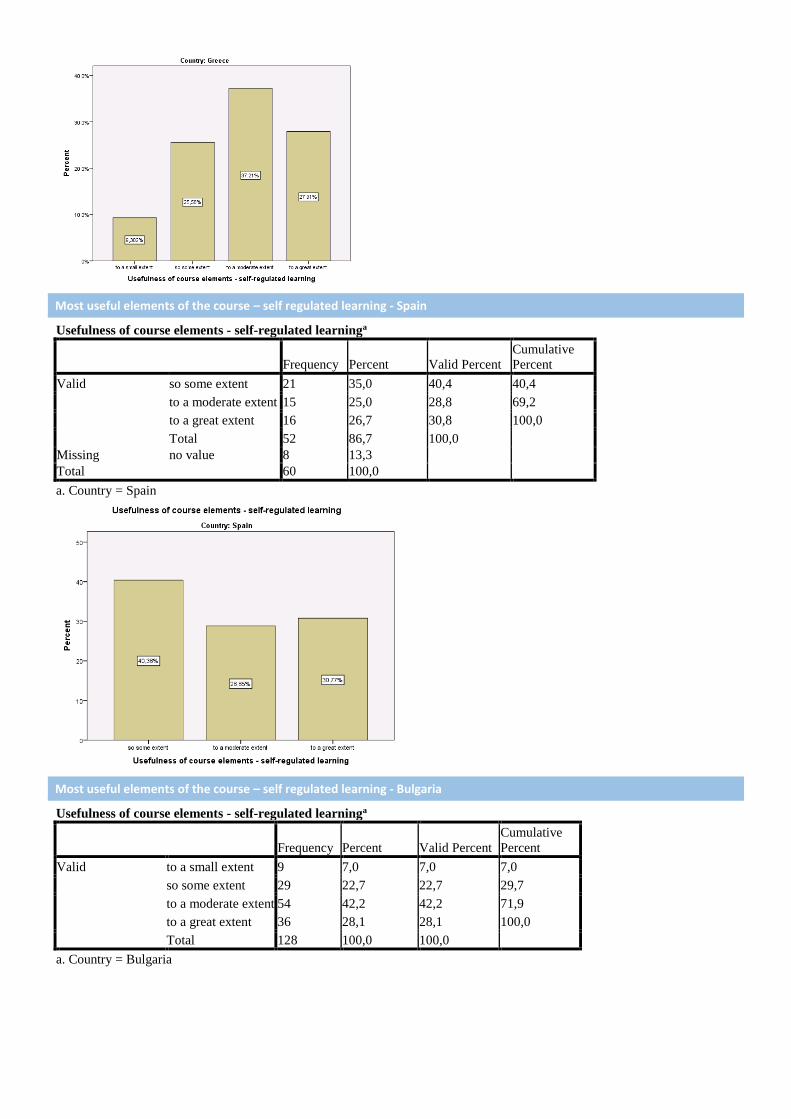


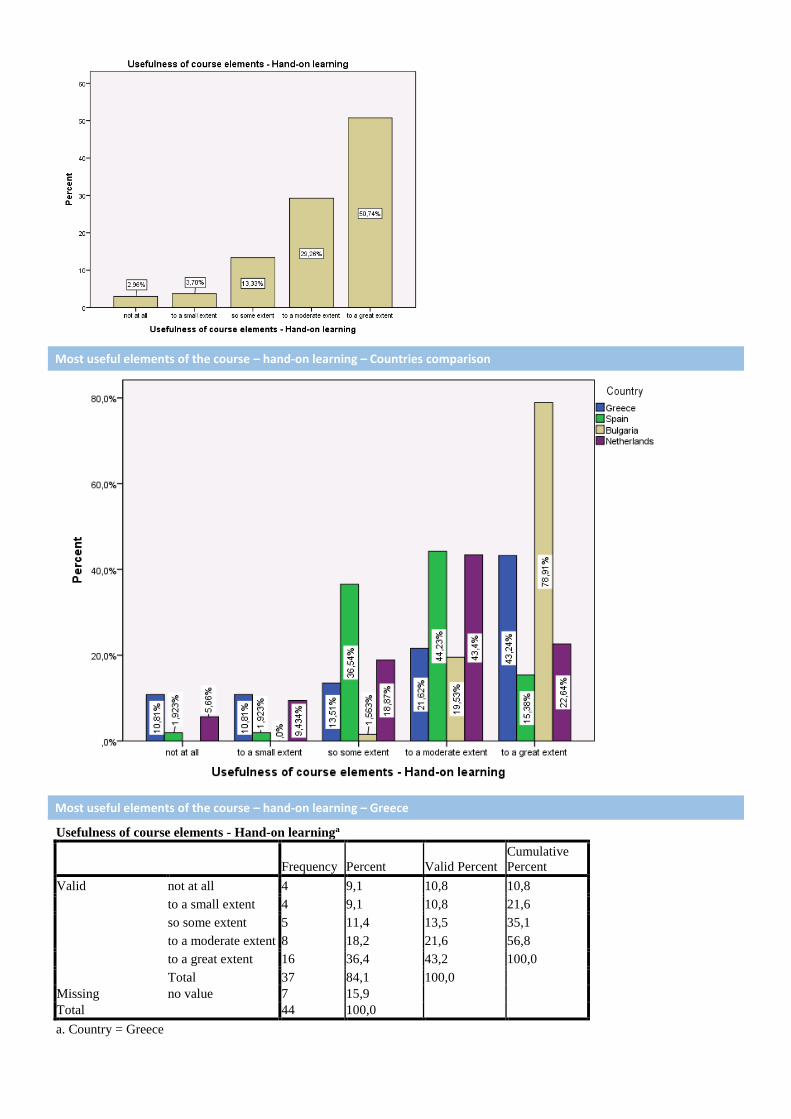
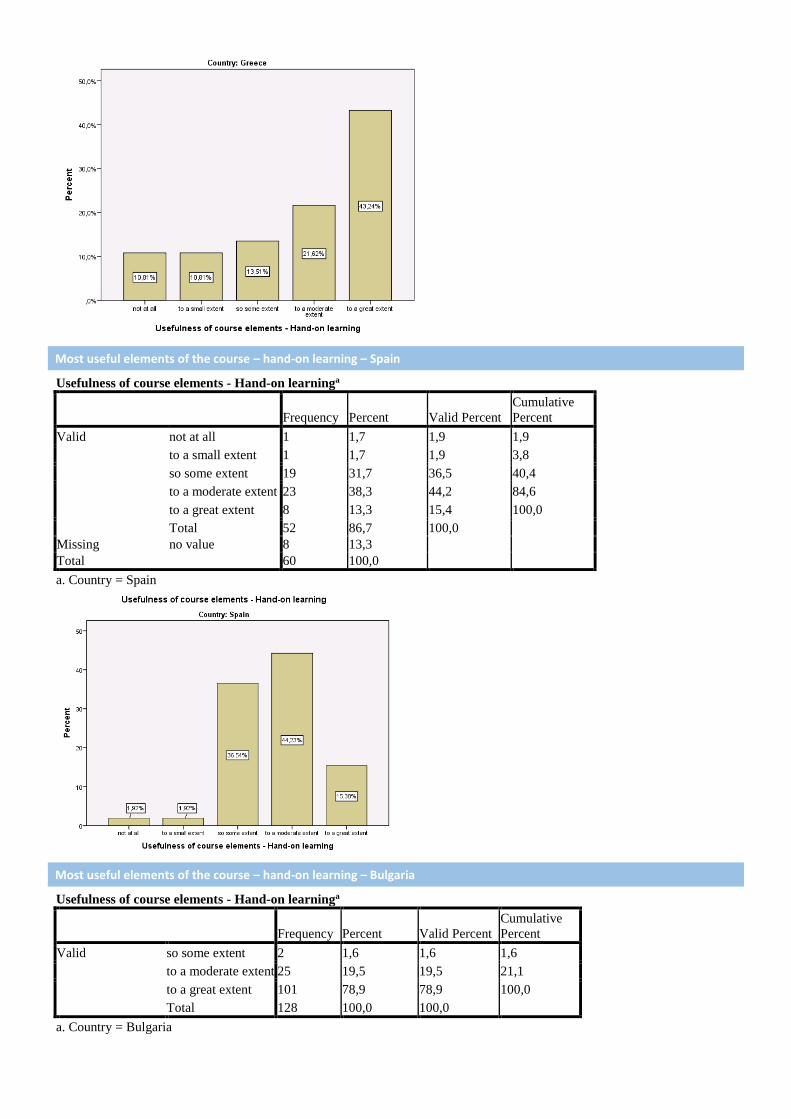


![- WordPress.com · [1] Title: Production of packaging and marketing concept . Activity . Description of the course](https://static.documents.pub/doc/80x56/5f062cbf7e708231d416ab07/-1-title-production-of-packaging-and-marketing-concept-activity-description.jpg)


