Intelligence, Human Capital, and Economic Growth: An Extreme-Bounds Analysis Garett Jones * Department of Economics and Finance Southern Illinois University Edwardsville W. Joel Schneider Department of Psychology Illinois State University This Version: March 2004 Human capital plays an important role in the theory of economic growth, but it has been difficult to measure this abstract concept. We survey the psychological literature on cross-cultural IQ tests, and conclude that modern intelligence tests are well-suited for measuring an important form of a nation’s human capital. Using a new database compiled by Lynn and Vanhanen (2002), we show that national average IQ has a robust positive relationship with economic growth. Using a methodology derived from Sala-i- Martin (1997a), we show that in growth regressions that include only robust control variables, IQ is statistically significant in 99.7% of these 1330 regressions. A strong relationship persists even when OECD countries are excluded from the sample. A 1 point increase in a nation’s average IQ is associated with a persistent 0.16% annual increase in GDP per capita. *Corresponding Author: Garett Jones, Department of Economics and Finance, Southern Illinois University, Edwardsville, IL, 62026-1102, [email protected], www.siue.edu/~garjone . W. Joel Schneider, Department of Psychology, Illinois State University, Normal, IL, 61790.
Transcript
Intelligence, Human Capital, and Economic Growth: An Extreme-Bounds Analysis
Garett Jones*
Department of Economics and Finance Southern Illinois University Edwardsville
W. Joel Schneider
Department of Psychology Illinois State University
This Version: March 2004
Human capital plays an important role in the theory of economic growth, but it has been difficult to measure this abstract concept. We survey the psychological literature on cross-cultural IQ tests, and conclude that modern intelligence tests are well-suited for measuring an important form of a nation’s human capital. Using a new database compiled by Lynn and Vanhanen (2002), we show that national average IQ has a robust positive relationship with economic growth. Using a methodology derived from Sala-i-Martin (1997a), we show that in growth regressions that include only robust control variables, IQ is statistically significant in 99.7% of these 1330 regressions. A strong relationship persists even when OECD countries are excluded from the sample. A 1 point increase in a nation’s average IQ is associated with a persistent 0.16% annual increase in GDP per capita.
*Corresponding Author: Garett Jones, Department of Economics and Finance, Southern Illinois University, Edwardsville, IL, 62026-1102, [email protected], www.siue.edu/~garjone. W. Joel Schneider, Department of Psychology, Illinois State University, Normal, IL, 61790.
Lynn and Vanhanen, in their original work, reported the results of a univariate regression
of the level of a nation's GDP per capita in 1998 (not the more common log-level) on IQ and a
constant for 81 countries, and report that one additional IQ point is associated with a $519
increase in 1998 GDP per capita; this regression had an R2 of 53%.
LV also performed some simple multivariate analyses using measures of political and
economic freedom as additional explanatory variables; however, these multivariate analyses used
interpolated IQ data for 104 additional countries, to create an artificial "dataset" of 185 countries.
These interpolations were often based on methods that we do not endorse (e.g., assuming
that members of a specific racial group have the same average IQ regardless of the country they
live in), and therefore we exclude all of LV's interpolated data from our study. Two of LV's 81
original observations (for Peru and Columbia) also relied heavily on a form of interpolation, and
so we exclude these observations from our dataset.
We discard another nine of Lynn and Vanhanen's 79 non-interpolated observations, either
because the sample size in the particular country was not stated or was less than 100, or because
the IQ estimate relied solely on the scores of emigrants. This leaves us with 70 usable
observations. Table 2 provides a complete list of these 70 estimated national average IQ's by
country.
Because some of the countries included in LV dataset are not included in Sala-i-Martin’s
dataset, our regressions include a maximum of 51 countries. The mean IQ in this dataset is 90.2
and the standard deviation of IQ is 11.4. As noted above, this sample of 51 is notably larger
than Hanushek and Kimko (2000), who relied upon math and science tests from 31 countries.
The national IQ estimate used in our research is the same used by LV: an average of all
same-country IQ studies. However, for 36 of LV's 81 countries, LV rely on just one IQ study to
12
estimate that nation's average IQ. This raises the question of whether one study is enough to
estimate a nation's average IQ. LV answer this question by analyzing the distribution of IQ
scores across various studies of the same country. In these cases, the within-country correlation
between each study's average IQ scores for that country is 0.939. This high intra-country
correlation across studies provides some confidence that one study alone provides a reasonable
estimate of a nation's average IQ. We look forward to reassessing our results as more
comprehensive databases of world IQ estimates become available.
Two published studies have used LV's data in growth regressions: Weede and Kampf
(2002) and Volken (2003). However, both studies used LV's interpolated data as well as the
authentic data, which may distort their results. Weede and Kampf report the results of 14
regressions, some of which include the Barro-Lee (1993) education measures along with other
education measures. They find that national IQ has a large and statistically significant
relationship with growth, even controlling for education measures, similar to our results.
Volken, using a similar dataset focusing on education, reports results from 10 regressions, and
finds that the relationship between IQ and growth becomes unstable once certain education
variables are included. We believe that these inconsistent results probably reflect the decision to
use LV's interpolated data.
We follow the practice of LV, who assume a Flynn effect of 2 or 3 points per decade,
depending on which exam was given. For example, the Iranian average IQ, based on a 1957 test,
was estimated as equal to an 80 when compared to the a similar British test given in 1979.
Because of the Flynn effect, LV assume that Iranian IQ's have risen by an average of two points
per decade since 1957, so Iran's average estimated IQ is inflated to 84 in LV's dataset. This
adjustment, while not ideal, follows the best practice of the psychological profession. Further, it
13
allows us to treat all national IQ scores listed in Table 2 as being in what economists might think
of as “Real 1979 IQ.”
In summary, while LV's dataset has its problems, theirs is the first comprehensive attempt
to assemble studies of IQ from around the world in such a way as to allow direct, international
comparisons. We hope that the results we present will encourage others to delve more deeply
into these intelligence tests. A comprehensive time-series database of such tests would be a
natural next step.
To give an overall impression of how these IQ data compare with test scores used by
other growth economists, Figure 1 shows the relationship between these IQ measures and the
Barro-Lee (1993) national educational achievement scores for math, science, and reading from
23 countries, and Figure 2 compares IQ to Hanushek and Kimko’s (2000) two indices of national
labor quality, based upon math and science examinations. Hanushek and Kim (1995) describe
how these labor quality measures were constructed. Our IQ observations overlap with 27 of
Hanushek and Kimko’s 31 observations.
Note that the Barro-Lee math and science scores have a particularly strong relationship
with national average IQ, and both of Hanushek and Kimko’s measures correlate positively with
IQ. These correlations provides some reason to believe that all of the exams measure a similar
set of mental abilities, however imperfectly. This strong positive correlation would come as no
surprise to cognitive psychologists, who, as noted above, have found that outcomes on tests of
mental ability invariably positively correlate with each other, with the correlation strongest when
the test performance relies on what psychologists refer to as “general intelligence.” Figure 3 is a
simple plot of IQ against real GDP per capita in 1992, measured in Summers-Heston purchasing-
power adjusted dollars.
14
Finally, note that to the extent that our IQ data mismeasure the actual human capital of
the population, and to the extent that such mismeasurements come in the form of independently
distributed error terms, the resulting errors in variables will generally tend to bias our coefficient
estimates downward. Therefore, if IQ is a "Mismeasure Of Man," in Gould's formulation (1981),
then our estimates of IQ's impact on growth may well be too small.
Methodology
Since so many variables could plausibly have an impact on economic growth, the 1990's
witnessed a flood of articles that each introduced and tested the statistical significance of a "new"
variable, such as a nation's land mass, percent Protestant, or percent of GDP devoted to
equipment investment. Many variables were found to have a positive relationship with growth,
but economists were skeptical about whether any causal relationship was underlying the
regressions results, and were also concerned that perhaps the statistical significance was an
artifact of which control variables happened to be included in the regression.
To address these concerns, our methodology is in the spirit of--and, as noted above, uses
data from--Sala-i-Martin's "I Just Ran Two Million Regressions"(1997a). Sala-i-Martin's general
approach is to start with a sizable set of variables plausibly related to growth, and to then run
every single possible regression with that set of variables. Sala-i-Martin then presents summary
statistics designed to give the reader of sense of how often and to what degree a particular
variable was correlated with growth. Sala-i-Martin judges a variable to be statistically
significant if more than 95% of a variable's "cumulative distribution function" was greater than
zero. In practice, this closely corresponds to the case where the average coefficient value across
15
all regressions is two standard errors away from zero (where the standard error, likewise, is an
average across all regressions).
We broadly follow Sala-i-Martin's approach in order to demonstrate that the relationship
between IQ and economic growth is not a mere coincidence, and that it is a relationship as strong
as that between such canonical growth variables as equipment investment and number of years
the economy has been open to trade. In so doing, we implicitly run a stricter Leamer-style
(1983, 1985) "extreme bounds test" on IQ, the results of which we also report.
The key question we want to ask is whether IQ has a robust statistical relationship with a
nation's average growth rate from 1960 to 1992, the time period studied by Sala-i-Martin.
We run four sets of regressions, all of which use the average growth rate of per capita
GDP from 1960 to 1992 as the dependent variable. Following Sala-i-Martin, each regression
includes a total of seven explanatory variables: log per capita GDP in 1960, percent of the age-
relevant population enrolled in primary school in 1960, life expectancy in 1960, the nation's
estimated average IQ (the variable of interest), and three additional control variables.
The three additional control variables are drawn from one of two sets: the 21 variables
that passed Sala-i-Martin's robustness test, or the eight measures of human capital included in
Sala-i-Martin's original dataset. Note that none of these eight education measures passed Sala-i-
Martin's robustness test; the aforementioned primary school enrollment variable was the sole
education variable to meet the 95% threshold value.
We run a separate regression for every possible combination of these variables. This
implies that there are 1330=21!/(18!3!) regressions in the 'top 21' set, and 56=(8!/(5!3!))
regressions in the second set. As noted in the introduction, we rerun all results excluding the
16
OECD countries, in order to address the concern that perhaps IQ tests are biased in favor of the
world's developed Western countries.
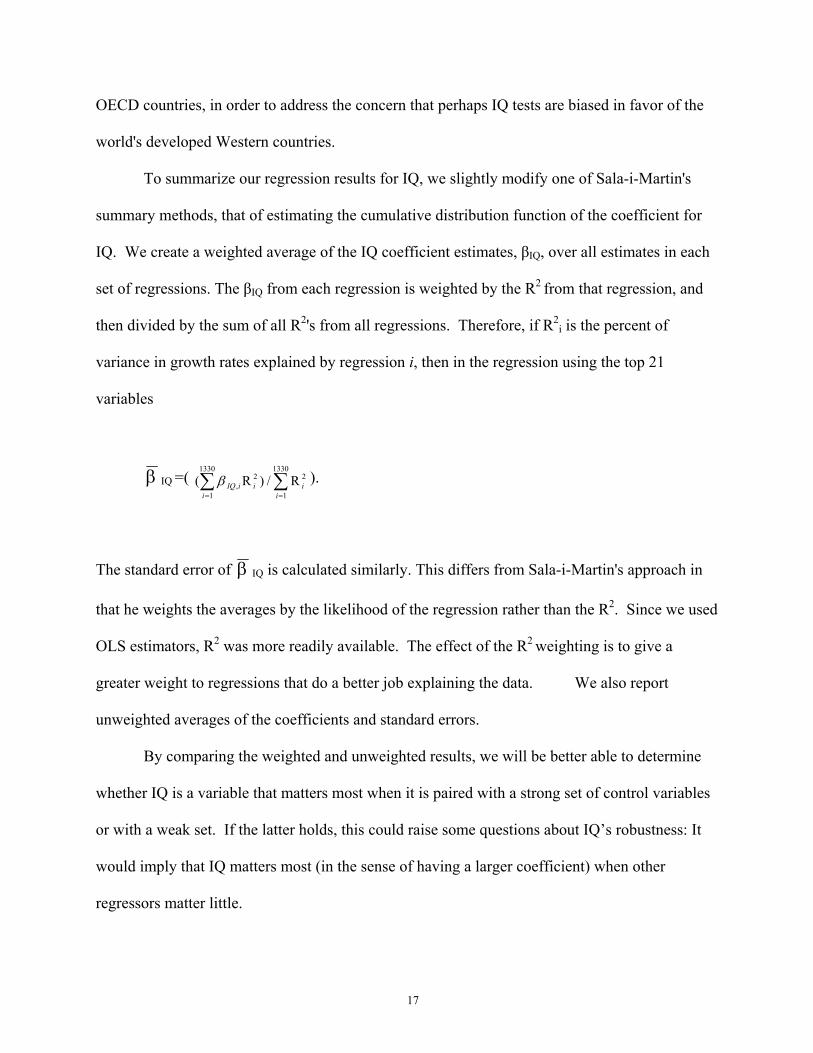
To summarize our regression results for IQ, we slightly modify one of Sala-i-Martin's
summary methods, that of estimating the cumulative distribution function of the coefficient for
IQ. We create a weighted average of the IQ coefficient estimates, βIQ, over all estimates in each
set of regressions. The βIQ from each regression is weighted by the R2 from that regression, and
then divided by the sum of all R2's from all regressions. Therefore, if R2i is the percent of
variance in growth rates explained by regression i, then in the regression using the top 21
variables
β IQ =( ( ). ∑∑==
1330
1
221330
1, R/)R
iii
iiIQβ
The standard error of β IQ is calculated similarly. This differs from Sala-i-Martin's approach in
that he weights the averages by the likelihood of the regression rather than the R2. Since we used
OLS estimators, R2 was more readily available. The effect of the R2 weighting is to give a
greater weight to regressions that do a better job explaining the data. We also report
unweighted averages of the coefficients and standard errors.
By comparing the weighted and unweighted results, we will be better able to determine
whether IQ is a variable that matters most when it is paired with a strong set of control variables
or with a weak set. If the latter holds, this could raise some questions about IQ’s robustness: It
would imply that IQ matters most (in the sense of having a larger coefficient) when other
regressors matter little.
17
The other statistics we report are the minimum value of the lower end of the 95%
confidence interval, βIQ-1.96*σIQ, across all regressions in that set. We also report the percent of
regressions in that set where βIQ was statistically significant. As noted above, due to the lack of
complete data on some countries, we have a total of 51 observations in our dataset.
Results
Table 3 reports our main results. The first two rows report information on the IQ
coefficient using data from all countries, while the third and fourth rows repeat these regressions,
while omitting observations from the OECD countries. We focus attention on the weighted
results, in part because the methodology used in these results is closest Sala-i-Martin’s.
Consider the first row of results: Using data from all countries, and including all possible
3-variable combinations of Sala-i-Martin’s top 21 growth variables as explanatory variables
(along with log GDP per capita in 1960, primary school enrollment in 1960, average lifespan in
1960, and a constant), IQ was statistically significant in 99.7% of the 1330 regressions. Thus, it
failed to reach statistical significance (at the 95% confidence level) in four of these 1330
regressions.
The third column reports the lowest value of the lower end of the confidence interval
from the 1330 regressions; this is the value that must be strictly positive in order to pass
Leamer’s extreme bounds test. The value, -0.0214, means that IQ fails Leamer’s rigorous test in
this case.
However, IQ passes Sala-i-Martin’s less-demanding test quite easily: The weighted
average IQ coefficient is more than five weighted average standard errors from zero, so not only
can we be extremely confident that the true coefficient is not zero, but we can also be 95%
18
confident that the true value lies between 0.0947 and .2173. Thus, raising a nation’s IQ by 10
points is estimated to add between 0.95% and 2.17% to a nation’s annual growth rate, with a
point estimate of 1.56%.
Considering all the results from Table 3, the coefficient on average IQ is at least two
standard errors away from the mean, so even the weakest results for IQ pass Sala-i-Martin’s 95%
confidence-interval test. The results that exclude the OECD countries are weaker (likely due to
restriction of range), but still above the two standard error cutoff.
R2 weighting appears only to strengthen our key results. The fact that the weighted
average yields higher coefficients than the unweighted average means that the highest βIQ
estimates tended to occur in the regressions that also had the highest R2. This has an important
econometric and economic implication: IQ does a better job explaining growth when the other
control variables also do a better job explaining growth. IQ is not a variable that only matters
when the regression contains weak explanatory variables; in fact, just the opposite appears to be
the case. Thus, it would appear that if we had run our regressions using all of Sala-i-Martin’s 62
variables—for 30,856 total regressions—our results would be only stronger.
We also note that IQ easily passes a Leamer-style extreme bounds test when regressed
along with this particular set of education measures: Out of our 56 education regressions using
data from all 51 countries, the extreme lower bound was still positive. Thus, the support for βIQ
appears to be strictly positive when other education variables are included as explanatory
variables in the full-country dataset. It is noteworthy that no three-variable combination of
education measures can eliminate the statistical robustness of IQ. So whether regressed along
with Sala-i-Martin’s top 21 or against other human capital variables, IQ performs extremely
well.
19
Table 4 reports a comparison between IQ and Sala-i-Martin’s best-performing education
variable, primary school enrollment. IQ appears to eliminate the statistical significance of
primary school enrollment in a growth regression: In no case is the primary school enrollment
coefficient twice the size of the standard error, and in most cases it is smaller than the standard
error. Some of the decline in statistical significance of primary school enrollment is likely due to
the fact that the control variables are limited here to Sala-i-Martin’s top 21 variables (a robust set
of regressors) or other education variables (with which primary enrollment is collinear).
However, these econometric problems apply with just as much force to IQ as to primary school
enrollment, but IQ is extremely robust while primary school enrollment loses much of the
robustness it had. 1
While statistical significance is surely not economic significance, it is reasonable to
wonder what these results mean. One might interpret these results as indicating that IQ measures
a key output of the education, socialization, and child-rearing process—an output called general
reasoning ability—while primary school enrollments are a measure of one key input. Inputs are
likely to have a noisy relationship with outputs, so the weak relationship between schooling and
growth is little surprise.
What is a surprise, at least from the point of view of much growth research, is that a
heretofore overlooked measure of educational output—the IQ test—is so robustly related to
growth. Growth economists may know little about how a nation’s stock of human capital is
1 In results not reported here, we estimated sets of regressions similar to those reported in Table 4, but used education measures other than primary school enrollment as the schooling variable. We also estimated separate versions that excluded IQ entirely, in order to assess the marginal importance of IQ in the growth regressions. However, as in Sala-i-Martin’s work, primary school enrollment was the most robust variable among all of the education-related measures we tested. The other education measures were so weakly correlated with growth that we do not report the results here.
20
produced, but it appears that we at least have a tool for measuring a critical portion of that stock
of human of capital.
Further research can now be done to determine exactly what role this form of human
capital plays in the growth process. Is IQ an engine of growth, part of the technology production
function? Or is a high national IQ more critical as a resource for adapting the technologies that
are developed elsewhere? Developing and testing such models is far beyond the scope of this
paper, but we hope that our results spur others to wrestle with these questions.
Finally, for an overall assessment of how IQ compares to other common growth
variables, consider Sala-i-Martin's original results, which used combinations of 62 growth
variables in over two million regressions. Among his top 21 regressors--the ones which he
considered robust--the median regressor was statistically significant in 76.4% of cases, with a
range from 100% (for fraction Confucian) to 2.81% (for revolutions and coups). Fraction
Confucian was the only regressor that passed an extreme bounds test. Only eight of the top 21
had coefficients over three standard errors from zero, while in our full-sample results using his
top 21 growth variables, IQ’s coefficient is over five standard errors away. For his overall best
performing variable, equipment investment, the coefficient estimate was 5.32 standard errors
away from zero. IQ would thus appear to fit comfortably in the top half of Sala-i-Martin's top 21
growth variables.
Conclusion
If human capital accumulation is important in economic development, then it would be
valuable to have a reliable measure of this stock of human capital. The evidence presented here
indicates that general intelligence, as measured by IQ tests, is a reliable indicator of such human
21
capital, and that such general human capital is an extremely important component of economic
growth. IQ outperforms the best-performing measure of human capital in Sala-i-Martin’s widely
used dataset—primary school enrollment—and is statistically significant in all but four out of
1330 full-sample growth regressions. Even when OECD countries are excluded from the
sample, IQ appears to have an economically large and statistically significant positive
relationship with growth.
It would, of course, be extremely valuable to have data from more countries over a longer
time period, and we hope that these encouraging results encourage the collection of cross-
country IQ data in the future.
There is one critical issue we have mentioned here but have not fully addressed: The
endogeneity of IQ over time. We mention the Flynn effect, the 2 to 3 points-per-decade increase
in IQ found in developed countries, an increase that appears to come mostly from a rise in the
bottom of a population’s IQ distribution. This effect gives researchers some reason to believe
that increases in education, reductions in poverty, and increases in overall literacy can increase a
nation’s average IQ.
Our estimates of IQ account for the Flynn effect, but do so imperfectly. In particular,
psychologists are just beginning to understand why the Flynn effect is higher in some countries
rather than others, so we do not make country-specific Flynn effect adjustments to our IQ data.
But as the structure of the Flynn effect becomes clearer, economists and psychologists may
uncover Solow-type convergence results for national average IQ. We hope that the results
presented here will encourage growth economists to join this area of research.
22
And while the endogeneity between IQ and growth is undoubtedly real, our results raise
the question: Since so many growth variables are contaminated by endogeneity problems, why
don’t these other contaminated variables perform at least as well as IQ?
The robust relationship between IQ and growth requires an explanation, but a complete
explanation is beyond the scope of this paper. The simplest explanation may turn out to be the
best: National average IQ is a better measure of general human capital than any of the other
measures tested here.
23
References Barro, Robert J. and Jong-Wha Lee (1993). “International Comparisons of Educational
Attainment,” Journal of Monetary Economics, 32,3 (December), 363-394. Data available at www.nber.org.
Brown, R.T., Reynolds, C. R., Whitaker, J. S. (1999). “Bias in mental testing since Bias in Mental Testing,” School Psychology Quarterly, 14, 208-238.
Carroll, J.B. (1993). Human cognitive abilities: A survey of factor-analytic studies. New York: Cambridge University Press.
Court, J. H. (1991). “Asian applications of Raven's Progressive Matrices,” Psychologia, 34, 75-85.
Daley, T. C., Whaley, S. E., Sigman, M. D., Espinosa, M. P., Neumann, C. (2003). “IQ on the rise: The Flynn effect in rural Kenyan children,” Psychological Science, 14, 215-219.
Deary , I. J. (2003) “Reaction time and psychometric intelligence: Jensen’s contributions,” In H. Nyborg (Ed.), The scientific study of general intelligence: Tribute to Arthur R. Jensen (pp. 53-75). Amsterdam: Pergamon.
Flugel, J. (1947). “An inquiry as to popular views on intelligence and related topics,” Journal of British Educational Psychology, 27, 140-152.
Flynn, J. R. (1987). “Massive IQ gains in 14 nations,” Psychological Bulletin, 101, 171-191. Furnham, A. (2001). “The shape of self-evaluation: Implicit theories of intelligence and
judgments of intellectual ability,” Personality and Individual Differences, 31, 1381-1405. Gottfredson, L. (1997). “Why g matters: The complexity of everyday life,” Intelligence, 24, 79-
132. Gould, S. J. (1981). The mismeasure of man. New York: W. W. Norton/Harmondsworth, U. K.:
Penguin Books. Hanushek, Eric, and Kim, Dongwook (1995). “Schooling, Labor Force Quality, and Economic Growth,” National Bureau of Economic Research (Cambridge, MA) Working Paper No. 5399, December. Hanushek, Eric, and Dennis Kimko (2000). “Schooling, Labor Force Quality, and the Growth of Nations,” American Economic Review, 90, 1184-1208. Hoover, Kevin D. and Perez, Stephen J. (2000). “Truth and robustness in cross-country growth regressions.” Manuscript, UC Davis. Jensen, A.R. (1980). Bias in mental testing. New York: Free Press. Jensen, A.R. (1998). The g-factor: The science of mental ability. Westport, CT: Praeger. Leamer, Edward E. (1983). “Let’s Take the Con Out of Econometrics,” American Economic
Review, 73:3, 31-43. Leamer, Edward E. (1985). “Sensitivity Analysis Would Help,” American Economic Review,
75,5, (June), 31-43. Mankiw, N. Gregory, David Romer, and David Weil (1992). “A Contribution to the Empirics of
Economic Growth,” Quarterly Journal of Economics, 107: 407-38. Murray, C. A. (1997). “IQ and economic success,” The Public Interest, 128, 21-35. Neisser, U., Boodoo, G., Bouchard, T.J., Jr., Boykin, A.W., Brody, N., Ceci, S.J., Halpern, D.F.,
Loehlin, J.C., Perloff, R., Sternberg, R.J., & Urbina, S. (1996). “Intelligence: Knowns and unknowns,” American Psychologist, 51, 77–101.
Nettelbeck, T. (2003) “Inspection time and g,” in H. Nyborg (Ed.), The scientific study of general intelligence: Tribute to Arthur R. Jensen (pp. 77-91). Amsterdam: Pergamon.
24
Ree, M. J., Carretta, T. R., & Green, M. T. (2003). “The ubiquitous role of g in training,” in H. Nyborg (Ed.), The scientific study of general intelligence: Tribute to Arthur R. Jensen (pp. 261-274). Amsterdam: Pergamon.
Rushton, R. J. & Rushton, E. W. (2003). “Brain size, IQ, and racial-group differences: Evidence from musculoskeletal traits,” Intelligence, 31, 139-155.
Sala-i-Martin, Xavier X (1997a). “I Just Ran Two Million Regressions,” American Economic Review, 87: 2, 178-183. Data available at www.columbia.edu/~xs23.
Sala-i-Martin, Xavier X (1997a). “I Just Ran Four Million Regressions,” National Bureau of Economic Research Working Paper 6252.
Shipstone, K. & Burt, S. (1973). “25 years on: A replication of Flugel’s (1947) work on popular views of intelligence and related topics,” Journal of British Educational Psychology, 56, 183-187.
Seligman, D. (1992). A question of intelligence: The IQ debate in America. New York: Birch Lane Press.
Sternberg, R. J. & Grigorenko, E. L. (2001) Enviromental effects on cognitive abilities. Mahwah, New Jersey: Lawrence Erlbaum Associates, Publishers.
Volken, Thomas (2003). “IQ and the Wealth of Nations. A Critique of Richard Lynn and Tatu Vanhanen's Recent Book,” European Sociological Review, 19: 411-412.
Weede, Erich and Sebastian Kampf (2002). “The Impact of Intelligence and Institutional Improvements on Economic Growth,” Kyklos, 55:361-380.
Wickett, J. C. Vernon, P. A., Lee, D. H. (2000). “Relationships between factors of intelligence and brain volume,” Personality and Individual Differences, 29, 1095-1122.
25
Table 1: Variables from Sala-i-Martin (1997a,b) Twenty-one variables passing Sala-i-Martin’s “Two Million Regressions” test, in rank order: 1. Equipment Investment + 2. Number of Years Open Economy + 3. Fraction Confucian + 4. Rule of Law + 5. Fraction Muslim + 6. Political Rights + 7. Latin America Dummy – 8. Sub-Saharan Africa Dummy – 9. Civil Liberties + 10. Revolutions and Coups – 11. Fraction of GDP in Mining + 12. Std. Dev. of Black Market Premium – 13. Fraction of GDP in Primary Exports in 1970 – 14. Degree of Capitalism + 15. War Dummy – 16. Non-Equipment Investment + 17. Absolute Latitude + 18. Exchange Rate Distortions – 19. Fraction Protestant – 20. Fraction Buddhist + 21. Fraction Catholic – Variables Included in all Sala-i-Martin Regressions Log (GDP per capita, 1960) + Rate of Primary School Enrollment, 1960 + Life Expectancy, 1960 + Other Education Measures Rate of Secondary School Enrollment – Rate of Higher Education Enrollment – Average Years of Primary Education in Total Population – Average Years of Secondary Education in Total Population + Average Years of Higher Education in Total Population – Average Years of Overall Education in Total Population – Average Years of Overall Education in Total Population*(log(GDP per capita, 1960) – Percent of GDP Spent on Education + Note: + and – signs indicate whether more of that value is good or bad for economic growth in the 1960-1992 period, according to Table 1 of Sala-i-Martin (1997b). Source: Sala-i-Martin (1997a, b)
26
Table 2: Estimated National Average IQ
IQ IQ
Argentina* 96 Kenya* 72
Australia* 98 Korea, South* 106
Austria* 102 Lebanon 86
Barbados 78 Malaysia* 92
Belgium* 100 Marshall Islands 84
Brazil* 87 Mexico* 87
Bulgaria 93 Morocco* 85
Canada* 97 Nepal* 78
China 100 Netherlands* 102
Congo (Brazzaville) * 73 New Zealand* 100
Congo (Zaire) * 65 Nigeria 67
Croatia 90 Norway* 98
Cuba 85 Philippines* 86
Czech Republic 97 Poland 99
Denmark* 98 Portugal* 95
Ecuador* 80 Puerto Rico 84
Egypt* 83 Qatar 78
Fiji* 84 Romania 94
Finland* 97 Samoa (Western) 87
France* 98 Singapore* 103
Germany* 102 Slovakia 96
Ghana* 71 Slovenia 95
Greece* 92 South Africa* 72
Guatemala* 79 Spain* 97
Guinea 66 Sudan 72
Hong Kong* 107 Sweden* 101
Hungary 99 Switzerland* 101
India* 81 Taiwan* 104
Iran* 84 Tanzania* 72
Iraq* 87 Turkey* 90
Ireland* 93 Uganda* 73
Israel* 94 United Kingdom* 100
Italy* 102 United States* 98
Jamaica* 72 Uruguay* 96
Japan* 105 Zambia* 77 Note: Asterisk indicates inclusion in regression results reported below. Source: Lynn and Vanhanen (2002)
27
Table 3: IQ's relationship with economic growth, 1960-1992 β IQ β IQ βIQ-1.96σIQ Percent No. of (unweighted) (weighted) Lower Bound Significant Regressions All Countries, 0.1229 0.1560 -0.0214 99.7% 1330 Controls: Top 21 (0.0245) (0.0313) All Countries, 0.1499 0.1926 0.0919 100% 56 Controls: Educ (0.0228) (0.0293) Non-OECD, 0.1030 0.1339 -0.1660 62.8% 1330 Controls:Top 21 (0.0479) (0.0624) Non-OECD, 0.1308 0.1665 -0.0056 96.4% 56 Controls: Educ (0.0429) (0.0545) Note: β IQ represents the average across all regressions of the effect of a one-point increase in a nation's average IQ on average annual economic growth, in percent. Standard errors (unweighted and weighted averages across all regressions) are in parentheses. “Lower Bound” is the minimum value of lower bound of the 95% confidence interval across all regressions. "Percent significant" is the percent of regressions where IQ was statistically significant at the 95% level. In all regressions, log GDP per capita in 1960, primary school enrollment in 1960, and average lifespan in 1960 are included as additional explanatory variables.
28
Table 4: Explaining Growth: IQ versus Primary School Enrollment β IQ β IQ β PS% β PS% No. of (unweighted) (weighted) (unweighted) (weighted) Regressions All Countries, 0.1229 0.1560 1.5185 1.9183 1330 Controls: Top 21 (0.0245) (0.0313) (1.2572) (1.5954) All Countries, 0.1499 0.1926 0.7164 0.9033 56 Controls: Educ (0.0228) (0.0293) (1.3154) (1.6889) Non-OECD, 0.1030 0.1339 0.8836 1.1323 1330 Controls:Top 21 (0.0479) (0.0624) (2.0569) (2.6838) Non-OECD, 0.1308 0.1665 0.1198 0.1347 56 Controls: Educ (0.0429) (0.0545) (2.1241) (2.6967) Note: β IQ represents the average across all regressions of the effect of a one-point increase in a nation's average IQ on average
annual economic growth, in percent. β PS% represents the average across all regressions of the effect on growth of moving from 0% to 100% enrollment of the primary-school-aged population. Standard errors (unweighted and weighted averages across all regressions) are in parentheses. In all regressions, log GDP per capita in 1960, primary school enrollment in 1960, and average lifespan in 1960 are included as explanatory variables.
29
Figure 1
IQ and Barro-Lee (1993) Achievement Measures
30
35
40
45
50
55
60
65
70 80 90 100 110IQ
Ach
ieve
men
t Sco
res
Math
Science
Reading
South Africa
Singapore
30
Figure 2
IQ and Hanushek and Kimko (2000) Labor Quality Estimates
0
10
20
30
40
50
60
70
80
80 85 90 95 100 105 110
IQ
H/K
Lab
or Q
ualit
y M
easu
re
QL1QL2
India
Hong Kong
Note: QL1 and QL2 are indices of labor quality used in Hanushek and Kimko (2000) and developed in Hanushek and Kim (1999).
31
Figure 3
IQ and 1992 GDP per capita (Summers-Heston PPP$)
100
1000
10000
100000
60 70 80 90 100 110IQ
GD
P pe
r cap
ita
Source: Sala-I-Martin (1992) and Lynn and Vanhanen (2002)