Intelligent Method based Optimal Reallocation of Generators for Enhancement of System Security for N-1 Contingency in Power SystemsB. Sravana Kumar1, M.Suryakalavathi 2 and G.V.Nagesh Kumar 1
Abstract: Due to privatization of the power industry, proper utilization of the available resources has become a very important factor. Optimal power flow (OPF) is an ideal solution to the problem. At the same time, stable operation of the power systems in both normal and contingency condition is of vital importance. Use of Facts devices is a good method to stop further contingencies in the power system. In this paper, a combined index based strategy for the optimal placement of Thyristor Controlled Series Compensator (TCSC) and optimal tuning of generators using Krill Herd Algorithm has been proposed for contingency management. The TCSC has been placed on the basis of an index which is a combination of Line Utilization Factor (LUF) and Fast Voltage Stability Index (FVSI). A probability based approach has been adopted for the placement of the device. A multi objective function has been chosen for tuning the generators. The multi-objective function includes voltage deviation, active power generation cost and transmission line loss. The proposed method has been tested and implemented on an IEEE 30 bus system.
Keywords: Optimal Reallocation; TCSC; Krill Herd Algorithm; Voltage Stability.
1. INTRODUCTIONAs a result of the increase in competition in the electrical industry, finest use of the obtainable power supplies has become mandatory. On the other hand, due to rise in power flow the transmission lines are continuously facing a problem of congestion because of carrying power at their extreme transmission limits and sometimes higher. Continuous overloading of the transmission lines can cause an excessive risk to power system security, reliability and stability.
Optimal power flow is a method of optimizing an objective function in the presence of operational constraints by the method of nonlinear programming. Many methods have been developed so far to solve the OPF problem [1]. Metaheuristic methods are one of the most recent methods used for the OPF problem. Nanda Kumar et al. [2] proposed optimal power flow method to determine the steady state operation point which minimizes multiple objectives and at the same time improves the system performance. Vijay kumar et al [3] demonstrated the effect of TCSC on congestion of transmission lines by optimal power flow method using Genetic algorithm. Rao et al [4] have used OPF technique in the presence of SVC for the improvement of network security under contingency condition. The performance of BAT and Firefly algorithm have been compared to determine the optimal location and size of Static VAR Compensator (SVC) in a power system to improve voltage stability for a multi objective function [5]. Mangaiyarkarasi [6] proposed a modified severity index and probability of severity based approach for the placement of
B. Sravana Kumar, M.Suryakalavathi, G.V.Nagesh Kumar282
Static VAR Compensator in order to improve the voltage stability. Prasad et al. [7] proposed Symbiotic Organisms Search (SOS) for the solution of optimal power flow of power systems with FACTS devices for a multi objective function. Several authors have used metaheuristic algorithms for obtaining the optimal location of FACTS devices for various objective functions [8, 9, 10].
Mishra et al [11] proposed the placement of Interline Power Flow Controller (IPFC) for the reduction of congestion of the transmission lines. The Line severity index used is found to a very efficient method of estimation of loading of the transmission lines. Ya-Chin et al. [12] have used multi-objective Particle Swarm optimization method for the installation of SVC to improve transmission system loading margin (LM) to a certain degree and reduce network expansion cost. Nam et al [13] have suggested optimal placement of SVC in power market that voltage stability is increased by PV curve as well as social welfare is increased by Locational Marginal Price (LMP). Shaheen et al [14] has used computational intelligence method namely DE has been used to find the optimal location and size of UPFC on the basis of performance index for N-1 contingency condition. Mishra et al. [15] proposed placement of IPFC using an index which is a combination of real power performance index and line stability index, for management of contingency. The IPFC was then tuned using Differential Evolution (DE). The proposed index is found to be a more accurate measure of severity in comparison to the individual indices. It is also found that use of line voltage stability index is a good option for the measurement of voltage stability for series devices. Optimal reallocation of generators is necessary for the optimal utilization of the available power system resources. The advantages of the method can be further improved by the placement of FACTS devices. Series FACTS devices are most suitable for enhancing the transmission capabilities. The FACTS device should be correctly placed in the system in order to enhance its effectiveness. Krill Herd Algorithm [16] was introduced in the year 2012. This recent algorithm has been implemented in different fields and has been found to be very successful [17, 18].
In this paper, optimal reallocation of generators has been proposed for the management of contingency condition in the power systems. Krill Herd Algorithm has been used for the optimal power flow in the presence of TCSC. The optimal reallocation of generators has been done for a multi-objective function, specifically, reduction in voltage deviation, reduction of fuel cost and reduction in transmission line loss. The real and reactive power generation values and voltage limits for buses are taken as constraints, during the optimization. The results of optimal tuning without and with TCSC have been compared to prove the effectiveness of the proposed method.
2. MODEL OF TCSCThyristor Controlled Series Compensator (TCSC) is a series FACTS device. It can be used for both
lead and lag compensation in the transmission lines. This is because of its operation in different modes like blocking mode in which inductive branch is opened, bypass mode in which it operates in parallel mode both as capacitor and inductor, and capacitive boost mode. The following are the advantages of TCSC
● ability to maintain balance in the reactive power,
● reducing the damped oscillations in the system,
● Improvement in the stability of the system at post contingency.
● Capability to improve the power transfer limits of the transmission lines to some extent.
The TCSC model between the buses j and k is shown as follows
Intelligent Method based Optimal Reallocation of Generators for Enhancement of System Security... 283
Fig. 1 Transmission line model with TCSC
The power flow equations of the transmission line would change as follows after adding the TCSC
( )2jk jP cos sinjk j k jk jk jk jkV G V V G B−= δ + δ (1)
2
jk jQ ( sin cos )jk j k jk jk jkV B V V G B jk= − − δ − δ (2)
2jk kP ( cos sin )jk j k jk jk jkV G V V G B jk= − δ − δ (3)
2jk kQ ( sin cos )jk j k jk jk jkV B V V G B jk= − + δ − δ (4)
Where
2jk 2G jk
jk
RR X= +
(5)
2jk 2B
jkX
R X= + (6)
jk jk TCSCX X -X= (7)
jkδ is the voltage angle between bus j and k.
The reactive constraint on the TCSC is given as –0.8 Xjk ≤ XTCSC ≤ 0.2 Xjk.
3. PROPOSED COMBINATORY INDEXA mbinatory index is formulated using LUF and FVSI index as given in equation 8.
1 1 1 2W WCI I I= × + × (8)
Where w1 and w2 are the weighting factors.
I1 is the Line Utilization Factor is an index used for determining the congestion of the transmission lines.
LUF-Index given by equation (9)
1 max
MVAijMVAij
I = (9)
MVAij (max): Maximum MVA rating of the line between bus i and bus j.
MVAij : Actual MVA rating of the line between bus i and bus j.
B. Sravana Kumar, M.Suryakalavathi, G.V.Nagesh Kumar284
LUF gives an estimate of the percentage of line being utilized.
The most severe line affected can be found by a voltage stability index called Fast Voltage Stability Index Factor (FVSI). It is introduced by Musirin and Rahman. It calculates the voltage stability of a given bus under any loading conditions. It is defined as follows
I2 is the Fast Voltage Stability Index (FVSI) given by equation (10)
2
2 24 Z QjVi X
I = (10)
Where, Z is the impedance of line, X is the line reactance, is the voltage at the sending end and is the reactive power at the receiving end.
4. PROBLEM FORMULATIONA multi-objective function including of fuel cost, real power loss and voltage deviation is used for the optimal tuning of generators.
Min F = Min (w1*F1+w2*F2+w3* F3) (11)
Where,
F1 is the Fuel cost given by-
2
Gi1
F1 min( [ ] )i
ng
i i G i
i
a b P c P=
= + +∑ (12)
Ng is the number of generators in the power system and a, b, c are the fuel cost coefficients.
F2 is the Real power loss
i ijk kj
1
F2 min (ntl
i
real S S=
= + ∑ (13)
Where ntl is number of transmission lines, Sjk is the total complex power flows from bus j to bus k in line i.
F3 is the Voltage deviation
ref
k
2
1
F3 min( ) min( )Nbus
kk
VD V V=
= = −∑ (14)
Vk is the actual value of voltage magnitude at bus k and Vkref is the reference value of voltage magnitude
at the bus.
Power Balance Constraint
1 1
N NGi Di L
i iP P P
= == +∑ ∑ (15)
Where i = 1, 2, 3... N and N = no. of. Bus
Voltage balance constraint
min maxGi Gi GiV V V≤ ≤ (16)
Intelligent Method based Optimal Reallocation of Generators for Enhancement of System Security... 285
Where Gi=1, 2, 3... ng and ng = number of Generator buses.
Generation limit real power
min max
Gi Gi GiP P P≤ ≤ (17)
Where, Gi=1, 2, 3... ngPL is the active power loss of the system, PGi is the active power generated at bus i, PDi is the power demand at bus i, N is the number of buses and ng is number of generators. The voltage limits of the generator buses are taken between 0.9 pu and 1.1 pu.
5 KRILL HERD ALGORITHMKrill Herd (KH) algorithm is a Meta-heuristic algorithm inspired by nature, based on the herding behavior of the krill individuals, proposed by Gandomi and Alavi in 2012. The distance of each krill from the food source is the main objective of the krill movement.
The herding of krill is based on two main goals:
1. Increase the density and
2. Reach the food
The position of the krill individual is mainly influenced by three important factors:
3. Movement induced by the krill individuals
4. Foraging activity
5. Random diffusion
All individual krill, in this mechanism, move towards the finest probable solution when searching for highest density and food. By extending the algorithm to an n-dimensional, the fitness function of the algorithm (for ithkrill individual) is determined below:
ii i i
dx N F Ddt
= + + (18)
Where, Ni is the motion induced on ith krill individual due to the other krill individuals, Fi is the foraging motion and Di is the random diffusion. The procedure followed for Krill Herd is mentioned in Fig. 2
B. Sravana Kumar, M.Suryakalavathi, G.V.Nagesh Kumar286
Fig. 2 Detailed Procedure for Krill Herd Algorithm
6. PROPOSED METHODOLOGYThe flowchart showing the steps followed to perform the optimal power flow in the presence of TCSC has been shown in Fig. 3
Intelligent Method based Optimal Reallocation of Generators for Enhancement of System Security... 287
Fig. 3 Flowchart for illustration of the proposed methodology
7. RESULTS AND DISCUSSIONThe proposed methodology has been implemented on an IEEE 30 bus system shown in Fig.4. Initially the proposed methodology has been tested for normal condition. A line outage condition has then been taken into consideration to test the proposed method under adverse conditions. The parameters of TCSC used are PTCSC = 0.482149p.u. and QTCSC = 0.01123p.u. & X = 0.002p.u.
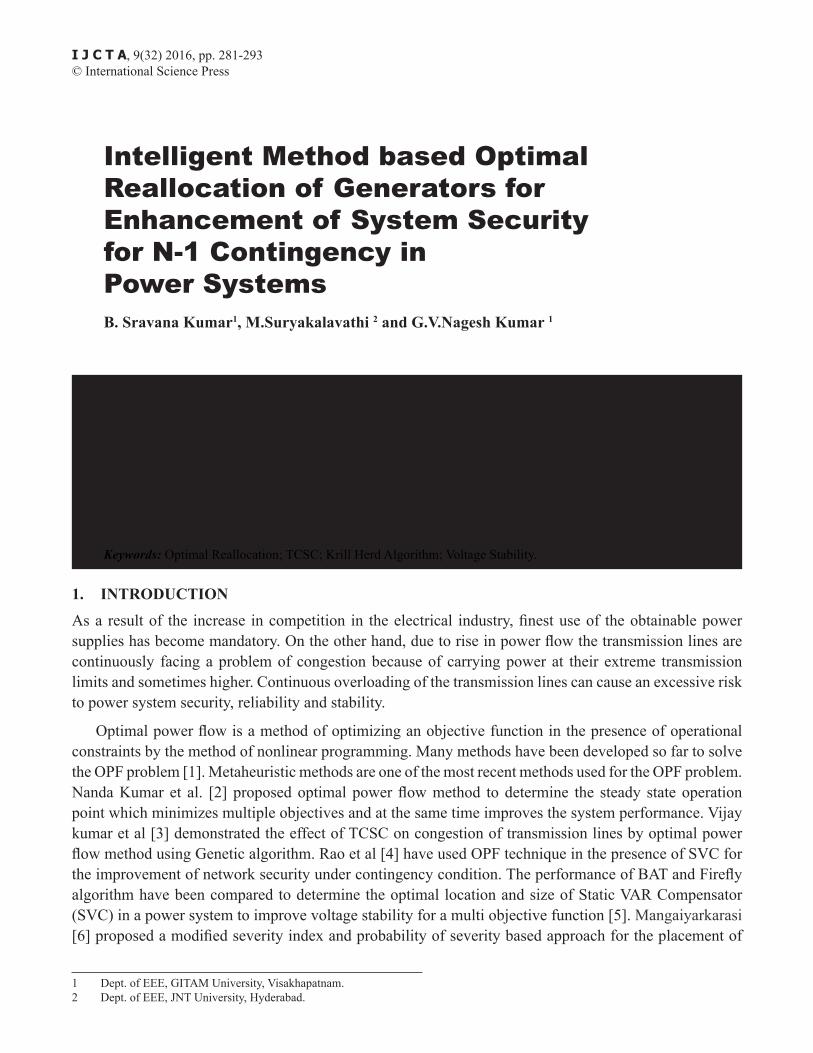
Contingency analysis for the IEEE 30 bus system is performed and the details of the indices after every contingency are mentioned in Table 1.CI gives an estimate of the overall stress on the lines as a result of various contingencies. Fig, 5 shows the probability of severity of lines due to various line outages. It is observed from Fig. 5 that line 9-10 has the maximum probability of severity due to various contingencies.
B. Sravana Kumar, M.Suryakalavathi, G.V.Nagesh Kumar288
Fig.4 IEEE 30 bus system with15-23 contingency
Table 1. Severity of lines for various line outages in decending order of CI
Intelligent Method based Optimal Reallocation of Generators for Enhancement of System Security... 289
Fig. 5. CI values for various line outage of IEEE 30 bus system
Fig. 6. Objective Function value with the Variation of Krill Herd Parameters
Different combinations of NR and NK have been used and the value of the objective function has been presented in Fig. 6. It is observed that NR = 20 = NK, which has been used for the study, gives the minimum average and best value of the objective function. Different combinations of weights have been compared in Table 2. It is observed that w1 = 0.7, w2 = 0.15, w3 = 0.15 gives the minimum value of the objective function equal to 192 p.u. Hence, the above values of the weights have been used for the study.
Table 2. Different Combinations of Weights vs. objective function
solution number weight
w1 w2 w3 f1
1 0.7 0.15 0.15 192
2 0.55 0.3 0.15 379.52
3 0.4 0.45 0.15 567
4 0.25 0.6 0.15 773.56
5 0.1 0.75 0.15 958.9
6 0.3 0.4 0.3 509.2
Table 3. Comparison of Real and Reactive power losses with placement of TCSC in different locations under 15-23 contingency
S.NoTCSC placement Real power losses
(MW)Reactive power losses
(MVAR)From bus To bus
1 9 10 5.12 6.46
2 4 12 5.64 7.71
3 3 4 5.68 8.61
4 6 10 5.34 6.51
The real and reactive power losses for different placement locations of the TCSC device have been compared in Table 3. It is observed that line 9-10 is the best suitable location for the placement of TCSC. In table 4 different parameters of the system have been compared for different system conditions. It is observed that the severity of the system is increased due to the outage of line 15-23. Optimal placement and sizing of the TCSC using KH reduces the severity to a great extent.
B. Sravana Kumar, M.Suryakalavathi, G.V.Nagesh Kumar290
Table 4. Comparison of Results for without & with 15- 23 contingency, with optimal placement of TCSC at 9-10 and optimal
sizing of TCSC using Krill HerdS. No. Parameter Values in different system state
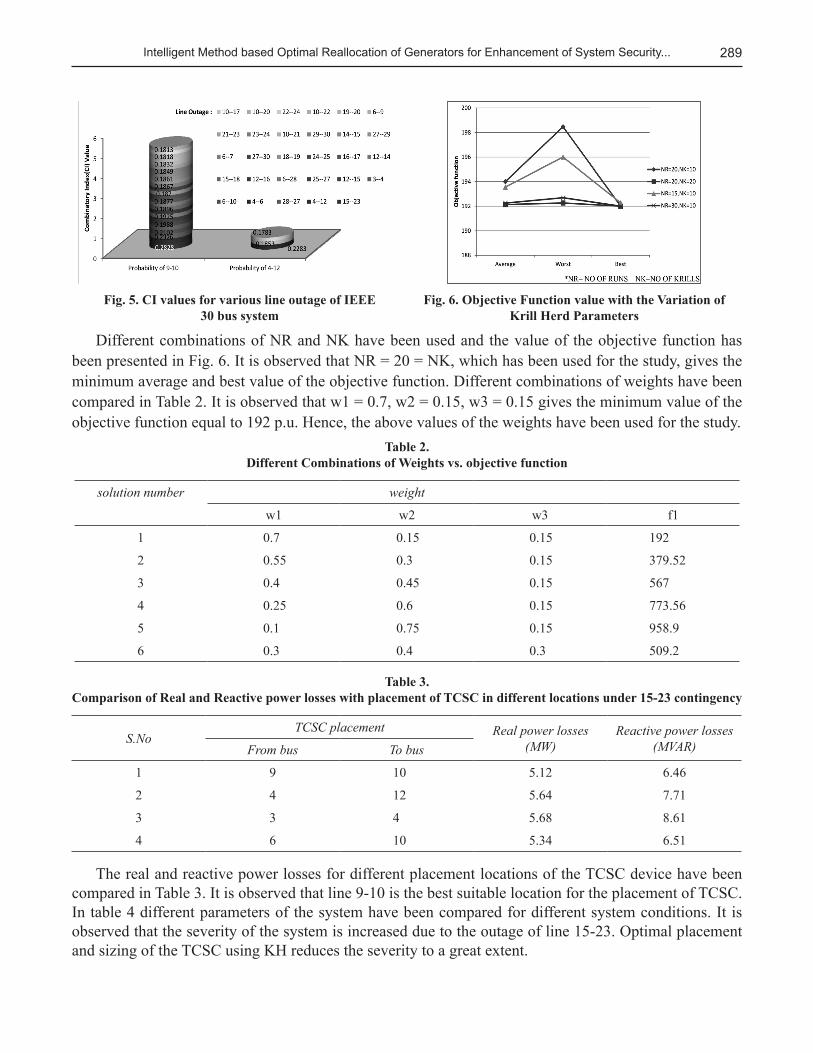
Various system parameters, namely, real power loss, generation cost, voltage deviation, and real power generation at each generator bus for individual objectives and multi-objective function have been compared in Fig. 7, 8, 9, and 10 respectively. It is observed that for a single objective function only one aspect of the system is reduced. A multi objective function is observed to be more suitable for catering to multiple aspects of the power system parameters.
Fig. 8 Generation cost vs. objective function Fig. 9 Voltage deviation vs. objective function
Fig. 10 Real power generation vs. objective function
Intelligent Method based Optimal Reallocation of Generators for Enhancement of System Security... 291
*OF: Objective Function
OF1: only losses
OF2: only cost
OF3: only voltage deviation
OF4: multi objective functionTable 5.
Comparison of Real power losses, Cost & Voltage deviation for different line outages with TCSC placed at 9-10
Loading Condition Parameters KH
KH OPF without TCSC
KH OPF with TCSC
Without Contingency
TCSC Rating (p.u.) - 0.002
Total Real power generation(MW) 290.011 288.77
Real power losses (MW) 6.618261 5.472154
Total generation cost ($/hr) 1365.33 1254.32
Voltage Deviation (p.u.) 1.835553 0.410978
With Contingency
15-23
TCSC Rating (p.u) - 0.002
Total Real power generation (MW) 289.23 288.5
Real power losses (MW) 5.863573 5.121716
Total generation cost($/hr) 1367.25 1255.89
Voltage Deviation(p.u.) 1.724115 0.46593
4-12
TCSC Rating(p.u.) - 0.002
Total Real power generation (MW) 292.56 290.54
Real power losses (MW) 9.173 7.157
Total generation cost($/hr) 1373.39 1258.25
Voltage Deviation(p.u.) 3.4644 0.36164
27-28
TCSC Rating(p.u.) - 0.002
Total Real power generation (MW) 293.385 291.69
Real power losses (MW) 9.99 8.298
Total generation cost($/hr) 1374.29 1364.62
Voltage Deviation(p.u.) 3.3258 1.182
6-10
TCSC Rating(p.u.) - 0.002
Total Real power generation (MW) 294.08 288.86
Real power losses (MW) 10.7 5.482
Total generation cost($/hr) 1392.22 1258.19
Voltage Deviation (p.u.) 2.5379 0.4229
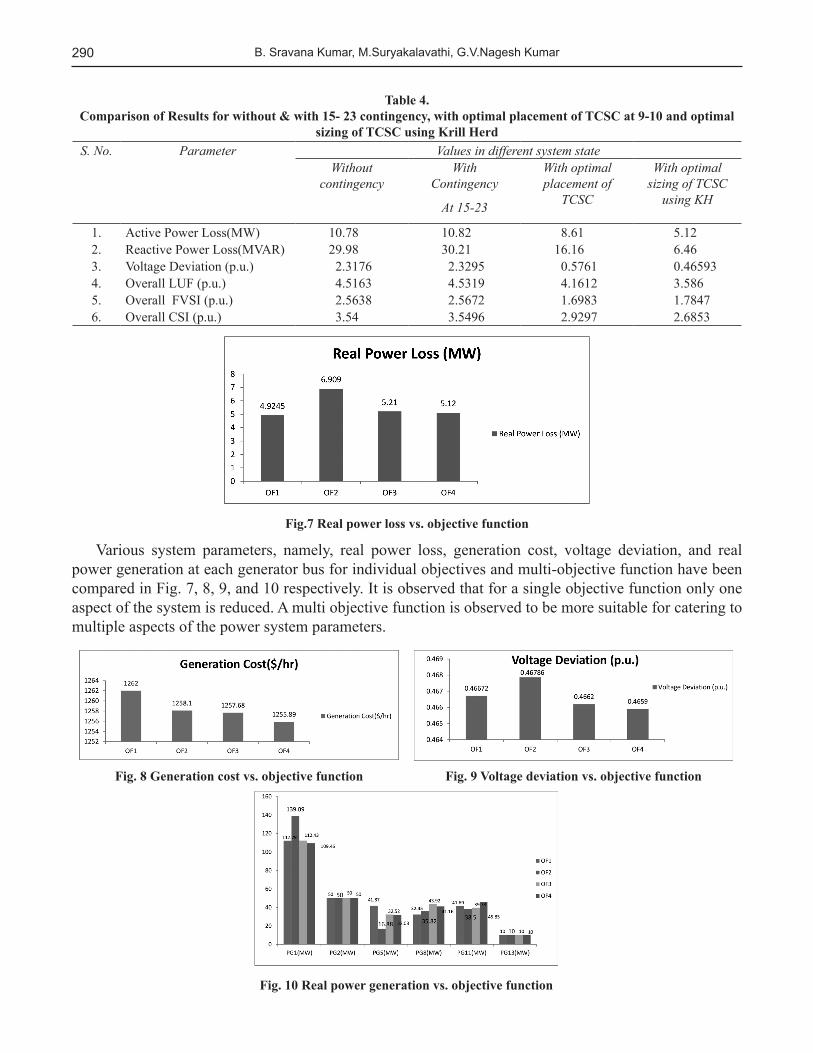
The system parameters are also studied for some other contingencies and the result has been compared in Table 5.The voltage profile of the 30 bus system for OPF without and with TCSC has been compared in Fig.11. The voltage profile of the system improves greatly when Krill OPF is performed in the presence of TCSC.
B. Sravana Kumar, M.Suryakalavathi, G.V.Nagesh Kumar292
Fig. 11 Comparison of bus voltages for 30 bus system using Krill Herd OPF without & with TCSC
8. CONCLUSIONContingency in power system is one of the most hazardous problems of power systems. Optimal power flow is an essential requirement for effective utilization of the power system resources. Effective use of FACTS devices can prove very beneficial in this respect. In this paper,
● Optimal power flow method in the presence of TCSC has been suggested for overcoming the instability issues of the power systems due to line outages and reduction of losses.
● A multi-objective function has been considered for the purpose. The multi-objective function consists of - voltage deviation, active power generation cost and transmission line loss.
● OPF in the presence of TCSC is found to be a very effective method of reducing the severity of the power system.
● Although TCSC is basically a series device the voltage profile of the system improves considerably.
● The proposed methodology has been tested for an IEEE 30 bus system.
References1. J.A.Momoh, M.El-Hawary, R.Adapa:A review of selected optimal power flow literature to 1993. II. Newton, linear
programming and interior point methods. IEEE Trans. Power Syst.14(1),105–111(1999)
2. Nanda Kumar, R. Dhanasekaran:Optimal Power Flow with FACTS Controller Using Hybrid PSO.Arabian Journal for Science and Engineering. 39 (4), 3137-3146(2014).
3. K, Vijay Kumar.: Optimal Location of FACTS Devices for Congestion Management in Deregulated Power Systems. International Journal of Computer Applications (0975-8887), 16(6), (2011).
4. B.Venkateswara Rao, G.V.Nagesh Kumar, “Optimal location of Thyristor Controlled Series Capacitor to Enhance Power Transfer Capability Using Firefly Algorithm.”, Electric Power Components and Systems, Taylor and Francis, pp.1541-1553. Vol. 42, Issue 14, 2014.
5. B.Venkateswara Rao, G.V.Nagesh Kumar, “Sensitivity Analysis based Optimal Location and Tuning of Static VAR Compensator using Firefly Algorithm to enhance Power System Security”, Indian Journal of Science and Technology, August 2014, Volume 7, No: 8, Page(s): 1201–1210, Gandhi nagar, Adyar, Chennai, India.
Intelligent Method based Optimal Reallocation of Generators for Enhancement of System Security... 293
6. P. Mangaiyarkarasi, T. SreeRenga Raja:Optimal Location and Sizing of Multiple Static VAr Compensators for Voltage Risk Assessment Using Hybrid PSO-GSA Algorithm.Arabian Journal for Science and Engineering. 39(11), 7967-7980(2014).
7. D. Prasad, V.Mukharjee, March: A novel symbiotic organisms search algorithm for optimal power flow of power system with FACTS devices. Engineering Science and Technology, an International Journal.19 (1), 79-89(2016).
8. B.Venkateswara Rao, G.V.Nagesh Kumar, “Optimal Power Flow by BAT Search Algorithm for Generation Reallocation with Unified Power Flow Controller.” International Journal of Electrical Power and Energy Systems, Elsevier,Volume 68, Issue 1, 2015,Pages: 81-88.
9. B.Venkateswara Rao , G.V.Nagesh Kumar , M.Ramya Priya , and P.V.S.Sobhan, “Implementation of Static VAR Compensator for Improvement of Power System Stability”, International Conference on Advances in Computing, Control, and Telecommunication Technologies, ACT 2009 organized by ACEEE and CPS, Trivandrum, Kerala, India, during 28-29 December, 2009, Pages: 453-457
10. B.Venkateswara Rao , G.V.Nagesh Kumar , M.Ramya Priya , and P.V.S.Sobhan, “Optimal Power Flow by Newton Method for Reduction of Operating Cost with SVC Models”, International Conference on Advances in Computing, Control, and Telecommunication Technologies, ACT 2009 organized by ACEEE and CPS, Trivandrum, Kerala, India, during 28-29 December, 2009, Pages: 468-470.
11. A. Mishra, V.N.K., Gundavarapu: Line utilisation factor-based optimal allocation of IPFC and sizing using firefly algorithm for congestion management. IET Generation, Transmission & Distribution.10 (1), 115-122(2016).
12. Ya-Chin Chang: Multi-Objective Optimal SVC Installation for Power System Loading Margin Improvement. IEEE Transactions on power systems.27 (2), 984-992(2012).
13. T.P. Nam, D. T. Viet La Van Ut: Optimal Placement of SVC in Power Market. IEEE 9th Conference on Industrial Electronics and Applications (ICIEA), Hangzhou, China. 1713-1718(2014).
14. H.I.Shaheen, G.I.Rashed, S.J.Cheng: Application and comparison of computational intelligence techniques for optimal location and parameter setting of UPFC. Engineering Applications of Artificial Intelligence.23 (2), 203-216(2010).
15. A. Mishra, V. N. K. Gundavarapu: Contingency management of power system with Interline Power Flow Controller using Real Power Performance Index and Line Stability Index.Ain Shams Engineering Journal.7(1),209-222(2016).
16. A.H. Gandomia, A.H. Alavib:An introduction of Krill HerdAlgorithm for engineering optimization. Journal of Civil Engineering and Management. 22(3), 302-310(2016).
17. A. H. Gandomi, A. HossienAlavi: Krill Herd, A new bio-inspired optimization algorithm. Communications in Nonlinear Science and Numerical Simulation.17 (12), 4831-4845(2012).
18. G. P. Singh, A. Singh: Comparative Study of Krill Herd, Firefly and Cuckoo Search Algorithms for Unimodal and Multimodal Optimization.I.J. Intelligent Systems and Applications.3, 35-49(2014).


![Interline Power Flow Controller - serialsjournals.comserialsjournals.com/serialjournalmanager/pdf/1481093126.pdf · have been applied for optimal placement and tuning of UPFC[8-11].](https://static.documents.pub/doc/80x56/5b00585c7f8b9a0c028c8fe5/interline-power-flow-controller-been-applied-for-optimal-placement-and-tuning.jpg)


