arXiv:1203.5615v2 [astro-ph.IM] 20 Apr 2012 Mon. Not. R. Astron. Soc. 000, 1–7 (2012) Printed 20 November 2021 (MN L A T E X style file v2.2) Intensity and polarization of the atmospheric emission at millimetric wavelengths at Dome Concordia E.S. Battistelli, 1⋆ G. Amico, 1 A. Ba` u, 2 L. Berg´ e, 3 ´ E. Br´ eelle, 4 R. Charlassier, 4 S. Collin, 3 A. Cruciani, 1 P. de Bernardis, 1 C. Dufour, 4 L. Dumoulin, 3 M. Gervasi, 2 M. Giard, 5 C. Giordano, 1,6 Y. Giraud-H´ eraud, 4 L. Guglielmi, 4 J.-C. Hamilton, 4 J. Land´ e, 5 B. Maffei, 7 M. Maiello, 1,8 S. Marnieros, 3 S. Masi, 1 A. Passerini, 2 F. Piacentini, 1 M. Piat, 4 L. Piccirillo, 7 G. Pisano, 7 G. Polenta, 1,9,10 C. Rosset, 4 M. Salatino, 1 A. Schillaci, 1 R. Sordini, 1,11 S. Spinelli, 2,12 A. Tartari 2,4 and M. Zannoni 2 1 Dipartimento di Fisica, “Sapienza” Universit` a di Roma, Piazzale Aldo Moro, 5, 00185, Rome, Italy 2 Dipartimento di Fisica “G.Occhialini”, Universit` a degli Studi di Milano-Bicocca, Piazza della Scienza, 3, 20126, Milan, Italy 3 Centre de Spectroscopie Nucl´ eaire et de Spectroscopie de Masse, UMR8609 IN2P3-CNRS, Universit´ e Paris Sud, bˆat 108, 91405, Orsay Campus, France 4 APC, Universit´ e Paris, Diderot-Paris 7, CNRS/IN2P3, CEA, Observatoire de Paris, 10, rue A. Domon & L. Duquet, Paris, France 5 Centre d’ ´ Etude Spatiale des Rayonnements, CNRS/Universit´ e de Toulouse, 9 Avenue du colonel Roche, BP 44346, 31028, Toulouse Cedex 04, France 6 Fondazione Bruno Kessler, Via S.Croce 77, 38122, Trento, Italy 7 JBCA School of Physics and Astronomy, The University of Manchester, Alan Turing Building, Oxford Road, Manchester M13 9PL, UK 8 Universit` a degli Studi di Siena, Via Banchi di Sotto 55, 53100, Siena, Italy 9 ASI Science Data Center, c/o ESRIN, via G. Galilei, 00044, Frascati, Italy 10 INAF - Osservatorio Astronomico di Roma, via di Frascati 33, 00040 Monte Porzio Catone, Italy 11 Dipartimento di Scienze Applicate, Universit` a degli Studi di Napoli “Parthenope”, Centro Direzionale di Napoli, Isola C4, 80143, Naples, Italy 12 Media Lario Technologies S.r.l., Localit` a Pascolo, 23842, Bosisio Parini (LC), ITALY Received ...; accepted ... ABSTRACT Atmospheric emission is a dominant source of disturbance in ground-based astronomy at millimetric wavelengths. The Antarctic plateau is recognized to be an ideal site for millimetric and sub-millimetric observations, and the French/Italian base of Dome Concordia is among the best sites on Earth for these observations. In this paper we present measurements at Dome Concordia of the atmospheric emission in intensity and polarization at 2 mm wavelength, one of the best observational frequencies for Cosmic Microwave Background (CMB) observations when considering cosmic signal intensity, atmospheric transmission, detectors sensitivity, and foreground removal. Using the BRAIN-pathfinder experiment, we have performed measurements of the atmospheric emission at 150 GHz . Careful characterization of the air-mass synchronous emission has been performed, acquiring more that 380 elevation scans (i.e. “skydip”) during the third BRAIN-pathfinder summer campaign in December 2009/January 2010. The extremely high transparency of the Antarctic atmosphere over Dome Concordia is proven by the very low measured optical depth: <τ I >=0.050 ± 0.003 ± 0.011 where the first error is statistical and the second is systematic error. Mid term stability, over the summer campaign, of the atmosphere emission has also been studied. Adapting the radiative transfer atmosphere emission model am to the particular conditions found at Dome Concordia, we also infer the level of the precipitable water vapor (PWV) content of the atmosphere, notoriously the main source of disturbance in millimetric astronomy (< PWV >=0.77±0.06± 0.15 0.12 mm). Upper limits on the air-mass correlated polarized signal are also placed for the first time. The degree of circular polarization of atmospheric emission is found to be lower than 0.2% (95%CL), while the degree of linear polarization is found to be lower than 0.1% (95%CL). These limits include signal-correlated instrumental spurious polarization. Key words: site testing – atmospheric effects – instrumentation: polarimeters – (cosmology:) cosmic background radiation.
Transcript
arX
iv:1
203.
5615
v2 [
astr
o-ph
.IM
] 2
0 A
pr 2
012
Mon. Not. R. Astron. Soc. 000, 1–7 (2012) Printed 20 November 2021 (MN LATEX style file v2.2)
Intensity and polarization of the atmospheric emission at
millimetric wavelengths at Dome Concordia
E.S. Battistelli,1⋆ G. Amico,1 A. Bau,2 L. Berge,3 E. Breelle,4 R. Charlassier,4
S. Collin,3 A. Cruciani,1 P. de Bernardis,1 C. Dufour,4 L. Dumoulin,3
M. Gervasi,2 M. Giard,5 C. Giordano,1,6 Y. Giraud-Heraud,4 L. Guglielmi,4
J.-C. Hamilton,4 J. Lande,5 B. Maffei,7 M. Maiello,1,8 S. Marnieros,3 S. Masi,1
A. Passerini,2 F. Piacentini,1 M. Piat,4 L. Piccirillo,7 G. Pisano,7 G. Polenta,1,9,10
C. Rosset,4 M. Salatino,1 A. Schillaci,1 R. Sordini,1,11 S. Spinelli,2,12 A. Tartari2,4
and M. Zannoni21Dipartimento di Fisica, “Sapienza” Universita di Roma, Piazzale Aldo Moro, 5, 00185, Rome, Italy2Dipartimento di Fisica “G.Occhialini”, Universita degli Studi di Milano-Bicocca, Piazza della Scienza, 3, 20126, Milan, Italy3Centre de Spectroscopie Nucleaire et de Spectroscopie de Masse, UMR8609 IN2P3-CNRS, Universite Paris Sud, bat 108, 91405,Orsay Campus, France4APC, Universite Paris, Diderot-Paris 7, CNRS/IN2P3, CEA, Observatoire de Paris, 10, rue A. Domon & L. Duquet, Paris, France5Centre d’Etude Spatiale des Rayonnements, CNRS/Universite de Toulouse, 9 Avenue du colonel Roche, BP 44346, 31028, ToulouseCedex 04, France6Fondazione Bruno Kessler, Via S.Croce 77, 38122, Trento, Italy7JBCA School of Physics and Astronomy, The University of Manchester, Alan Turing Building, Oxford Road, Manchester M13 9PL, UK8Universita degli Studi di Siena, Via Banchi di Sotto 55, 53100, Siena, Italy9ASI Science Data Center, c/o ESRIN, via G. Galilei, 00044, Frascati, Italy10INAF - Osservatorio Astronomico di Roma, via di Frascati 33, 00040 Monte Porzio Catone, Italy11Dipartimento di Scienze Applicate, Universita degli Studi di Napoli “Parthenope”, Centro Direzionale di Napoli, Isola C4, 80143,Naples, Italy12Media Lario Technologies S.r.l., Localita Pascolo, 23842, Bosisio Parini (LC), ITALY
Received ...; accepted ...
ABSTRACT
Atmospheric emission is a dominant source of disturbance in ground-based astronomyat millimetric wavelengths. The Antarctic plateau is recognized to be an ideal sitefor millimetric and sub-millimetric observations, and the French/Italian base of DomeConcordia is among the best sites on Earth for these observations. In this paper wepresent measurements at Dome Concordia of the atmospheric emission in intensity andpolarization at 2 mm wavelength, one of the best observational frequencies for CosmicMicrowave Background (CMB) observations when considering cosmic signal intensity,atmospheric transmission, detectors sensitivity, and foreground removal. Using theBRAIN-pathfinder experiment, we have performed measurements of the atmosphericemission at 150 GHz. Careful characterization of the air-mass synchronous emissionhas been performed, acquiring more that 380 elevation scans (i.e. “skydip”) duringthe third BRAIN-pathfinder summer campaign in December 2009/January 2010. Theextremely high transparency of the Antarctic atmosphere over Dome Concordia isproven by the very low measured optical depth: < τI >= 0.050± 0.003± 0.011 wherethe first error is statistical and the second is systematic error. Mid term stability, overthe summer campaign, of the atmosphere emission has also been studied. Adapting theradiative transfer atmosphere emission model am to the particular conditions foundat Dome Concordia, we also infer the level of the precipitable water vapor (PWV)content of the atmosphere, notoriously the main source of disturbance in millimetricastronomy (< PWV >= 0.77±0.06±0.15
0.12mm). Upper limits on the air-mass correlated
polarized signal are also placed for the first time. The degree of circular polarizationof atmospheric emission is found to be lower than 0.2% (95%CL), while the degreeof linear polarization is found to be lower than 0.1% (95%CL). These limits includesignal-correlated instrumental spurious polarization.
Fast growing fields in millimetric astronomy are the studyof the Cosmic Microwave Background (CMB) polarizationand the measurement of polarized emission from interstellardust. In particular, a curl component (B-modes) of the CMBpolarization from the predicted inflationary expansion of theuniverse earlier in time may be present. The theorized signaldepends on the energy of the inflationary field, as measuredby the tensor-to-scalar ratio r, and is so low that exquisitesensitivity and control of systematic effects are necessary toattempt these kind of observations.
Atmospheric emission is one of the dominant sourcesof disturbance for ground-based CMB experiments andfor millimetric and sub-millimetric astronomy in general.In addition to continuum emission at the frequencies ofour interest, there are also the roto-vibrational emissionlines of O2 (at around 60 GHz and 119 GHz) andH2O (at 22 GHz and 183 GHz). Dry and high alti-tude observation sites are chosen to mitigate the prob-lem. The French/Italian scientific base of Dome Concor-dia on the Antarctic plateau (75◦06′ South, 123◦24′ East,at 3233 m aside see level, http://www.concordiabase.eu/)is one of the best observational sites on Earth for milli-metric observations. Site testing at Dome C has provenits observational quality at different wavelengths (see e.g.(Tremblin et al. 2011; Gredel 2010; Lawrence et al. 2004;Aristidi et al. 2009; Calisse et al. 2004)) although only pre-liminary measurements were performed at millimeter wave-lengths (Valenziano et al. 1999). 150 GHz is among the bestobservational frequencies for ground based CMB experi-ments in terms of cosmic signal intensity, atmospheric trans-mission, detectors sensitivity and foreground removal.
The BRAIN-pathfinder experiment (Masi et al. 2005;Polenta et al. 2007) has undergone its third Antarctic cam-paign from the French/Italian scientific base of Dome Con-cordia. The first two campaigns were dedicated to instru-ment fielding, while the 2009-2010 austral summer campaignwas dedicated to continuous observations of the atmosphericemission and site testing. This paper is structured as follows:in §2 we introduce the BRAIN-pathfinder instrument, in §3we describe the observations; in §4 we present the data andthe analysis and in §5 we give the results in terms of intensityand polarization.
2 BRAIN-PATHFINDER: THE INSTRUMENT
The BRAIN-pathfinder was designed as a prototype in-strument for a challenging project of bolometric in-terferometer. The BRAIN collaboration has been com-bined with the Millimeter-wave Bolometric Interferome-ter (MBI) (Tucker et al. 2008) collaboration to form theQUBIC collaboration. The BRAIN-pathfinder was devotedto site and logistics testing for the QUBIC experiment(The QUBIC collaboration 2011), that we aim to install atDome Concordia in 2013. The BRAIN-pathfinder instru-ment is described in detail elsewhere (Masi et al. 2005);(Polenta et al. 2007); (Masi et al. in prep). Nevertheless, wehere report a brief description of the instrumental setup forcompleteness.
The BRAIN-pathfinder comprises of a two-channel
bolometric receiver coupled to two off-axis (40 and 60 cmdiameter) parabolic mirrors, tiltable around the optical axis.The whole instrument is mounted on an azimuth plane, mak-ing the instrument an Alt-Az double telescope. The first inits kind, our bolometric receiver is cooled by a dry-cryostatwith a Sumitomo 1 Pulse Tube cryocooler, allowing us tokeep an intermediate stage at 30 K and a main plate at 3 K.Quasi-optical filters, JFET boards and shields are kept at30 K with JFET amplifiers attached to their PCB throughweak thermal connections in their fiberglass supports. Fur-ther filters, radiation collecting horns and further shields arekept at 3 K with an 3He−4He refrigerator 2 that keeps thebolometers at 310mK during observations.
One of the two channels (channel 1) measures theanisotropy of the emission of the sky, while the second one(channel 2) sees the sky through an ambient-temperature,rotating sapphire Quarter Wave Plate (QWP), and a steadywire grid polarizer. The presence of the rotating QWPmakesthis second detector inherently sensitive to linear and circu-lar polarization. In an ideal case, the power hitting channel2 is thus (Polenta et al. 2007):
W =1
2[Iin+Qin
1 + cos(4ωt)
2+Uin
sin(4ωt)
2+Vinsin(2ωt)](1)
where Iin, Qin, Uin, and Vin and the Stokes parameters ofthe incoming radiation, ω is the mechanical angular speedof the QWP. From equation 1 it is clear that an incomingpolarized radiation is modulated by the rotating QWP ata frequencies twice or four times the mechanical frequency,depending whether the polarization is circular or linear.
We use the control and read-out electronics, as wellas the control software, originally developed for the PlanckHigh frequency Instrument (Lamarre et al. 2010) and for itsground based calibrations. Its angular resolution on the skyis 1◦. A double back-to-back horn and the quasi-optical fil-ters set the average observational frequency at 150 GHz,with 36 GHz FWHM bandwidth. Detailed measurementsof the bandpass have been performed combining data ob-tained with a high throughput Fourier Transform Spectrom-eter (Schillaci 2010) and a Vector Network Analyzer 3 in or-der to characterize the transmission curve especially on thelow frequency end of the band-pass, where the molecularOxygen line emission becomes brighter.
3 OBSERVATIONS
Observations were taken during the 2009-2010 austral sum-mer Antarctic campaign. As opposed to a CMB experi-ment, for which one should choose an observational strat-egy aiming at minimizing the atmospheric effects (see eg.(Chiang et al. 2010), (Castro et al. 2009)), we have chosenan observational strategy able to highlight the atmosphericcontribution. Here we present a full characterization of theair-mass dependence of the atmospheric intensity and polar-ized emission, obtained by performing elevation scans (i.e.skydips) by leaving the azimuth constant and scanning theelevation from the zenith to 35 degrees above the horizon.
Millimetric atmospheric emission at Dome Concordia 3
Elevation scans were done in a so called “fast scan”mode by acquiring the sky signal while the telescope contin-uously samples different elevation angles. The scan speed hasbeen chosen as high as possible, in order to mitigate the 1/fnoise present in the data arising both from detector instabil-ity and (mainly) from the slow variation of the atmosphericemission. At the same time we set the scan speed to be ableto acquire multiple QWP rotations in one single telescopebeam. We tested different QWP and scan speeds and, trad-ing off instrumental constrains and observational needs. Weset the QWP rotational frequency at 1.56 Hz (correspond-ing to 3.13 Hz and 6.26 Hz respectively for circular and lin-ear polarization modulation frequencies) for approximatelyhalf of the measurements and at 2.09 Hz (corresponding to4.17 Hz and 8.35 Hz respectively for circular and linear po-larization modulation frequencies) for the rest of the time.A scan speed of 1◦/s thus allows at least three or six po-larized modulation periods per telescope beam. With thesesettings, a full scan completes in less than a minute, a shortenough time to mitigate slow signal variation arising fromatmospheric emission.
In order to reduce the field of view vignetting, to over-come detector and read-out non-linearity, and to optimizethe detectors dynamics, we have chosen not to use a warmreference load for skydip measurements. This forces us tomake some assumptions if we want to do absolute calibra-tion of the data (see section 4). On the other hand, it allowsus to directly analyze polarization data relatively to the in-tensity emission, with no need of any reference signal.
We have collected 383 skydips. About 12% of the sky-dips were discarded because of corrupted data or due to largeatmospheric fluctuations. About 76% of the analyzed sky-dips were acquired changing the elevation from the zenithto 35 degrees above the horizon (long skydip) while the re-maining 24% were limited to 60 degrees above the horizon(short skydip), in order to keep the Sun always at an anglelarger than 30 degrees from the field of view. Most of thereported results have been extracted from the analysis of thelong skydips, although the short ones have been useful forcross checks.
4 DATA REDUCTION AND ANALYSIS
The skydip technique (Dicke et al. 1946) is a well investi-gated method to study the atmospheric emission (see e.g.(Dragovan et al. 1990), (Archibald et al. 2002)). During askydip we expect the acquired signal to respond to the air-mass as in the following:
S = off +C · T0 · [1− exp(−x · τI)] (2)
where S is the acquired signal in ADC units, off is an in-strumental offset in ADC units, C is the calibration factorin ADC/K units, T0 (in K) is the equivalent temperature ofthe atmosphere, τI is the sky opacity and x = sec(z) is theair-mass with the zenithal angle z = 90◦ − elevation.
One of the features in our data is the presence in thetime stream of a periodic signal at a frequency of around1 Hz due to the pulses of the Pulse Tube cryocooler. In fact,the experimental effort spent to reduce the system vibrationhas drastically reduced but not completely eliminated theeffect of the pulses on the high impedence bolometers, that
Figure 1. Data acquired during one skydip. The plot on the topshows the Fourier transform of the raw data (black, solid), theused multiple Notch filter (black, dotted) and the filtered data(cyan, solid, overplotted on the data). The plot on the bottomshows a raw skydip (black), and a filtered skydip (cyan) offset by60000 Analog to Digital Units (ADU).
are intrinsically microphonic. This does not affect the highsignal-to-noise skydip measurements we are analyzing in thispaper; nevertheless we have decided to filter out from ourdata this well defined imprint, in order to avoid biases inthe skydip fits. We have performed several tests, both intime and in Fourier space and we finally decided to use amultiple Notch filter to remove the main pulse frequencyand its harmonics. In figure 1 we show filtered and unfilteredsignals (and their Fourier transforms), in engineering units,acquired during one skydip.
While for channel 1 we have only (Notch-) filtered outthe Pulse Tube 1 Hz signal, in order to retrieve signal inten-sity information from channel 2 we have to account for thepresence of the rotating QWP in front of it. We have thusapplied a low-pass filter, with cut-off frequency at 1 Hz,to remove any higher frequency signal due to the rotatingQWP that could modulate linear and circular polarized sig-nal. Dedicated band-pass filters have then been applied toretrieve polarization information (see section 5.3 for details).
We have performed a likelihood analysis and chi squareminimization to optimize secant-law fits on each of the ac-quired skydips. We have verified the linearity of the depen-dence of the signal as a function of the air-mass. This isverified only in the case of high transparency of the atmo-sphere:
S = P1+P2·exp(−P0·x) ≃ P1+P2−P2 ·P0 ·x = AI−BI
·x(3)
where AI = P1 + P2 and BI = P2 · P0 are the fitted param-eters.
Comparing equation 2 and 3 we determine the sky opac-ity:
τI = −BI/(C · T0) (4)
where the calibration factor C has been determined by us-ing laboratory absolute reference loads cooled at liquid Ni-trogen temperature (i.e. 77 K), careful measurements of the
bolometer efficiency, as well as the daily electrical respon-sivity measurements performed during observations throughthe measurements of the detector I −V curve. The temper-ature T0 was determined by integrating the temperature,pressure and humidity profiles obtained by daily measure-ments with atmospheric radio-sound balloons flying up toan altitude of 24000 m, collecting data with ∆h ∼ 10 m al-titude sampling4. In particular, these data, combined withcontinuous ground temperature measurements at the time ofthe skydip, and after integration of the atmospheric emissioncontribution over the altitude for each of our scans, allowedus to recover T0 using radiative transfer.
Our model for atmosphere emission is made bytwo different parts: in order to reconstruct the circu-larly polarized O2 signals we use the model described in(Spinelli et al. 2011). This model can be used to estimatealso Stokes paramaters I,Q and U. In order to deal with acomplete dry-air model, together with a water vapor column,we used the am model (Paine et al. 2011). The am modeluses updated spectroscopic parameters and is readily avail-able, very well supported, and documented. We have madeday-by-day estimates of the atmospheric emission using ra-dio sounds, properly resampled to build am configurationfiles. The resulting brightness temperature is then averagedover the frequency bandpass of BRAIN-pathfinder channels,after accurate laboratory bandpass reconstruction, to obtainthe power delivered to our detectors. We find a linear scalingrelation between the precipitable water vapor (PWV), or theintegrated optical depth τ , and the brightness temperatureTb in our bandpass, that is:
Tb = Q+M · PWV, (5)
where Mch1 = (6.6± 0.3)K/mm, Mch2 = (5.4± 0.3)K/mm,Q = (4.2± 0.2)K with PWV expressed in mm. Not surpris-ingly, the two M coefficients are different, since our band-passes is strongly suppressed towards the 118 GHz O2 line,while their high frequency wings pick up with small (but notnegligible) and different efficiency a residual signal from the183 GHz H2O line. The intercept Q is sensitive to the dry-air component, mainly to O2, whose tail is observed withthe same efficiency by our detectors.
In order to account for polarized emission one has toconsider magnetic field direction and intensity. We have es-timated these for the Austral summer 2009/2010, at DomeC, by means of the International Geomagnetic ReferenceField (IGRF) model was used. The day-by-day variationin atmospheric conditions produces a small uncertainty onthe oxygen polarized and unpolarized brightness tempera-ture computed through their model (seasonal variations andmagnetic storms being definitely more relevant). In particu-lar, in the specific case of the BRAIN campaign, the absoluteuncertainty on O2 modeled signals is of the order of a fewµK and a few mK, respectively, for the V and I maps. Boththese uncertainties are negligible with respect to the one as-sociated with H2O emission estimates, which is of the orderof some tens of mK. This last one is driven mainly by theday-by-day scatter of atmospheric parameters.
4 Data and information were obtained from IPEV/PNRA ProjectRoutine Meteorological Observation at Station Concordia -www.climantartide.it.
Figure 2. Collection of best fit curves obtained over the cali-brated skydips collected during the 2009-2010 summer campaign.
We found the uncertainty derived from the fits negligi-ble with respect to the estimated uncertainty derived fromthe calibration procedure. This can be as high as 23% andshould be treated as a systematic error. It dominates over allother uncertainties. Calibration uncertainties proportionallypropagate to the opacity determination, while we producedmonte-carlo simulations in order to estimate PWV uncer-tainties.
In figure 2 we report best fit curves obtained over thecalibrated skydips collected during the campaign for bothchannels.
5 RESULTS
5.1 Sky opacity
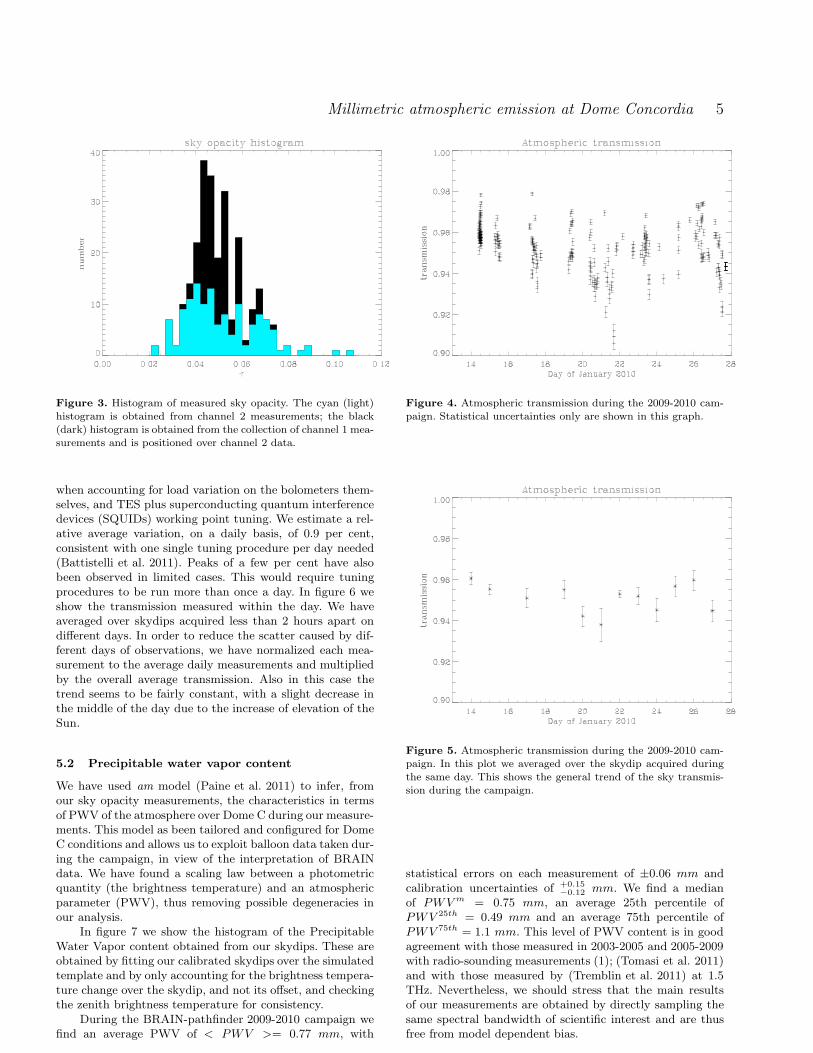
The distribution of the sky opacities measured during thecampaign can be seen in the histogram in figure 3. The cyan(light) histogram is derived from channel 2 measurementswhile the black (dark) histogram (summed and positionedon top of the cyan one) is derived from channel 1 measure-ments. The measurements from both channels result in τIvalues centered around an average value < τI >= 0.050,with a median of τm
I = 0.048 and statistical error on eachmeasurement of 7%. This corresponds to an average trans-mission of 95%. Although all the measurements have beentaken with clear sky, we should stress that the reported re-sults reflect a wide variety of weather conditions and onlybad weather situations (i.e. covered sky, although rare atDome C) have been discarded from our analysis.
In figure 4 we show the atmospheric transmission mea-surements along the whole campaign. In figure 5 we show thesame measurements averaged on day by day basis. Transmis-sion seems to be fairly constant along the campaign, with apossible general trend to decrease in the middle of the cam-paign and a rise back at the end of it. Error bars in figure5 reflect the variability within each day. This parameter hasto be taken into account when considering measurementswith thermal detectors like transition edge sensor (TES)bolometers (as those planned for the QUBIC experiment)
Millimetric atmospheric emission at Dome Concordia 5
Figure 3. Histogram of measured sky opacity. The cyan (light)histogram is obtained from channel 2 measurements; the black(dark) histogram is obtained from the collection of channel 1 mea-surements and is positioned over channel 2 data.
when accounting for load variation on the bolometers them-selves, and TES plus superconducting quantum interferencedevices (SQUIDs) working point tuning. We estimate a rel-ative average variation, on a daily basis, of 0.9 per cent,consistent with one single tuning procedure per day needed(Battistelli et al. 2011). Peaks of a few per cent have alsobeen observed in limited cases. This would require tuningprocedures to be run more than once a day. In figure 6 weshow the transmission measured within the day. We haveaveraged over skydips acquired less than 2 hours apart ondifferent days. In order to reduce the scatter caused by dif-ferent days of observations, we have normalized each mea-surement to the average daily measurements and multipliedby the overall average transmission. Also in this case thetrend seems to be fairly constant, with a slight decrease inthe middle of the day due to the increase of elevation of theSun.
5.2 Precipitable water vapor content
We have used am model (Paine et al. 2011) to infer, fromour sky opacity measurements, the characteristics in termsof PWV of the atmosphere over Dome C during our measure-ments. This model as been tailored and configured for DomeC conditions and allows us to exploit balloon data taken dur-ing the campaign, in view of the interpretation of BRAINdata. We have found a scaling law between a photometricquantity (the brightness temperature) and an atmosphericparameter (PWV), thus removing possible degeneracies inour analysis.
In figure 7 we show the histogram of the PrecipitableWater Vapor content obtained from our skydips. These areobtained by fitting our calibrated skydips over the simulatedtemplate and by only accounting for the brightness tempera-ture change over the skydip, and not its offset, and checkingthe zenith brightness temperature for consistency.
During the BRAIN-pathfinder 2009-2010 campaign wefind an average PWV of < PWV >= 0.77 mm, with
Figure 4. Atmospheric transmission during the 2009-2010 cam-paign. Statistical uncertainties only are shown in this graph.
Figure 5. Atmospheric transmission during the 2009-2010 cam-paign. In this plot we averaged over the skydip acquired duringthe same day. This shows the general trend of the sky transmis-sion during the campaign.
statistical errors on each measurement of ±0.06 mm andcalibration uncertainties of +0.15
−0.12 mm. We find a medianof PWV m = 0.75 mm, an average 25th percentile ofPWV 25th = 0.49 mm and an average 75th percentile ofPWV 75th = 1.1 mm. This level of PWV content is in goodagreement with those measured in 2003-2005 and 2005-2009with radio-sounding measurements (1); (Tomasi et al. 2011)and with those measured by (Tremblin et al. 2011) at 1.5THz. Nevertheless, we should stress that the main resultsof our measurements are obtained by directly sampling thesame spectral bandwidth of scientific interest and are thusfree from model dependent bias.
Figure 6. Atmospheric transmission during the 2009-2010 cam-paign. In this plot we averaged over the skydip acquired less than2 hours apart, each measurement being normalized by the averagedaily transmission, relative to (multiplied by) the overall averagetransmission on the campaign. This shows the general trend ofthe sky transmission during the day.
Figure 7. Histogram of the derived Precipitable Water VaporContent on the atmosphere. The cyan (light) histogram is ob-
tained from channel 2 measurements; the black (dark) histogramis obtained from the collection of channel 1 and channel 2 mea-surements.
5.3 Polarization
As previously mentioned, channel 2 of the BRAIN-pathfinder measures sky emission through a rotating QWPfollowed by a wire-grid polarizer. During observations werotated the QWP at several different speeds. For instru-mental, environmental, and noise reasons we set its physicalrotational frequency at νQWP = 1.56 Hz (2.09 Hz) for mostof our observations. We thus expect any incoming circularlypolarized signal to be modulated at νC = 2·νQWP = 3.13Hz(4.17 Hz) and any incoming linearly polarized signal atνL = 4 · νQWP = 6.26 Hz (8.35 Hz) (see eq. 1). The
emission of the (ambient temperature) QWP and of thepolarizer have been studied using the models presented by(Salatino et al. 2011). Our data are affected by an offsetmodulated both at νC and at νL that we found to be consis-tent with the QWP emission as well as the polarizer emissionreflected back from the QWP. We should stress that the sta-bility of this emitted signal is critical to retrieve meaningfulinformation from the data. One of the goals of this paperis to provide information on the polarization of the skydipsignal. For the present analysis, it is critical to character-ize and monitor the stability of our instrument within theaverage time of a skydip as faster instability will affect theresults.
We have demodulated the νC and the νL signals usingband-pass filters for each raw skydip. The extracted signalshave thus been treated in the same way as the intensitysignal in order to find a possible secant law dependence inthe polarized signal of the skydips. Once we have performedsecant law fits over the polarized skydips, we can define τCand τL similarly to τI :
τC = −(BC)/(C · T0), (6)
τL = −(BL)/(C · T0). (7)
The comparison between the different τ ’s enables us to ex-tract polarized information from our skydips and thus anestimation of the air-mass-correlated (or anticorrelated) po-larization of atmospheric emission.
In figure 8 we show one of the skydips acquired and ana-lyzed in polarization. Polarization calibration has been per-formed using local polarized sources placed in the near-fieldand in the medium-field. We should stress, however, thatthe derived percentage polarization levels are independentof the calibration and of the determination of the equivalenttemperature of the atmosphere. The uncertainty on each ofthe skydip polarization levels is thus directly derived fromthe fits. After combining and weight-averaging over all theskydips, we find that both circular and linear polarizationof the air-mass correlated signals are consistent with zero,with upper limits such that SC < 0.19% and SL < 0.11%(95%CL), respectively. These results have been confirmedby cross-correlating the measured data with the signals ex-pected from Zeeman splitting and simulated using the modeldeveloped in (Spinelli et al. 2011). These limits include in-strumental systematics and place a tight limit on the QWPplus polarizer stability within the time of the acquired sky-dips.
6 CONCLUSIONS
In this paper we report a detailed site testing of Dome Cat 150 GHz and the first limits on the polarized emissionof its atmosphere. Dome Concordia is demonstrated to bean exceptional millimetric observational site, in terms of ab-solute transmission and stability and polarization limits areencouraging as far as spurious polarization and intensity-polarization mixing are concerned. Our opacity measure-ments have been derived from direct sampling of the fre-quencies of astronomical interest and are thus free frommodel-dependent bias. We anticipate that, in most observa-tional conditions, the measured daily stability should enable
Millimetric atmospheric emission at Dome Concordia 7
Figure 8. Intensity, linear polarization and circular polariza-tion signal acquired during a single skydip. We plot the acquireddata (dark) and the secant law performed fit (light/cyan). Wereport the derivation of the percentage polarization that can beextracted from this skydip.
us to have Transition Edge Sensor Bolometer arrays requir-ing only a single tuning procedure per day. When compar-ing our millimetric opacities and in-bandwidth transmissionswith those obtained at sub-millimeter wavelengths, the ab-solute values are one order of magnitude better in terms oftransmission and stability. Nevertheless, we should keep inmind that the requirements, in terms of systematic controland stability, for a millimetric B-modes CMB experiment,are such that it is necessary to characterize the atmosphericstability to a high level of precision and our results are veryencouraging. Our derived PWV value relies on a model in-dependently developed by the BRAIN collaboration and tai-lored for Dome C. Our PWV values are consistent with thosederived at sub-millimeter wavelenghts (Tomasi et al. 2011).In our case, however, radiation is detected through an instru-ment similar to those aiming to detect CMB polarization,allowing direct monitoring of many systematic effects. Sys-tematic control requirements for a B-mode CMB experimentare so stringent that no instrument, to date, has been ableto meet them. The requirement for the instrumental spuri-ous polarization induced from leakage of CMB anisotropiesinto B-mode polarization is that the leakage should be main-tained lower than 10−3 (Bock et al. 2006). This is necessaryin order to be able to reach a B-modes signal of the or-der of 30 nK rms (i.e. Tensor to Scalar ratio r=0.01). Interms of absolute temperature limits, our analysis does notallow us to reach this limit. However, in terms of a relativesystematic limit, considering that our 0.1% limit for linearpolarization includes spurious polarization due to intensity-to-polarization leakage, our instrument is already satisfyingto this requirement.
ACKNOWLEDGMENTS
This work is supported and funded by the “ProgettoNazionale Ricerche in Antartide” (PNRA) and the “Insti-
tut Polaire francaise Paul Emile Victor” (IPEV). We thankthe logistic support at Dome C. We acknowledge Dr. AndreaPellegrini for the radio sound data and information obtainedfrom IPEV/PNRA Project “Routine Meteorological Obser-vation at Station Concordia - www.climantartide.it.” Wethank Ken Ganga for comments and for reviewing the pa-per. We acknowledge Scott Paine (Smithsonian Astrophysi-cal Observatory) for making the am code available and forthe kind support. We acknowledge the anonymous refereefor comments that improved the paper.
REFERENCES
Archibald, E.N., et al., 2002, Montly Notice of the RoyalAstronomical Society, 336, 1-13Aristidi, E., et al., 2009, Astronomy & Astrophysics, 499,955-965Battistelli, et al., 2008, proceeding of the SPIE, 7020,702028Bock, J.J., et al., 2006, arXiv:astro-ph/0604101Calisse, P., et al., 2004, Publications of the AstronomicalSociety of Australia, 21, 256-263Castro, P.G., et al., 2009, Astrophysical Journal, 701, 2,857-864Chiang, H.C., et al., 2010, Astrophysical Journal, 711, 2,1123-1140Dicke, R. H., et al., 1946, Physical Review, 70, 5-6, 340-348Dragovan, M., et al., 1990, Applied Optics, 29, 4, 463-466Gredel, R., 2010, Proceedings of the 3rd ARENA Con-ference: An Astronomical Observatory at CONCORDIA(Dome C, Antarctica), Spinoglio and Epchtein (eds), EASpubblication series, 40, 11-20Lamarre, J.-M., et al., 2010, Astronomy & Astrophysics,520, 9ALawrence, J.S., et al., 2004, Nature, 431, 7006, 278-281Masi, S., et al., 2005, EAS Publications Series, 14, 87-92Masi, S., et al., in preparationPaine, S., 2011, ASTDC, 41, 24-44Polenta, G., et al., 2007, New Astronomy Reviews, 51, 3-4,256-259Salatino, M., et al., 2011, Astronomy & Astrophysics, 528,138SSchillaci, A., 2010, PhD, Sapienza University of RomeSpinelli, S., et al., 2011, Montly Notice of the Royal Astro-nomical Society, 414, 3272SThe QUBIC collaboration, 2011, Astroparticle Physics, 34,705-716Tomasi, C., et al., 2006, JGRD, 111, 20305Tomasi, C., et al., 2011, JGRD, 116, D15304Tremblin, P., et al., 2011, Astronomy & Astrophysics, 535Tucker, G.,S., et al., 2008, Proc. SPIE, 7020, 70201MValenziano, L., et al., 1999, Publications of the Astronom-ical Society of Australia, 16, 167-174