+ All Categories
Home > Documents > Interest Rate Derivatives and Firm Value

Interest Rate Derivatives and Firm Value

Date post: 24-Mar-2022
Category:
Upload: others
View: 3 times
Download: 0 times
Share this document with a friend
48
Interest Rate Derivatives and Firm Value: Evidence from Mandatory versus Voluntary Hedging Ali Marami * Michel Dubois ** Institut d'analyse financière, Université de Neuchâtel, Pierre-à-Mazel 7 2000 Neuchâtel, Switzerland Keywords: Risk Management, Derivatives, Interest Rates * [email protected], Tel: +41-32-718 15 34, Fax: +41-32-718 14 01 ** [email protected], Tel: +41-32-718 13 66, Fax: +41-32-718 14 01
Transcript

Interest Rate Derivatives and Firm Value: Evidence from Mandatory

versus Voluntary Hedging

Ali Marami*

Michel Dubois**

Institut d'analyse financière, Université de Neuchâtel, Pierre-à-Mazel 7

2000 Neuchâtel, Switzerland

Keywords: Risk Management, Derivatives, Interest Rates

* [email protected], Tel: +41-32-718 15 34, Fax: +41-32-718 14 01

** [email protected], Tel: +41-32-718 13 66, Fax: +41-32-718 14 01

1

Abstract

This paper examines the impact of interest rate derivatives enforced by creditors and

interest rate derivatives used voluntarily on firm value, separately in a sample of 3881

firm-years from 1998 to 2005. Voluntary hedging positions include derivatives for

corporate risk management practices and those for private benefit of managers.

Consequently, these derivatives might not have the positive impact on firm value

predicted by risk management theories. However, there is no managerial incentive in the

use of derivatives mandated by credit agreements. Therefore, shareholders refer to

mandatory term of derivatives obliged by creditors and classify these instruments as real

risk management practices and reward such positions by a premium on firm value. This

argument is strongly supported by the results of this empirical research in which we find

an economically large and statistically significant positive impact from mandatory interest

rate derivatives on firm value and no significant impact from voluntary ones.

2

1. Introduction

Several studies document that firms may use financial instruments for speculation (Géczy,

Minton, and Schrand, 2007), and managers may hold derivative positions for their own

advantage that might not be in parallel with shareholders’ benefit (Stulz, 1984 and Smith

and Stulz, 1985). The pooling of speculative, self-interest, and hedging in derivative

positions could make investors cautious in valuing firms that use derivative contracts.

Consistent with this idea, Fauver and Naranjo (2010) find that derivatives negatively

influence the value of the firms that have high level of agency problems and weak

corporate governance system.

However, shareholders can appeal to external or internal signals in firms to clarify the real

motivation of using derivatives. For instance, Nain (2004) shows how competition on the

product market reduces the agency conflicts between managers and shareholders in the

use of foreign exchange derivatives. She documents that foreign exchange derivatives

increase firm value when the use of such derivatives is common among the competitors.

Allayannis, Lel, and Miller (2012) concentrate on monitoring pressure on managers from

shareholders and its impact on value implication of derivatives. They find that the use of

derivatives increases firm value in well-governed firms, where managers have limited

power to exert financial instruments for speculation or self-interests. In fact, market

competition or efficient monitoring of corporate management shifts the use of derivatives

toward sound risk management practices, and reduces the agency conflicts between

shareholders and managers in the use of financial instruments. Through these factors,

investors are able to identify the motive behind the use of derivatives and gain their

confidence in real purpose of such financial decisions.

In the same spirit, we focus on the role of creditors and their influence on the agency cost

between shareholders and managers in the use of derivatives. In this paper, we distinguish

voluntary use of interest rate (IR) derivatives from those enforced by private credit

agreements, and evaluate the impact of each group on firm value, separately. We

hypothesize that shareholders refer to the mandatory term of using IR derivatives in credit

agreements and perceive these positions as “hedging” instruments. Therefore, creditors’

request for IR hedging reduces the agency conflict between managers and shareholders in

the use of IR derivatives, making these positions completely aligned with corporate risk

management practices. As predicted by risk management theories, we argue that investors

reward the use of such derivatives by a positive premium on firm value. Since voluntary

3

positions include IR derivatives both for corporate risk management and for private

benefits, such premium on firm value from these financial instruments is not expected.

By focusing on mandatory interest rate hedging, we diminish the likelihood of speculation

or manager’s self-benefit in using derivatives, since the decision-making for such hedging

strategies is outside the shareholders’ and managers’ reaches. A derivative position

obliged by creditors is not speculative and the borrower cannot terminate this position

unless it bears the cost of breaching a covenant. Indeed, this technical default is not in the

interest of managers and shareholders.

Mandatory interest rate hedging, usually called Interest Rate Protection Covenant (IRPC),

complies with risk management theories as well. As discussed in Froot, Scharfstein, and

Stein (1993) and Leland (1998), firms commit themselves to hedge to increase their debt

capacity and grant the credit facility to harvest the tax advantage of debt. In addition,

commitment to hedge reduces the agency conflicts between creditors and shareholders

(Campbell and Kracaw, 1990) and mitigates underinvestment problem (Bessembinder,

1991; Nance, Smith, and Smithson, 1993; and Géczy, 1997).1

It may be argued that because of agency conflicts between debt-holders and shareholders,

creditors usually impose covenants to minimize their risk at the cost of shareholders.

Consequently, mandatory hedging might not be optimal for the firm. This argument does

not necessarily hold for hedging covenants. Many affirmative covenants such as

complying with accounting rules, paying taxes, or buying insurance are in parallel to

sound corporate management practices, and completely aligned with shareholders’

interests. IRPC also is an affirmative covenant that delivers the benefit to both creditors

and shareholders. Smooth payment of the interests and principal amount of the loan is

banks’ main concern. Thus, the main purpose of mandatory hedging is to secure the cash

flows of the borrower in the states of the economy in which it would not be able to meet

its payment obligation without hedging2. As a result, IRPC reduces the probability of

default, which is in the interest of the shareholders as well. Moreover, IRPCs do not

restrict the borrower to specific derivative contracts and are flexible in terms of the

notional amount, maturity, and type of the contracts3. Hence, it is less likely that an IRPC

1 In parallel to these theoretical studies, Campello, Lin, Ma, and Zou (2011) and Beatty, Petacchi, and Zhang (2011)

empirical researches document a significant reduction in cost of debt (LIBOR spread) by interest rate hedging in

syndicated loans, particularly by IRPCs. 2 In our sample, firms with IRPC pay 41% of their free cash flow for interest, on average. 3 IRPCs usually oblige borrower to fix the interest rate of at least 50% of its total indebtedness for 2 to 3 years, not

contradictory to a typical interest rate risk management. Banks also set a minimum credit quality for hedging

counterparties and almost no restrictions for the type of hedging contracts. They also usually set a 60- to 90-day

period after the agreement for entering into interest rate derivatives.

4

deviates substantially from an optimal contract and its “mandatory” term does not weaken

our hypothesis about value implication of derivatives obliged by creditors.

To investigate the impact of IRPCs on firm value, we focus on interest rate protection

covenants in private credit agreements in the syndicated loan market4. Hedging covenants

are more prevalent in the bank loans than in bond indenture, since banks’ monitoring

resources are more concentrated than those of individual bondholders (see Lookman,

2009b). Interest rate hedging covenants are also more common than currency or

commodity hedging covenants as it is more difficult for nonfinancial firms to pass-

through or naturally hedge interest rate exposure compared to the risk of the price of

commodities or exchange rate fluctuations5.

Syndicated loan agreements have clear and detailed terms and covenants. Due to the

material impact of these agreements on firms’ capital structure and operation, firms report

terms and covenants of syndicated loan agreements in their SEC filings, enabling to

extract details and conditions of IRPCs and classify interest rate hedging positions as

voluntary or mandatory,6 clearly.

We construct our sample from the dataset used in Nini, Smith, and Sufi (2009) 7

. Our

empirical analysis is based on hand collected data on interest rate (IR) hedging contracts

and detailed private credit agreements from Securities and Exchange Commission (SEC)

filings, and accounting and market data from COMPUSTAT and CRSP databases. The

dataset includes 3881 firm-year observations all exposed to interest rate risk from year

1998 to 2005. 1140 observations are voluntary, 481 observations are mandatory IR

derivative users, and 2260 observations are nonusers8. With this sample, we examine the

impact of mandatory and voluntary interest rate risk management on firm value both in

cross-sectional and within-industry dimensions (industry fixed-effect).

Using the Q ratio, we find that mandatory IR hedging increases firm value and its

premium is statistically and economically significant. Based on our model, on average,

IRPC increases the Q ratio by 7.6% relative to an IR derivative nonuser counterfactual

4 A syndicated loan is a credit facility offered by a group of lenders and managed by a commercial or investment bank

as the lead lender. 5 For commodities, fuel surcharges in transportation industry or floating prices in gas stations are examples of pass-

through or natural hedging. For foreign exchange, borrowing in foreign currency or supply and sell with the same

currency are examples of the natural hedging strategies. 6 As an example, here is the IRP of Donnelley Corporation 2004 credit agreement:

“In the case of the Borrower, within 90 days after the Closing Date, enter into, and thereafter maintain, such Hedge

Agreements as are necessary to provide (together with any existing Hedge Agreements entered into prior to the date

hereof) that at least 50% of the aggregate principal amount of all Funded Debt at such time is subject to either a fixed

interest rate or interest rate protection for a period of not less than three years, which Hedge Agreements shall have

terms and conditions reasonably satisfactory to the Administrative Agent” 7 We appreciate Amir Sufi for providing these data in his website (http://faculty.chicagobooth.edu/amir.sufi/data.html). 8 We use mandatory (voluntary) IR hedgers and mandatory (voluntary) IR derivative users, or nonhedgers and nonusers,

interchangeably in the rest of the paper.

5

after controlling other variables affecting firm value. Voluntary IR hedging does not

demonstrate any significant impact on firm value in our empirical test. In addition, in a

sample of mandatory and voluntary IR derivative users, we find that the impact of interest

rate derivatives mandated by creditors on firm value is 9.6% larger than that of voluntary

ones, on average. These findings suggest that investors perceive mandatory term of using

IR derivative as a strong signal for a sound risk management practice and reward the IR

derivatives mandated by creditors, while they are cautious to price the impact of voluntary

derivatives whose real purpose is not clear.

It is unlikely that banks impose IRPC on firms with higher value. Nevertheless, the

special characteristics of the firms with IRPC, and firms’ acceptance of this covenant in

the credit agreement leave minor simultaneity concern. This concurrence is scrutinized by

implementing an instrumental variables (IV) approach and propensity score matching for

endogeneity and selection bias concerns. We use the reduction in cost of debt defined as

the difference between the LIBOR spread in credit agreement and the expected spread

based on firm’s and loan characteristics as the instrument for IRPC and find positive and

statistically significant impact from mandatory use of IR derivatives on firm value. We

also find that firms with IRPC have 14.4% (14.6%) higher value than propensity-score -

matched nonusers (voluntary users), on average.

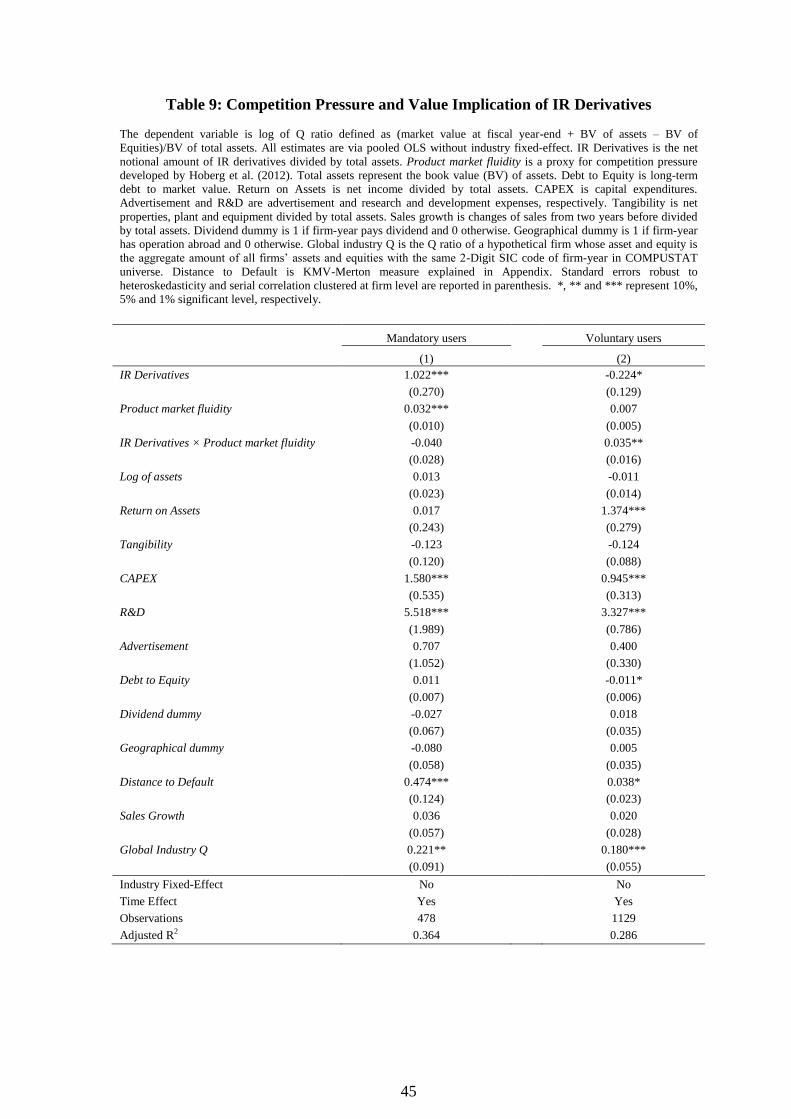
To highlight the difference between shareholders’ confidence in real purpose of

mandatory and voluntary use of IR derivatives, we show that shareholders rights, defined

by G-Index in Gompers, Ishii, and Metrick (2003), and competition pressure, defined by

product market fluidity in Hoberg, Philips, and Prabhala (2012), impact the value

implication of voluntary use of IR derivatives but do no influence that of IRPCs.

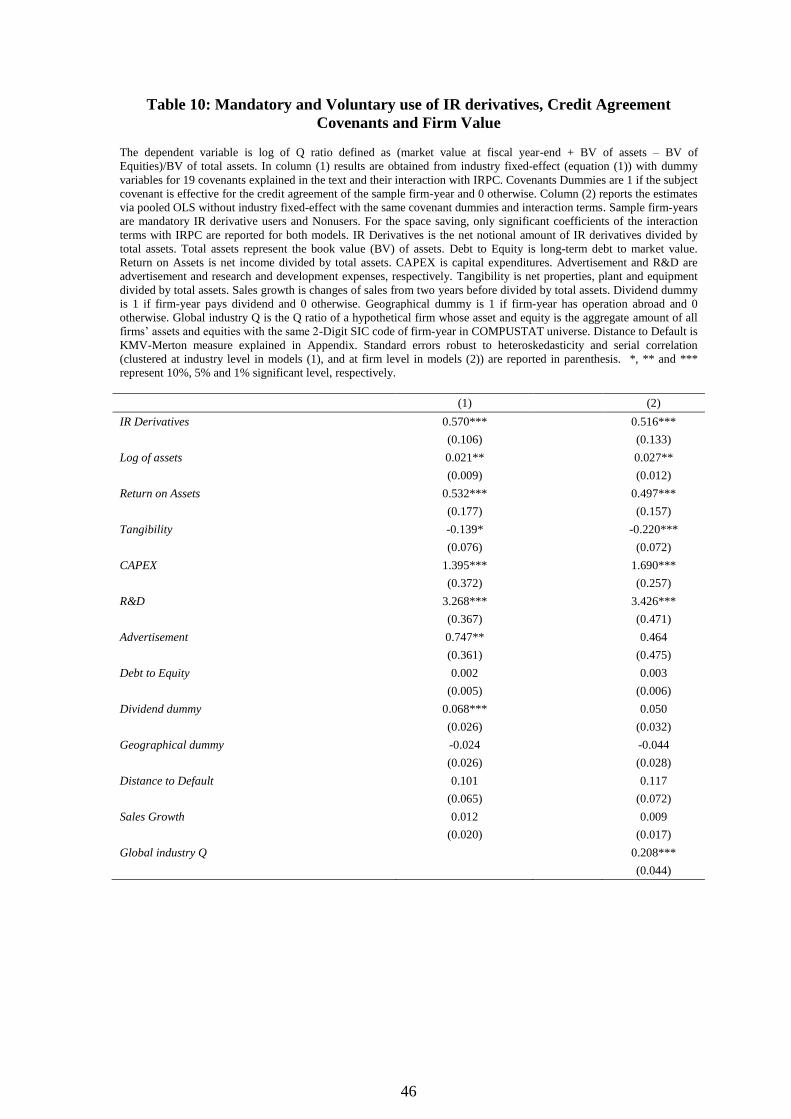
Syndicated loans usually have other covenants beside IRPC. These covenants impose

different restrictions on such liquidity, capital expenditures or net worth assets. With such

influences on firm’s operation, these covenants may impact firm value in parallel to or

independently from what IRPC does. However, our results are robust to the existence of

other covenants in the credit agreements. Using a dummy variable for 19 different

covenants and their interactions with IRPC, we find similar results to those in the baseline

model without controlling for these variables.

This research contributes to hedging literature by providing new evidence on the

importance of investors’ perception about the use of derivatives in value implication of

such financial instruments. It is also one step forward to unbiased estimation of the

influence of derivatives on firm value by focusing on hedging imposed by creditors rather

than those decided by managers in so far empirical researches. We also provide novel

6

empirical evidence in the interplay between competition pressure and premium on firm

value from the use of derivatives by comparing the impact of this factor on value

implication of voluntary and mandatory use of IR derivatives. In the loan literature, it

complements the empirical studies on the relation between mandatory hedging and cost of

debt. Beatty, Petacchi, and Zhang (2011) find that creditors reward the commitment of the

firms in hedging interest rate (IRPC) by reducing the LIBOR spread charged in credit

agreements. We show such reward from shareholders’ point of view by documenting a

positive impact from IRPCs on firm value. Moreover, consistent to Nini, Smith, and Sufi

(2012), this study illustrates that despite the existence of conflicts of interest between

shareholders and debt-holders, there are cases such as imposing IRPC in which creditors’

indirect influence on financial decision-making is in the interest of shareholders and

increases the value of the firm.

The remainder of the paper is organized as follows. In section 2, we review the literature

and develop the hypothesis. Section 3 describes the construction of the sample. Section 4

explains the empirical models and reports the results for the impact of IRPC and

voluntary IR hedging on firm value. Section 5 describes the robustness checks to

endogeneity and selection bias while section 6 examines the role of competing

hypotheses. Section 7 explains the robustness of our result to confounding factors.

Section 8 concludes the paper.

2. Related literature and developing hypothesis

Theories state that risk management increases firm value in an imperfect capital market

by reducing expected tax liabilities and financial distress costs, and by increasing firms’

debt capacity.9 However, the results of empirical research on the relation between the use

of derivatives, one of the main tools of risk management, and firm value is not conclusive.

For instance, Allayannis and Weston (2001), Graham and Rogers (2002), Carter, Rogers,

and Simkins (2006) and Adam and Fernando (2006) find positive impact of hedging on

firm value, while Tufano (1996), Jin and Jorion (2006), Lookman (2009a) and Bartram,

Brown, and Conrad (2011) document that this impact is not significant10

.

Theories in the context of principal-agent conflict of interests explain this empirical

evidence by focusing on managers’ motivation for hedging. Stulz (1984), and Smith and

Stulz (1985) explain the incentive of risk-averse managers to hedge when they can

9 Smith and Stulz (1985), Bessembinder (1991), Froot, Scharfstein, and Stein (1993), Nance, Smith, and Smithson

(1993), Géczy (1997), and Leland (1998). 10 We refer the reader to Smithson and Simkins (2005), and Aretz and Bartram (2010) for a comprehensive literature

review of hedging and firm value studies.

7

mitigate the risk of their own interests in the firm by hedging the same risk at corporate-

level. Géczy et al. (2007) also highlight the issue of speculation in the use of derivatives

by stating that “profitable speculation will (presumably) increase cash-based

compensation such as bonuses, whereas purely risk-taking speculation will not”. In their

confidential survey, they document that managers can inflate their performance-based

compensation by using financial instruments. More importantly, they show that investors

are not able to distinguish between speculative and non-speculative positions based on

firms’ disclosures. Several empirical studies document the issue of managerial self-benefit

in the use of derivatives. Lel (2011) shows that well-governed firms use currency

derivatives for risk management purposes while weakly governed firms mostly have

managerial incentives in using these financial instruments. Faulkender (2005) finds a

strong relation between the slope of the yield curve and interest risk management that

indicates the speculative use of derivatives. In Bodnar, Graham, Harvey, and Marston

(2011) risk management survey, 49% of nonfinancial and 54% of American firms indicate

that their forecast for interest rate is very important or important in their interest rate

hedging decisions. Borokhovich, Brunarski, Crutchley, and Simkins (2004) show the

impact of outside directors on the level of using interest rate derivatives.

In the light of this evidence, researchers aim to clarify derivatives used as real hedging by

focusing on mechanisms through which shareholders are able to control or identify

managers’ motivation in the use of derivatives. This clarification resolves the issue of

mixed results of empirical studies in value implication of risk management.

Literature suggests corporate governance, product market competition, and creditors’

controls as the main instruments in decreasing conflict of interest between managers and

shareholders in financial decisions including in the use of derivatives. Allayannis et al.

(2012) document that the use of currency derivatives is associated with higher firm value

in well firm- and country-level corporate governance regimes. Fauver and Naranjo (2010)

find that derivatives negatively influence the value of the firms that have high level of

agency problems and weak corporate governance system. While these studies shed light

on how the use of derivatives in a well-governed firm generates wealth for the

shareholders, they magnify the common issue of endogeneity in firm value and hedging

research, as corporate governance itself has a direct impact on firm value (see La Porta,

Lopez-de-Silanes, Shleifer, and Vishny, 2002) and quality of disclosures11

(see Eng and

Mak, 2003).

11 For instance, in Allayannis et al. (2012) firms with weak corporate governance system, particularly in country-level,

may not disclose derivative positions that might bias the results. In their research, the number of derivative users in

8

In the context of competition, Nain (2004) shows that the use of foreign exchange (FX)

derivatives increases the value of the firm when many of its competitors use FX

derivatives. When the use of FX is common in a particular industry, investors identify

currency risk and the incentive of hedging this risk in the industry. Therefore, they

perceive the use of FX derivatives as an efficient risk management instrument. However,

the impact of product market competition on value implication of derivatives is not

limited to the identifying a risk factor. Several researches explain how competition

pressure harmonizes the incentive of managers with shareholders’ in the use of corporate

resources (See Hart, 1983; Schmidt, 1997; and Raith, 2003). Empirical studies such as

Hoberg et al. (2012), and Frésard and Valta (2012) document the impact of competition

pressure on corporate policies e.g. payouts and cash holdings. Studies such as

Chhaochharia, Grinstein, Grullon, and Michaely (2012) show product market competition

as a substitute for corporate governance. Therefore, considering risk management as part

of corporate policies, we expect that competition pressure also improves the value

implication of derivatives.

In this paper, we complement the recent studies by focusing on creditors’ control in the

use of derivatives. By imposing covenants in credit agreements, creditors effectively limit

the managers’ opportunism in over-investment or exerting corporate assets for personal

benefits. Nini et al. (2012) state that creditors influence the corporate governance

indirectly by restricting financial decision-making. This action is rewarded by

shareholders and increases firm value. Creditors’ influence on corporate decision-making

is not limited to restrictions and encompasses affirmative covenants such as mandatory

use of derivatives for interest rate risk management. Mandatory use of IR derivatives

relaxes the “no managerial incentive” assumption in value implication of using

derivatives, making them completely aligned with risk management theories. Banks

impose hedging for reducing the risk of default and bankruptcy, in parallel to

shareholders’ benefit. Borrowers accept this term in credit facility to increase their debt

capacity, diminish underinvestment problem, and take the tax advantage of the leverage.

Taken together, we hypothesize that the commitment to use IR derivatives in a credit

agreement is a strong signal to the shareholders that the purpose of these instruments is

not for private benefit. Same as creditors, shareholders identify these positions as

corporate risk management instruments and consider a premium for firm value from these

low and high quality corporate governance system is not reported separately that makes it hard to justify that the

positive but insignificant result of the impact of currency derivatives for low quality governance system is from

investors’ perception about the use of derivatives or from the number of observations in the test.

9

hedging practices. The average impact on firm value from voluntary IR derivatives whose

application is not clearly identified by the shareholders is not expected to be significant.

To bolster our hypothesis, we borrow from two strands of the literature discussed above,

i.e. the impact of corporate governance and product market competition on managerial

incentives in corporate financial policies including the use of derivatives. Since the

mandatory term of using IR derivatives suffices as a signal of real risk management for

shareholders, we conjecture that shareholders’ right and product market competition do

not influence the impact of IRPCs on firm value, while we expect a significant impact

from these factors on value implication of voluntary use of IR derivatives.

It is a question that instead of offering a loan with floating interest rate and imposing

IRPC, why banks do not offer a fixed rate loan. Vickery (2008) explains the issue of

maturity mismatch in banks’ holdings that makes banks to incline toward floating rate

lending. We extend this argument in syndicated loan agreements. Since more than one

bank is involved in syndicated lending, the issue of maturity mismatch is more

complicated than for a single lender. In addition, almost all syndicated loans have the

repayment option that amplifies the issue of maturity mismatch in this type of lending if

banks offer a fixed rate loan.

It is also at the benefit of the borrower to have a floating rate loan with IRPC instead of a

fixed rate one, if it expects an improvement in its credit quality that is not observable by

creditors. The credit spread of a fixed rate loan is evaluated based on information

available at the time of initiation and may burden an extra cost of debt on borrower if its

credit quality improves before the maturity of the loan, assuming that fixed rate loans

have no or expensive repayment (call) option. Therefore, firms can borrow in floating rate

and have the benefit of performance-based interest charges in these types of agreements

and fix the interest rate with financial instruments12

. This argument provides an additional

support for value implication of IRPCs in credit agreements.

3. Sample Description

We construct our sample based on the dataset used in Nini et al. (2009). This is a unique

sample of 3720 syndicated loan agreements of 1939 firms from 1996 to 2005. It includes

the text of the credit agreement and classification of the covenants for each contract.

12 One may argue that the borrower pays higher swap or collar rate instead. Since these financial instruments exchange

the net amount of position not the notional, they have lower credit risk spread than in lending the same notional

amount with fixed rate. Even with equal credit spread, borrower still saves the extra cost of the call option of a fixed

rate lending.

10

First, we drop financial institutions and utilities from the sample, 149 firms (375

contracts) in total, due to their special capital structure and regulatory system. Then, we

manually search for “term loan”, “term-loan”, “term agreement”, “term contract”, “term

credit”, and “prime rate” keywords in the text file of each agreement. In this stage, we

short list firms which have at least one term loan during 1996-2005 period and the index

of the term loan is not the prime rate. We work on term loans since these credit

agreements have an explicit value, repayment schedule, and maturity. The interest rate

risk of the term loans is more expected to be hedged compared to that of line of credits

whose credit limit and outstanding amount fluctuate frequently. In addition, we remove

term loan agreements in which prime rate is the index used for interest rate calculation;

because, interest rate derivatives are based on LIBOR and firms that pay interest based on

prime rate and use IR derivative, face a basis risk coming from uncorrelated movement of

two indexes. At this stage, we find 787 individual firms which have at least one term loan

based on LIBOR from 1996 to 2005.

For these firms, we extract their 10-K13

filings from Electronic Data Gathering, Analysis

and Retrieval system (EDGAR) of SEC from 1998 to 2005. We start from 1998 because

FRR-48 statement, also called item 7a, of SEC is effective from July 15, 1998. This

statement obliges firms to disclose quantitative information for their derivative positions

and market risks in their 10-K filings. The quantitative disclosure assures that all

derivative positions are disclosed in the filings while market risk disclosure reconfirms

that the sample firm is exposed to interest rate risk.

In each 10-K filing, we search for “credit facility”, “credit agreement”, “term loan”,

“term-loan”, “term contract”, “term agreement”, and “bank loan” keywords. By doing so,

we make sure that the firm-year has a term loan credit facility and that term loan has an

outstanding amount and is not repaid. Although the syndicated loan agreements with

interest rate based on prime rate are excluded in the previous stage, it is possible that a

firm issues a syndicated loan with prime rate in addition to other loan agreements.

Therefore, we also recheck that the interest rate of the term loan is not based on prime

rate. The sample firm-year is dropped if it does not issue a syndicated term loan or issues

such loans only with interest rate based on prime rate. This process generates 3976 firm-

year (784 firms) observations.

13 Including 10-K405 and 10-KSB filings but we use only “10-K” in the text for brevity.

11

Next, we collect accounting and market information such as net income, book value of

assets, long-term debt and share price14

from COMPUSTAT and CRSP databases for all

3976 firm-years. we look at the data of firm-years whose total assets, stock price, sales,

return on assets, leverage, and Q ratio15

are outside the 1st and 99th percentile to check

for outliers. Among these firm-years, we remove 87 firm-year observations (3889 firm-

years remain) due to the negative stock price, bankruptcy, or Chapter 11 filing.

Finally, we manually collect the notional and type of IR hedging derivatives (float to

fixed or reversed) by searching relative keywords16

in the 10-K filing of each firm-year of

the 3889 firm-year observations, and reading the text surrounding them. We also conduct

our search with the same keywords in the body of all firm’s term-loan agreements in Nini

et al. (2009) dataset issued on or before the date of the filing to find whether the credit

agreement includes an interest rate protection covenant. We classify an interest rate

derivative found in the 10-K filing as mandatory, if the report indicates that banks require

the firm for this hedging or if an IRPC exists in the matched term loan agreement of the

firm-year. IRPCs are all float to fixed IR derivatives while voluntary derivatives

sometimes are a combination of fixed to float and reversed contracts. In case of mixed IR

derivative positions, we calculate the net position of the contracts17

. We normalize the

total net notional amount of all interest rate derivatives by total assets of the firm-year. A

firm-year is an IR derivative nonuser, if it explicitly indicates that it does not use IR

derivatives or if our search does not find any related keyword in 10-K filing. In this stage,

we also drop 8 firm-years for which we could not find the notional value or type of the IR

derivative in their 10-K filings. The final sample includes 3881 firm-years (728 firms)

with 481 firm-years (153 firms) mandatory and 1140 firm-years (356 firms) voluntary

interest rate derivative users, and 2260 firm-years (611 firms) nonusers.

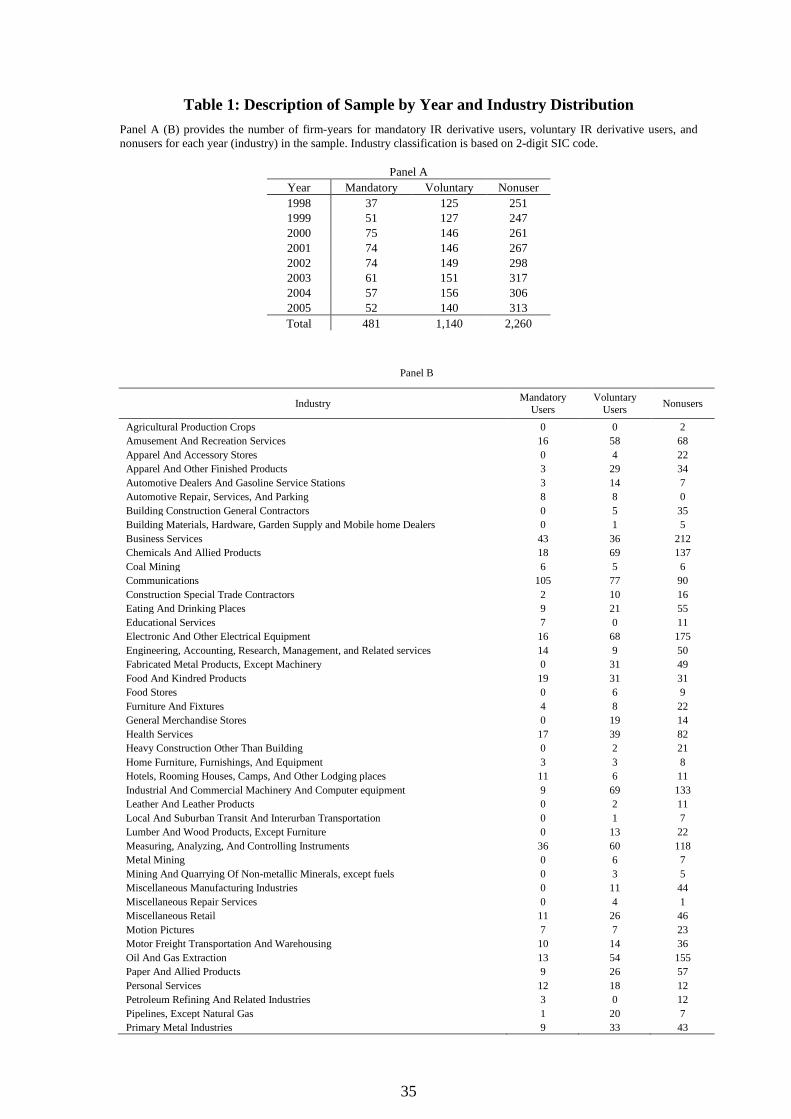
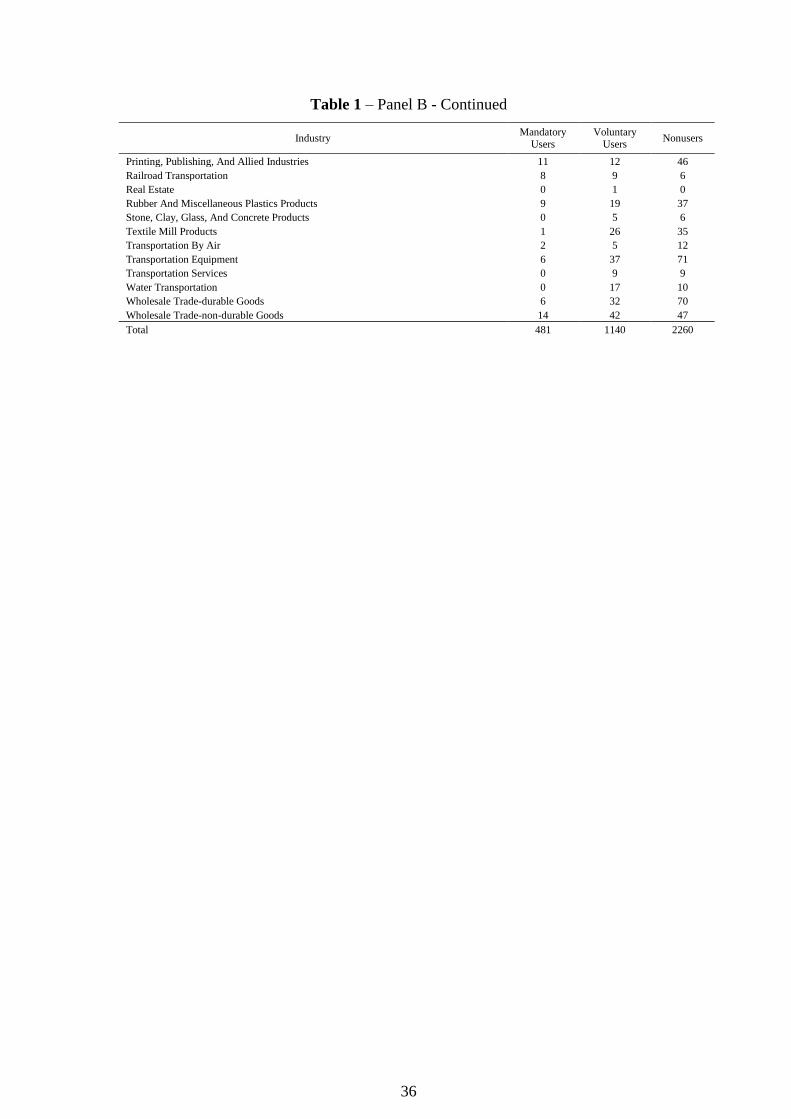
Table 1 provides the number of nonusers, mandatory, and voluntary IR derivative users

for each industry in our sample. As presented in the table, our sample offers a wide

distribution in different industries. The proportion of nonusers, mandatory, and voluntary

IR derivative users is respectively 12.4%, 29.4% and 58.2%. Firms in communication

industry have the highest number IR derivative users which may raise the concern of bias

14 Share prices are at the end of fiscal years. We also conduct our test based on share prices at the end of calendar years

and the results are qualitatively similar. 15 Detailed explanation of variables is available in Appendix. 16 The list of keywords is: “hedg”, “risk management”, “derivative”, “swap”, “collar”, “rate cap”, “rate floor”, “rate

option”, “rate protection”, “rate contract”, and “rate agreement”. 17 We examine the impact of these contracts by adding the notional amount of contract and also by separating fixed to

float and reverse ones, explained in the robustness test section of this paper.

12

in our empirical test from this particular industry. When we remove observations from

this industry, our results are qualitatively similar to those including these observations.

[Table 1]

Panel A, B, and C of Table 2 provide descriptive statistics of firms’ characteristics for IR

derivative nonusers, voluntary, and mandatory users, respectively. Description of all

variables and their sources are provided in the Appendix.

Our sample offers substantial variation in firms’ assets with $76.72M and $3339.13M for

nonusers, $171.00M and $8480.56M for voluntary users, and $95.54M and $3892.10M

for mandatory users, in 10th

and 90th

percentile, compared to minimum $500M assets in

Allayannis and Weston (2001) sample.

[Table 2]

Table 3 compares firms’ characteristics in three subgroups, mandatory versus nonusers,

voluntary versus nonusers, and voluntary versus mandatory users. Panel A reports the

difference in mean, while Panel B exhibits the differences in median for each variable.

The median of R&D and advertisement expenses is 0 for all subgroups and consequently

are not reported in Panel B. Consistent with previous research, both mandatory and

voluntary hedgers are larger in size than non-hedgers. However, voluntary hedgers are

larger than mandatory ones. Mandatory hedgers are more levered, less profitable and have

higher default risk (measured by KMV-Merton distance to default). They also have lower

R&D expense and capital expenditures (CAPEX) compare to voluntary and non-hedgers.

Following Allayannis and Weston (2001), we use log of Q ratio as a proxy for firm value.

The mean and median of log of Q ratio of mandatory hedgers is not significantly different

from those of voluntary and nonusers.

[Table 3]

These univariate results shed light on specific characteristics of mandatory hedgers in our

sample, i.e. they are highly levered and have lower distance to default. These

characteristics are consistent to what risk management theories predict (Nance et al.,

1993) for hedgers. Moreover, these special factors of mandatory hedgers such as lower

profitability and investment, and higher default risk have no or negative influence on firm

value. This fact substantially reduces the concern of endogeneity in the empirical tests

explained in the next section.

4. Do IR derivatives increase firm value?

To test the impact of IR derivatives on firm value in cross-sectional and within-industry,

we implement an industry fixed-effect model as follows:

13

, , , control variables (1)i t i t j i t t i it

j

Q IR derivatives

in which, i and t subscripts refer to firm i at year t. The dependent variable is the log of Q

ratio and represents firm value in our model.

IR derivatives is the hedging intensity of interest rate derivatives which is the net amount

of all IR derivative positions normalized by total assets. Using intensity of hedging is

more informative than a dummy variable for hedger and non-hedger since it represents the

extent of hedging in the model as well. In addition, a simple classification of hedger and

non-hedger increases the endogeneity concerns by ignoring the impact of the level of the

hedging on firm value.

Firm value is affected by factors which are generally classified as profitability, growth

options, and risk. To isolate the impact of IR derivatives on firm value from these factors,

we follow Allayannis and Weston (2001). They use return on asset as a proxy for

profitability, log of assets, dividend dummy (equal to one if firm-year pays dividend and

zero otherwise), and capital expenditures divided by total assets as proxies for growth

options. Debt to equity and credit rating are used as proxies for firm’s risk. However, we

do not include industrial diversification dummies since our firms are smaller in size.

Most of the firms in our sample do not have credit rating. As a substitute, we use KMV-

Merton distance to default explained in Crosbie and Bohn (2003) and used in Campello,

Lin, Ma, and Zou (2011). This measurement takes into account the volatility of assets and

debt level. Altman (1968) Z-Score is an alternative but this measurement has variables

such as profitability in common with control variables in our model that potentially

reduces its explanatory power. Beside the capital expenditure, we use advertisement and

R&D expenditures normalized by total assets, and two-year sales growth as other proxies

for growth options. We also use debt to equity as a measurement of leverage similar to

that used in Allayannis and Weston (2001). The use of book leverage does not change our

results but we prefer debt to equity in our model for two reasons. First, book leverage has

a strong correlation with IR derivatives intensity in our model and reduces its explanatory

power. Second, debt to total assets is already embedded in KMV-Merton distance to

default. Researches address the issue of tangibility in growth options. Tangible assets are

also more valued for collateral in credit agreements. Therefore, we employ tangibility in

our model and use net amount of properties, plant and equipment divided by total assets

as a substitute for this variable. ηt and ωi are time and industry fixed-effects classified as

2-digit Standard Industrial Classification (SIC) code, respectively that represent the

marginal impact of these effects on the intercept of our model.

14

4.1 Impact of mandatory IR derivatives on firm value

We first conduct our test in a sample of mandatory IR derivative users and nonusers and

estimate heteroskedasticity consistent standard errors clustered at industry level. Industry

fixed-effect in our model circumvents the impact of time-constant unobserved industry’s

characteristic on firm value that partially reduces the endogeneity concern from industry-

specific parameters. However, time varying unobserved heterogeneity among industries is

not addressed.

[Table 4]

Column (1) of Table 4 exhibits the result of the test with industry fixed-effect. Consistent

to our hypothesis, IRPC’s coefficient is positive and highly significant. If we apply the

average IRPC intensity reported in Table 2 into the model and the corresponding

coefficient in Table 4, we find that an average mandatory IR derivative user has a Q ratio

7.6% (e0.183×0.4

-1) higher than a nonusers, which is economically significant. The

coefficients of the control variables have the expected sign and are statistically significant.

More specifically, tangibility has a large negative impact on Q ratio while profitability,

capital expenditures, advertisement and R&D expenses, dividend dummy, and distance to

default have positive and significant impact on firm value.

We also conduct our test as a pooled OLS without industry fixed-effect. Since many

industries have naturally higher or lower Q ratios, we add the Global industry Q to our

model in case that control variables have weak explanatory power for industry-specific

characteristics of the firm-years. The coefficients and heteroskedasticity consistent

standard errors clustered at the firm level are reported in column (2) of Table 4. Again,

IRPC shows a positive and significant impact on firm value similar to what we find in the

first test. The coefficients of the control variables have the same sign as those in the fixed-

effect model. These findings suggest that shareholders perceive IRPCs as efficient interest

rate hedging instruments and set a positive premium on firm value from these financial

instruments.

4.2 Impact of voluntary IR derivatives on firm value

Hitherto, our results indicate a positive and significant impact from IRPCs on firm value.

While mandatory term of IRPCs sends a strong signal about the purpose of using such

derivatives for hedging interest rate risk, the real purpose of voluntary use of IR

derivatives is not as clear for shareholders. Therefore, such positive impact of IRPCs on

firm value is not expected from voluntary IR derivatives.

15

To test the impact of voluntary use of IR derivatives, we conduct our test based on

equation (1) but on the sample of voluntary IR derivative users and nonusers. We also

conduct our test without industry fixed-effect as a pooled OLS and add Global industry Q

to our model. Columns (3) and (4) of Table 4 report the results of these tests. As expected,

voluntary IR derivatives do not demonstrate any significant impact on firm value in both

models. The sign of coefficient of control variables is similar to our test on IRPCs, except

the sign of Debt to Equity in pooled OLS model though is not significant. These results

explain that shareholders are cautious in pricing IR derivatives when the real purpose of

such derivatives is not clear.

4.3 IRPC and value implication of IR derivatives

Previously, we isolated mandatory and voluntary IR derivatives and documented a strong

impact from IRPC and no significant impact from voluntary ones on firm value. The

agency conflicts between shareholders and managers, and the mandatory term of using IR

derivatives in IRPC clearly explain these results. IRPC significantly reduces the

information asymmetry between shareholders and managers about the motive behind the

use of IR derivatives, making such derivatives completely aligned with sound risk

management practices.

In this section, we turn our attention to signaling effect of mandatory term in IRPCs. To

determine whether investors perceive an IRPC as a signal for no managerial incentives

embedded in the use of IR derivatives, we estimate whether their evaluation of IR

derivatives differs between voluntary and mandatory use of derivatives. To do so, we

make a distinction between IR derivatives mandated by credit agreements and those

applied voluntarily by managers, and define our model as follows:

, 1 , 2 , 3 , ,

,

+ control variables (2)

i t i t i t i t i t

j i t t i it

j

Q IRPC dummy IR derivatives IRPC dummy IR derivatives

Dependent and control variables are similar to those in equation (1). IRPC dummy is a

dummy variable equal to one if the IR derivative is mandatory and zero otherwise. The

coefficient of interaction term between IRPC dummy and IR derivatives explains the

investors’ perception about the mandatory term of the IR derivatives. Based on our

hypothesis and previous findings, we conjecture a positive and significant value for this

coefficient. We conduct our test on a sample of mandatory and voluntary users of IR

derivatives. Similar to our previous tests, we also add Global industry Q to control

variable and test the model without industry fixed-effect.

16

[Table 5]

Table 5 reports the results of both models. The average impact of IR derivatives on firm

value is positive but not significant. However, we observe that mandatory term of using

IR derivatives has a significant effect on investors’ valuation of IR derivatives. In fact,

shareholders put a substantial premium on the IR derivatives mandated by creditors. The

coefficient of IR dummy × IR derivatives is large (0.5), positive, and statistically

significant. If we apply the average intensity of IRPCs reported in Table 2 in our model, it

reveals that on average, the impact of IR derivatives mandated by creditors on firm value

is 9.6% (e0.5×0.183

-1) higher than that of voluntary ones. This estimate explains the

signaling effect of mandatory term of using IR derivatives.

5. Do endogeneity and selection bias affect the results?

The results in section 4 strongly support our hypothesis and document a positive and

significant impact from mandatory IR hedging on firm value and no significant influence

from voluntary ones. However, it is possible that mandatory IR hedging is an endogenous

factor in the model. Almost all researches in financial decision including hedging have the

reverse causality concern, since these decisions are firm-choice and the special

characteristics of these firms might bias the result of empirical tests.

Mandatory hedging is creditors’ rather than firm’s decision. In addition, as discussed in

Campello et al. (2011), there is a substantial “institutional mismatch” between hedging

counterparties and lenders particularly, when 85% of IR hedging contracts is provided by

five financial institutions, according to Fed’s regulatory 2002 statistical information.

However, creditors may impose IRPC on firms with special characteristics. For instance,

firms with more growth options are more subject to asset substitution. Consequently,

these firms are more vulnerable to be enforced by the banks to hedge while their growth

options accounts for their higher value. Moreover, it is firm’s choice to accept a credit

agreement with IRPC that exacerbates simultaneity in our model.

The univariate analysis explained in Table 3 does not clarify this concern. While firms

with IRPC have fewer tangible assets than voluntary IR derivative users’, they have less

R&D expense relative to voluntary IR derivative users and nonusers and less capital

expenditure than those of voluntary IR derivative users. Table 3 also shows that

mandatory IR derivative users have lower (higher) distance to default (leverage) than that

of voluntary and nonusers. Therefore, we implement an instrumental variable approach

and propensity score matching, to alleviate the issue of endogeneity and selection bias in

our test on the impact of IRPCs on firm value.

17

5.1 Instrumental variable approach

To define an instrumental variable that explains the mandatory hedging but does not

directly impact firm value, we refer to the findings in Campello et al. (2011) who state

that IR and foreign exchange rates hedging reduce the LIBOR spread in syndicated loan

agreements. Moreover, Beatty et al. (2011) exclude mandatory use of IR derivatives and

find that IR hedging enforced by creditors reduces LIBOR spread more significantly than

voluntary ones. Therefore, we develop a proxy for the reduction in LIBOR spread by

IRPCs and use it as an instrumental variable. This factor is the incentive of commitment

to hedge from creditor’s point of view that theoretically is identified by shareholders as

well.

First, we collect the details of credit agreement of our firm-years including loan amount,

maturity, LIBOR spread, performance pricing, loan type, loan purpose, seniority,

collateral and credit rating from LPC DealScan database. For contracts with performance

pricing, we collect the minimum and maximum LIBOR spread charged by lender from

the text of the agreement. For each firm-year, we match the contract and calculate the real

LIBOR spread paid according its credit agreement as follows:

,

, 1 (3)i

i i

i

performance i t

i t contract performance

contract

D leveragereal Spread spread D

Leverage

in which, spreadcontract is All-in spread charged by the bank over LIBOR reported in LPC

DealScan database. Since most of the credit agreements are performance based for

calculation of LIBOR spread, we adjust the real spread based on the current book

leverage (leveragei,t) relative to the book leverage at the time of contract (leveragecontract).

However, we bond the adjusted value of spread to minimum and maximum LIBOR

spreads stated in the credit agreement. Dperformance is a dummy variable which is one if the

credit agreement has performance pricing and zero otherwise. With this dummy variable

in our calculation, real spread is equal to spreadcontract if the contract is not performance

based.

Next, we follow the empirical model in Graham, Li, and Qiu (2008) used in Campello et

al. (2011) to calculate the expected LIBOR spread as follows:

(log) ( , c , ,

) (4)

spread f firm charactristics ontract specifications macroeconomic factors

industry fixed effect

in which firm characteristics include size (log of assets) , EBIT (Earnings Before Interests

and Taxes) over assets, tangibility, market to book, leverage, Altman (1968) Z-Score,

credit rating, and asset volatility. Contract specifications include loan size (log), Maturity

18

in months (log), loan type (term loan or hybrid), performance pricing, and loan purpose.

Credit and term spreads are included in macroeconomic factors. The details of all

variables are available in Appendix. First, we run the model at contract level (1747

contracts) and estimate the coefficients. Then, we predict the LIBOR spread for each

firm-year by plugging the variables. Contract specifications are constant except we

update the maturity and amount of loan. For maturity, we calculate the remaining months

to maturity date. For loan amount, we extract the outstanding amount of the loan from the

10-K filing if the information is not available otherwise we estimate the outstanding

amount by applying the change in the level of long term debt to loan size. Last, we

subtract the expected spread estimated by model (4) from real spread calculated in model

(3) and divide by spread of the contract as our instrument:

(5)spread

contract

real spread estimated spread

spread

Based on findings in Beatty et al. (2011), spread is expected to have high correlation with

imposing IRPCs when commitment to hedge diminishes the agency cost between

creditors and shareholders and consequently reduces the cost of debt. Therefore, this

factor meets the inclusion condition of an instrumental variable. spread is not expected to

have correlation with firm value. The potential impact on firm value from this factor

comes from the reduction of cost of debt. However, this reduction should be applied to

outstanding amount of loan to be identified as real change in cost of debt. Moreover, the

real interest paid by firm is based on the level and terms of the hedging agreement that

should be taken into account for calculation of cost of debt. Therefore, we do not expect a

first-order impact from this factor on firm value, making it complied with exclusion

condition of instruments18

.

On a sample of mandatory users of IR derivatives and nonusers, we conduct the

instrumental variable estimations in two stages. First, we regress IR derivatives on

instrumental and independent variables of the baseline model (equation (1)). Second, we

use the predicted values of IR derivatives from the first stage regression in the baseline

model. Similar to our test of IRPCs with the baseline model, we conduct this 2SLS test in

a sample of mandatory IR derivative users and nonusers, and estimate heteroskedasticity

18 We evaluate other instruments as well. For instance, we investigate conditional IRPCs in which creditors set a

threshold for imposing IRPC. EBIT to Debt, interest rate coverage ratio, and fixed-charges coverage ratio are the main

scales for imposing IRPCs. EBIT as the main parameter in all three factors is indirectly controlled in return on assets

in the baseline model. On top of that, all three factors have a direct impact on firm value and fail in exclusion

restriction of instrumental variables. We test these variables as an instrument in our model and all fail in Hansen J

over-identification tests, as expected. However, we use EBIT to Debt ratio as a control variable in propensity score

matching explained in the next section.

19

consistent standard errors clustered at industry level with and at firm level without

industry fixed-effect. Column (1) and (2) of Table 6 report the coefficients of these tests,

respectively.

[Table 6]

Consistent with the results in the baseline model, mandatory hedging has significant and

positive impact on firm value. Control variables in both IV models show signs and

magnitudes consistent with the results in tests without instruments. These findings

indicate that the instrument used treats endogenous variable exclusively with limited

impact on explanatory power of other control variables. As stated in Campello et al.

(2011), FX hedging also reduces the LIBOR spread that might generate noises in our IV

estimation. Therefore, we exclude FX derivative users from our sample and conduct our

IV test. Column (3) and (4) of Table 6 show the results. After excluding FX hedgers,

IRPCs still have a positive and significant impact on firm value that supports our finding

in the test on whole sample.

In all four IV tests, the coefficient of spread is negative and highly significant (p-value

0.00%) in the first stage of our test. As reported in the table, the first stage F-tests are

12.59 and 13.49 for with and without industry fixed effect models, respectively, higher

than commonly accepted level 10 (rule of thumb). When we exclude FX hedgers, the F-

tests is even higher which is 23.74 (31.55) for with (without) industry fixed effect models,

indicating the strong explanatory power of our instrument for IRPCs.

Since the real error terms in our model are unobservable by definition, it is almost

impossible to completely justify the exclusion condition of our instrument. However, to

increase our confidence in validity of our instrument, we conduct additional tests to

ensure the exclusion condition of our instrument, beside our economic explanations. We

replace IR derivatives with spread in the baseline model and estimate its coefficient in a

sample of mandatory IR derivative users and nonusers. The coefficient is negative and

significant at 7% level. Then we add IR derivatives to the model and re-estimate the

coefficient of spread . After adding IR Derivatives, this coefficient is not significant at all

(p-value 16%). It indicates that spread does not directly impact firm value but through its

correlation with IRPCs. As an additional evaluation, we implement the same IV approach

in a sample of voluntary IR derivative users and nonusers. Similar to our test on IRPC, the

coefficient of spread is negative and highly significant (p-value 0.00%). However, the first

stage F-test is 9.23 which is lower than that of previous test. The coefficient of IR

20

Derivatives in this IV model is positive but not significant (p-value 16%). It shows that

first, spread does not have a direct impact on firm value and exclusively explains the value

implication of IR Derivatives. Second, consistent to our finding in the baseline model,

voluntary use of IR derivatives does not influence firm value.

Taken together, these results show that mandatory hedging has a positive and significant

impact on firm value. While industry fixed-effect partially minimizes the issue of

endogeneity by controlling industries’ time-constant characteristic, our IV instrument

cleans out the time variant unobserved factors and supports the robustness of the results of

this empirical study, if we assume spread as a valid instrument for mandatory hedging.

5.2 Propensity score matching

In the previous section, we implement an IV approach to mitigate the issue of reverse

causality in the impact of IRPC on firm value. However, the issue of selection bias is not

addressed, particularly, in the evaluation of the impact of IRPC on value implication of IR

derivatives. Banks enforce firms with special characteristics to hedge interest rate risk.

Therefore, there is a concern for selection bias from observable and unobservable

characteristics of the firms, when we test the impact of IR derivatives. To address this

concern, we conduct a propensity score matching for IRPC treatment in two mandatory-

nonuser and mandatory-voluntary subgroups.

Bartram et al. (2011) use the same methodology to compare the Q ratio of hedgers and

non-hedgers. Since we have a subgroup of mandatory hedger in our test, we setup two

separate tests for a robust conclusion of the results. Based on our hypothesis, we define

two distinct treatments, the impact of mandatory IR derivatives on firm value and the

impact of mandatory term of using IR derivatives on investors’ evaluation of such

derivatives. For testing the first treatment, we match mandatory hedgers with nonusers of

interest rate derivatives and compare the Q ratios while for the latter we conduct our test

by matching mandatory hedgers with voluntary ones.

For each test, we generate propensity scores with a logit model, using a dummy variable

for mandatory users of IR derivatives as the dependent variable and a set of variables as

determinant of imposing IRPCs and firm value. We also restrict this procedure for each

year to limit the matching of treated with control firms from different years19

.

Size, growth opportunities, leverage, and default risk are the main determinant of hedging

according to risk management theories and have a potential impact on firm value as well.

19 We also conducted the logit model with year dummies. The results after matching are qualitatively similar. We prefer

the way of isolating years since the Bias defined in equation (6) is much lower than those in the model with year

dummies.

21

Therefore, for matching mandatory IR derivative users with nonusers, we use Log of

Assets and Debt to Equity as well as CAPEX, R&D and, Advertisement as substitutes for

growth opportunities. KMV-Merton distance to default measure is also used as a proxy

for default risk. We also use EBIT to Long-term Debt ratio (EBIT/LT debt) since it is the

most common parameter in conditional IRPCs and a proxy for profitability of the firm.

In matching mandatory hedgers with voluntary ones, we also add IR derivatives. In fact,

by adding IR derivatives intensity, we test the difference between the firm value of

mandatory IR hedgers with that of voluntary IR hedgers which have the closest

characteristics to the sample firm, including the level of the use of IR derivatives. Global

Industry Q is also included in both tests for industry-specific variation of the variables. To

suppress biases from other value generating factors, we add Tangibility to control

variables as well (see Bhojraj and Lee, 2002).

After generating propensity scores for each test, we conduct our analysis by matching

each treated firm-year with a firm from controlling samples whose propensity score is the

closest to and is maximum 0.01 different from that of treated (Caliper 0.01). Then, we

compare the Q ratio of treated, which are mandatory hedgers in our test, with the Q ratio

of the matched firm-years. We conduct these tests with and without replacement20

.

To assess the quality of matching, we report the bias of variables before and after of the

matching calculated as follows (Rosenbaum and Rubin, 1985; and Rubin, 1991):

2 2

( )(%) 100 (6)

( ) / 2

T M

T M

Bias

in which, μT (μM) and σT (σM) is the mean and standard deviation of each variable used in

matching procedure for treated (matched) samples, respectively. The comparison of Bias

before and after matching depicts to what extent the matching procedure reduces the

selection bias of observable firm’s characteristics in our sample.

Panel A (B) of Table 7 reports the result of matching between mandatory IR derivative

users and nonusers with (without) replacement.

[Table 7]

On average, mandatory hedgers have 14.6% (1.587/1.385-1) higher value than propensity

score matched non-hedgers with 0.0% p-value of the t-test. The median of the Q ratio of

the mandatory hedgers is also 8.9% higher (p-value 0.0%), indicating that the impact of

IRPC is economically and statistically significant. This result supports our findings in the

baseline model and IV tests and suggests that interest rate risk management embedded in

20 All of the estimates are obtained using Leuven and Sianesi (2003) psmatch2 and pstest programs for Stata.

22

the IRPC accounts for the higher firm value of mandatory hedgers and this premium is not

biased by special characteristics of mandatory hedgers. Figure 1.A (1.B) graphically

exhibits the level of biases before and after the matching with (without) replacement. As

demonstrated, the matching significantly reduces the bias of variables where the

maximum bias is less than 6% compare to 40% before the matching.

[Figure 1]

In the next step, we analyze the impact of mandatory term of using IR derivatives on

value implication of such financial instruments. Panel C and D of Table 7 exhibit the

results for matching with and without replacement, respectively. Consistent with the

baseline model, the result shows that the average (median) of firm value of mandatory

hedgers is 14.4% (10.5%) higher than that of propensity score matched voluntary hedgers,

and the difference is highly significant , i.e. 1.0% and 0.0% p-value for mean and median

comparison, respectively. Since, the level of using IR derivatives is also included in

control variables, this result clearly explains that investors evaluate mandatory IR

derivatives with a premium compare to voluntary ones whose purpose is not transparent

for shareholders. Figure 1.C (1.D) demonstrates the biases before and after the matching

with (without) replacement. Variables before the matching are highly biased, 42% at

maximum, while this bias is significantly reduced to 11% maximum level after the

matching.

Our results indicate that with propensity score matching we remove most of the bias

attributable to observable covariates. However, our conclusion about the value

implication of IRPCs is valid if we assume that there is no unobserved variable affecting

bank decisions to impose IRPC in a credit agreement. Since we cannot estimate the

impact of unobservable variables, we follow Rosenbaum (2002) sensitivity analysis

technique used in Bartram et al. (2011) to evaluate the concern of hidden biases in our

inference. In fact, ideally, in a large and purely random selection of observation, the

expected odds ratio in having IRPC in a credit agreement is one for two firms with

identical characteristics. Indeed, a hidden bias from an unobservable characteristic can

produce a multiple of odds and reduce the precision of our inference about the impact of

the treatment. Rosenbaum (2002) sensitivity analysis is a conservative measurement of

this impact based on “worst case” scenarios as mentioned in DiPrete and Gangl (2002). In

this analysis, for odds of treatment greater than one and in 0.01 steps, we compute an

interval of p-values related to uncertainty about the hidden bias. We stop our analysis at

p-value greater than 5% where we have the maximum odds of treatment for which we

reject the impact of hidden bias on the probability of receiving treatment, at 95%

23

confidence level. Clearly, the higher is the odds ratio at this level of confidence the lower

our result is sensitive to unobservable variables.

Our sensitivity analysis shows 1.15 (1.16) and 1.21 (1.18) odds of treatment at 95%

confidence level for propensity score matching with nonusers and voluntary users with

(without) replacement, respectively. This value is much larger than those in Bartram et al.

(2011) who find 1.00 with caliper propensity score matching. It indicates that mandatory

term of using derivatives is a so strong signal for real risk management that significantly

reduces the sensitivity of our results to hidden biases. We also conduct the same

methodology of DiPrete and Gangl (2002) used in Bartram et al. (2011) to quantify the

impact of unobservable variables. We show to what extend the average of each observable

variable should change to have the same impact from an unobservable variable as an

economic interpretation of our sensitivity analysis. For space saving, we stick to the

results of matching without replacement which are more conservative in this analysis. In

matching with nonusers, the effect of an unobservable variable with potential impact on

our inference is equivalent to $1.11B change in total assets, 30% of EBIT/LT debt, 100

times of the Debt to equity, 120% of R&D, 5.1 times of Advertisement, 200% of CAPEX,

70% of Tangibility, 38% change in probability of default, or 89% of Global industry Q

ratio of the average of nonusers’. It indicates that the impact of an unobservable variable

must be relatively large compare to observable variables to change our inference about

value implication of IRPCs. It also shows that EBIT/LT debt is the most sensitive variable

in our test, as expected. In matching with voluntary users of IR derivatives, the impact of

an unobservable variable is equivalent to $1.8B change in total assets, 31% of EBIT/LT

debt, 80% in IR derivative, 11.3 times of the Debt to Equity, 243% of R&D, 10.7 time of

Advertisement, 188% of CAPEX, 30% of Tangibility, 70% change in probability of

default, and 175% of Global Q ratio of the average of voluntary users’. Similar to

matching with nonusers, the result shows that our inference about value implication of

IRPC relative to voluntary use of IR derivatives is unlikely to get impacted by an

unobservable variable, notwithstanding, all numbers are based on a conservative

measurement. EBIT/LT debt, same as previous analysis, and Tangibility are the most

sensitive variables in this test.

6. Does value implication of IRPC come from shareholders’ confidence?

So far, we have found evidence that IRPC increases firm value in contrast to voluntary

use of IR derivatives which do not influence firm value. Our hypothesis states that

shareholders’ confidence in real purpose of mandatory hedging accounts for significant

24

difference between the premium on firm value from mandatory and voluntary use of

derivatives. To reinforce this argument, we test whether investors associate the mandatory

term of using IR derivatives with the cutback in the managerial incentive of using such

derivatives. To do so, we focus on corporate governance and product market competition.

Both factors potentially align the interests of managers and shareholders in corporate

policies, including the use of derivatives. Therefore, we argue that corporate governance

and product market competition have an impact on value implication of voluntary use of

IR derivatives but should not impact mandatory hedging due to the investors’ confidence

in risk management purpose of IRPCs.

6.1 Corporate governance and IR derivatives

Several empirical studies such as Allayannis et al. (2012) document the relation between

corporate governance and the use of derivatives. We compare the shareholders’ rights in

voluntary and mandatory IR derivative users and nonusers and assess the impact of

corporate governance on value implication of voluntary and mandatory use of IR

derivatives, separately. We employ the G-index (see Gompers et al., 2003) as a

measurement for corporate governance quality. This index is built based on 24 internal

and state level governance rules. The lower the value of the G-index means the higher

shareholder rights in the firm. We merge our observations with data used in Gompers et

al. (2003)21

and find 135(402) firm-year of mandatory (voluntary) users of IR derivatives,

and 659 firm-year nonusers in common with their dataset.

We restrict our sample to those with G-index and compare the mean and median of

corporate governance index of mandatory and voluntary users of IR derivatives with

nonusers. The mean of the G-index for mandatory (voluntary) users of IR derivatives is

9.2 (9.7) and 9.5 for nonusers. The median of the index for all subgroups is 9. As a result,

there is no significant difference in the quality of corporate governance measurement in

three subgroups.

To test the value implication of shareholders right in the use of derivatives, we follow

Gompers et al. (2003) and distinguish democratic firms by defining a dummy variable

which is one if the G-Index is equal to or lower than five and zero otherwise. We add this

dummy and its interaction with IR derivatives to the baseline model and conduct our test

on a sample of only voluntary, and only mandatory user of IR derivatives, separately. In

addition, Sarbanes-Oxley Act Of 2002 (SOX) imposed several guide lines and restrictions

in corporate internal controls and off-balance sheet disclosures particularly for derivative

21 We appreciate Andrew Metrick for providing these data in his website

(http://faculty.som.yale.edu/andrewmetrick/data.html)

25

positions. Due to the increase in monitoring pressure on the use of derivatives after SOX

takes effect, we expect a significant improvement in shareholders’ confidence in real

purpose of using derivatives. Allayannis et al. (2012) address the impact of SOX and

show that corporate governance impact on value implication of using derivatives is not

significant after SOX. Therefore, we restrict our test on interaction of democracy dummy

variable and IR derivatives to pre-SOX period. However, as an additional test for the

impact of corporate governance on value implication of IR derivatives, we generate a

dummy variable for SOX which is one if year is greater than 2002 and zero otherwise,

and conduct our test similar to Democracy dummy but for the whole period. We expect a

positive and significant coefficient for interaction terms of Democracy dummy and SOX

dummy with IR derivatives in the sample of voluntary users, but not in the sample of

mandatory users. We conduct a pooled OLS test without industry fixed effect since our

tests are focused on corporate governance on firm level, and are inconsistent with industry

fixed effect. Column (1) and (2) report the result for the impact of shareholders’ rights

and value implication of mandatory and voluntary use of derivatives, respectively. With

the same sequence, Column (3) and (4) show the results of interplay between SOX and

the impact of IR derivatives on firm value.

[Table 8]

Interestingly, the coefficient of interaction between IR derivatives and Democracy dummy

is positive and highly significant for voluntary users while it is not significant for

mandatory users. The coefficient of the interaction term for voluntary users (1.93) is also

much larger than that of mandatory ones (0.31). The result for the impact of SOX is also

consistent to previous finding. The coefficient of SOX dummy and IR derivatives

interaction is positive (0.48) and highly significant for voluntary users. Although this

coefficient is positive (0.20) for mandatory users, it is insignificant and much smaller than

the estimate for voluntary users.

These results indicate that monitoring pressure from shareholders shifts the use of IR

derivatives toward real risk management with positive impact on firm value. However,

this factor does not change the value implication of IRPCs since shareholders regain their

confidence in the motive behind the use of these derivatives through creditor’s

enforcement.

6.2 Product market competition and IR derivatives

In this section, we extend our test on interplay between shareholders’ confidence in the

use of derivatives and their impact on firm value by focusing on competition pressure.

Several theoretical (Hart, 1983; Schmidt, 1997; and Raith, 2003) and empirical (Hoberg et

26

al., 2012; and Frésard and Valta, 2012) studies document how product market

competition influence corporate financial policies and align managers’ and shareholders’

interests in the use of corporate resources. In the same spirit of shareholders rights, we

expect that competition pressure positively influence the value implication of voluntary

use of IR derivatives. However, we conjecture that creditors’ enforcement in the use of IR

derivatives do not leave any room for the influence of product market competition on

IRPCs. To test this argument, we use product market fluidity developed by Hoberg et al.

(2012) as a proxy for market competition. This index is based on a text-search in

corporate filings and address firm-level competitive threats by capturing the changes in

products of the firm relative to those produced by rivals.

We merge our dataset to that of Hoberg et al. (2012)22

and define Product market fluidity

to each firm-year. 478 mandatory and 1129 voluntary users are common between two

datasets. We add Product market fluidity and its interaction with IR Derivatives to our

baseline model and conduct our test on a sample of only voluntary and only mandatory

users, separately. Since Product market fluidity is a measurement for competition pressure

at firm level we test the model without industry fixed effects. Column (1) and (2) of Table

9 show the results for mandatory and voluntary users, respectively.

[Table 9]

As expected, in the sample of mandatory users, the coefficient of interaction term between

IR Derivatives and Product market fluidity is not positive and significant while it is

positive and significant in the sample of voluntary users. Consistent to our previous

findings, this result documents how competition pressure improves investors’ confidence

in the use of derivatives. It also shows that this confidence is so matured in IRPCs that

competition does not influence the interplay between mandatory hedging and firm value.

7. Additional robustness checks

In this section we identify several confounding factors, including other covenants,

creditors’ rights, other hedging, and type of derivatives, with potential impact on our

inference about value implication of IR derivatives and show that our results are robust to

them.

7.1 The Impact of other covenants and creditors’ control rights

It is possible that IRPCs are bonded to other types of covenants whose impact on firm

value is not controlled in our model. There is also a possibility of a tradeoff between

22 We appreciate Gerard Hoberg and Gordon Philips for providing this dataset in their website

(http://www.rhsmith.umd.edu/industrydata/industryconcen.htm).

27

relaxing such covenants and accepting IRPCs that misleads our inference about the results

of our empirical tests. To check the robustness of our results to other covenants in the

syndicated loan agreements, we use the classification of covenants in Nini et al. (2009)

sample23

. We control the impact of these terms by adding a dummy variable to our

baseline model for each covenant which is equal to one if the firm-year is subject to the

covenant and zero otherwise. To investigate the interplay between these covenants and

IRPCs, the interaction between IRPC and each covenant dummy is also added.

We conduct our test on the sample of mandatory IR derivative users and nonusers. The

results are in column (1) and (2) of Table 10 for tests with and without industry fixed-

effect, respectively. To save space, we report only the coefficient of covenants whose

interaction with IRPC term is statistically significant.

[Table 10]

First, the estimates show that after controlling for the presence of other covenants and

their interaction with IRPC, mandatory use of IR derivatives still has positive and

significant impact on firm value and the magnitude of the impact (IR derivatives’

coefficient) is not dramatically changed either (from 0.4 to 0.5). It means that the positive

impact from IRPC is independent from the other covenants. Second, the interaction term

of five types of covenants including current ratio, debt to net worth, senior debt to cash

flow, quick ratio, and other balance sheet covenants have statistically significant

coefficient. These coefficients deliver a clear insight about the real purpose of IRPC and

its impact on firm value.

We focus on covenants which have significant impact on firm value along with

interaction term with IRPC. The coefficient of interaction between IRPC and quick ratio

covenant is negative while the impact from covenant itself is positive, stating that

liquidity-control covenants reduce the positive impact of IRPC on firm value. In fact,

hedging secures the cash flows in unfavorable states of the economy and stabilizes

liquidity. It also diminishes the probability of generating excess cash vulnerable to be

used for private benefit of managers. Since quick ratio covenant addresses the same risks

in credit agreements, it reduces the positive impact of IRPC on firm value, demonstrated

by the negative sign of its interaction with IRPC.

23 Covenants in this classification are as follows:

CAPEX restriction, Current ratio, Debt service coverage ratio, Debt to capitalization, Debt to cash flow, Debt to net

worth, Fixed charge coverage ratio, Interest coverage ratio, Net worth, Other balance sheet, Other coverage, Other

liquidity, Quick ratio, Senior debt to cash flow, Stockholder's equity, Tangible net worth, Working capital, Debt to

balance sheet, and Cash flow/earnings based covenants.

28

The coefficient of interaction term between IRPC and senior debt to cash flow covenant

complements this argument. Senior debt to cash flow covenant has a negative and

significant coefficient in our estimates, while its interaction with IRPC is positive and

statistically significant. It means that the stable cash flows resulted from interest rate risk

management significantly reduces the probability of technical default in this covenant and

the positive interaction of IRPC with senior debt to cash flow covenant compensates the

negative impact of this covenant on firm value. The analysis of interaction terms between

IRPC and covenants not only provides solid evidence about the independent value

implication of IRPCs from other covenants but also demonstrates that IRPCs are

complied with risk management purpose of using interest rate derivatives.

In the context of creditors’ control rights out of states of bankruptcy, Nini et al. (2012)

explain that when firms violate a covenant of a credit agreement, creditors actively get

involved in corporate management and influence corporate governance quality. They also

show that this influence has a positive impact on firm value. Therefore, it is possible that

imposing IRPC is a result of a technical default and the positive impact from IRPC on

firm value is biased from other factors of creditors’ involvement in management.

However, our analysis of firms with IRPC and violation of covenant states that our results

are not influenced by technical defaults. Nini et al. (2009) identify credit agreements in

which the borrower has a violation of a covenant in the year before the date of the

contract. We match these credit agreements with contracts with IRPC and find only

twelve firms in our sample which have an IRPC in their credit agreements and a record of

technical default in the year before. We remove these firms from our sample and test the

baseline model. The unreported results24

are qualitatively similar to what we find for the

whole sample. Therefore, the technical default does not influence the impact of IRPC on

firm value in our test.

7.2 Impact of other derivatives and type of IR derivatives

In our sample, 826 firm-year use FX and commodity derivatives. To make sure that our

results are not affected by the use of such derivatives, we exclude these observations from

our sample and conduct our test for the impact from mandatory and voluntary use of IR

derivatives in the baseline model. The unreported results show positive and significant

impact from mandatory use of IR derivatives and no significant impact from voluntary

positions, consistent with tests on the whole sample. Moreover, the propensity score

matching conducted by Bartram et al. (2011) indicates the potential impact on firm value

24 All unreported results are available upon request.

29

from all kinds of derivatives. Therefore, we excluded all firms which use derivatives

rather than interest rate financial instruments and conduct our propensity matching tests.

The unreported results are qualitatively similar to what we find on whole sample.

The type of IR derivatives is also another concern in this study. Almost 10% of voluntary

hedgers in our sample have a combination of fixed to float and float to fixed contracts.

Therefore, we analyze the potential biases of our results from type of contracts as well. As

explained in the construction of our sample, we assume the net position of interest rate

derivatives, if the firm-year holds both types of contract in its IR derivatives portfolio.

Since all IRPCs are variable to fixed interest rate derivatives, the difference in the impact

on firm value between voluntary and mandatory use of IR derivatives might be from type

of hedging agreements. Since float to fixed contracts are more complied with risk

management theories than reverse ones, shareholders’ might overweight the impact of

float to fixed derivatives, resulting in larger impact from IRPC on firm value. To clarify

this issue in our tests, we split fixed to float and float to fixed contracts in voluntary

hedging and conduct our initial test on a sample of voluntary IR derivative users and

nonusers. The unreported result of this test shows that neither fixed to float nor float to

fixed voluntary contracts demonstrate any significant impact on firm value, rejecting the

potential biases from type of IR derivatives in our inference of empirical results.

Last, instead of netting the fixed to float and float to fixed contracts, we add the notional

amount of contracts to test the robustness of our results to the calculation of combined

positions. The unreported results show no significant changes in the impact of voluntary

positions on firm value.

7. Conclusion

In the studying of welfare implication of using derivatives, empirical research so far aims

to use instruments such as corporate governance to distinguish positions used for risk

management from those used for speculation or managers’ self-benefit which are not

complied with risk management theories. For the same purpose, we go beyond the

shareholders’ and managers’ decision for hedging and focus on the use of derivatives

mandated by creditors. These financial instruments have a distinct position from

derivatives implemented by managers who might have incentives rather than corporate

risk management in the use of derivatives. Shareholders address to mandatory term of

using derivatives and identify them as real risk management practices. Therefore, they

reward these instruments by a premium on firm value as predicted by risk management

theories.

30

We choose Interest Rate Protection Covenant in private credit agreements as one of the

most common mandatory hedging instruments and find a positive and significant impact

from these derivatives on firm value. The impact of voluntary interest rate hedging on

firm value is studied in parallel to mandatory ones and no significant impact on firm value

from these derivatives is found in our research. By analyzing the impact of corporate

governance and product market competition on value implication of voluntary and

mandatory use of IR derivatives, we show that the difference between the impacts of these

two groups of IR derivative users largely comes from shareholders’ confidence in risk

management purpose of IRPCs.

In sum, this study provides a new insight into the value implication of risk management

and highlights the critical role of shareholders’ perception about derivative positions in

value generation of financial instruments. It also complements the empirical studies in

reduction of cost of debt by mandatory use of IR derivatives and documents the ultimate

positive impact of these derivatives on firm value. The result of this research is also a true

example of cases in which shareholders value the indirect influence of creditors on

financial decisions despite the existence of conflict of interest between creditors and

shareholders.

REFERENCES

Adam, T.R., Fernando, C.S., 2006. Hedging, speculation, and shareholder value. Journal

of Financial Economics 81, 283-309.

Allayannis, G., Lel, U., Miller, D.P., 2012. The use of foreign currency derivatives,

corporate governance, and firm value around the world. Journal of International

Economics 87, 65-79.

Allayannis, G., Weston, J.P., 2001. The use of foreign currency derivatives and firm

market value. Review of Financial Studies 14, 243-276.

Altman, E.I., 1968. Financial ratios, discriminant analysis and the prediction of corporate

bankruptcy. Journal of Finance 23, 589-609.

Aretz, K., Bartram, S.M., 2010. Corporate hedging and shareholder value. Journal of

Financial Research 33, 317-371.

Bartram, S.M., Brown, G.W., Conrad, J., 2011. The effects of derivatives on firm risk and

value. Journal of Financial and Quantitative Analysis 46, 967-999.

Beatty, A., Petacchi, R., Zhang, H., 2011. Hedge commitments and agency costs of debt:

evidence from interest rate protection covenants and accounting conservatism.

Review of Accounting Studies 17, 1-39.

Bessembinder, H., 1991. Forward contracts and firm value: Investment incentive and

contracting effects. Journal of Financial and Quantitative Analysis 26, 519-532.

Bhojraj, S., Lee C., 2002. Who is our peer? A valuation-based approach to the selection of

comparable firms. Journal of Accounting Research 40, 407-439.

Bodnar, G.M., Graham, J., Harvey, C.R., Marston, R.C., 2011. Managing Risk

Management. Working paper. Johns Hopkins University, MD.

Borokhovich, K.A., Brunarski, K.R., Crutchley, C.E., Simkins, B.J., 2004. Board

31

composition and corporate use of interest rate derivatives. Journal of Financial

Research 27, 199-216.

Campbell, T.S., Kracaw, W.A., 1990. Corporate risk management and the incentive

effects of debt. Journal of Finance 45, 1673-1686.

Campello, M., Lin, C., Ma, Y., Zou, H., 2011. The real and financial implications of

corporate hedging. Journal of Finance 66, 1615-1647.

Carter, D.A., Rogers, D.A., Simkins, B.J., 2006. Does hedging affect firm value?

Evidence from the US airline industry. Financial Management 35, 53-86.

Chhaochharia, V., Grullon, G., Grinstein, Y., Michaely, R., 2012. Product market

competition and agency conflicts: Evidence from the Sarbanes Oxley Law.

Working Paper, University of Miami.

Crosbie, P.J, Bohn, J.R., 2003. Modeling Default Risk. KMV LLC, San Francisco, CA.

DiPrete, T.A., Gangl, M., 2004. Assessing Bias in the Estimation of Causal Effects:

Rosenbaum Bounds on Matching Estimators and Instrumental Variables

Estimation with Imperfect Instruments. Sociological Methodology 34, 271–310.

Eng, L.L., Mak, Y.T., 2003. Corporate governance and voluntary disclosure. Journal of

Accounting and Public Policy 22, 325-345.

Faulkender, M., 2005. Hedging or market timing? Selecting the interest rate exposure of

corporate debt. Journal of Finance 60, 931-962.

Fauver, L., Naranjo, A., 2010. Derivative usage and firm value: The influence of agency

costs and monitoring problems. Journal of Corporate Finance 16, 719-735.

Frésard, L., Valta, P., 2012. Competitive pressure and corporate policies. working paper,

University of Maryland.

Froot, K.A., Scharfstein, D.S., Stein, J.C., 1993. Risk management: coordinating

corporate investment and financing policies. Journal of Finance 48, 1629-1658.

Géczy, C., Minton, B.A., Schrand, C., 1997. Why firms use currency derivatives. Journal

of Finance 52, 1323-1354.

Géczy, C.C., Minton, B.A., Schrand, C.M., 2007. Taking a view: corporate speculation,

governance, and compensation. Journal of Finance 62, 2405-2443.

Gompers, P., Ishii, J., Metrick, A., 2003. Corporate Governance and Equity Prices.

Quarterly Journal of Economics 118, 107-155.

Graham, J.R., Rogers, D.A., 2002. Do firms hedge in response to tax incentives? Journal

of Finance 57, 815-839.

Graham, J.R., Li, S., Qiu, J., 2008. Corporate misreporting and bank loan contracting.

Journal of Financial Economics 89, 44–61.

Hart, O., 1983. The Market as an Incentive Mechanism. Bell Journal of Economics 14,

366–382.

Hoberg, G., Philips, G., Prabhala, N., 2012. Product market threats, payouts, and financial

flexibility. Journal of Finance, forthcoming.

Jin, Y., Jorion, P., 2006. Firm value and hedging: Evidence from US oil and gas

producers. Journal of Finance 61, 893-919.

La Porta, R., Lopez-de-Silanes, F., Shleifer, A., Vishny, R.W., 2002. Investor protection

and corporate valuation. Journal of Finance 57, 1147–1170.

Leuven, E., Sianesi, B., 2003. Psmatch2: Stata module to perform full Mahalanobis and

propensity score matching, common support graphing, and covariate imbalance

testing. http://ideas.repec.org/c/boc/bocode/s432001.html., version 4.0.6.

Lel, U., 2011. Currency hedging and corporate governance: a cross-country analysis.

Journal of Corporate Finance 18, 221-237.

Leland, H.E., 1998. Agency costs, risk management, and capital structure. Journal of

Finance 53, 1213-1243.

32

Lookman, A.A., 2009. Does Hedging Increase Firm Value? Comparing Premia for

Hedging “Big” Versus “Small” Risks. Working paper, University of Pittsburgh,

DC.

Lookman, A.A., 2009. Bank borrowing and corporate risk management. Journal of

Financial Intermediation 18, 632-649.

MacKay, P., Moeller, S.B., 2007. The value of corporate risk management. Journal of

Finance 62, 1379-1419.

Nain, A., 2004. The strategic motives for corporate risk management. Unpublished

working paper. University of Michigan.

Nance, D.R., Smith Jr, C.W., Smithson, C.W., 1993. On the determinants of corporate

hedging. Journal of Finance 48, 267-284.

Nini, G., Smith, D.C., Sufi, A., 2009. Creditor control rights and firm investment policy.

Journal of Financial Economics 92, 400-420.

Nini, G., Smith, D.C., Sufi, A., 2012. Creditor control rights, corporate governance, and

firm value. Review of Financial Studies 25, 1713-1761.

Raith, M., 2003. Competition, Risk, and managerial incentives. American Economic

Review 93, 1425-1436.

Rosenbaum, P.R., 2002. Observational Studies, 2nd edition. New York, Springer-Verlag.

Rosenbaum, P.R., Rubin, D., 1985. Constructing a control group using multivariate

matched sampling methods that incorporate the propensity score. American

Statistician 39, 33–38.

Schmidt, K., 1997, Managerial incentives and product market competition. Review of

Economic Studies 64, 191-203.

Smith, C.W., Stulz, R.M., 1985. The determinants of firms’ hedging policies. Journal of

Financial and Quantitative Analysis 20, 391-405.

Smithson, C., Simkins, B.J., 2005. Does risk management add value? A survey of the

evidence. Journal of Applied Corporate Finance 17, 8-17.

Stulz, R.M., 1984. Optimal hedging policies. Journal of Financial and Quantitative

Analysis 19, 127-140.

Tufano, P., 1996. Who manages risk? An empirical examination of risk management

practices in the gold mining industry. Journal of Finance 51, 1097-1137.

Vickery, J., 2008. How and why do small firms manage interest rate risk. Journal of

Financial Economics 87, 446-470.

33

Appendix: Variable Definitions

Variable name Description COMPUSTAT Item

Advertisement Advertising expense divided by total assets. 0 for

missing variables.

data45 / data6

Asset volatility σa in calculation of distance to default.

Assets Book value of total assets. data6

CAPEX Capital expenditures divided by total assets. data128/data6

Credit rating dummies Dummy variable for each S&P credit ratings,

including AAA, AA, A, BBB, BB, and B or

worse. We have also a separate dummy for firms

without rating.

Credit spread The difference between the yields of average

BAA and AAA corporate bonds.

Debt to Equity Long term debt to market value of equities. data9/( data199 × data25)

Democracy dummy Equal one if G-index <=5, zero otherwise

(Gompers et al. , 2003).

Distance to Default Distance-to-default (Crosbie and Bohn, 2003)

based on KMV-Merton model = (Va-D)/Vaσa

where Va is the value of the assets, D is half of

long term debt plus debt in current liabilities.

σa is the volatility of the assets. Since Va and σa

are not observable, we approximate them by

solving Merton’s (1974) model of pricing firm’s

debt and value of the equity for 1-year period:

Ve = VaN(d1)-e-rDN(d2) and σe = N(d1)Vaσa/Ve.

d1 = (ln(Va/D)+r+0.5σa2) σa and d2 = d1- σa .

Dividend Dummy Equal one if common dividends is paid. Equal 1 if data21 > 0

Dperformance Equal one if the credit agreement uses

performance pricing.

EBIT Earnings Before Interest and Taxes. data172 + data15 + data16

EBIT/LT debt EBIT dived by long term debt, zero if EBIT < 0. (data172 + data15 + data16)/data

Geographical dummy Equal one if foreign tax is paid, zero otherwise. Equal 1 if data64>0

Global industry Q Sum of market value of all firms with the same

2-digit SIC code in COMPUSTAT universe plus

the sum of the assets minus the sum of book

value of the equities divided by the

sum of the assets of those firms for each year.

IR Derivatives Net notional value of interest rate derivatives

divided by total assets.

IRPC dummy Equal one if IR derivative is enforced by

creditors, zero otherwise.

Leverage Long term debt divided by total assets. Data9/data6

Loan purpose Dummy variable for each loan purpose, including

corporate purpose, working capital, debt

repayment, acquisition, commercial paper

backup, and others.

Loan size (log) natural log of loan amount is millions of dollars.

Market to book (Market value of equity at fiscal year-end) /Total

assets.

(data199 × data25)/data6

Maturity(log) Natural log of loan maturity in month.

Product market

fluidity

Product market fluidity developed by

Hoberg et al. (2012).

Q ratio (Market value of equity at fiscal year-end +

total assets – book value of equity)/Total assets.

(data199 × data25 + data6 – data60)/data6

R&D Research and development expenses divided by

total assets. zero for missing variables.

data46/data6

34

Appendix - continued

Variable name Description COMPUSTAT Item

ROA Return On Assets – net income divided by

total assets.

data172/data6

Sales Growth Two-year sales change divided by total assets. (data12(t)-data12(t-2))/data6

SOX Dummy Equal one if year>2002, zero otherwise.

Spreadcontract All-in spread charged by the bank over LIBOR

reported in DealScan database.

Tangibility Net Properties, Plant and Equipment divided

by total assets.

data8 / data6

Term spread The difference between the yields of 10-year and 1-

year Treasury bonds.

Z-Score Modified Altman (1968) Z-score = (1.2 × working

capital + 1.4 × retained earnings+3.3 × EBIT +

0.999 × sales)/Total assets.

(1.2 × data179 + 1.4 × data36 + 3.3 ×

data170 + 0.999 × data12)/data6

35

Table 1: Description of Sample by Year and Industry Distribution

Panel A (B) provides the number of firm-years for mandatory IR derivative users, voluntary IR derivative users, and

nonusers for each year (industry) in the sample. Industry classification is based on 2-digit SIC code.

Panel A

Year Mandatory Voluntary Nonuser

1998 37 125 251

1999 51 127 247

2000 75 146 261

2001 74 146 267

2002 74 149 298

2003 61 151 317

2004 57 156 306

2005 52 140 313

Total 481 1,140 2,260

Panel B

Industry Mandatory

Users

Voluntary

Users Nonusers

Agricultural Production Crops 0 0 2

Amusement And Recreation Services 16 58 68

Apparel And Accessory Stores 0 4 22

Apparel And Other Finished Products 3 29 34

Automotive Dealers And Gasoline Service Stations 3 14 7

Automotive Repair, Services, And Parking 8 8 0

Building Construction General Contractors 0 5 35

Building Materials, Hardware, Garden Supply and Mobile home Dealers 0 1 5

Business Services 43 36 212

Chemicals And Allied Products 18 69 137

Coal Mining 6 5 6

Communications 105 77 90

Construction Special Trade Contractors 2 10 16

Eating And Drinking Places 9 21 55

Educational Services 7 0 11

Electronic And Other Electrical Equipment 16 68 175

Engineering, Accounting, Research, Management, and Related services 14 9 50

Fabricated Metal Products, Except Machinery 0 31 49

Food And Kindred Products 19 31 31

Food Stores 0 6 9

Furniture And Fixtures 4 8 22

General Merchandise Stores 0 19 14

Health Services 17 39 82

Heavy Construction Other Than Building 0 2 21

Home Furniture, Furnishings, And Equipment 3 3 8

Hotels, Rooming Houses, Camps, And Other Lodging places 11 6 11

Industrial And Commercial Machinery And Computer equipment 9 69 133

Leather And Leather Products 0 2 11

Local And Suburban Transit And Interurban Transportation 0 1 7

Lumber And Wood Products, Except Furniture 0 13 22

Measuring, Analyzing, And Controlling Instruments 36 60 118

Metal Mining 0 6 7

Mining And Quarrying Of Non-metallic Minerals, except fuels 0 3 5

Miscellaneous Manufacturing Industries 0 11 44

Miscellaneous Repair Services 0 4 1

Miscellaneous Retail 11 26 46

Motion Pictures 7 7 23

Motor Freight Transportation And Warehousing 10 14 36

Oil And Gas Extraction 13 54 155

Paper And Allied Products 9 26 57

Personal Services 12 18 12

Petroleum Refining And Related Industries 3 0 12

Pipelines, Except Natural Gas 1 20 7

Primary Metal Industries 9 33 43

36

Table 1 – Panel B - Continued

Industry Mandatory

Users Voluntary

Users Nonusers

Printing, Publishing, And Allied Industries 11 12 46

Railroad Transportation 8 9 6

Real Estate 0 1 0

Rubber And Miscellaneous Plastics Products 9 19 37

Stone, Clay, Glass, And Concrete Products 0 5 6

Textile Mill Products 1 26 35

Transportation By Air 2 5 12

Transportation Equipment 6 37 71

Transportation Services 0 9 9

Water Transportation 0 17 10

Wholesale Trade-durable Goods 6 32 70

Wholesale Trade-non-durable Goods 14 42 47

Total 481 1140 2260

37

Table 2: Descriptive Statistic of Sample

Panel A describes the sample of IR derivative nonusers with 2260 firm-year observations. Panel B (C) describes the

sample of voluntary (mandatory) IR derivative users with 1140 (481) firm-year observations. IR derivatives intensity is

the net notional amount of IR derivatives divided by total assets. Total assets represent the book value (BV) of assets. Q

ratio is defined as (market value at fiscal year-end + BV of assets –BV of Equities)/BV of total assets. Debt to Equity is

Long-term debt to market value. CAPEX is capital expenditures. Advertisement and R&D are advertisement and

research and development expenses, respectively. Tangibility is net properties, plant and equipment divided by total

assets. Distance to Default is KMV-Merton measure explained in Appendix.

Mean SD

10th Percentile

Median 90th

Percentile

Panel A: Firms' Characteristics - IR derivative Nonusers (2260 firm-years)

Total assets ($m) 1696.988 6602.377 76.717 518.022 3339.130

Q ratio 1.612 0.982 0.852 1.321 2.754

Leverage (Debt to Equity) 1.206 4.827 0.020 0.361 2.473

Tangibility 0.311 0.245 0.057 0.240 0.705

CAPEX/Assets 0.060 0.067 0.011 0.038 0.138

Advertisement/Assets 0.012 0.038 0.000 0.000 0.037

R&D/Assets 0.016 0.036 0.000 0.000 0.050

Distance to Default (KMV-Merton Model) 0.271 0.567 -0.024 0.194 0.876

Panel B: Firms' Characteristics - Voluntary IR derivative users (1140 firm-years)

IR derivatives intensity 0.116 0.171 0.016 0.080 0.240

Total assets ($m) 3950.329 10238.300 170.995 1136.187 8480.557

Q ratio 1.473 0.813 0.882 1.267 2.245

Leverage (Debt to Equity) 1.355 3.249 0.093 0.545 2.966

Tangibility 0.355 0.237 0.088 0.299 0.736

CAPEX/Assets 0.059 0.059 0.013 0.043 0.125

Advertisement/Assets 0.012 0.040 0.000 0.000 0.034

R&D/Assets 0.012 0.030 0.000 0.000 0.038

Distance to Default 0.298 0.593 -0.049 0.231 0.865

Panel C: Firms' Characteristics - Mandatory IR derivative users (481 firm-years)

IR derivatives intensity (IRPC) 0.183 0.173 0.036 0.139 0.362

Total assets ($m) 1589.728 2728.558 95.541 643.401 3892.099

Q ratio 1.586 1.180 0.851 1.268 2.347

Leverage (Debt to Equity) 2.005 5.482 0.135 0.750 3.636

Tangibility 0.300 0.223 0.063 0.264 0.666

CAPEX/Assets 0.056 0.055 0.011 0.039 0.122

Advertisement/Assets 0.009 0.027 0.000 0.000 0.029

R&D/Assets 0.009 0.026 0.000 0.000 0.025

Distance to Default 0.188 0.423 -0.098 0.153 0.788

38

Table 3: Comparison of Mandatory and Voluntary IR Derivative Users, and

Nonusers

This table compares mean and median of IR derivatives, Q ratio (log) and firm characteristic of mandatory IR derivative

users, voluntary IR derivative users, and nonusers. IR Derivatives intensity is the net notional amount of IR derivatives

divided by total assets. Total assets represent the book value (BV) of assets. Q ratio is defined as (market value at fiscal

year-end + BV of assets –BV of Equities)/BV total assets. Debt to Equity is long term debt to market value. Return on

Assets is net income divided by total assets. CAPEX is capital expenditures. Advertisement and R&D are advertisement

and research and development expenses, respectively. Tangibility is net properties, plant and equipment divided by total

assets. Sales growth is changes of sales from two years before divided by total assets. Distance to Default is KMV-

Merton measure explained in Appendix. *, ** and *** represents 10%, 5% and 1% significant level of the t-test and

Wilcoxon rank-sum Z-test for the mean and median comparisons, respectively.

Panel A: Comparison of the mean of parameters between mandatory IR hedgers, voluntary IR Hedgers, and Nonhedgers

Mandatory

Hedgers (1)

Voluntary

Hedgers (2)

Nonhedgers (3)

Diff.: (1)-(2) Diff.: (1)-(3) Diff.: (2)-(3)

Observations 481 1140 2260

IR derivatives intensity 0.183 0.116 n.a. 0.067*** n.a. n.a.

Log of Q ratio 0.325 0.294 0.353 0.031 -0.028 -0.058***

Log of total assets 6.432 7.050 6.246 -0.618*** 0.185*** 0.805***

Debt to Equity 2.005 1.354 1.206 0.651*** 0.800*** 0.149

Return on assets 0.002 0.025 0.010 -0.023*** -0.008 0.015***

Tangibility 0.300 0.355 0.311 -0.056*** -0.011 0.045***

CAPEX/Assets 0.056 0.059 0.059 -0.003 -0.003 0.000

Advertisement/Assets 0.009 0.012 0.012 -0.003 -0.003 -0.000

R&D/Assets 0.009 0.012 0.016 -0.003** -0.007*** -0.004***

Distance to Default 0.188 0.298 0.271 -0.110*** -0.083*** 0.028

Panel B: Comparison of the median of the parameters between mandatory IR hedgers, voluntary IR Hedgers, and Nonhedgers

IR derivatives intensity 0.139 0.080 n.a. 0.059*** n.a. n.a.

Log of Q ratio 0.237 0.237 0.278 -0.000 -0.041 -0.041***

Log of total assets 6.467 7.035 6.250 -0.568*** 0.217*** 0.785***

Debt to Equity 0.750 0.545 0.361 0.205*** 0.389*** 0.184***

Return on assets 0.022 0.034 0.033 -0.012*** -0.011*** 0.001

Tangibility 0.264 0.299 0.240 -0.035*** 0.024 0.059***

CAPEX/Assets 0.039 0.043 0.038 -0.004* 0.001 0.005***

Distance to Default 0.153 0.231 0.194 -0.078*** -0.041*** 0.037*

39

Table 4: Mandatory and Voluntary Use of IR Derivatives and Firm Value

The dependent variable is the log of Q ratio defined as (market value at fiscal year-end + BV of assets – BV of

Equities)/BV of total assets. Column (1) and (2) exhibit the results of the impact of IR derivatives on firm value in a

sample of mandatory IR derivative users and nonusers. Column (3) and (4) exhibit the results of the impact of voluntary

use of IR derivatives on firm value in a sample of voluntary IR derivative users and nonusers. In column (1) and (3)

results are obtained from industry fixed-effect (equations (1)). Column (2) and (4) report the estimates via pooled OLS

without industry fixed-effect. IR Derivatives is the net notional amount of IR derivatives divided by total assets. Total

assets represent the book value (BV) of assets. Debt to Equity is long term debt to market value. Return on Assets is net

income divided by total assets. CAPEX is capital expenditures. Advertisement and R&D are advertisement and research

and development expenses, respectively. Tangibility is net properties, plant and equipment divided by total assets. Sales

growth is changes of sales from two years before divided by total assets. Dividend dummy is 1 if firm-year pays

dividend and 0 otherwise. Geographical dummy is 1 if firm-year has operation abroad and 0 otherwise. Global industry

Q is the Q ratio of a hypothetical firm whose asset and equity is the aggregate amount of all firms’ assets and equities

with the same 2-Digit SIC code of firm-year in COMPUSTAT universe. Distance to Default is KMV-Merton measure

explained in Appendix. Standard errors robust to heteroskedasticity and serial correlation (clustered at industry level in

models (1) and (3), and at firm level in models (2) and (4)) are reported in parenthesis. *, ** and *** represent 10%,

5% and 1% significant level, respectively.

Mandatory and Nonusers

Voluntary and Nonusers

(1)

(2)

(3)

(4)

IR Derivatives 0.408*** 0.405***

0.031 -0.005

(0.085) (0.113)

(0.061) (0.064)

Log of assets 0.022** 0.030***

0.003 0.012

(0.009) (0.010)

(0.009) (0.010)

ROA 0.570*** 0.531***

0.839*** 0.798***

(0.188) (0.153)

(0.148) (0.134)

Tangibility -0.154** -0.244***

-0.148* -0.198***

(0.076) (0.068)

(0.087) (0.065)

CAPEX 1.470*** 1.738***

1.223*** 1.473***

(0.384) (0.242)

(0.355) (0.223)

R&D 3.383*** 3.495***

3.255*** 3.383***

(0.296) (0.451)

(0.394) (0.413)

Advertisement 0.726** 0.399

0.518* 0.317

(0.348) (0.475)

(0.272) (0.380)

Debt to Equity 0.001 0.001

0.000 -0.001

(0.005) (0.005)

(0.005) (0.004)

Dividend dummy 0.056** 0.038

0.051** 0.025

(0.023) (0.031)

(0.024) (0.027)

Geographical Dummy -0.023 -0.046*

0.000 -0.019

(0.026) (0.027)

(0.021) (0.025)

Distance to Default 0.098* 0.110*

0.070** 0.077**

(0.052) (0.060)

(0.029) (0.031)

Sales Growth 0.013 0.009

0.014 0.011

(0.020) (0.016)

(0.018) (0.014)

Global industry Q 0.210***

0.202***

(0.043)

(0.039)

Industry fixed-effect Yes

No

Yes

No

Time effect (Years) Yes

Yes

Yes

Yes

Observations 2741

2741

3400

3400

Adjusted R2 0.195

0.219

0.203

0.225

40

Table 5: IRPCs and Value Implication of IR Derivatives

The dependent variable is log of Q ratio defined as (market value at fiscal year-end + BV of assets – BV of

Equities)/BV of total assets. In column (1) results are obtained from industry fixed-effect model (equation (2)) on a

sample of voluntary and mandatory IR derivative users. Column (2) reports the estimates for the same sample via

pooled OLS without industry fixed-effect. IR Derivatives are the net notional amount of IR derivatives divided by total

assets. IRPC dummy is 1 if the IR derivative is mandated by creditors and 0 otherwise. Total assets represent the book

value (BV) of assets. Debt to Equity is long-term debt to market value. Return on Assets is net income divided by total

assets. CAPEX is capital expenditures. Advertisement and R&D are advertisement and research and development

expenses, respectively. Tangibility is net properties, plant and equipment divided by total assets. Sales growth is

changes of sales from two years before divided by total assets. Dividend dummy is 1 if firm-year pays dividend and 0

otherwise. Geographical dummy is 1 if firm-year has operation abroad and 0 otherwise. Global industry Q is the Q ratio

of a hypothetical firm whose asset and equity is the aggregate amount of all firms’ assets and equities with the same 2-

Digit SIC code of firm-year in COMPUSTAT universe. Distance to Default is KMV-Merton measure explained in

Appendix. Standard errors robust to heteroskedasticity and serial correlation (clustered at industry level in models (1),

and at firm level in models (2)) are reported in parenthesis. *, ** and *** represent 10%, 5% and 1% significant level,

respectively.

(1) (2)

IR Derivatives 0.111 0.117

(0.078) (0.078)

IRPC dummy -0.050 -0.026

(0.041) (0.042)

IRPC dummy × IR Derivatives 0.500*** 0.524***

(0.130) (0.134)

Log of assets 0.002 0.017

(0.010) (0.012)

Return on Assets 0.457 0.469

(0.345) (0.347)

Tangibility -0.091 -0.165**

(0.145) (0.075)

CAPEX 1.444*** 1.558***

(0.489) (0.290)

R&D 3.424*** 3.699***

(1.143) (0.975)

Advertisement 0.865** 0.401

(0.350) (0.349)

Debt to Equity -0.008 -0.009*

(0.006) (0.005)

Dividend dummy 0.013 -0.008

(0.031) (0.031)

Geographical dummy -0.020 -0.035

(0.026) (0.032)

Distance to Default 0.078* 0.082

(0.047) (0.050)

Sales Growth 0.045* 0.044*

(0.022) (0.024)

Global industry Q 0.200***

(0.049)

Industry fixed-effect Yes No

Time effect Yes Yes

Observations 1621 1621

Adjusted R2 0.213 0.242

41

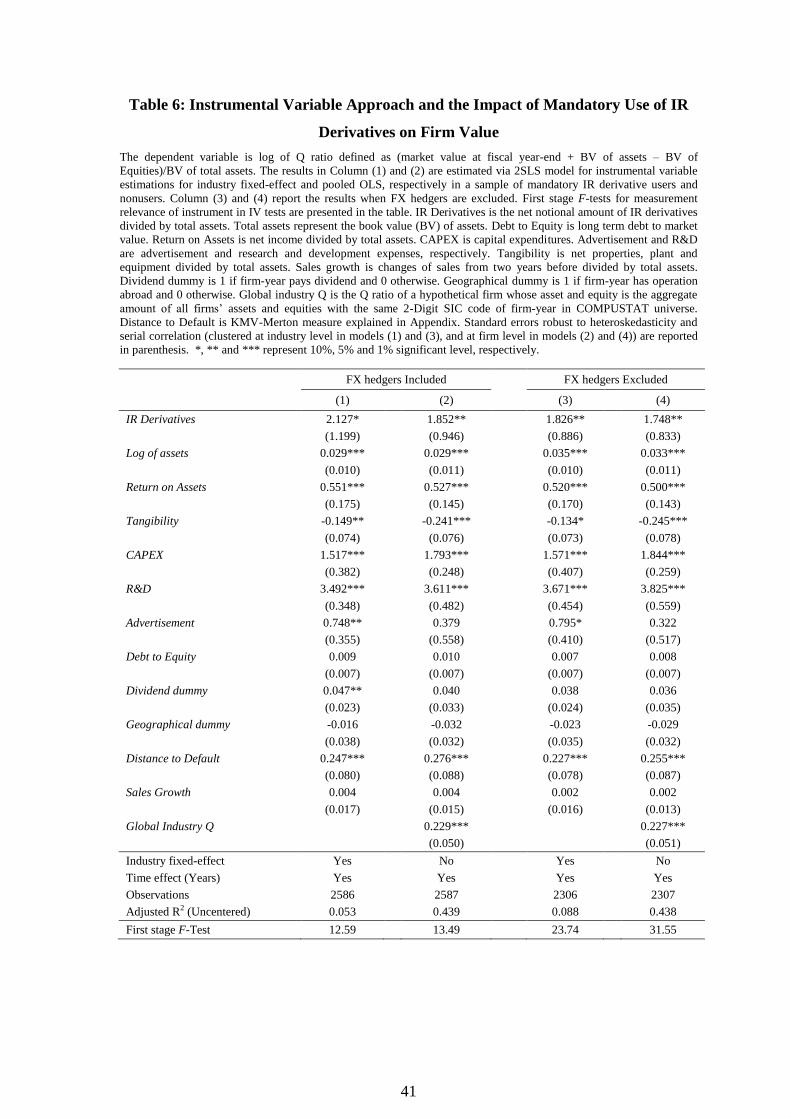
Table 6: Instrumental Variable Approach and the Impact of Mandatory Use of IR

Derivatives on Firm Value

The dependent variable is log of Q ratio defined as (market value at fiscal year-end + BV of assets – BV of

Equities)/BV of total assets. The results in Column (1) and (2) are estimated via 2SLS model for instrumental variable

estimations for industry fixed-effect and pooled OLS, respectively in a sample of mandatory IR derivative users and

nonusers. Column (3) and (4) report the results when FX hedgers are excluded. First stage F-tests for measurement

relevance of instrument in IV tests are presented in the table. IR Derivatives is the net notional amount of IR derivatives

divided by total assets. Total assets represent the book value (BV) of assets. Debt to Equity is long term debt to market

value. Return on Assets is net income divided by total assets. CAPEX is capital expenditures. Advertisement and R&D

are advertisement and research and development expenses, respectively. Tangibility is net properties, plant and

equipment divided by total assets. Sales growth is changes of sales from two years before divided by total assets.

Dividend dummy is 1 if firm-year pays dividend and 0 otherwise. Geographical dummy is 1 if firm-year has operation

abroad and 0 otherwise. Global industry Q is the Q ratio of a hypothetical firm whose asset and equity is the aggregate

amount of all firms’ assets and equities with the same 2-Digit SIC code of firm-year in COMPUSTAT universe.

Distance to Default is KMV-Merton measure explained in Appendix. Standard errors robust to heteroskedasticity and

serial correlation (clustered at industry level in models (1) and (3), and at firm level in models (2) and (4)) are reported

in parenthesis. *, ** and *** represent 10%, 5% and 1% significant level, respectively.

FX hedgers Included

FX hedgers Excluded

(1)

(2)

(3)

(4)

IR Derivatives 2.127* 1.852** 1.826** 1.748**

(1.199) (0.946) (0.886) (0.833)

Log of assets 0.029*** 0.029*** 0.035*** 0.033***

(0.010) (0.011) (0.010) (0.011)

Return on Assets 0.551*** 0.527*** 0.520*** 0.500***

(0.175) (0.145) (0.170) (0.143)

Tangibility -0.149** -0.241*** -0.134* -0.245***

(0.074) (0.076) (0.073) (0.078)

CAPEX 1.517*** 1.793*** 1.571*** 1.844***

(0.382) (0.248) (0.407) (0.259)

R&D 3.492*** 3.611*** 3.671*** 3.825***

(0.348) (0.482) (0.454) (0.559)

Advertisement 0.748** 0.379 0.795* 0.322

(0.355) (0.558) (0.410) (0.517)

Debt to Equity 0.009 0.010 0.007 0.008

(0.007) (0.007) (0.007) (0.007)

Dividend dummy 0.047** 0.040 0.038 0.036

(0.023) (0.033) (0.024) (0.035)

Geographical dummy -0.016 -0.032 -0.023 -0.029

(0.038) (0.032) (0.035) (0.032)

Distance to Default 0.247*** 0.276*** 0.227*** 0.255***

(0.080) (0.088) (0.078) (0.087)

Sales Growth 0.004 0.004 0.002 0.002

(0.017) (0.015) (0.016) (0.013)

Global Industry Q 0.229*** 0.227***

(0.050) (0.051)

Industry fixed-effect Yes No Yes No

Time effect (Years) Yes Yes Yes Yes

Observations 2586 2587 2306 2307

Adjusted R2 (Uncentered) 0.053 0.439 0.088 0.438

First stage F-Test 12.59 13.49 23.74 31.55

42

Table 7: Propensity Score Matched-Sample Test of Firm Value between Mandatory

Users of IR Derivatives and Nonusers, and Mandatory and Voluntary Users Panel A (B) and C (D) present the comparison of Q ratios between mandatory IR derivative users and nonusers, and

mandatory IR derivative users and voluntary users, respectively with (without) replacement. Treatment effect is the

mandatory use of IR derivatives. Control firms are the matched firm-years after propensity score matching procedure

explained in the text. The number of observations for treated and control variables in each test are reported separately as

supported firm-years. Log of assets, Debt to Equity, KMV-Merton Distance to Default, EBIT/LT debt, and Global

industry Q as well as R&D, Advertisement, and Capital expenditures all scaled by total assets are used in matching. In

addition, IR derivatives (net notional amount of IR derivatives divided by total assets) is used in Panel C and D tests.

For each treated firm-year, the non-treated firms whose propensity score is equal to or 0.01 different from that of treated

at maximum (caliper) is used as controlled firm. After matching for each test, the difference between the average and

median of Q ratios of treated and controlled firm-years is tested and the p-value of the t-test for the mean and Wilcoxon

rank-sum Z-test for median comparisons are reported.

Panel A:

Mandatory vs. Nonusers

Treatment: Mandatory

Control: Nonusers

Supported with replacement:

Treated = 476, Control = 2260

Panel B:

Mandatory vs. Nonusers

Treatment: Mandatory

Control: Nonusers

Supported without replacement:

Treated = 473, Control = 2260

Before Matching After Matching Before Matching After Matching

Mean

Q ratio (Treated) 1.586 1.587 1.586 1.588

Q ratio (Control) 1.612 1.385 1.612 1.380

Difference -0.026 0.202 -0.026 0.208

p-value 30.1% 0.0% 30.1% 0.0%

Median

Q ratio (Treated) 1.268 1.293 1.268 1.293

Q ratio (Control) 1.320 1.188 1.320 1.192

Difference -0.052 0.105 -0.052 0.101

p-value 14.2% 0.0% 14.2% 0.0%

Panel C:

Mandatory vs. Voluntary

Treatment: Mandatory

Control: Voluntary

Supported with replacement:

Treated = 474, Control = 1140

Panel D:

Mandatory vs. Voluntary

Treatment: Mandatory

Control: Voluntary

Supported without replacement:

Treated = 412, Control = 1140

Before Matching After Matching Before Matching After Matching

Mean

Q ratio (Treated) 1.586 1.576 1.586 1.600

Q ratio (Control) 1.473 1.378 1.473 1.402

Difference 0.113 0.198 0.113 0.198

p-value 1.0% 1.0% 1.0% 0.0%

Median

Q ratio (Treated) 1.268 1.293 1.268 1.293

Q ratio (Control) 1.267 1.170 1.267 1.186

Difference 0.001 0.123 0.001 0.107

p-value 76.1% 0.0% 76.1% 0.0%

43

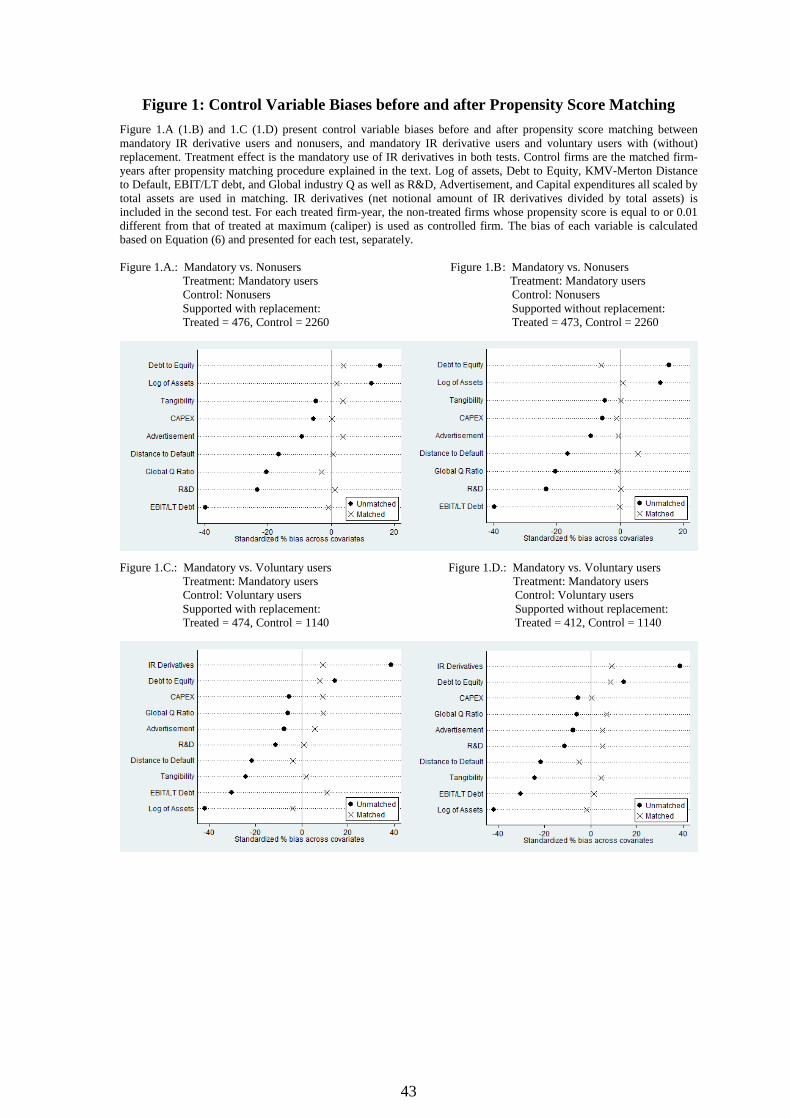
Figure 1: Control Variable Biases before and after Propensity Score Matching

Figure 1.A (1.B) and 1.C (1.D) present control variable biases before and after propensity score matching between

mandatory IR derivative users and nonusers, and mandatory IR derivative users and voluntary users with (without)

replacement. Treatment effect is the mandatory use of IR derivatives in both tests. Control firms are the matched firm-

years after propensity matching procedure explained in the text. Log of assets, Debt to Equity, KMV-Merton Distance

to Default, EBIT/LT debt, and Global industry Q as well as R&D, Advertisement, and Capital expenditures all scaled by

total assets are used in matching. IR derivatives (net notional amount of IR derivatives divided by total assets) is

included in the second test. For each treated firm-year, the non-treated firms whose propensity score is equal to or 0.01

different from that of treated at maximum (caliper) is used as controlled firm. The bias of each variable is calculated

based on Equation (6) and presented for each test, separately.

Figure 1.A.: Mandatory vs. Nonusers Figure 1.B: Mandatory vs. Nonusers

Treatment: Mandatory users Treatment: Mandatory users

Control: Nonusers Control: Nonusers

Supported with replacement: Supported without replacement:

Treated = 476, Control = 2260 Treated = 473, Control = 2260

Figure 1.C.: Mandatory vs. Voluntary users Figure 1.D.: Mandatory vs. Voluntary users

Treatment: Mandatory users Treatment: Mandatory users

Control: Voluntary users Control: Voluntary users

Supported with replacement: Supported without replacement:

Treated = 474, Control = 1140 Treated = 412, Control = 1140

44

Table 8: Shareholders Rights, SOX and Value Implication of IR Derivatives

The dependent variable is log of Q ratio defined as (market value at fiscal year-end + BV of assets – BV of

Equities)/BV of total assets. All estimates are via pooled OLS without industry fixed-effect. IR Derivatives is the net

notional amount of IR derivatives divided by total assets. Democracy dummy is 1 if the G-Index is equal or less than 5

and 0 otherwise. SOX dummy is 1 if year is greater than 2002 and 0 otherwise. Total assets represent the book value

(BV) of assets. Debt to Equity is long-term debt to market value. Return on Assets is net income divided by total assets.

CAPEX is capital expenditures. Advertisement and R&D are advertisement and research and development expenses,

respectively. Tangibility is net properties, plant and equipment divided by total assets. Sales growth is changes of sales

from two years before divided by total assets. Dividend dummy is 1 if firm-year pays dividend and 0 otherwise.

Geographical dummy is 1 if firm-year has operation abroad and 0 otherwise. Global industry Q is the Q ratio of a

hypothetical firm whose asset and equity is the aggregate amount of all firms’ assets and equities with the same 2-Digit

SIC code of firm-year in COMPUSTAT universe. Distance to Default is KMV-Merton measure explained in Appendix.

Standard errors robust to heteroskedasticity and serial correlation clustered at firm level are reported in parenthesis. *,

** and *** represent 10%, 5% and 1% significant level, respectively.

Mandatory users

Voluntary users

Mandatory users

Voluntary users

(1)

(2)

(3)

(4)

IR Derivatives 0.746**

-0.028

0.564**

0.026

(0.366)

(0.072)

(0.230)

(0.075)

Democracy dummy -0.119

-0.173

(0.255)

(0.150)

IR Derivatives × Democ. 0.313

1.926**

(0.630)

(0.847)

SOX dummy

-0.280**

0.071

(0.124)

(0.048)

IR Derivatives × SOX

0.204

0.478***

(0.240)

(0.161)

Log of assets 0.011

-0.014

0.043*

0.001

(0.058)

(0.021)

(0.022)

(0.014)

ROA -0.197*

2.494***

0.002

1.424***

(0.105)

(0.473)

(0.231)

(0.284)

Tangibility -0.118

-0.067

-0.208*

-0.119

(0.198)

(0.143)

(0.121)

(0.084)

CAPEX 1.924*

1.025

2.075***

1.064***

(1.043)

(0.645)

(0.528)

(0.311)

R&D 9.679***

5.792***

5.877***

3.541***

(2.969)

(1.863)

(1.927)

(0.766)

Advertisement -0.570

0.697*

0.676

0.351

(1.555)

(0.398)

(1.034)

(0.339)

Debt to Equity 0.011

-0.011

0.008

-0.010*

(0.015)

(0.020)

(0.006)

(0.006)

Dividend dummy -0.099

-0.018

-0.037

0.003

(0.111)

(0.054)

(0.064)

(0.034)

Geographical dummy -0.148

-0.049

-0.112*

-0.009

(0.144)

(0.053)

(0.062)

(0.034)

Distance to Default 0.503**

0.157

0.417***

0.043*

(0.198)

(0.122)

(0.115)

(0.025)

Sales Growth -0.141*

0.114***

0.019

0.025

(0.078)

(0.037)

(0.053)

(0.028)

Global Industry Q 0.174

0.167**

0.193**

0.174***

(0.242)

(0.076)

(0.091)

(0.055)

Industry Fixed-Effect No

No

No

No

Time Effect (Years) Yes

Yes

Yes

Yes

Observations 140

387

481

1140

Adjusted R2 0.507

0.431

0.339

0.289

45

Table 9: Competition Pressure and Value Implication of IR Derivatives

The dependent variable is log of Q ratio defined as (market value at fiscal year-end + BV of assets – BV of

Equities)/BV of total assets. All estimates are via pooled OLS without industry fixed-effect. IR Derivatives is the net

notional amount of IR derivatives divided by total assets. Product market fluidity is a proxy for competition pressure

developed by Hoberg et al. (2012). Total assets represent the book value (BV) of assets. Debt to Equity is long-term

debt to market value. Return on Assets is net income divided by total assets. CAPEX is capital expenditures.

Advertisement and R&D are advertisement and research and development expenses, respectively. Tangibility is net

properties, plant and equipment divided by total assets. Sales growth is changes of sales from two years before divided

by total assets. Dividend dummy is 1 if firm-year pays dividend and 0 otherwise. Geographical dummy is 1 if firm-year

has operation abroad and 0 otherwise. Global industry Q is the Q ratio of a hypothetical firm whose asset and equity is

the aggregate amount of all firms’ assets and equities with the same 2-Digit SIC code of firm-year in COMPUSTAT

universe. Distance to Default is KMV-Merton measure explained in Appendix. Standard errors robust to

heteroskedasticity and serial correlation clustered at firm level are reported in parenthesis. *, ** and *** represent 10%,

5% and 1% significant level, respectively.

Mandatory users Voluntary users

(1) (2)

IR Derivatives 1.022*** -0.224*

(0.270) (0.129)

Product market fluidity 0.032*** 0.007

(0.010) (0.005)

IR Derivatives × Product market fluidity -0.040 0.035**

(0.028) (0.016)

Log of assets 0.013 -0.011

(0.023) (0.014)

Return on Assets 0.017 1.374***

(0.243) (0.279)

Tangibility -0.123 -0.124

(0.120) (0.088)

CAPEX 1.580*** 0.945***

(0.535) (0.313)

R&D 5.518*** 3.327***

(1.989) (0.786)

Advertisement 0.707 0.400

(1.052) (0.330)

Debt to Equity 0.011 -0.011*

(0.007) (0.006)

Dividend dummy -0.027 0.018

(0.067) (0.035)

Geographical dummy -0.080 0.005

(0.058) (0.035)

Distance to Default 0.474*** 0.038*

(0.124) (0.023)

Sales Growth 0.036 0.020

(0.057) (0.028)

Global Industry Q 0.221** 0.180***

(0.091) (0.055)

Industry Fixed-Effect No No

Time Effect Yes Yes

Observations 478 1129

Adjusted R2 0.364 0.286

46

Table 10: Mandatory and Voluntary use of IR derivatives, Credit Agreement

Covenants and Firm Value

The dependent variable is log of Q ratio defined as (market value at fiscal year-end + BV of assets – BV of

Equities)/BV of total assets. In column (1) results are obtained from industry fixed-effect (equation (1)) with dummy

variables for 19 covenants explained in the text and their interaction with IRPC. Covenants Dummies are 1 if the subject

covenant is effective for the credit agreement of the sample firm-year and 0 otherwise. Column (2) reports the estimates

via pooled OLS without industry fixed-effect with the same covenant dummies and interaction terms. Sample firm-years

are mandatory IR derivative users and Nonusers. For the space saving, only significant coefficients of the interaction

terms with IRPC are reported for both models. IR Derivatives is the net notional amount of IR derivatives divided by

total assets. Total assets represent the book value (BV) of assets. Debt to Equity is long-term debt to market value.

Return on Assets is net income divided by total assets. CAPEX is capital expenditures. Advertisement and R&D are

advertisement and research and development expenses, respectively. Tangibility is net properties, plant and equipment

divided by total assets. Sales growth is changes of sales from two years before divided by total assets. Dividend dummy

is 1 if firm-year pays dividend and 0 otherwise. Geographical dummy is 1 if firm-year has operation abroad and 0

otherwise. Global industry Q is the Q ratio of a hypothetical firm whose asset and equity is the aggregate amount of all

firms’ assets and equities with the same 2-Digit SIC code of firm-year in COMPUSTAT universe. Distance to Default is

KMV-Merton measure explained in Appendix. Standard errors robust to heteroskedasticity and serial correlation

(clustered at industry level in models (1), and at firm level in models (2)) are reported in parenthesis. *, ** and ***

represent 10%, 5% and 1% significant level, respectively.

(1) (2)

IR Derivatives 0.570***

0.516***

(0.106)

(0.133)

Log of assets 0.021**

0.027**

(0.009)

(0.012)

Return on Assets 0.532***

0.497***

(0.177)

(0.157)

Tangibility -0.139*

-0.220***

(0.076)

(0.072)

CAPEX 1.395***

1.690***

(0.372)

(0.257)

R&D 3.268***

3.426***

(0.367)

(0.471)

Advertisement 0.747**

0.464

(0.361)

(0.475)

Debt to Equity 0.002

0.003

(0.005)

(0.006)

Dividend dummy 0.068***

0.050

(0.026)

(0.032)

Geographical dummy -0.024

-0.044

(0.026)

(0.028)

Distance to Default 0.101

0.117

(0.065)

(0.072)

Sales Growth 0.012

0.009

(0.020)

(0.017)

Global industry Q

0.208***

(0.044)

47

Table 10 - Continued

(1) (2)

Current Ratio Covenant 0.032

0.019

(0.082)

(0.059)

Debt to Net Worth Covenant 0.033

-0.003

(0.061)

(0.065)

Other Balance Sheet Covenant 0.073

0.121

(0.075)

(0.080)

Quick Ratio Covenant 0.184**

0.150

(0.076)

(0.091)

Senior Debt to Cash Flow Covenant -0.083*

-0.082*

(0.048)

(0.043)

IRPC × Current Ratio Covenant 1.521**

1.226**

(0.666)

(0.539)

IRPC × Debt to Net Worth Covenant -3.098**

-2.110

(1.211)

(1.399)

IRPC × Other Balance Sheet Covenant 1.174

3.156***

(0.792)

(0.977)

IRPC × Quick Ratio Covenant -3.210***

-2.477**

(1.080)

(0.991)

IRPC × Senior Debt to Cash Flow Covenant 0.922***

0.689*

(0.288)

(0.356)

Industry fixed-effect Yes No

Time Effect (Years) Yes Yes

Observations 2548 2548

Adjusted R2 0.225 0.255


Recommended