+ All Categories
Home > Documents > Intergrated Geophysical Studies Over Parts of Central Cross River State for the Determination of...

Intergrated Geophysical Studies Over Parts of Central Cross River State for the Determination of...

Date post: 12-Dec-2015
Category:
Upload: iosrjournal
View: 8 times
Download: 0 times
Share this document with a friend
Description:
IOSR Journal of Applied Geology and Geophysics (IOSR-JAGG) volume.3 issue.4 version.2
Popular Tags:
16
IOSR Journal of Applied Geology and Geophysics (IOSR-JAGG) e-ISSN: 23210990, p-ISSN: 23210982.Volume 3, Issue 4 Ver. II (Jul - Aug. 2015), PP 49-64 www.iosrjournals.org DOI: 10.9790/0990-03424964 www.iosrjournals.org 49 | Page Intergrated Geophysical Studies Over Parts of Central Cross River State for the Determination of Groundwater Potential and Foundation Properties of Rocks V. I. Obianwu 1, , A. O. Egor 2, , A. A. Okiwelu 3 and E. D. Ebong 4 1,3,4 Department of Physics (Geophysics Unit), University of Calabar, P.M.B. 1115, Calabar, Nigeria 2 Department of Physics, Cross River University of Technology, Calabar, Nigeria Abstract: A total of 71 Vertical Electrical Soundings were carried out using Schlumberger electrode configuration for the evaluation of groundwater potential in parts of central Cross River State, Nigeria. Interpretation of data showed three to six geoelectric layers. Productive shallow and deep aquifer zones were identified at depths of 60 m and 150 m respectively, corresponding to a resistivity range of 100-500 Ωm for shallow aquifers and 1000-2500 Ωm for deep aquifers respectively. The lithologic data of the aquif ers revealed sand/sandstone and very coarsed grained sand/fractured basement, respectively. Seismic refraction survey was also carried out within the same study area for the foundation study of rocks. The studies revealed an average thickness of 4.5 m (probably sand/clay) and 10.0 m (probably gravelly sand/shale) for the first and second layers respectively. The range of velocities for the first three layers are 602 m/s to 960 m/s, 378 m/s to 2,424 m/s and 1,587 m/s to 5,368 m/s, respectively, indicating that the soils in the area are not homogeneous. It is inferred from the relative high values of calculated elastic constants in most of the locations, that the soils are well consolidated and as such suitable for large engineering construction in such locations, while in the rest of the locations the soils are considered unconsolidated and unsuitable for large construction work due to the relative low values of the elastic constants. Keywords: Vertical Electrical Sounding, groundwater, electrical resistivity, aquifer, electrode separation, refractor, geoseismic section. I. Introduction The central parts of Cross River State forms a part of the geopolitical and geographic entity where the Cross River State Government dissipated so much energy to upgrade its natural and human resources. Since the commencement of the democratic experiment in 1999, the Cross River State Government initiated the Urban Renewal Scheme, which led to the improvement of facilities in some urban centres in the state. A corresponding population growth within those urban centres, which include Yakurr and Ikom Local Government Areas form a part of the study area. In another policy of the state government tagged: “Rural Development Policy”, the emphasis on development was shifted to the rural communities which constituted the bulk of the state population. These two policies resulted in population increase within the urban centres and the rural areas which has put so much pressure on the available water supply. The situation is further worsened by the overstretching of the available facilities and hence the development and expansion of water facilities to meet present and future demands of the communities in the study area have become very expedient. Although for over a decade, there had been some effort to develop and expand these facilities, especially in the area of exploitation of ground water, most of these boreholes have since stopped producing as revealed by presence of failed boreholes and manually dug wells in some of the Local Government Areas in the study area. The consequence of failed wells is that greater parts of the population depend on surface water sources like rivers and streams which are both seasonal and prone to contamination leading to water borne diseases like guinea worm, bilhaziosis, typhoid, and cholera during the dry season. In the light of the above, it is essential to acquire a geophysical and hydrogeological database that will help in site and groundwater development in the study area leading to the present study. Electrical resistivity method and seismic refraction method are efficient tools for site investigation towards the determination of overburden thickness, bed rock competence and mapping of subsurface structures before excavation and construction (Kurthenecker, 1934; Drake, 1962; Early and Dyer, 1964; Burton 1976; Nun, 1979; Keary and Brooks, 1984; Olorunfemi and Meshida, 1987). Both methods can be used in geotechnics to assess the rock strength, determine rippability and potential fluid content (Ayolabi, 2004; Ayolabi et al., 2008). In the present study, the electrical resistivity method and seismic refraction methods were deployed to determine the ground water potentials and foundation condition of rocks within the study area.
Transcript

IOSR Journal of Applied Geology and Geophysics (IOSR-JAGG)

e-ISSN: 2321–0990, p-ISSN: 2321–0982.Volume 3, Issue 4 Ver. II (Jul - Aug. 2015), PP 49-64

www.iosrjournals.org

DOI: 10.9790/0990-03424964 www.iosrjournals.org 49 | Page

Intergrated Geophysical Studies Over Parts of Central Cross

River State for the Determination of Groundwater Potential and

Foundation Properties of Rocks

V. I. Obianwu1,

, A. O. Egor2,

, A. A. Okiwelu3 and E. D. Ebong

4

1,3,4Department of Physics (Geophysics Unit), University of Calabar, P.M.B. 1115, Calabar, Nigeria

2Department of Physics, Cross River University of Technology, Calabar, Nigeria

Abstract: A total of 71 Vertical Electrical Soundings were carried out using Schlumberger electrode

configuration for the evaluation of groundwater potential in parts of central Cross River State, Nigeria.

Interpretation of data showed three to six geoelectric layers. Productive shallow and deep aquifer zones were

identified at depths of 60 m and 150 m respectively, corresponding to a resistivity range of 100-500 Ωm for

shallow aquifers and 1000-2500 Ωm for deep aquifers respectively. The lithologic data of the aquifers revealed

sand/sandstone and very coarsed grained sand/fractured basement, respectively. Seismic refraction survey was

also carried out within the same study area for the foundation study of rocks. The studies revealed an average

thickness of 4.5 m (probably sand/clay) and 10.0 m (probably gravelly sand/shale) for the first and second

layers respectively. The range of velocities for the first three layers are 602 m/s to 960 m/s, 378 m/s to 2,424 m/s

and 1,587 m/s to 5,368 m/s, respectively, indicating that the soils in the area are not homogeneous. It is inferred

from the relative high values of calculated elastic constants in most of the locations, that the soils are well

consolidated and as such suitable for large engineering construction in such locations, while in the rest of the

locations the soils are considered unconsolidated and unsuitable for large construction work due to the relative

low values of the elastic constants.

Keywords: Vertical Electrical Sounding, groundwater, electrical resistivity, aquifer, electrode separation,

refractor, geoseismic section.

I. Introduction The central parts of Cross River State forms a part of the geopolitical and geographic entity where the

Cross River State Government dissipated so much energy to upgrade its natural and human resources. Since the

commencement of the democratic experiment in 1999, the Cross River State Government initiated the Urban

Renewal Scheme, which led to the improvement of facilities in some urban centres in the state. A corresponding

population growth within those urban centres, which include Yakurr and Ikom Local Government Areas form a

part of the study area. In another policy of the state government tagged: “Rural Development Policy”, the

emphasis on development was shifted to the rural communities which constituted the bulk of the state

population. These two policies resulted in population increase within the urban centres and the rural areas which

has put so much pressure on the available water supply. The situation is further worsened by the overstretching

of the available facilities and hence the development and expansion of water facilities to meet present and future

demands of the communities in the study area have become very expedient. Although for over a decade, there

had been some effort to develop and expand these facilities, especially in the area of exploitation of ground

water, most of these boreholes have since stopped producing as revealed by presence of failed boreholes and

manually dug wells in some of the Local Government Areas in the study area.

The consequence of failed wells is that greater parts of the population depend on surface water sources

like rivers and streams which are both seasonal and prone to contamination leading to water borne diseases like

guinea worm, bilhaziosis, typhoid, and cholera during the dry season. In the light of the above, it is essential to

acquire a geophysical and hydrogeological database that will help in site and groundwater development in the

study area leading to the present study.

Electrical resistivity method and seismic refraction method are efficient tools for site investigation

towards the determination of overburden thickness, bed rock competence and mapping of subsurface structures

before excavation and construction (Kurthenecker, 1934; Drake, 1962; Early and Dyer, 1964; Burton 1976;

Nun, 1979; Keary and Brooks, 1984; Olorunfemi and Meshida, 1987). Both methods can be used in geotechnics

to assess the rock strength, determine rippability and potential fluid content (Ayolabi, 2004; Ayolabi et al.,

2008). In the present study, the electrical resistivity method and seismic refraction methods were deployed to

determine the ground water potentials and foundation condition of rocks within the study area.

Intergrated Geophysical Studies Over Parts of Central Cross River State for the Determination of…

DOI: 10.9790/0990-03424964 www.iosrjournals.org 50 | Page

II. Geology And Hydrogeology Of The Study Area The study area covering the central part of Cross River State lies between latitudes 5°45′ N and 6°28′ N

and longitudes 8°00′ E and 9°11′ E. The area includes the Ikom-Mamfe embayment and Boki Geological

environment. The Ikom-Mamfe embayment is the Northwest to Southeast segment of the Northeast to

Southwest trending Benue Trough. It extends laterally into parts of Western Cameroon, where it covers an area

of 2,016km2 (Eseme et al., 2002). It occupies the low lying areas between the Oban Massif and the Obudu

plateau in Cross River State, Nigeria and is characterized by low relief and gently undulating topography

(Eseme et al., 2002) (see Fig. 1). This basin covers some of the communities in Abi, Yakurr, Obubra, Ikom and

Etung Local Government Areas, which constitute part of the study area.

The Precambrian basement rocks under the Ikom-Mamfe basin are overlain by three major cretaceous

lithostratigraphic units comprising the Asu River Group (ARG), Eze Aku Group (EAG) and the Post-Semtonian

Nkporo-Afikpo shale formation (NASF) (see Fig. 1). Some isolated alluvial deposits are also found along parts

of Cross River plains, while tertiary volcanic rocks like basalts and dolerites intrude into the overlying

cretaceous sedimentary units in some locations (Benkelil et al., 1975; Offodile, 1975; Cross River State Basin

Development Authority (CRBDA), 1982; NGSA, 2006) (see Fig. 1).

Migmatitic granitic gneisses, schists and pegmatite are the crystalline basement rocks in the basin. The

gneisses are usually foliated with some pink feldspars and vary from fine homeblende, black to white with

porhyroblastic feldspars. The albian ARG is the oldest sedimentary rocks in the study area and directly overlie

the Precambrian basement; they are basically non-marine to marginal marine in character and predominantly

cover the eastern part of the study area. The sediments within the ARG consist of impervious shales, limestone

with some sandstone intercalation and ammonites (Nigerian Geological Survey Agency (NGSA), 2006; Odigi

and Amajor, 2009). The EAG comprises of thick flaggy impervious calcareous and non-calcareous shales, sandy

shally limestone and calcareous sandstone (NGSA, 2006; Odigi and Amajor, 2009). The EAG is overlain by the

post santonian NASF which occupy most of the western parts of the study area. Sandstone, mudstone and shale

are the major lithologic units in the formation (NGSA, 2006; Odigi and Amajor, 2009). The shales are often

carbonaceous and pyritic which is suggestive of sediments that were deposited in a poorly oxygenated shallow

water environment with restricted air circulation (Peters et al., 1987).

Fig. 1: (A) Topographic map of Central Cross River State showing the elevation,

(B) Geological map of the study area and (C) Location map of the study area showing the seismic

stations and VES points (Redrawn from NGSA, 2006)

A

Profile lines

A’

B

B’C

C’

A

B

C

Intergrated Geophysical Studies Over Parts of Central Cross River State for the Determination of…

DOI: 10.9790/0990-03424964 www.iosrjournals.org 51 | Page

The Cross River Basin Development Authority (CRBDA), carried out a geological segmentation in

1982 and on this basis, Peters (1989) identified four shallow hydrogeological provinces consisting of the

crystalline basement province (CBP), Cross River Plain Province (CRPP), Nkporo-Afikpo Shales Province

(NASP) and Alluvial/Buried River Province (ABRP). The area exhibits a dendritic drainage pattern which is

drained by the Cross River and some of its tributaries including Ovarr, Okwo, Lokpoi, Okang, Udip, Ujidam,

Okpon, Atimaka, Aboine, Otere, Usee and Nde River (See Fig. 1B).

The study area’s vegetation is that of the guinea savannah, this is characterized by a mixture of green

plants, shrubs, grasses and trees, it has two seasons – wet (March to October) and dry (November to April).

Annual precipitation is usually over 2,200m while annual temperature ranges between 32 °C to 36 °C. Average

relative humidity is about 85 per cent. Recently, significant shift in both the upper and lower boundaries of these

two climatic conditions have been observed (Martinez et al., 2008; Rapti-Caputo, 2010; Riddell et al., 2008;

Wagner and Zeck-hauser, 2011).

Basalts, dolerites and major rock types in the CBP are distributed in patches in many parts of the study

area, although the southern part of the study area is dominated by gneissic materials which is another major rock

type in the CBP region. The occurrence of groundwater in the CBP is facilitated by the presence of secondary

structures like fracture, faults, joints, fissures and other weathered litho-units. Ground water from these

structures can occur even at depths as low as 50m with poor in yield at some locations (Edet et al., 2011;

Offiong, 2011; Akpan et al., 2013). The single largest hydrogeological province is the CRPP covering the

northern, central, southwestern and Northwestern parts of the study area. The aquiferous units in this province

consist of deformed shales, siltstones, limestones and sandstones of Markurdi formation (Petters, 1989).

The NASP occupied the western part of the study area and consists basically of porous sandstones,

compact shales, mudstones, marls and clays (Petters, 1989; Nigerian Geological Survey Agency (NGSA),

2006). The permeable sandstone appears to be an eastward extension of the adjoining Afikpo sandstones

(Petters, 1989; Odoh, 2010). Most of the litho-units are porous and thus act as high yielding aquifers (Akpan et

al., 2013).

III. Methods Of Data Collection Resistivity method

Conventional Schlumberger array VES (Telford et al., 1990) with the maximum electrode spacing

(AB) of 800 m at some of the 71 sites. The depth of current penetration using Schlumberger electrode array is ⅓

to ¼ of AB/2 which comes to 133m to 150m is deemed sufficient to know about the aquifer and bedrock

properties (Bernard, 2003; Roy and Apparao, 1971). The soundings were constrained by data from existing

boreholes located near some of the VES points.

Seismic method

Ten profile lines were laid in each of the local government areas in the central part of the state. Each

profile line was 60 m long with inter-geophone spacing of 5m (see Fig. 9). Inter-profile line spacing varied from

1.5 km to 3 km. The P- waves and S-waves were mechanically generated using the sledge-hammer

perpendicular to a base plate that is placed on a flat surface.

The arrival time of signals in each of the geophones are picked from the record of the seismograph.

Other details of the refraction survey procedures have been documented by Ayolabi (2004).

IV. Results Resistivity survey

The initial analysis of the VES data began with the computation of apparent resistivities, using the

Schlumberger array equation as expressed below:

𝜌𝑎𝑠 = 𝐴𝐵

2

2−

𝑀𝑁

2

2

𝑀𝑁

∆𝑉

𝐼 =

𝜋𝑏2𝑅

4𝑎 (1)

where 𝜌𝑎𝑠 is the Schlumberger apparent resistivity, AB is the current electrode distance, MN is the

potential electrode distance, R is the apparent resistance ∆𝑉 is the voltage and I is current. The calculated 𝜌𝑎𝑠 of

each sounding station was plotted against half of the current electrode spacing 𝐴𝐵/2 on a log-log graph paper,

VES curves were obtained and noisy segments were removed by manual smoothening (Bhattacharya, 1968;

Chakravarthi et al., 2007). The smoothened curves were quantitatively interpreted in terms of true resistivity and

thickness by a conventional manual curve matching procedure using master curves and auxiliary charts

(Orellana and Moony, 1966).

Intergrated Geophysical Studies Over Parts of Central Cross River State for the Determination of…

DOI: 10.9790/0990-03424964 www.iosrjournals.org 52 | Page

Fig. 3: Apparent Resistivity model curve of Abia Bendeghe in the study area

Fig. 2: Apparent Resistivity model curve of Abankang in the study area

Fig. 4: Apparent Resistivity model curve of Abu Ogbagante in the study area

Intergrated Geophysical Studies Over Parts of Central Cross River State for the Determination of…

DOI: 10.9790/0990-03424964 www.iosrjournals.org 53 | Page

Computer software Resist was used to refine the manually interpreted results (Vender Velpen, 1988;

Zohdy, 1989; Loke, 2001). The layer parameters (apparent resistivity, layer thickness and depth) realized

initially from the manual interpretation stage were used as inputs into the computer modeling software. The

modeled data was iterated to obtain high accuracy by consciously ensuring that the root mean square error does

not exceed 5%. The results are displayed in Table 1 (a, b & c).The field curves revealed 3 to 5 interpretable geo-

electric layers resembling KH, HKH, HK, K, KHKH, KQ, KQH, KHH, AKQ, KAKH, Q, QQ, QQQ, AAK,

AAKH, QH, HKQ, KQQ, QQH, and KKH types, as shown in Figs. 3-5. VES stations 6, 12, 26, 29, 36, 37, 45,

46, 47 and 60 have revealed reflection coefficients more than 0.9 and resistivity contrasts more than 0.9 and 19,

respectively.

Seismic survey

The first arrival time from each geophone (5m apart) was plotted between the geophone numbers

versus the arrival time of P-waves and S-waves for each shooting point for forward and reverse arrivals (Fig. 5)

(Geosoft, 2001). The first arrival time was picked from these plots (seismic wiggles) (see Figs. 6 & 7). A time-

distance plot was generated for P-wave and S-wave using a software SeisImager. The layer velocities and depths

for P-waves and S-waves are displayed automatically with the T-X plots (see Fig. 8 – 10).

Although the software simplifies the process of analysing the data by its automation procedure the

underlying principle for calculating the velocity and depth of the layers was based on the Wyrobek Method

(Telford et al., 1990). The Wyrobek’s method upon which the SeisImager software is based does not actually

require reverse profiles because the intercept at a shotpoint does not depend on the direction in which the cable

is laid (Telford et al., 1990). The summary of the seismic refraction velocity results is given in Table 2 (a & b),

while the computed results of the elastic constants are in Tables 3 (a & b).

V. Discussion Geoelectric Sections

A first glance, the apparent resistivity curves (see Fig. 2 – 4), reveal 3 - 6 layers that are characterized

by low to moderately high resistivity values. The first layer which is exposed at the surface is characterized by

electrical resistivity values that are generally less than 500 Ωm (that is ρ1 < 500 Ωm) except at a few VES points

VES 5, VES 28, VES 33, VES 34, VES 41, VES 50, VES 52, VES 54, VES 55, VES 56, VES 60, VES 62 VES

66, and VES 70 where the electrical resistvity values are moderately high with ρ1 500 Ωm as a result of the

presence of gravel on the surface .The thickness of the first layer lie between 0.4m to 5.8m. At some locations

where thickness of 5m was observed, the rock bears water and the yield can sustain hand dug wells, especially

during the rainy season.

The second geoelectrical layer is dominated by clay/shale with thickness of 2.6 – 10.2 m and resistivity

of 90 – 1,547 Ωm. However at VES 21 and VES 22, the least values of resistivity was recorded between 9.4-

12.6 Ωm, this particular section of the layer was delineated as shale. The shales are thick in some locations and

the observed shale content of this layer suggests that primary porosity will be very low and consequently, water

transmission and storage will be very poor (Odoh, 2010).

The electrical resistivity values of the third layer varied between 164 – 746 Ωm, with thickness of 5.8 –

38 m corresponding to the variability of the lithology. Layers with resistivity values less than 30 Ωm are

inferred to be responses from wet clays while electrical resistivity values of over 500 Ωm are attributed to

sandy/sandstone materials which correlate well with lithology of nearby boreholes where sandy materials

dominate the subsurface composition in this layer. The sands are usually saturated with water and forms the

aquifer (Edet et al., 2011; Akpan et al., 2013).

Some locations like Ofunbongha and Adun Beach did not reveal fourth layer whereas in locations like

Ntamante, the electrical resistivity values is quite high (ρ4 > 8000 Ωm) which is indicative of basement

Fig.5: Geophone layout for seismic refraction data acquisition

Forward

Shot point

5m 5m 5m 5m 5m 5m 5m 5m 5m 5m 5m 5m

60m

Intergrated Geophysical Studies Over Parts of Central Cross River State for the Determination of…

DOI: 10.9790/0990-03424964 www.iosrjournals.org 54 | Page

rocks. The fifth layer was touched at Abakang , Alok and Nsadop, the electrical resistivity values ranges from

459.9 – 1340 Ωm and thickness between 40 m and 110 m.

TABLE 1(a) Summary of results of geo-electric parameters for VES 5-19

TABLE 1(b) Summary of results of geo-electric parameters for VES 20-34

TABLE 1(c) Summary of results of geo-electric parameters for VES 35-49

Intergrated Geophysical Studies Over Parts of Central Cross River State for the Determination of…

DOI: 10.9790/0990-03424964 www.iosrjournals.org 55 | Page

TABLE 1 (d) Summary of results of geo-electric parameters for VES 50-64

TABLE 1 (e) Summary of results of geo-electric parameters for VES 61-71

Fig. 6: Seismic wiggle showing forward arrival time of P-wave curve for a 12-channel

seismic line installed to the Seismic equipment from the study area

Intergrated Geophysical Studies Over Parts of Central Cross River State for the Determination of…

DOI: 10.9790/0990-03424964 www.iosrjournals.org 56 | Page

Fig. 7: Seismic wiggle showing reverse arrival time of P-wave curve for a 12-channel

seismic line installed to the Seismic equipment from the study area

Fig. 8: T-X plot of Ababene 309 P F (RMS error 5%)

Fig. 9: T-X plot of Ababene 310 S F (RMS error 5%)

Intergrated Geophysical Studies Over Parts of Central Cross River State for the Determination of…

DOI: 10.9790/0990-03424964 www.iosrjournals.org 57 | Page

Fig. 10: T-X plot of Ababene 315 P R (RMS error 5%)

TABLE 2(a) Summary of results of seismic velocities and depth from Itigidi to Ekukunela STUDY

LOCATI

ON

COORDINATES (°) Vp

(m/

s)

Vp2

(m/

s)

Vp3

(m/

s)

Vs

(m/

s)

Vs2

(m/

s)

Vs3

(m/

s)

Vp1∕

Vs1

Vp2∕

Vs2

Vp3/

Vs3

Dp1

(m

)

Dp2

(m

)

Ds1

(m

)

Ds2

(m

)

LATITU

DE

LONGITU

DE

Itigidi 5.89833 8.02713 585 681

101

7 385 441 509 1.52 1.54 2.00 3.8 8.8 6.2 1.7

Ediba 5.86469 8.03388 553 169

5 239

0 349 625 124

6 1.58 2.71 1.92 3.8 7.5

Ekurku 5.935 8.03513 584

193

1

483

1 411

129

5

212

2 1.42 1.49 2.28 3.1

12.

2 6 6.8

Agbara 5.98611 8.01772 541 691

309 409

1.75 1.69

14.

6

4.2

5

Annong 5.887166 8.06061 728

1141

2806 482 655

1304 1.51 1.74 2.15 2.8

12.1 2.7 9

Usumuton

g 5.7663 8.01827 857

106

9

146

6 533 598 871 1.61 1.79 1.68 4.5 8.3 2.6

10.

1 Pcn p/s

Ijiman

Ugep 5.80716 8.0846 690

115

8

225

1 475 527 675 1.45 2.20 3.33 4.2

10.

9 2 5.3 st

Theresas

p/s Ugep 5.82236 8.08622 584 815

193

1 313 480 705 1.87 1.70 2.74 4.9

10.

7 2.5 9 Ekori 5.88002 8.12083 602 669

363 401

1.66 1.67

2

4.4

Nkpani 5.8418 8.5663 658 946

1806 368 601 833 1.79 1.57 2.17 6.9

12.1 7.1 6.6

Onyadama 5.93388 8.23822 669

147

1

245

7 347 747

124

7 1.93 1.97 1.97 7.3 8.7 4.8 8.6

Ababene 5.95102 8.26269 822

252

4

299

0 484 745

127

2 1.70 3.39 2.35 25 2.3 5.1 9

Ovonum 5.98881 8.27063 634 124

1 536

8 454 615 799 1.40 2.02 6.72 4.6 8.6 4.2 5.9

Apiapum 5.99794 8.31577 960

175

6

257

2 444 460 649 2.16 3.82 3.96 5.5 5.2 2.5 7.7

Owakande 6.03394 8.34488 793

144

8

298

3 462 645

110

0 1.72 2.24 2.71 8 9.9 4.8 8.6

st Francis

p/s

Obubra 6.8513 8.32841 621 697

113

4 284 327 389 2.19 2.13 2.92 4.8 8.3 2.8 2.8

Iyamitet 5.85819 8.35508 763 144

7 157

4 408 740 714 1.87 1.96 2.20 4.1 0.5 2.7 0.5

Iyamoyon

g 5.97241 8.3588 732 808

158

7 484 496 754 1.51 1.63 2.10 2.1

13.

5

17.

2 2.6

Ochon 5.92802 8.44227

115

0

227

5

417

0 523 809

115

5 2.20 2.81 3.61 6.4 7.6 3.1

11.

4

onyen-okpon 5.97494 8.47261 782

1777

2908 282 399 715 2.77 4.45 4.07 4.2 7.3 5 6.5

Alesi 5.94891 8.51108 535

104

9

257

9 277 488

111

1 1.93 2.15 2.32 4 7.9 4.4 9.4

Ekukunela 5.94458 8.53891 651

134

7

393

6 422 713

106

4 1.54 1.89 3.70 5.1 9.9 3.5 4.2

Intergrated Geophysical Studies Over Parts of Central Cross River State for the Determination of…

DOI: 10.9790/0990-03424964 www.iosrjournals.org 58 | Page

TABLE 2(b) Summary of results of seismic velocities and depths from Omindom to Velos Ikom

STUDY

LOCATI

ON

COORDINATES (°)

VP

(m/

s)

VP2

(m/

s)

VP3

(m/

s)

Vs

(m/

s)

Vs2

(m/

s)

Vs3

(m/

s)

Vp1∕V

s1

Vp2∕V

s2

VP3

VS3

dp1

(m

)

dp2

(m

)

ds1

(m

)

ds2

(m

)

LATITU

DE

LONGITU

DE

Omindom 5.93555 8.58430 618 181

6 405

3 298 359 751 2.07 5.06 5.4

0 4.8 9.7

3.5

14.8

Ekpokpa 5.98825 8.61569 481

146

8

346

1 317 521 777 1.52 2.82

4.4

5

2.

6 10

4.

8

13.

4

Akam 5.94422 8.62794 615

210

9

471

9 325 599 920 1.89 3.52

5.1

3

3.

7

10.

6

2.

5

10.

6

Abijang 5.82705 8.70941 643 111

6 271

9 443 547 778 1.45 2.04 3.4

9 2.7 3.7

1.1 6.4

Enoghi-

ikom 5.95297 8.73680 297 499

202

6 201 255 353 1.48 1.96

5.7

4

4.

6

13.

3

4.

2 5.6

Grassfield 5.95250 8.73980 390

117

4

320

1 192 236 416 2.03 4.97

7.6

9

8.

8 13

2.

6 7.6

Kalime 5.90991 8.77533 715 101

4 262

2 342 353 674 2.09 2.87 3.8

9 4.2

12.1

1.9

14.0

Crin

Ajasor 5.87644 8.81561 281 544

164

0 192 323 395 1.46 1.68

4.1

5

4.

6 7.5

8.

5

12.

1 Okondi-

Ikom 5.96366 8.78847

116

8

173

7

248

8 510 641

121

4 2.29 2.71

2.0

5

2.

4 5.4

6.

8 8.0

Agbokim waterfall 5.90411 8.89425 610

1238

2169 286 310 421 2.13 3.99

5.15 8 8.8

2.3 7.8

Wula 6.39866 9.11140 360 378

161

6 209 245 354 1.72 1.54

4.5

6

1.

6 8.3 3 3.6

Bukalum 6.34269 9.11302 492 999

596

8 325 451 671 1.51 2.22

8.8

9

4.

2 16

5.

6 7.5

Kanyang 6.26447 9.04694 387 960 258

3 257 367 459 1.51 2.62 5.6

3 4.9 9.3

3.2 3.8

Abo

Ogbante 6.16333 9.02102 433 770

286

6 226 433 490 1.92 1.78

5.8

5

4.

7 3.9

4.

2 6.2

Bashua 6.08122 8.96272 619 908

256

2 391 424 553 1.58 2.14

4.6

3

4.

7 10

3.

8 4.6

Biawan 6.07683 8.92170 494

104

3

402

0 314 430 637 1.57 2.43

6.3

1

9.

8

14.

9

5.

9 7.0

Orim

Ekpang 6.06597 8.89536 528 600 925 340 377 408 1.55 1.59

2.2

7

1.

9 9.6

2.

4 4.7 Bendege

Ekim 6.01531 8.88000 459

131

6

305

8 260 350 627 1.77 3.76

4.8

8

5.

5 8.7

5.

3 8.2 Adijikpon

g 6.00800 8.74613 512

122

5

390

4 321 364 562 1.60 3.37

6.9

5

7.

4

14.

5

2.

5 7.0

Akparabong 6.03147 8.74780 649

1567

2829 289 349 417 2.25 4.49

6.78

5.1 7.3

4.7 4.5

Velos

Ikom 5.96516 8.71883 459 655

113

9 255 336 472 1.80 1.95

2.4

1

5.

9 9.9

4,

7

10.

6

Intergrated Geophysical Studies Over Parts of Central Cross River State for the Determination of…

DOI: 10.9790/0990-03424964 www.iosrjournals.org 59 | Page

TABLE 3 (a) Summary of results of elastic constants from Itigidi to Ekunela

STUDY

LOCATI

ON

COORDINATES (°)

DENSITY

(kg/m3) µ1

×108

(N/m2)

µ2

×108

(N/m2)

µ3

×108

(N/m2)

E1

×108

(N/m2)

E2

×108

(N/m2)

E3

×108

(N/m2)

K1

×108

(N/m2)

K2

×108

(N/m2)

K3

×108

(N/m2)

LATITU

DE

LONGITU

DE

ρ1 ρ2 ρ2

Itigidi 5.89833 8.02713 267

0 267

0 267

0 3.96 5.19 6.92 8.85 11.8

0 18.4

0 3.86 5.46 18.4

0

Ediba 5.86469 8.03388

267

0

267

0

267

0 3.25

10.4

0

41.5

0 7.60

29.6

0

109.

00 3.83

62.8

0

97.2

0

Ekureku 5.93500 8.03513

267

0

267

0

267

0 4.51

44.8

0

120.

00 9.10

97.7

0

332.

00 3.09

39.9

0

463.

00

Agbara 5.98611 8.01772 267

0 267

0

2.55 4.47

6.41 11.0

0

4.42 6.79

Annong 5.88717 8.06061

267

0

267

0

267

0 6.20

11.5

0

45.4

0

13.8

0

28.7

0

124.

00 5.88

19.5

0

150.

00 Usumuton

g 5.76630 8.01827

267

0

267

0

267

0 7.59 9.55

20.3

0

18.0

0

24.3

0

49.7

0 9.50

17.8

0

30.4

0

Pcn p/s

Ijiman

Ugep 5.80716 8.0846

267

0

267

0

267

0 6.02 7.42

12.2

0

12.6

0

20.3

0

35.3

0 4.68

25.9

0

119.

00

St theresas

p/s Ugep 5.82236 8.08622

267

0

267

0

267

0 2.62 6.15

13.3

0 6.79

15.2

0

37.8

0 5.62 9.53

81.9

0

Ekori 5.88002 8.12083 267

0 267

0

3.52 4.29

8.54 10.5

0

4.99 0.06

Nkpani 5.84180 8.5663

267

0

267

0

267

0 3.62 9.64

18.5

0 9.20

22.4

0

50.6

0 6.74

11.0

0

62.4

0 Onyadam

a 5.93388 8.23822

267

0

267

0

267

0 3.21

41.5

0

84.6

0

39.5

0

110.

00 7.66

37.9

0

106.

00

Ababene 5.95102 8.26269

267

0

267

0

267

0 6.25

14.8

0

43.2

0

15.4

0

43.0

0

120.

00 9.70

150.

00

181.

00

Ovonum 5.98881 8.27063 267

0 267

0 267

0 5.50 10.1

0 17.0

0 10.7

0 27.0

0 50.7

0 3.39 27.7

0 747.

00

Apiapum 5.99794 8.31577

267

0

267

0

267

0 5.26 5.65

11.2

0

14.4

0

16.5

0

33.0

0

17.6

0

74.8

0

162.

00 Owakand

e 6.03394 8.34488

267

0

267

0

267

0 5.70

11.1

0

32.3

0

14.2

0

30.6

0

91.8

0 9.19

41.2

0

195.

00

St Francis p/s obubra 6.8513 8.32841

2670

2670

2670 2.15 2.86 4.04 5.89 7.76

11.60 7.43 9.16

28.90

Iyamitet 5.85819 8.35508

267

0

267

0

267

0 4.44 1.46

13.6

0

11.6

0

38.7

0

37.3

0 9.62

36.4

0

48.0

0 Iyamoyon

g 5.97241 8.3588

267

0

267

0

267

0 6.25 6.57

15.2

0

13.9

0

15.7

0

41.1

0 5.97 8.67

47.0

0

Ochon 5.92802 8.44227 267

0 267

0 267

0 7.30 17.5

0 35.6

0 20.0

0 49.9

0 100.

00 25.6

0 115.

00 417.

00

Onyen-

okpon 5.97494 8.47261

267

0

267

0

267

0 2.12 4.25

13.6

0 6.05

12.5

0

40.1

0

13.5

0

78.6

0

208.

00

Alesi 5.94891 8.51108

267

0

267

0

267

0 2.05 6.36

33.0

0 5.40

33.0

0

91.4

0 4.91

20.9

0

134.

00

Ekukunela 5.94458 8.53891

2670

2670

2670 4.75

13.60

30.20

10.80

35.40

88.30 4.98

30.30

373.00

Intergrated Geophysical Studies Over Parts of Central Cross River State for the Determination of…

DOI: 10.9790/0990-03424964 www.iosrjournals.org 60 | Page

TABLE 3 (b) Summary of results of elastic constants from Omindom to Velos Ikom

VES63

VES62

VES68

VES20 VES15

VES18

VES30VES61

A A’

STUDY

LOCATI

ON

COORDINATES

DENSITY

(kg/m3) µ1

×108

(N/

m2)

µ2

×108

(N/

m2)

µ3

×108

(N/

m2)

E1

×108

(N/

m2)

E2

×108

(N/

m2)

E3

×108

(N/

m2)

K1

×108

(N/

m2)

K2

×108

(N/

m2)

K3

×108

(N/

m2)

LATITU

DE

LONGIT

UDE

ρ1 ρ2 ρ2

Omindom 5.93555 8.58430

267

0

267

0

267

0 2.37 3.44

15.1

0 6.39

10.2

0

44.6

0 7.04 8.35

419.

00

Ekpokpa 5.98825 8.61569

267

0

267

0

267

0 2.68 7.25

16.1

0 5.99

20.7

0

47.5

0 2.60

47.9

0

298.

00

Akam 5.94422 8.62794 267

0 267

0 267

0 2.82 9.58 22.6

0 7.37 27.9

0 66.9

0 6.34 106.

00 564.

00

Abijang 5.82705 8.70941

267

0

267

0

267

0 5.24 7.99

16.2

0

11.0

0

21.4

0

47.0

0 4.05

22.6

0

176.

00 Enoghi-

ikom 5.95297 8.73680

267

0

267

0

267

0 1.08 1.74 3.33 2.32 4.59 9.88 0.92 4.33

105.

00

Grassfield 5.95250 8.73980 267

0 267

0 267

0 0.98 1.49 4.62 2.64 4.40 13.8

0 2.75 34.8

0 267.

00

Kalime 5.90991 8.77533

267

0

267

0

267

0 3.12 3.33

12.1

0 8.44 9.52

35.5

0 9.49

23.0

0

167.

00

Crin ajasor 5.87644 8.81561

267

0

267

0

267

0 0.98 2.79 4.17 2.09 6.84

12.2

0 0.80 4.19

66.3

0

Okondi-ikom 5.96366 8.78847

2670

2670

2670 6.94

11.00

39.40

19.20

31.20

106.00

27.20 6.59

113.00

Agbokim

waterfall 5.90411 8.89425

267

0

267

0

267

0 2.18 2.57 4.73 5.94 7.53

14.0

0 7.02 3.75

119.

00

Wula 6.39866 9.11140

267

0

267

0

267

0 1.17 1.60 3.35 2.91 3.65 9.87 1.91 1.68

65.3

0

Bukalum 6.34269 9.11302 267

0 267

0 267

0 2.82 5.43 1.20 6.28 14.9

0 35.9

0 2.70 19.4

0 935.

00

Kanyang 6.26447 9.04694

267

0

267

0

267

0 1.76 3.60 5.63 3.90

10.2

0

16.7

0 1.65

19.8

0

171.

00 Abo

Ogbante 6.16333 9.02102

267

0

267

0

267

0 1.36 5.01 6.41 3.58

12.7

0

19.0

0 3.19 9.16

211.

00

Bashua 6.08122 8.96272 267

0 267

0 267

0 4.08 4.80 8.17 9.54 13.1

0 24.1

0 4.79 15.6

0 164.

00

Biawan 6.07683 8.92170

267

0

267

0

267

0 2.63 4.94

10.8

0 6.11

13.8

0

32.2

0 3.01

22.5

0

417.

00

Orim

ekpang 6.06597 8.89536

267

0

267

0

267

0 3.09 3.79 4.44 7.07 8.91

12.3

0 3.33 4.55

16.9

0

Bendege ekim 6.01531 8.88000

2670

2670

2670 1.80 3.27

10.50 4.56 9.50

31.00 3.22

41.90

236.00

Adijikpong 6.00800 8.74613 267

0 267

0 267

0 2.75 3.54 8.43 6.47 10.3

0 25.1

0 3.33 35.3

0 396.

00

Akparabon

g 6.03147 8.74780

267

0

267

0

267

0 2.23 3.25 4.64 6.14 9.59

13.8

0 8.27

61.2

0

207.

00

Velos ikom 5.96516 8.71883

267

0

267

0

267

0 1.74 3.01 5.95 4.43 7.97

16.6

0 3.31 7.44

26.7

0

Fig. 11: Model showing AA’ Geoelectric Psuedosection of the study area

Intergrated Geophysical Studies Over Parts of Central Cross River State for the Determination of…

DOI: 10.9790/0990-03424964 www.iosrjournals.org 61 | Page

287

24

34

132

33

140

VES3 VES18 VES13 VES27

VES48

VES51VES53

Sandstone

B B’

16913

18

7

24

35

263

28

164

454

51

149

VES23VES21

VES20

VES57

VES35 VES36

Junction

VES 41

30871

500

30

160

182

62

C C’

C C’

Fig. 13: Model showing CC’ Geoelectric Pseudosection of the study area

Fig. 12: Model showing BB’ Geoelectric Pseudosection of the study area

Fig. 14: Primary wave velocity variation with depth of CC’ Geoseismic Pseudosection of

the study area

Intergrated Geophysical Studies Over Parts of Central Cross River State for the Determination of…

DOI: 10.9790/0990-03424964 www.iosrjournals.org 62 | Page

values around Alok and Nsadop presents a picture of a basement sedimentary contact, this contact is

characterized by fractured basement and has the potential for water as indicated by the values of <104 Ωm which

is the resistivity values for wet basement rocks (granite) (Loke and Dahlin, 1997).

Aquifers

Three geoelectrical sections were prepared for the study area (Figs. 11, 12 and 13), Fig. 11 is a

geoelectrical section trending Northeast – Southwest marked AA’ and shows the existence of thick aquifer units

in the third layer with resistivity of 164 – 746 Ωm and thickness of 5.8 – 38m and lies within a depth of 30 – 70

m beneath the surface. Apart from the third layer, the fifth layer also constitutes one of the aquiferous units in

some location. Fig. 12 is a geoelectric section trending East – West marked BB’, it shows the third layer as the

aquiferous unit with resistivity between 121 – 291 Ωm and thickness of 5.1 – 154.0 m, the resistivity range of

these aquifer units suggests that the layer is dominated with sandy materials, the third layer in this geosection is

highly variable and thins out greatly in some locations like Imabana (3.3 m) and Ababene (3.6 m), the thinning

out of this lithostrata around Ababene and Imabana axis of the psuedosection results in a poor groundwater

potential in this part of the profile.

The Northwest–Southeast geosection marked CC’is shown in Fig. 13, the third layer constitute the

aquifer unit, with resistivity range of 74–257 Ωm and thickness of 4.8–39.8 m. The aquifer exists at a depth

range of 27–75 m, which can easily be tapped by both private and cooperate developers.

Seismic Geosection

Two seismic refraction geosections were made as shown in Figs. 14 – 15. The first section (Fig. 14)

which trends Northwest – Southeast marked CC’ shows a conspicuous variation in primary wave velocity VP

with depth. Three distinct layers were imaged in the geosection. The first layer had a primary wave velocity of

281 m/s to 1,150 m/s and a thickness of 2.4 m to 4.6 m. within the layer a Vp range of 400 m/s to 600 m/s within

a depth range of 1 m to 2 m is inferred as organic materials in the soil which could be loose

sand/rubble/landfill/refuse/disturbed soil and clay landfill (http:pkukmwebukm.my/rohim). For road

construction, this layer must be ripped off because it does not have sufficient bearing capacity (Okwueze, 1991).

The locations in the Southeast (SE) of the profile registered a first layer of up to 14m deep. There is a

general increase in velocity (Vp) from the first layer to the second layer. This increase can be explained in terms

of consolidation of the earth materials as one gets deeper. There is also a variation in primary wave velocity (Vp)

within the second layer. The range of Vp is from 544 m/s to 2,275 m/s, with layer thickness ranging from 7.3 m

to 13.6 m. The range of P-wave velocities of the layer when compared to borehole logs, suggest that at various

locations, the layer is made up of laterite, sand, gravel, clay and shale. The third layer has a P-wave velocity

range of 1,139 m/s to 5,368 m/s and thickness of 1.9 m to 17.2 m. It is inferred that sandy clay dominates the

layer. There was no access to deeper refractors because of the limited energy of the source used in the survey.

The Northeast - Southwest profile marked AA’ is shown in Fig. 15. Only two geoseismic layers were

accessed. The first layer has a Vp range of 590 m/s to 960 m/s and a thickness range of 2.0 m to 8 m. This

indicates that the top layer of this profile is chiefly dry loose sand (Alhasen et al., 2010). The bearing capacity of

this layer to a depth of 3m is not sufficient enough for road construction and therefore should be ripped off. The

second layer of the Southwest – Northeast section has a Vp range of 378 m/s – 2,524 m/s and a thickness range

of 6.2 m to 13 m. It is adjudged to be more compacted and consolidated than the overlying layer because of the

obvious velocity increase.

Fig. 15: P-wave velocity variation with depth: AA’ Geoseismic Pseudosection of the study area

Intergrated Geophysical Studies Over Parts of Central Cross River State for the Determination of…

DOI: 10.9790/0990-03424964 www.iosrjournals.org 63 | Page

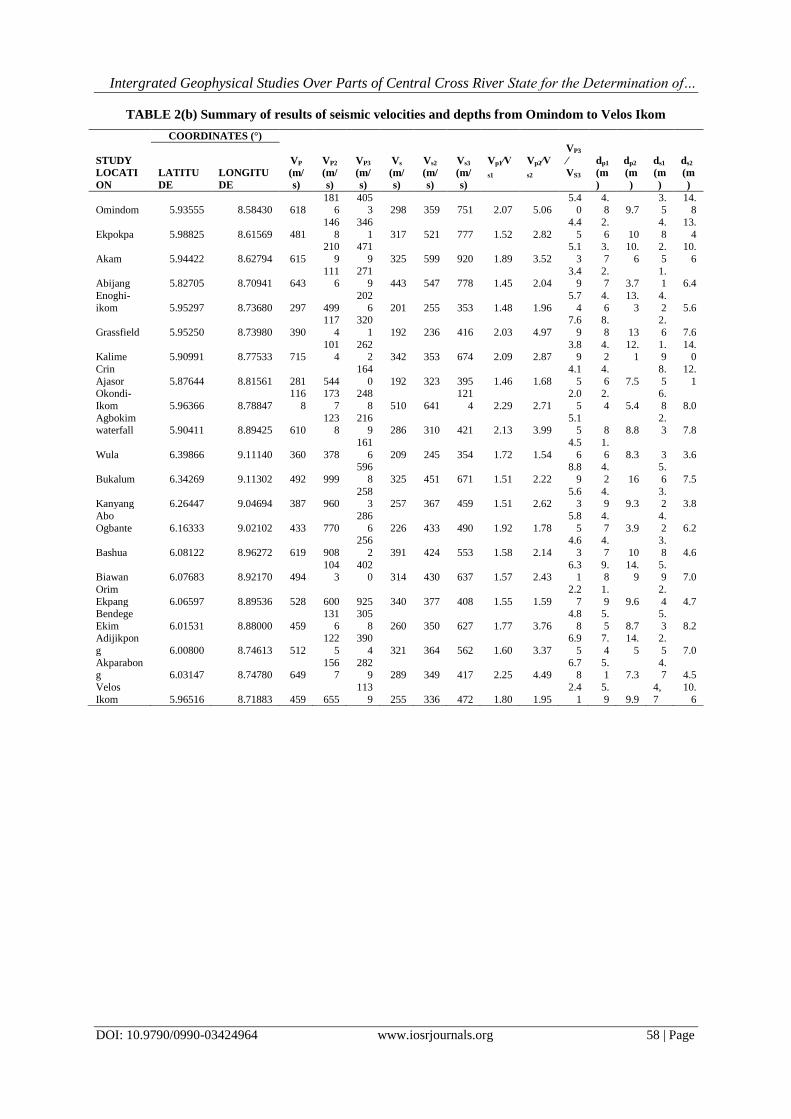
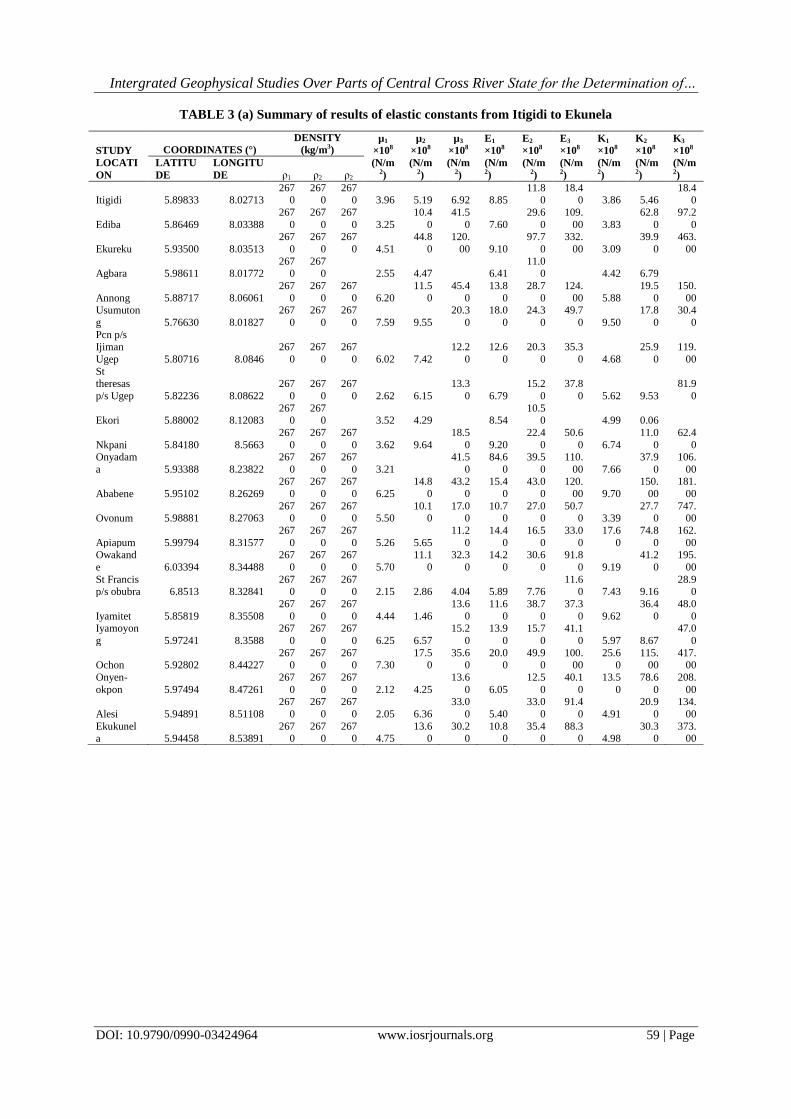
Generally the elastic constants varied very widely and anomalously. The shear modulus, μ, varied from

0.98 GPa to 120.00 GPa, while the bulk modulus varied from 0.06 GPa to 935.00 GPa. Also the Young’s

modulus varied from 2.09 GPa to 332.00 GPa. These variations defied the normal cause of hierarchy of values

of elastic constants in many places, thus suggesting geologic environment with surfaces that are undulating,

without clear-cut natural geologic boundaries, whose velocities might slowly vary both laterally and

horizontally. These places with anomalous variations could account for the numerous failed roads in those areas.

However, the Vp/Vs ratio for all the sites registered values that are greater than 1.5, which is generally indicative

of porous or fractured rocks partially or fully saturated with fluid.

VI. Conclusion

Interpretation of the geoelectric sounding data showed characteristic curves with two to six geoelectric

layers. The KH, HKH and HK curve types dominated the area with a prevailing frequencies of 23.7%, 16.96%

and 11.86%. Evaluation of the reflection coefficient and resistivity contrast revealed that VES stations 6, 12, 26,

29, 36, 37, 45, 46, 47 and 60 might be areas with high density water fractures because their reflection

coefficients and resistivity contrasts were not less than 0.9 and 19, respectively. There is a variation in the depth

to water table in the study area. The trend of the variation is from Northeast to Southwest, with range of values

of 10-50 m and 60-110 m, respectively.

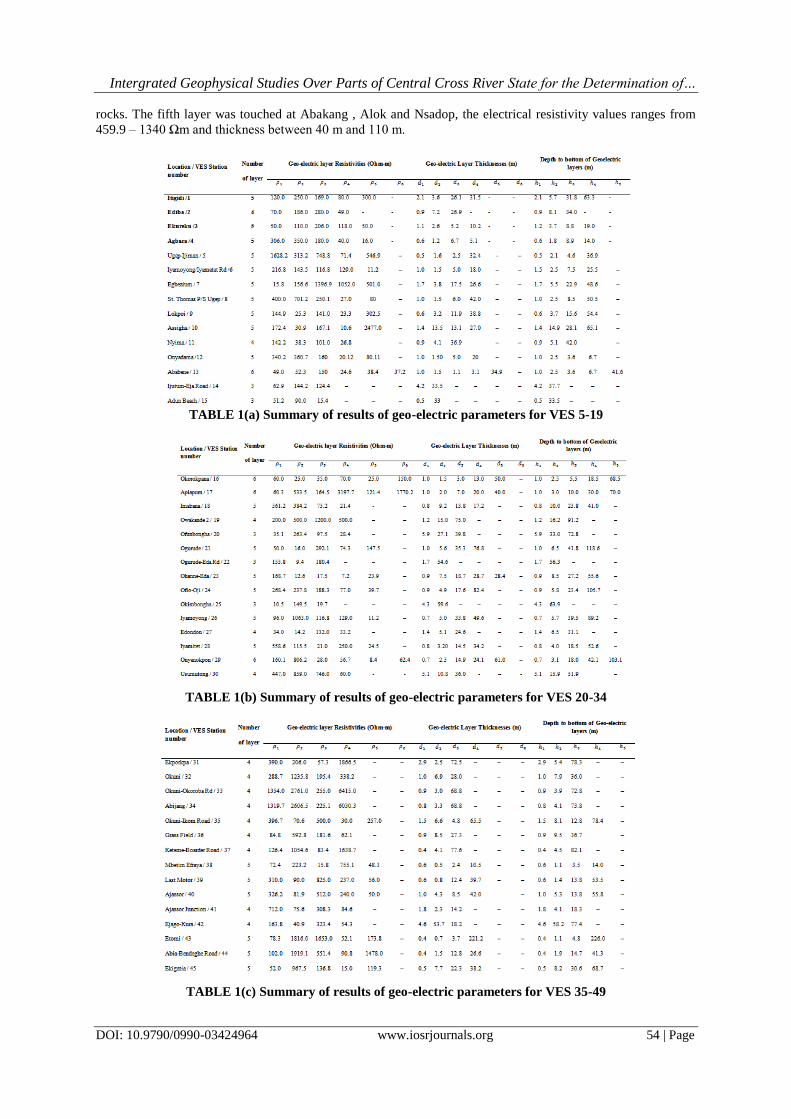
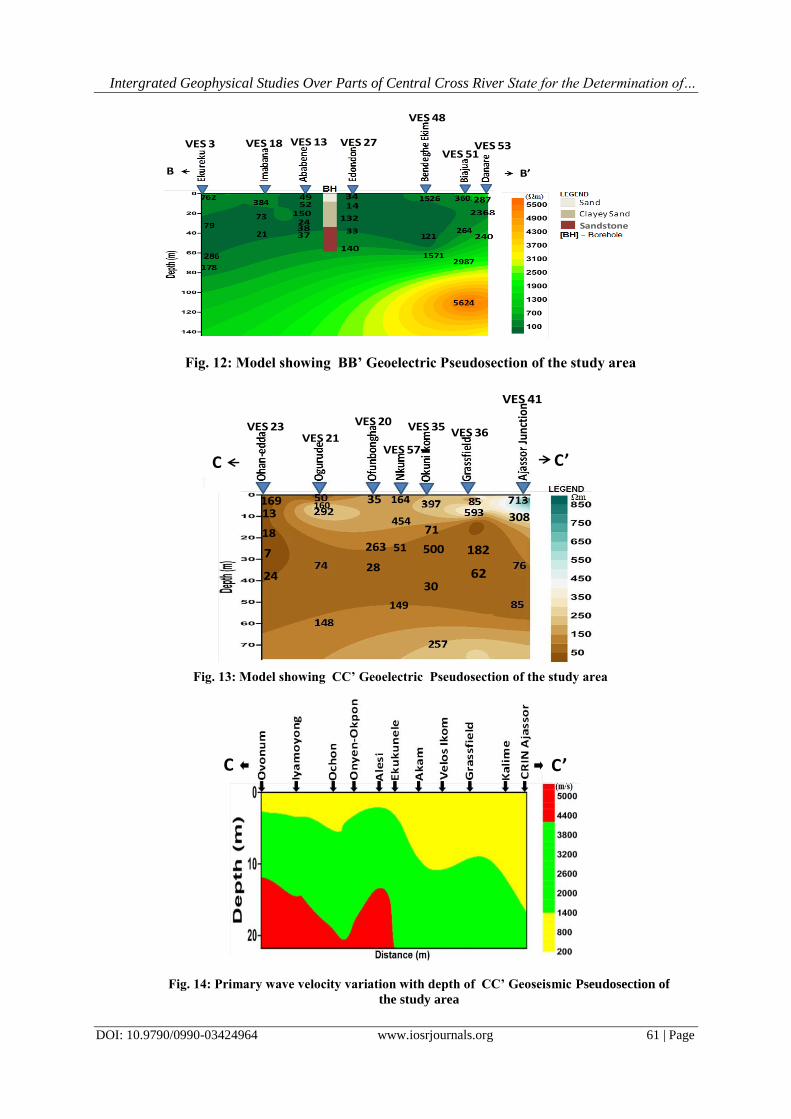
Six geoelectric layers were obtained from the interpretation of the sounding data. The electrical

resistivity of the first layer was between 100 Ωm and 2,115 Ωm which was indicative of clay/shale/sandy silt.

The second layer resistivity was between 9.4 Ωm and 4,317.0 Ωm. This was inferred to be shalestone/shale. It

was underlain by the third layer which had a resistivity range of 100-5422 Ωm, inferred as sandstone. The

materials of this layer is indicative of an aquifer. The fourth layer had resistivity values that range from 10.6 Ωm

to 6,415.0 Ωm. The fifth layer resistivity values were between 8.4 and 3,511.2 Ωm, while the last layer had

resistivity values between 10.0 Ωm and 6,103.0 Ωm.

The productive shallow aquifer terrains in the study area according to borehole lithologic logs are made

up of fine sands and sandstones with resistivity ranges of 100-500 Ωm and depth of 60 m. These shallow

terrains are horizontally aligned in the study area. The deep aquifer terrains which consist of coarse grained

sands and fractured basement, had resistivity range of 1000-2,500 Ωm and a depth from surface to bottom of

about 150 m. The area has been identified to have confined aquifer terrain due to the confining clay layer which

is of large vertical extent in the adjacent layers that enclosed the aquifer.

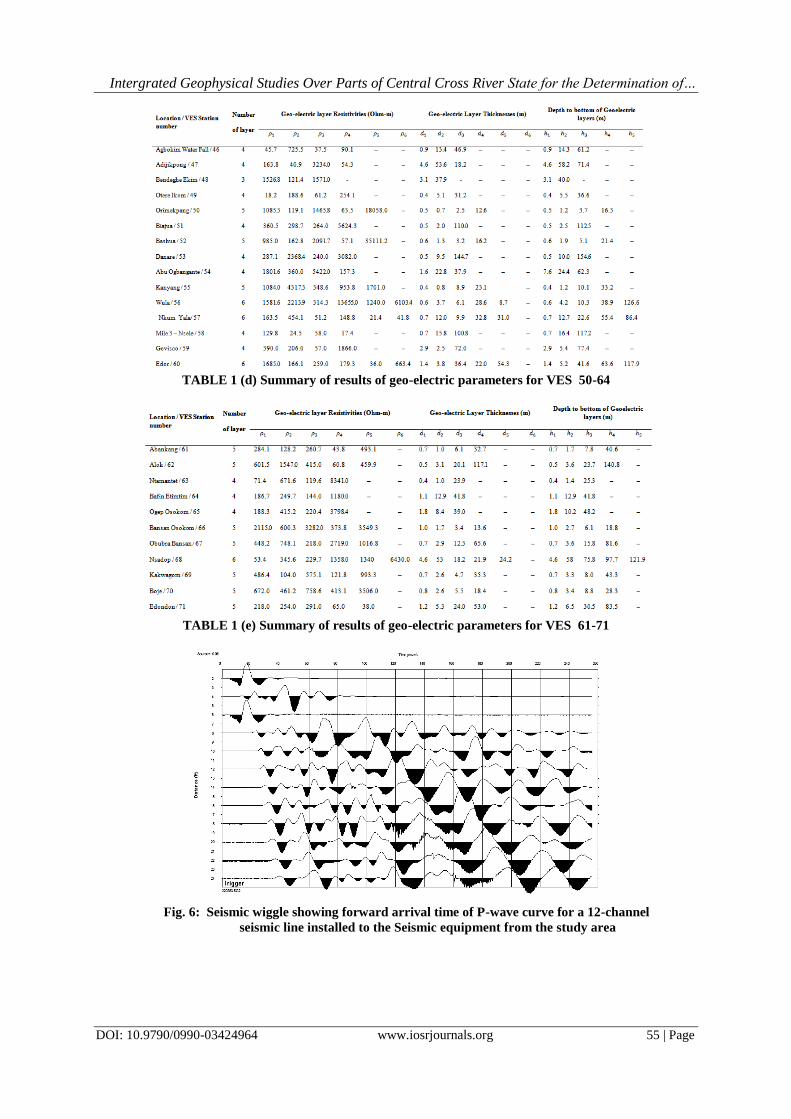
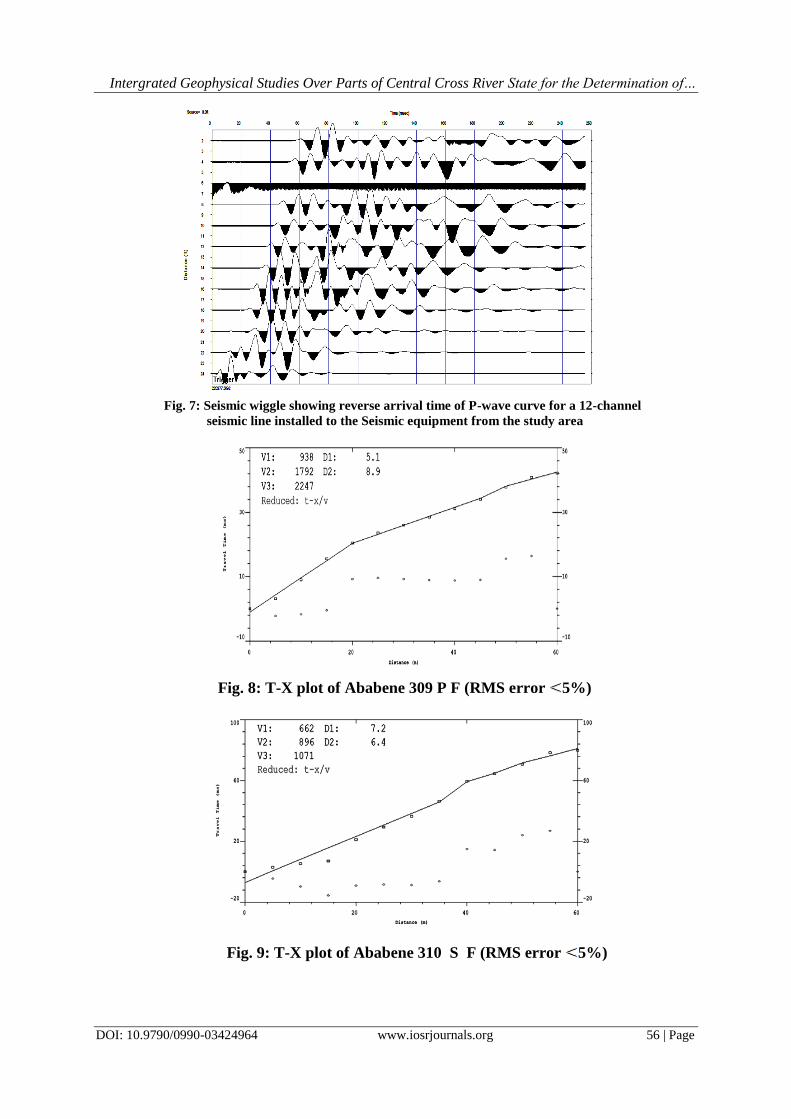
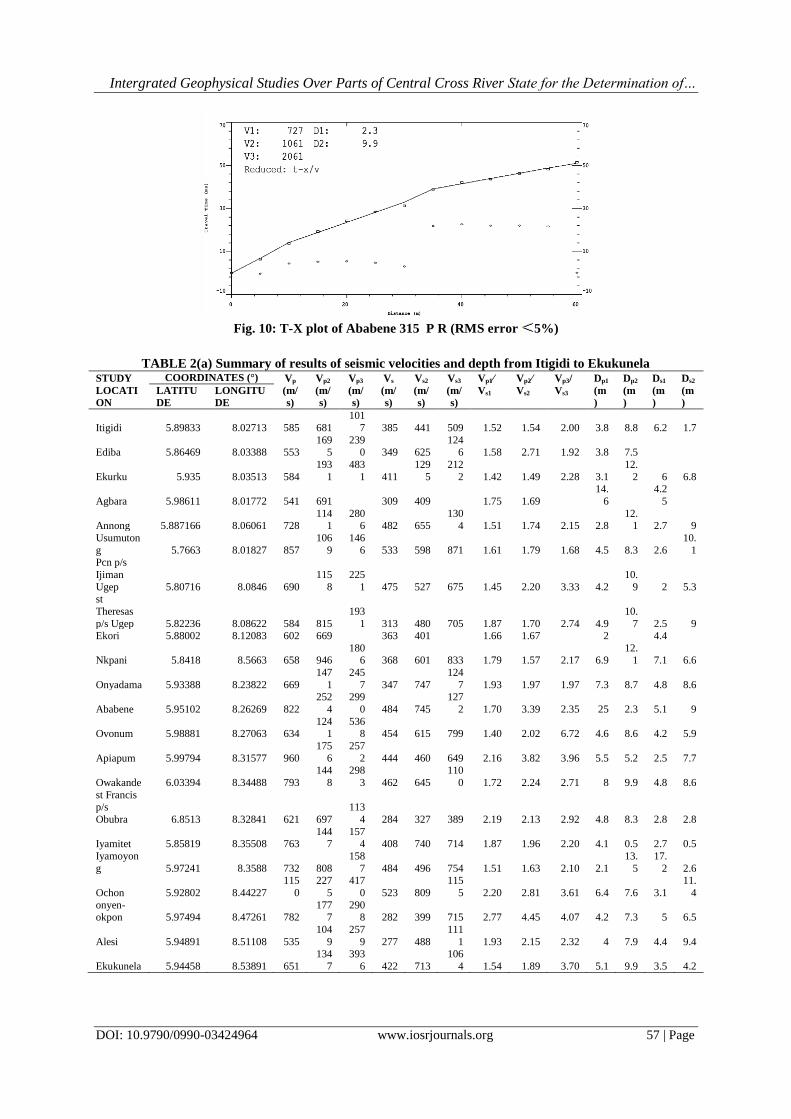
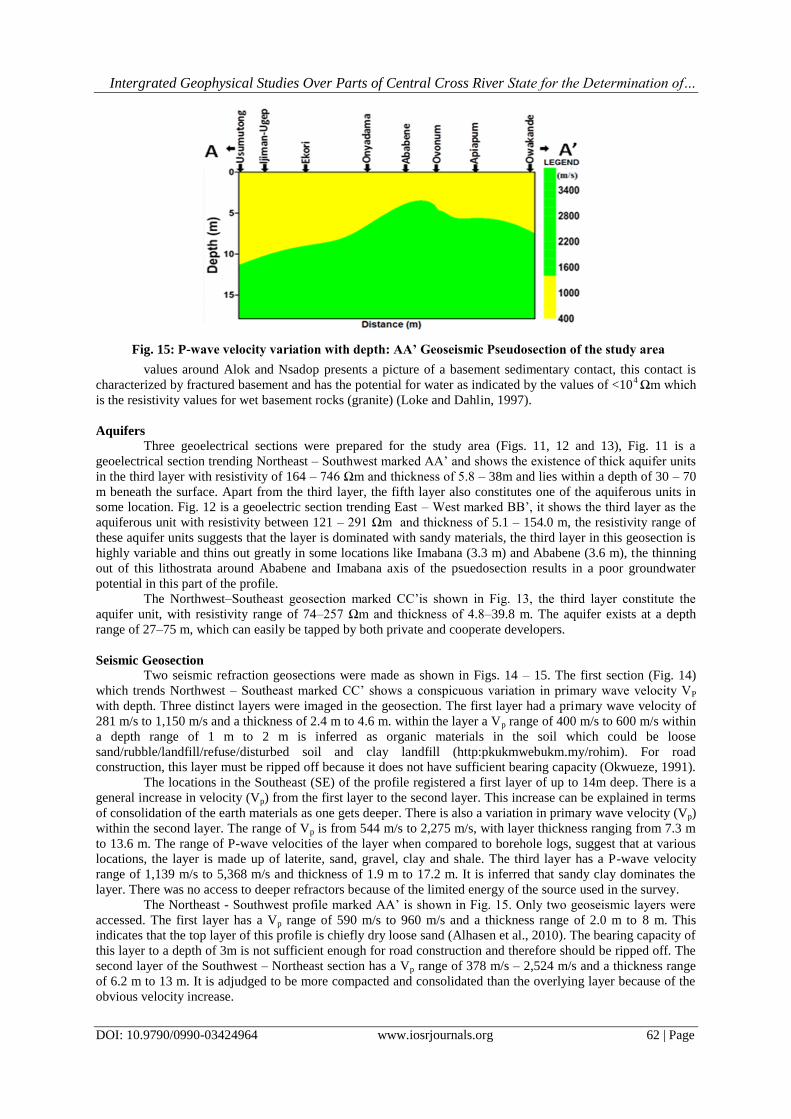
Analysis of the seismic refraction data revealed two to three geoseismic layers. The first layer had

velocities values that are from 602 m/s to 960 m/s and depth values ranging from 1.5 to 8.0 m, which is

indicative of sand (dry)/top soil/clay, when compared to nearby borehole data. The second layer had velocities

of 378 m/s to 2,474 m/s and refractor depth that range from 1.3 m to 13.0 m. This layer is inferred to composed

of clay/sand(water saturated, loose)/sand and gravel near surface based on nearby borehole logs. The third layer

had velocity range of 1,587 m/s to 5,368 m/s, suspected to be weathered basement.

The elastic constants varied wildly and anomalously from site to site and from layer to layer, which is

an indication of both lateral and vertical inhomogeneity. Some of the survey sites recorded high values of elastic

constants especially bulk modulus and shear modulus . Rocks from such sites will not deform under elevated

load. They provide foundation for durable roads. However, those sites with comparatively low elastic constants

are vulnerable to road failures and as such should be excavated or treated before constructing civil engineering

works. The S-wave velocity depends mainly on the properties of the rock matrix and is nearly independent of

the pore fill whereas P-wave velocity depends on both matrix and pore fill Kirsch, 2009). Hence, the high values

(> 1.5) of the ratio of Vp to Vs indicates that the soils and rocks have pores and fractures that are partially or

fully filled with water.

References [1]. Akpan, A. E. Ugbaja, A. N., George, N. J. (2013). Integrated Geophysical, Geochemical and hydrogeological investigation of

shallow ground water resources in parts of the Ikom-Mamfe Embayment and the adjourning in Cross River State, Nigeria. Environ.

Earth Sci. Doi:10/1007/s12665-013-2232-3. [2]. Alhassan, D. U., Dangana, L. M. Salako, K. A. Jonah, S. A. & Ofor, N. P. (2010). Seismic Refraction investigation of the

subsurface structure at the Southern part of Niger State, College of Education, Minna, Bayero Journal of Pure and Applied

Sciences., 3(2), 56-61. [3]. Ayolabi, E. A. (2004). Seismic refraction survey of University of Lagos, Nigeria and its implication. Journal of Applied Sciences, 7

(3), 4319-4327.

[4]. Ayolabi, E. A., Adeoti, L. Oshinlaja, N. A. Adeosun, I. O., & Idowu, O. I. (2008). Journal of Science Research and development 2008/2009, 11, 42-61.

[5]. Benkhelil, M. G., Ponsard, J. F. Saugy, L. (1975). The Bornu-Benue Trough, The Niger Delta and its offshore Tectono-sedimentary

reconstruction during the cretaceous and Tertiary from geophysical and geology. In: Kogbe CA (ed) Geology of Nigeria. Elizabethan Press, Lagos. pp.277-309.

[6]. Bernard, J. (2003). Short notes on depth of investigation of electrical methods. www.iris-instruments.com

Intergrated Geophysical Studies Over Parts of Central Cross River State for the Determination of…

DOI: 10.9790/0990-03424964 www.iosrjournals.org 64 | Page

[7]. Bhathacharya, P. K., Patra, H. P. (1986). Direct current geoelectric sounding: principles and interpretation. Elsevier Science

Publishing Co. Inc., Amsterdam.

[8]. Burton, A. N. (1976). The use of geophysical methods in Engineering Geology, Part 1: Seismic Techniques. Ground Engineering. [9]. Chakravarthi, V. Shankar, GBK., Muralikharan, D., Harinarayana, T., Sundarajan, N. (2007). An integrated geophysical approach

to imaging subbasal Sedimentary Basin: case study of Jam River Basin, India: Geophysics, 72(6):B141-B147.

doi:10.1190/12777004. [10]. Cross River Basin Development Authority (CRBDA) (1982). Inventory of Natural Site conditions, soils slopes, hydrology, landuse

and vegetation throughout the area of operation of the authority. Technical report 4.

[11]. Drake, C. L. (1962). Geophysics and Engineering, Geophysics 27, 193-197. [12]. Early, K. R. and Dyer, K. R. (1964). The use of resistivity survey in foundation site underlain by Karst dolomite, Geotechnique 14,

341-348.

[13]. Edet, A. E., Nganje, T. N., Ukpong, A. J. Ekwere, A. S. (2011). Groundwater chemistry and quality of Nigeria: A Status Review. African Journal of Environmental Science and Technology. 5(13):1152-1169, DOi:10.5897/AJESTX11.011.

[14]. Eseme, E., Agyingi, C. M., Foba-Tendo, J. (2002). Geochemistry and genesis of brime emanation from cretaceous strata of the

Mamfe Basin, Cameroun, J. Afri. Earth Sc. 35, 467-4776 doi:10/1016/50899-55362(2)00171-9. [15]. Geosoft W., (2001). Seismic Refraction processing software for Windows, Instruction manual, Geosoft Geological and geophysical

Software. Geneva: Lully.

[16]. Http://pkukmwebukm.my/rohim [17]. Keary, P. & Brooks, M. (1984). An introduction to geophysical exploration. Blackwell Scientific publication, Oxford, pp. 198-217.

[18]. Kirsch, R. (2009). Groundwater geophysics – a tool for hydrology. Springer – Verlag, Berlin, pp. 548.

[19]. Kurtenacker, K. S. (1934). Some practical application of resistivity measurement to highway problem. Transaction of American Institute of Mining and Metallurgical Engineers, 110, 193-205.

[20]. Loke, M. H. & Dahlin, T. (1997). A combined Gauss-Newton and Quasi-Newton inversion method for the interpretation of

apparent resistivity pseudosections. Procedures of 3rd meeting of the European Association of Environmental and Engineering Geophysics, 8-11 September, 1997, Aarhus, Denmark, 139-142.

[21]. Loke, M. H. (2001). RES ID version 1.0 for Windows 95/98/ME/2000/NT, I-D Resistivity. IP and SP inversion and forward

modeling for Wenner and Shlumberger arrays. [22]. Martinez, A. G., Takahashi, K. Nunez, E. Silva, Y, Trasmonte, G. Mosquera, K. Lagos, P. (2008). A multi-institutional and

interdisciplinary approach to the assessment of vulnerability and adaptation to climate change in the Peruvian Central Andes:

Problems and prospects. Adv. Geosci. J. 14, 257-260. [23]. Nigeria Geological Survey Agency (NGSA) (2006). Geological and mineral resources map of Cross River State, Nigeria.

[24]. Nunn, K. R. (1979). Geophysical survey at two landfill sites in the west midlands. Symposium on the engineering behaviour of

industrial and urban hill. [25]. Odigi, M. I., Amajor, L. C. (2009). Geochemical characterization of cretaceous sandstones from the southern Benue Trough,

Nigeria. Chin. J. GEochem. 28, 044-054. Doi:10.1007/s11631-009-00447.

[26]. Odoh, B. I. (2010). Surface-outcrop characterization for fracture flow of groundwater: case study of ABakaliki Basin, Ebonyi State, Nigeria. Int. Arch. Appl. Sci. Technol. 1(1):45-53.

[27]. Offodile, M. E. (1975). A review of the geology and cretaceous of the Benue valley. In Kogbe CA (ed) Geology of Nigeria;

Elizabethan Press Lagos, pp.375-376.

[28]. Okwueze E. E. (1991). Shear wave observation in seismic refraction prospecting. Journal of mining and Geology, 24(1&2).

[29]. Olorunfemi, M. O. and Meshida, E. A. (1987). Engineering Geophysics and its application in Engineering site investigations (Case study from Ile-Ife area). The Nigerian Engineer. 22, 57-66.

[30]. Orellana, E., and Mooney, H. (1966). Master tables and curves for vertical electrical soundings over layered structures of Madrid,

Interciencia: India. [31]. Petters, S. W. (1989). A regional hydrogeological study of rural water supply options for planning and implementation of phase II

rural water programme in Cross River State. Unpublished Technical report submitted to DIFFRI, Cross River State.

[32]. Petters, S. W., Okereke, C. S., Nwajide, C. S. (1987). Geology of the Mamfe Rift, south eastern Nigeria. In Mathesis, G. Shandemerer J. (eds) Current research in African Earth Sciences, Balkema Rotterda. pp. 299-302.

[33]. Rapti-Caputo, D. (2010). Influence of climate change and human activities on the salinization process of coaster aquifer systems.

Italan J. Agron. 5(3), 67-79. [34]. Riddel, E. S. Lorentz, S. A., Kotze, D. C. (2010). A geophysical analysis of hydro-geomorphic controls within a headwater wetland

in a granitic landscape, through ERI and IP. J. HYdrol Earth Sci.14:1697-1713. doi:10.5194/hess-14-1697-2010.

[35]. Roy, A. & Apparao, A. (1971). Depth of investigation in direct current methods. Geophysics, 36(5), 943-959. [36]. Telford, W. W., Geldart, L. P. Sheriff, R. E., and Keys, D. A. (1990). Applied Geophysics. New York: Cambridge University Press.

[37]. Vender Velpa, BPA. (1988). A computer processing package for DC Resistivity interpretation for IBM compatibles, ITC Journal 4,

The Netherlands. [38]. Wagner, G., Zechauser, R. J. (2011). Climate policy: hard problem, soft thinking, Climate Change. doi:10.1007/s1054-011-0067-z.

[39]. Zohdy, A. A. R., Eaton, G.P & Mabey, D. R. (1980). Application of surface geophysics to groundwater investigations. U.S.

Government printing office: Washington D.C.


Recommended