Prepared for DuPont Corporate Remediation Group Wilmington, Delaware INTERIM REMEDIAL MEASURE WORK PLAN FOR GROUNDWATER NEAR WELL 128 POMPTON LAKES WORKS POMPTON LAKES, NEW JERSEY Prepared by 130 Research Lane, Suite 2 Guelph. Ontario N1G 5G3 Telephone: 519.822.2230 Project Number TR0352 November 9, 2010
Transcript
Prepared for
DuPont Corporate Remediation Group Wilmington, Delaware
INTERIM REMEDIAL MEASURE WORK PLAN FOR GROUNDWATER
NEAR WELL 128 POMPTON LAKES WORKS
POMPTON LAKES, NEW JERSEY
Prepared by
130 Research Lane, Suite 2
Guelph. Ontario N1G 5G3 Telephone: 519.822.2230
Project Number TR0352
November 9, 2010
TR0352 2010.11.09 128 IM Work Plan 2010.11.09.docx
i
TABLE OF CONTENTS
1. INTRODUCTION .....................................................................................................................1 1.1 Site Conditions ..................................................................................................................2
1.1.1 Site Hydrogeology ................................................................................................3 1.1.2 Groundwater Chemistry ........................................................................................3
2.8.1 Finalize Operating Conditions for the IRM ........................................................11 2.8.2 Baseline Sampling Event ....................................................................................11 2.8.3 Amend with Selected EAB Substrate .................................................................11 2.8.4 Operate Extraction Well to Induce Hydraulic Gradient .....................................12 2.8.5 Operation, Monitoring and Reporting.................................................................13
2.9 Health and Safety ............................................................................................................14 2.10 Waste Management .........................................................................................................14
TR0352 2010.11.09 128 IM Work Plan 2010.11.09.docx
ii
LIST OF TABLES Table 1: Summary of Hydraulic Assessment Testing Table 2: Summary of Field and Laboratory Analyses Table 3: Proposed Well Configuration
LIST OF FIGURES Figure 1: Site Location Map Figure 2: Proposed Interim Measure Layout Figure 3: Generic Well Detail for Extraction and Injection Wells Figure 4: Generic Well Detail for Multilevel Wells
APPENDICES Appendix A: Summary of Groundwater VOC Results from 128 IRM Characterization
TR0352 2010.11.09 128 IM Work Plan 2010.11.09.docx
iii
LIST OF ABBREVIATIONS cis-DCE cis-1,2-dichloroethene CGMP Comprehensive Groundwater Monitoring Program CMT continuous multichannel tubing CT carbon tetrachloride 1,1-DCA 1,1-dichloroethane 1,2-DCA 1,2-dichloroethane 1,1-DCE 1,1-dichloroethene Dhc Dehalococcoides DHGs dissolved hydrocarbon gases (i.e., ethane, ethane, methane) DO dissolved oxygen DuPont DuPont Corporate Remediation Group EAB Enhanced Anaerobic Bioremediation EVO emulsified vegetable oil ft feet ft bgs feet below ground surface Geosyntec Geosyntec Consultants, Inc. HASP health and safety plan IRM/FPS Interim Remedial Measure / Field Pilot Study IRMWP Interim Remedial Measure Work Plan ISCO in situ chemical oxidation mg/L milligrams per liter ML multilevel monitoring well NELAP National Environmental Laboratory Accreditation Program ORP oxidation reduction potential Parsons Parsons Corporation PCE tetrachloroethene PLW Pompton Lakes Works qPCR quantitative polymerase chain reaction SiREM SiREM Laboratory Site Pompton Lakes Works, Pompton Lakes, New Jersey SGP soil gas probe TCA 1,1,1-trichloroethane TCE trichloroethene TOC total organic carbon trans-DCE trans-1,2-dichloroethene TTA target treatment area UIC underground injection control VC vinyl chloride VFA volatile fatty acid VOC volatile organic compound
TR0352 2010.11.09 128 IM Work Plan 2010.11.09.docx
1
1. INTRODUCTION
This interim remedial measure work plan (IRMWP) has been prepared by Geosyntec Consultants, Inc. (Geosyntec) for the DuPont Corporate Remediation Group (DuPont). It presents the proposed approach to conducting an Interim Remedial Measure/Field Pilot Study (IRM/FPS) at the former E. I. du Pont de Nemours and Company (DuPont) Pompton Lakes Works (PLW) site (the Site) to address elevated chlorinated volatile organic compound (VOC) concentrations in off-site groundwater. The location of the Site is presented in Figure 1.
The IRM will be conducted in the vicinity of well 128, in a portion of the off-site plume. Since the prevailing geochemical conditions at depth are generally reducing and the distribution of VOCs (predominantly partially dechlorinated) suggests some native microbial activity, the preferred technology for the IRM is Enhanced Anaerobic Bioremediation (EAB). However, the implementation sequence is such that In Situ Chemical Oxidation (ISCO) may be selected for the active remediation phase. The first steps of the IRM design will be to confirm the effects that conductivity and permeability may have on an injection-based remedial approach, as this will directly impact the implementability of a selected remedial technology.
Given the current understanding of site conditions and the site constraints (limited street access and residential zone) it was proposed that a groundwater extraction and re-injection loop be installed on Barbara Drive to further assess the ability to extract, inject and control amendment additions so that larger scale design information can be obtained. The proposed layout of the IRM is presented in Figure 2. Depending on the results of the hydraulic testing, recirculation between extraction and injection wells may be included as part of the IRM. This recirculation component would only be included so that the effects of amendment addition (e.g., electron donor) can be observed within a reasonable time frame and should not be considered as a necessary component of future activities.
Successful application of either remedial technology in the off-site plume is contingent upon achieving delivery of reagent chemicals throughout the treatment zone. Hence, understanding the aquifer hydraulic properties is key to designing the IRM and interpreting the resulting data.
The EAB technology consists of in situ treatment of contaminated groundwater through EAB, which relies on anaerobic reductive dechlorination, a metabolic process in which bacteria gain energy and grow as one or more chlorine atoms on a chlorinated hydrocarbon are replaced with hydrogen. Certain bacterial species are known to use the VOCs metabolically, but only Dehalococcoides (Dhc) species are known to convert them completely to ethene and/or ethane. Chloride is produced in a sequence of successive dechlorination steps. Other bacteria, such as sulfate-reducing bacteria are known to dechlorinate certain VOCs in cometabolic processes, which although generally slower may contribute to the overall removal.
TR0352 2010.11.09 128 IM Work Plan 2010.11.09.docx
2
Treatment by EAB consists of introduction of an amendment to enhance and/or promote reductive dechlorination of the VOCs. The amendment will consist of an electron donor, an organic carbon compound that undergoes oxidation as the microbes utilize the substrate to cause reduction of the target VOCs. The amendment will also include a consortium of bacterial cultures to ensure that the chlorinated ethenes are completely and rapidly degraded to ethane, ensuring that the system does not stall at the lesser-chlorinated species cis-1,2-dichloroethene (cis-DCE) and vinyl chloride (VC).
The remainder of this introductory section presents the site conditions (Section 1.1), objectives of the IRM (Section 1.2), and a summary of the implementation steps (Section 1.3). The rest of this report describes implementation of the IRM, including an overview (Section 2.1), permitting (Section 2.2), extraction and injection well installation (Section 2.3), multilevel well and soil gas probe installation (Section 2.4), hydraulic assessments (Section 2.5), numerical simulation (Section 2.6), metric evaluation (Section 2.7), operation of the IRM (Section 2.8), health and safety (Section 2.9) and waste management (Section 2.10). References cited are listed at the end (Section 3).
1.1 Site Conditions
The Remedial Technology Evaluation for Off-Site Groundwater Contamination (Parsons Corporation [Parsons], 2010) and the Characterization Work-Plan for Off-Site Groundwater (Geosyntec, 2010a) describes the geology, hydrogeology, and distribution of contaminants at the Site.
The Facility is situated within the Highlands Physiographic Province adjacent to the northwestern boundary of the Newark Basin. Two primary geologic units, crystalline bedrock and alluvial deposits consisting of colluviums and stratified glacial drift, underlie the Site.
The alluvial deposits in the Acid Brook Valley are up to 170 feet (ft) thick and have been described as a fining downward stratified glacial sequence without distinct lithologic contacts. It has been divided into three zones in past reports, termed shallow, intermediate and deep.
The shallow alluvial zone is composed of colluvium, fill and glacial till deposits, which are generally poorly sorted coarse- to medium-grained sand and gravel, and may contain layers of very coarse gravel. This zone ranges from 5 to 20 ft thick. The existing shallow monitoring wells include 20 ft screens that span the shallow alluvium.
The intermediate alluvial zone consists of glacial fluvial deposits, which are generally very fine- to medium-grained sand, and ranges from 15 to 80 ft thick.
TR0352 2010.11.09 128 IM Work Plan 2010.11.09.docx
3
The deep alluvial zone consists of glacial lacustrine deposits, which are generally very fine-grained silty sand and very fine-grained sandy silt. The thickness of the deep zone varies widely and may be up to 90 ft thick where the bedrock surface is structurally low.
The Off-Site Groundwater IRM Characterization Report (Geosyntec 2010b) contains a summary of the lithology in the vicinity of well 128. In general, the upper 20 ft of alluvium consists of light olive brown, generally poorly sorted sand. This is underlain by an olive brown poorly to moderately well sorted sand between 20 and 38 feet below ground surface (ft bgs). Together these sands comprise the shallow zone; well 128-S is screened across this zone, from about 7 to 27 ft bgs. The intermediate zone at this location spans the interval from about 38 ft bgs to about 78 ft bgs and is composed of olive and dark gray, moderately well-sorted sand containing silt layers. In the upper portion of this interval (approximately 38 to 48 ft bgs), the sands are gray-brown and poorly sorted. Well 128-I is screened in the lower portion of the intermediate zone, from 62 to 72 ft bgs. The deep zone at this location is below about 78 ft bgs and composed of dark gray-brown silt with some clay and dark brown interbeds; well 128-D is screened from 126 to 146 ft bgs.
1.1.1 Site Hydrogeology
Water depths in wells in the Acid Brook Valley at Facility range from approximately 3 to 25 ft bgs under natural conditions. The saturated thickness of the alluvial aquifer ranges from approximately 5 ft in the northern operating valley to 165 ft near the Pompton Lake shore. At location 128-I, the depth to water is approximately 10 ft bgs. The alluvial deposits appear to respond to pumping as a single unit aquifer system. The pump-and-treat system is currently operating to prevent off-site migration of VOCs. Therefore, the pattern of groundwater flow on-site indicates a south to southeasterly flow with cones of depression locally at the recovery wells and water table mounds at the injection beds.
1.1.2 Groundwater Chemistry
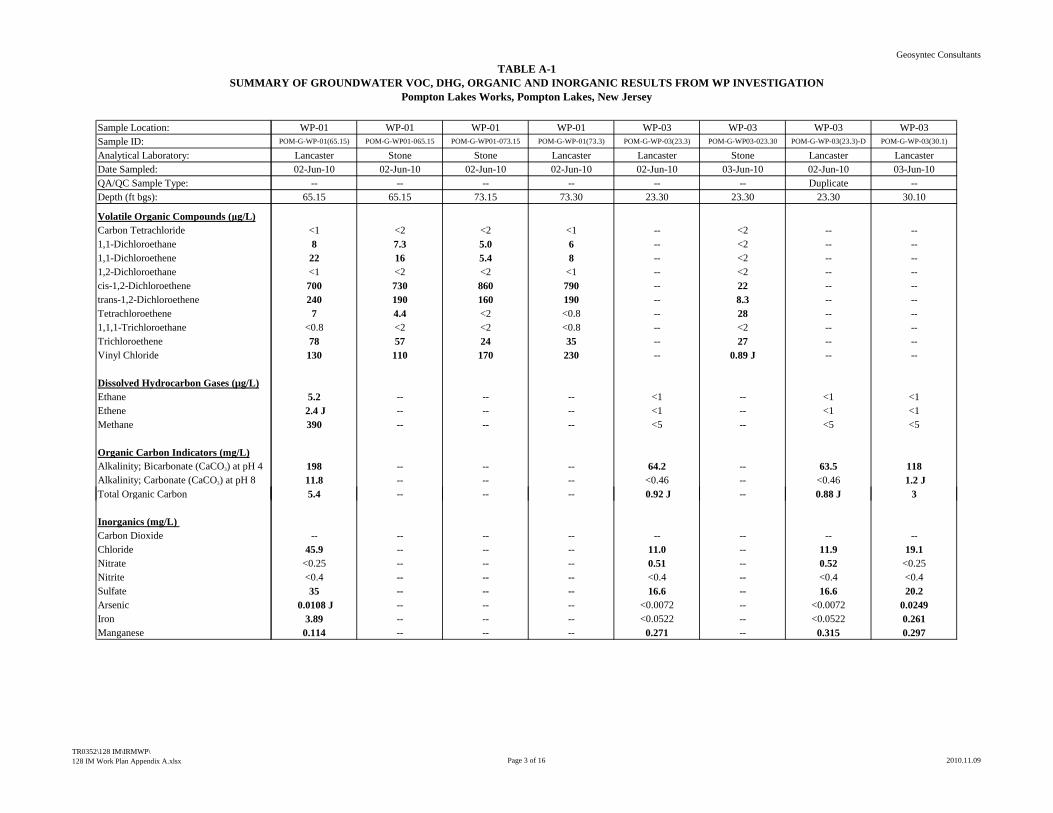
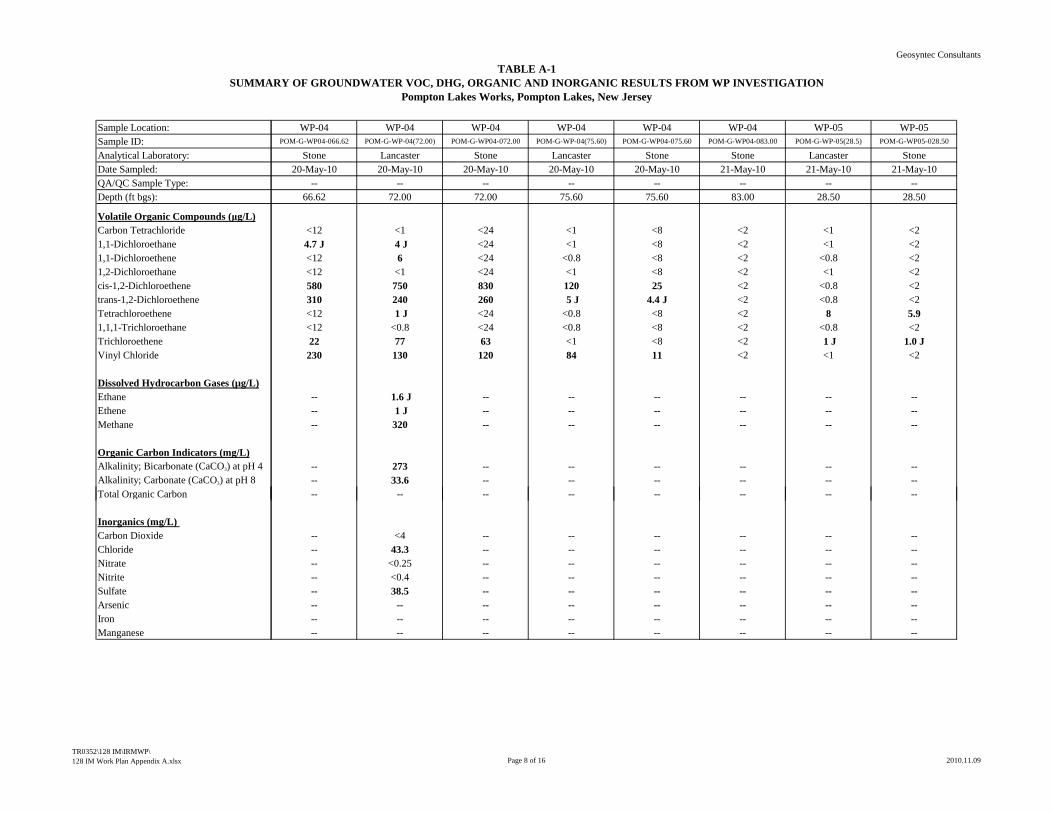
Site investigations have shown that there is VOC-impacted groundwater both on- and off-site at the Facility (Parsons, 2010). As stated in the Comprehensive Groundwater Monitoring Program (CGMP), the following contaminants are regularly monitored: tetrachloroethene (PCE), trichloroethene (TCE), 1,1,1-trichloroethane (TCA) 1,1-dichloroethane (1,1-DCA), 1,2-dichloroethane (1,2-DCA), 1,1-dichloroethene (1,1-DCE), cDCE, trans-1,2-dichloroethene (trans-DCE), carbon tetrachloride (CT) and VC. As outlined in the 2009 annual report, many of these contaminants (PCE, TCE, 1,2-DCA, 1,2-DCA, 1,1-DCE, cis-DCE, trans-DCE and VC) are above the New Jersey standard for Class IIA (GWIIA) in wells 128, 128-I and 128-D. The Off-Site Groundwater IRM Characterization Report (Geosyntec, 2010b) presented the findings of the detailed characterization of the 128 area and confirmed that the highest concentrations of VOCs
TR0352 2010.11.09 128 IM Work Plan 2010.11.09.docx
4
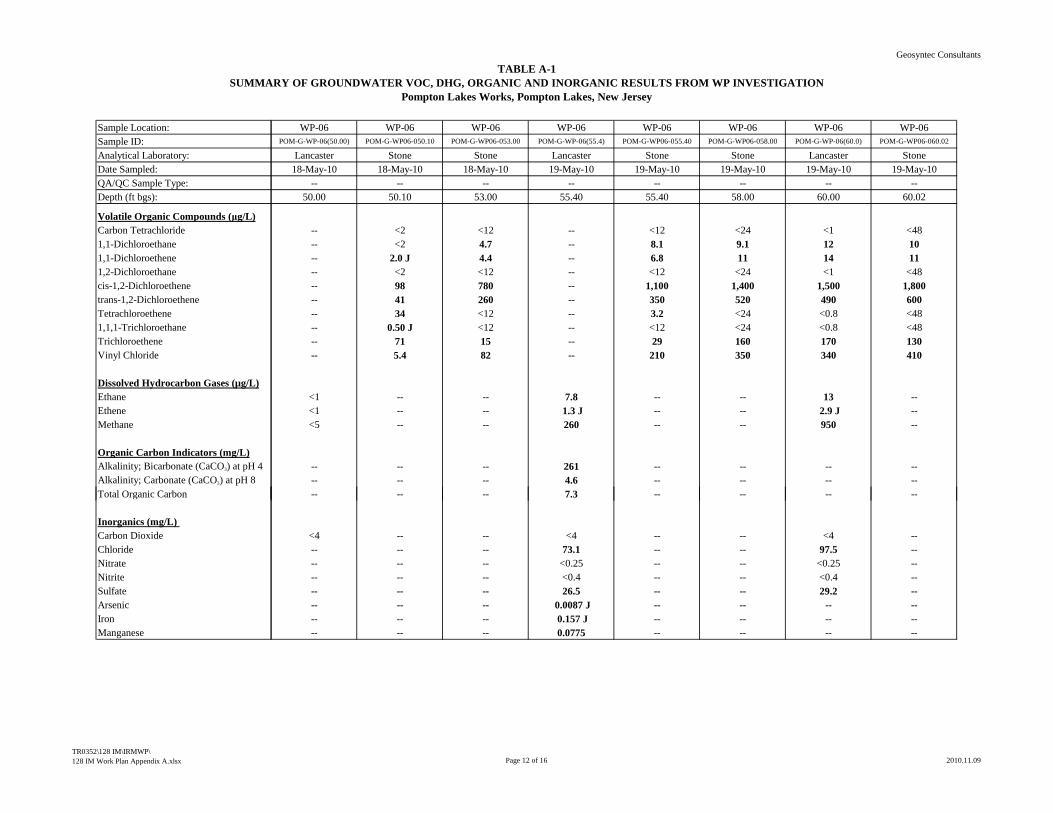
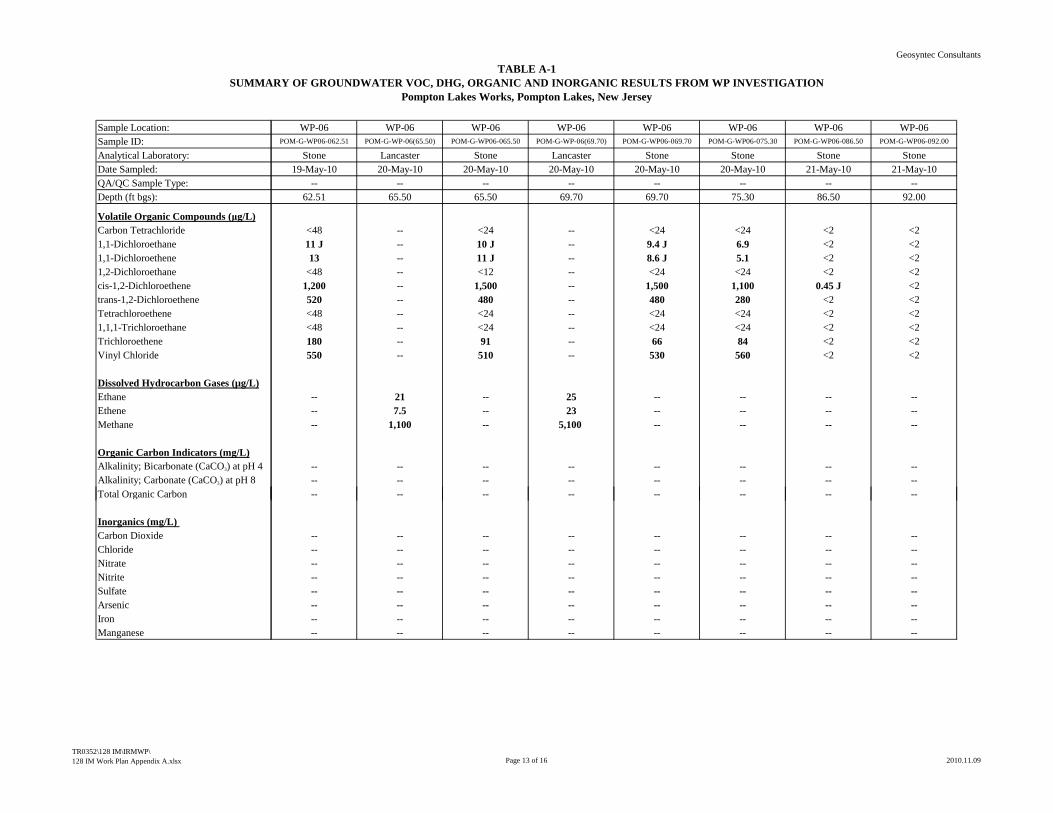
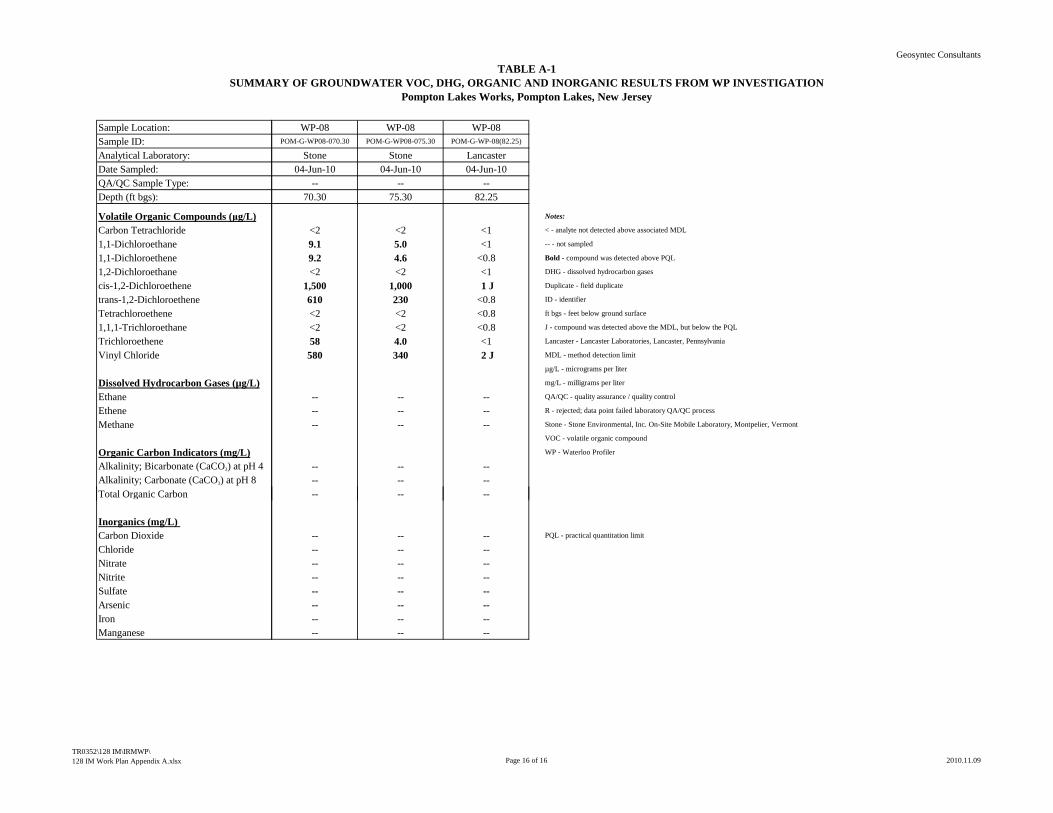
are present in the intermediate zone. A summary of the target VOC concentrations reported from the recent IRM Characterization activities is provided in Table A-1 (Appendix A).
1.2 Objectives
The primary objectives of the proposed IRM are to:
• Conduct Site-specific tests of hydraulic conductivity and pumping rates to ensure delivery of amendments to the full thickness (approximately 40 ft) of the VOC-impacted zone that overlies the lower permeability glaciolacustrine soils (silt and silty fine sand).
• Remove VOC mass from within the target treatment area (TTA) for the IRM through addition of amendment (donor) and bacterial cultures.
• Collect design data for potential expansion of the treatment zone (e.g., flow rates, well spacing, operational periods, amendment concentration and re-amendment frequency, etc.).
1.3 Implementation Steps
Implementation of this IRM will proceed as follows:
• Slug tests to estimate well transmissivity / hydraulic conductivity at each well (distinguish by screen interval);
• Short term pump tests to further assess hydraulic conductivity and determine flow rates at each well (distinguish by screen interval);
• Hydraulic tomography; and
• Tracer tests.
TR0352 2010.11.09 128 IM Work Plan 2010.11.09.docx
5
4. Numerical simulation (groundwater model).
5. Evaluation Metric – decision based on projected delivery of amendments
• Select EAB substrate/donor and concentration for application.
6. Operate IRM
• Finalize operating conditions for the IRM;
• Install multilevel monitoring wells and soil gas probe;
• Sample to establish baseline conditions;
• Amend with selected EAB substrate (i.e., add electron donor);
• Semi-active operation of extraction well to induce hydraulic gradient; and
• Conduct 6 months of operation and monitoring with the option to extend another 6 months (total of 12 months) and reporting.
TR0352 2010.11.09 128 IM Work Plan 2010.11.09.docx
6
2. IMPLEMENTATION
2.1 Overview
The IRM will be conducted in the vicinity of well 128-I, south of the Facility at the corner of Barbara Drive and Schuyler Avenue (Figure 2). Wells will be installed during business hours (i.e., 8 AM to 5 PM). After the wells are installed hydraulic assessment will be completed. The field program will be conducted over a three to four week period, during standard business hours. The table below shows the anticipated schedule of field activities.
Task Q1 Q2 Q3 Q4 Q5 Q6 Q7 Permits & Well Install X
Hydraulic Assessment X X X
Evaluation X Supplemental Hydraulic Assessment E E
Evaluation/Finalize Donor Application* X X
Amend Donor** X X X X X X E E E E E E Evaluation X X X X X X E E E E E E Reporting X Notes: * Includes update with agencies on implementation design. ** Donor addition may be extended for up to 12 months, if required. E - extra field work in case additional evaluation is deemed necessary Q - quarter X - anticipated field work
2.2 Permits
Prior to performing field work to implement the IRM, all necessary permits will be obtained. This includes, but is not limited to, permits to perform work in city streets and rights-of-way, utility clearances, well construction permits, and a permit for groundwater re-injection (discharge to groundwater or underground injection control permits, as applicable).
2.3 Install Extraction and Injection Wells
A state-licensed driller will be retained to install one extraction well and three injection wells. These wells will be built with two separate screened intervals defining an upper and lower zone. The screened sections will be connected by a segment of blank casing, as shown in the generic well detail in Figure 3. This construction will allow the wells to operate either as nested wells with an upper and lower zone, or as single long-screened well. To isolate the upper and lower zones, an inflatable packer would be installed within the casing. This would allow independent
TR0352 2010.11.09 128 IM Work Plan 2010.11.09.docx
7
control of the groundwater extraction and re-injection rates in the upper and lower zones and ensure that amendments were delivered to the targeted interval of the aquifer. At this time addition of amendments will not be applied to the shallow water table (from about 10 to 25 ft bgs). If the addition of electron donor to the lower portions of the aquifer is successful and effective shallow injection wells could be installed and amendments added.
Each injection and extraction well will be constructed as depicted in Figure 3. Details of the construction, such as borehole diameter, casing diameter, screen slot size and filter pack grain size distribution will be selected for each well type. The wells will be installed directly above the glaciolacustrine silt that underlies the intermediate aquifer in this area of the Site. Each borehole will be advanced until the silt horizon is encountered, nominally to 80 ft bgs (the silt contact was observed in soil cores at 78 ft bgs at well 128-D; was estimated to occur at about 76 ft bgs and 75 ft bgs in WP-04 and WP-01, respectively, based on the index of hydraulic conductivity and the sample collection rate; but was not clearly observed to a depth of 79 ft bgs in soil boring DP-01). Each well will be built up from the depth of this contact, installing the lower screen at the base of the intermediate aquifer, directly above the silt.
2.4 Install Multilevel Monitoring Wells and Soil Gas Probe
Four multilevel monitoring wells (MLs) and a soil gas probe (SGP) will be installed to monitor the performance of the IRM. Approximate locations for these monitoring points are shown in Figure 2. Each ML will be constructed as depicted in Figure 4. Two MLs will be installed prior to hydraulic testing and two additional locations for MLs will be selected once operation of the IRM is simulated with the numerical model. MLs will be positioned at a suitable distance (and thus travel time) from the injection well array, so that IRM performance can be effectively monitored. The aim will be to have a transect of three MLs, forming a ‘fence’ downgradient of the injection wells to assess performance of plume treatment across a segment of the TTA. A fourth ML will be installed downgradient of the fence, roughly on the centerline of the TTA, to provide a sampling location at greater distance (and travel time) with which to assess rates of removal. Each ML will be completed with at least 7 discrete sampling depth intervals; three in the lower zone, three in the upper zone and one shallow zone above the target depth interval of the IRM. The MLs may be constructed as nested wells in which multiple small-diameter wells (0.5 to 1 inch diameter) are constructed within a single borehole, or using off-the-shelf multilevel technology such as continuous multichannel tubing (CMT – e.g., Solinst CMT Model 403) or the Waterloo Multichannel System.
An SGP will also be installed within the TTA, to assess the effects of groundwater treatment in the vadose zone. The SGP will be monitored for potential changes in VOC concentrations, if present, in the unsaturated soils overlying the TTA, as well as for potential production of byproducts of microbial activity, such as methane and hydrogen sulfide. The SGP would be installed adjacent to the ML in the middle of the TTA, to provide a relative point of comparison between soil gas and groundwater concentrations.
TR0352 2010.11.09 128 IM Work Plan 2010.11.09.docx
8
Following drilling and well installation, and after allowing sufficient time (48 hours) for the well seals to set and harden, the wells will be developed to remove fines and ensure proper communication with the aquifer.
2.5 Hydraulic Assessments
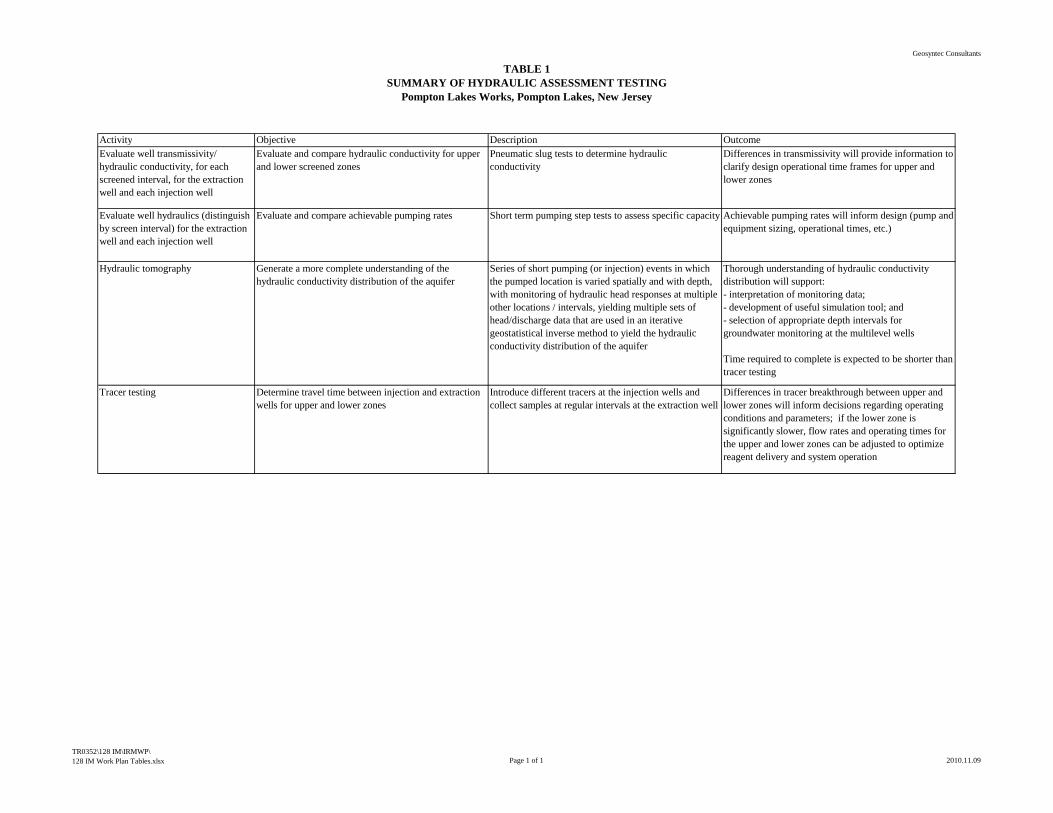
The newly-installed wells will be used to assess the hydraulic properties of the aquifer in the TTA. A sequence of tests is proposed, as listed in Table 1. These tests are designed to obtain relevant data about the hydraulic conductivity distribution within the TTA and determine achievable pumping rates to inform equipment selection, planned operations and the final IRM implementation design. Each phase of testing is described below.
2.5.1 Hydraulic Conductivity (Slug Testing)
The hydraulic conductivity for each screened interval at each well location will be evaluated using a pneumatic slug test technique. The method utilizes air pressure to disturb the water column and measures the response to the perturbation with a pressure transducer. This time-response data is then analyzed to yield an estimate of the hydraulic conductivity.
These data will allow comparison of the hydraulic conductivity estimates for the upper and lower screened zones. Differences in transmissivity will provide information to clarify design operational time frames for the upper and lower zones.
Slug testing evaluates the aquifer properties immediately adjacent to the well screen. Pump testing interrogates a larger volume of the formation, yielding more representative estimates of aquifer characteristics. Stepped-rate pump tests will be conducted to assess individual well (for each screened-interval) performance (and yield) and generate estimates of the hydraulic conductivity, transmissivity and storage coefficient of the aquifer. The step tests will also provide an estimate of the greatest flow rate that may be sustained by the pumped well. Knowledge of these flow rates will be useful for design of the IRM, including determining the size of pumps to be used. At select time points in the step tests VOC samples will be collected to evaluate changes in VOC concentrations at the pumping rates.
2.5.3 Hydraulic Tomography
Hydraulic tomography may be a suitable method to assess, in high resolution, the hydraulic conditions in the vicinity of the injection wells. If the well layout proposed for the IRM is deemed suitable for application of hydraulic tomography (well locations and construction have been selected for application of the remedial technology, not necessarily for optimal hydraulic
TR0352 2010.11.09 128 IM Work Plan 2010.11.09.docx
9
characterization), this technique may be applied at the Site. Hydraulic tomography has the potential to provide detailed characterization of the distribution of hydraulic conductivity while requiring less time and effort than tracer testing. This technique involves a sequence of cross-hole hydraulic tests with subsequent inversion of the data to map the distribution of aquifer hydraulic properties (Illman et al., 2007). In hydraulic tomography, each well is partitioned into several intervals using packers. A sequential aquifer test at selected intervals is then conducted by applying a short duration stress (i.e., pumping or withdrawal of water) at one interval and monitoring pressure response at the other depth intervals at this well and other wells. This test produces a set of pressure response data of the subsurface. Once a test is completed, the pump is moved to another interval and the test is repeated to collect another set of data. This process is repeated for the intervals at the other wells. After data collection is complete, all of the data sets are processed with a mathematical model to estimate the spatial distribution of hydraulic properties of the aquifer. Each set of data resulting from one pumping event provides a ‘snapshot’ of subsurface heterogeneity around the pumped location. Repeating the process at different intervals provides ‘snapshots’ of the heterogeneity from different locations. The inverse model then synthesizes the set of ‘snapshots’ to create a three-dimensional distribution of the hydraulic conductivity in the test area.
2.5.4 Tracer Testing
Tracer testing is proposed to determine travel times between injection and extraction wells for the upper and lower zones. Once the recirculation system was operational, conservative tracers would be introduced at the injection wells and samples would be collected at regular intervals at the extraction well. Differences in tracer breakthrough between upper and lower zones will inform decisions regarding operating conditions and parameters. If groundwater flow in the lower zone is found to be significantly slower, pumping rates and operating periods for the different zones will be adjusted to optimize reagent delivery and system operation.
Tracer testing would likely involve continuous groundwater extraction and re-injection, with routine sample collection for the duration of the test. Hence, the tracer tests will require greater effort and time to complete. However, if hydraulic tomography is successful in generating a detailed understanding of the distribution of hydraulic conductivity in the TTA, then the decision would be made to forego the tracer test. Instead the tomography results would be used as the basis of the groundwater modeling of the TTA. Tracers would still be introduced along with the first remediation amendments, as a means to verify transport times. This would eliminate the time required to operate the tracer test as a preliminary activity, while preserving a primary benefit of collecting the tracer data.
TR0352 2010.11.09 128 IM Work Plan 2010.11.09.docx
10
2.6 Numerical Simulation
Once the aquifer hydraulic properties in the TTA have been evaluated, the results will be incorporated into a numerical model of groundwater flow. The flow model will then be used to assess the details of the IRM design, including well layout and operating parameters such as pump rates, duration of active recirculation and frequency of active phases (i.e., time between periods of active recirculation, where groundwater flow within the TTA occurs under natural gradient). The model will be used to generate estimates of travel time from the set of injection wells to the extraction well. Travel time estimates will be used to help refine the positions of the multilevel monitoring wells within the TTA and to guide frequency of sample collection. The model will also be used to assess different amendment delivery scenarios; for example, the model will be used to simulate recirculation solely from the extraction well to the injection wells during amendment addition, and compare that with recirculation between injection wells (i.e., pump from an injection well while injecting into others in order to induce flow transverse to the normal flow direction). Basically, the model will be used to evaluate several operation scenarios and aid in the selection of optimal operating conditions. The model will provide a reasonable projection of the delivery of amendments to the TTA, and allow an informed decision to be made about proceeding with the IRM.
2.7 Evaluation Metric
Before installing the remaining wells and building the recirculation system, elements of the proposed IRM design and operation will be reviewed. Although it is believed that the IRM can be designed to operate as intended, if the hydraulic assessment (or other information that becomes available) suggests that the delivery of amendments to the TTA will be technically infeasible due to geological conditions, the decision could be made to not proceed with the IRM as presented herein. It is more likely that the results of the hydraulic assessment can be used to adjust the design and proceed with the IRM.
Assuming that implementation of the IRM will proceed, the EAB substrate/donor amendment and target concentration for application will be selected. At present, a blend of fast-acting soluble donor (lactate) and slow-release donor (emulsified vegetable oil [EVO]) is proposed.
2.8 Operate IRM
The IRM will be operated semi-actively: periods of active groundwater recirculation and donor amendment will be separated by periods of passive operation, with no groundwater extraction and re-injection, during which groundwater will migrate under natural gradient. Several cycles of donor addition are envisioned. Details are provided below.
TR0352 2010.11.09 128 IM Work Plan 2010.11.09.docx
11
2.8.1 Finalize Operating Conditions for the IRM
The final decisions regarding operating conditions will be made following review of the hydraulic assessment data and groundwater flow simulations. For example, daylight-only operation versus 24-hour operation during active pumping will be evaluated in terms of practicality, cost to implement, duration of operations, frequency of re-amendment, etc. Presently, a model of operations in which the active phase lasts for a period of about one week per month is envisioned. However, the effectiveness of such an operating schedule will greatly depend on the achievable pumping rates and hydraulic conductivity distribution in the TTA.
An implementation work plan would be prepared which would present the operating conditions for the in situ test. Any additional infrastructure requirements will also be addressed at this time. This will include, but is not limited to, installing the pumps in the extraction well and configuring the injection wells with drop lines and packers, as appropriate. At present, it is envisioned that temporary groundwater recirculation lines will be used, with deployment and storage required each day. Alternately, it may be feasible to install recirculation piping in the road-bed; this option will be determined at this time. The use of recirculation would potentially accelerate the time frame for observation and evaluation of the technology.
2.8.2 Baseline Sampling Event
All of the newly-installed sampling locations will be sampled to establish baseline conditions prior to initiation of the IRM and the application of electron donor. The MLs will be sampled for VOCs at all intervals to produce a three-dimensional distribution of the contaminant plume. Select intervals will be sampled for total organic carbon (TOC) to establish baseline concentrations prior to electron donor (i.e. carbon substrate) addition. Select intervals may also be sampled for other parameters of interest, such as chloride, bromide, iodide, sulfate and dissolved hydrocarbon gases (DHGs). DHGs include ethane and ethene, which are breakdown products of the contaminants of concern, and methane, which can be produced by microbes under anaerobic conditions.
2.8.3 Amend with Selected EAB Substrate
Once the wells are built, initiation of the IRM will involve amending the TTA with the selected EAB substrate. As mentioned above, a blend of fast-acting soluble donor (lactate) and slow-release donor (EVO) is proposed. Preliminary estimates based on the observed concentrations of VOCs and reducible inorganic species (primarily sulfate) present suggest that the stoichiometric donor demand in the TTA groundwater is approximately 33 milligrams per liter (mg/L) of sodium lactate. Donor would be added with a safety factor to account for variations in VOC concentrations, desorption of VOCs sorbed to the aquifer matrix, subsurface heterogeneities, consumption of donor by other microbial processes, and the intent to extend the active treatment
TR0352 2010.11.09 128 IM Work Plan 2010.11.09.docx
12
zone within the TTA. Donor would be added in pulses, with each pulse delivering sufficient mass of donor to provide the desired time-weighted average concentration to the subsurface. The desire to add excess donor to extend the bioactive zone within the TTA and provide longevity between active amendment phases must be balanced against the need to prevent excessive methane production; this will be done through careful control of the donor blend to minimize methanogenesis due to fermentation of the EVO.
EAB substrate (donor) will be applied via groundwater recirculation. Basically, this will involve deploying a mobile unit (truck or trailer-mounted system) and connecting the extraction pumps to the trailer and the trailer to the injection wells using quick-connect hoses. The donor and dosing system will be housed in the trailer. Groundwater will be pumped from the extraction well, amended with the desired amount of donor, and returned to the subsurface. Rather than constantly adding donor to the groundwater stream, the desired dose of donor (i.e. sufficient to deliver the desired time-weighted average concentration) will be added in a pulse at the beginning, so that subsequent groundwater injection will flush the amendments out from the injection wells. This pattern could be followed daily (add some donor at the start of each day) or weekly (add donor at the start of weekly operation). Details of the operation will depend on the achievable flow rates and anticipated duration of each active phase.
A second recirculation and amendment phase will occur approximately two weeks after the initial phase (timing will be based on hydraulic assessment results), in order to bioaugment the TTA with KB-1™, a microbial consortium capable of complete and rapid reductive dechlorination of chlorinated ethenes. Although there appears to be a native microbial community capable of reducing PCE and TCE to cis-DCE and VC, the natural degradation process appears to stall at the intermediate products cis-DCE and VC, which appear to have accumulated within the TTA. While the native microbial community might respond to stimulation alone (i.e., donor addition alone), augmentation with a culture known to produce the desired complete dechlorination will ensure that the process commences as quickly as possible and makes best use of the time and effort of operating the IRM.
2.8.4 Operate Extraction Well to Induce Hydraulic Gradient
Since the extraction well will not be in continuous operation during the IRM, full hydraulic control will not be possible. However, operation of the groundwater extraction-injection system will induce a hydraulic gradient across the TTA during donor amendment. The duration of the active phase can be selected and adjusted to ensure adequate distribution of amendments. If the numerical simulations or performance monitoring data suggest that a significant component of ambient groundwater flow occurs transverse to the centerline of the TTA, it may be desirable to increase the frequency of the active phase recurrence.
TR0352 2010.11.09 128 IM Work Plan 2010.11.09.docx
13
2.8.5 Operation, Monitoring and Reporting
The IRM will be operated for a period of 6 months with an option to continue for another 6 month period. Operation will involve periodic active phases of groundwater recirculation and donor amendment, as described above; at present, this active pumping and re-injection is suggested to operate for approximately one week each month. During recirculation, water level data will be collected to assess the effects of extraction and re-injection. System operating parameters, such as flow rates, injection time and volumes, line pressures, donor concentrations, etc. will be measured and recorded.
Routine monitoring will be performed by a National Environmental Laboratory Accreditation Program (NELAP) certified laboratory, to assess IRM performance. System performance will primarily be based on VOC concentrations to assess the degree of removal and TOC to assess the amount of labile donor available. DHGs will be sampled at a subset of locations and/or occasions to confirm that decreases in chlorinated VOC concentrations are accompanied by increases in ethane and ethane, the end-products of dechlorination. Periodically, further characterization of the TOC may be undertaken using volatile fatty acid (VFA) analysis to confirm the composition of TOC. Other indicators of IRM performance will include field measurements of pH, oxidation reduction potential (ORP) and dissolved oxygen (DO). Sulfate concentrations will be monitored at a subset of locations to confirm removal (conversion to sulfide), since sulfate-reducing conditions are expected. Samples will be collected on a periodic basis to assess microbial activity using quantitative polymerase chain reaction (qPCR) analysis using the 16S rRNA gene (via the Gene-Trac-Dhc analysis offered by SiREM Laboratory [SiREM]), which detects the presence and abundance of Dhc organisms, and/or the Dhc vcrA gene (via SiREM’s Gene-Trac-VC assay), the gene that codes for vinyl chloride reductase, the enzyme responsible for dechlorination of cis-DCE and VC to ethene.
Generally, performance monitoring will involve sample collection at the ML wells and at the extraction well. The network will be sampled monthly for three months. If the program is to be extended to 12 months then the subsequent sampling would be quarterly for the next nine months (i.e., at months 1, 2, 3, 6, 9 and 12). If the IRM only operates for a 6 month period, then a final sample event at 6 months would conclude the test.
Prior to commencing the IRM, the results of the hydraulic assessment and numerical simulations will be presented in a memorandum along with the proposed IRM implementation plan. This report will form the basis for discussion of the planned implementation and the evaluation decision. Results of the routine monitoring will be summarized and included in the quarterly site progress reports. A summary report would be prepared at the completion of the IRM.
TR0352 2010.11.09 128 IM Work Plan 2010.11.09.docx
14
2.9 Health and Safety
All work will be performed in accordance with the Site-specific health and safety plan (HASP), which will be modified to incorporate the activities of the IRM.
2.10 Waste Management
All investigation derived wastes will be handled and disposed of in accordance with the project-specific waste management plan (URS, 2008).
TR0352 2010.11.09 128 IM Work Plan 2010.11.09.docx
15
3. REFERENCES
Geosyntec Consultants. 2010a. Interim Remedial Measure – Characterization Work Plan for Off-Site Groundwater, Pompton Lakes Works, Pompton Lakes, New Jersey. April 2010.
Geosyntec Consultants. 2010b. Off-Site Groundwater IRM Characterization Report, Pompton Lakes Works, Pompton Lakes, New Jersey. 27 October 2010.
Illman, W.A. A.J. Craig, A. Liu. 2007. Practical issues in imaging hydraulic conductivity through hydraulic tomography. Groundwater 46(1): 120-132.
Parsons. 2010. Remedial Technology Evaluation for Off-Site Groundwater Contamination, Pompton Lakes Works, Pompton Lakes, New Jersey. January 2010.
FIGURES
TR0352 2010.11.09 128 IM Work Plan.doc
1
10
100
PomptonLake
DuPontPLWSite
RamapoRiver
1
10
100
PomptonLake
DuPontPLWSite
RamapoRiver
Site
Loc
atio
n M
ap.a
i
Guelph
Site Location MapDuPont Pompton Lakes Works
Pompton Lakes, New Jersey
Figure1
0 0.2 0.4 0.6 0.80.1MilesLegend:
Site Areas
Notes:
Base is portions of the USGS Wanaque andPompton Plains QUAD. Figure from Parsons (2010).
Well Location
128-I
NWilkie
Text Box
27-Oct-2010
NBarros
Text Box
09-Nov-2010
70I
71I
BARBARA DRIVE
128-D
128-S
128-I
WP-03
WP-04
WP-06
DP-06
WP-08
DP-01
WP-01
WP-05
SCHUYLER AVENUE
125I
125D
135
67
MIP-7
MIP-4
MIP-3
MIP-5
MIP-8
MIP-6
MIP-2
MIP-1
ML04ML01
ML03
ML02IW01
IW03
IW02
EW01
SGP01
Proposed Interim Measure Layout
DuPont Pompton Lakes WorksPompton Lakes, New Jersey
Figure
2
P:\P
RJ\P
roje
cts
\TR0
352_
Du
PON
T_Po
mp
ton_
Lake
s\C
AD
D_G
IS\P
om
pto
n_In
vest
iga
tion_
Loc
atio
ns.m
xd
Guelph 09-Nov-2010
40 0 4020 Feet
Legend:
Soil Gas Probe
Extraction Well
Injection Well
Multilevel Monitoring Well
Target Treatment Area
WP Location
MIP Location
Well Location
Approximate Location of DP Boring
Dupont PLW Site
Notes:D - deepDP - Direct PushEW - extraction wellI - intermediateIW - injection wellMIP - Membrane Interface ProbeML - multilevel monitoring wellS - shallowSGP - soil gas probeWP - Waterloo Profiler* Well survey not completed for MIP/WP/DP locations. These locations are approximate.
BEAM AVENUE
COLFAX AVENUE
DURHAM ST.
WHIT E WAY
LAKE AVENUE
COLF
AX
GRANT AVENUE
SCHUYLER AVENUE
JEF FERSON AVENUE
PERRIN AVENUE
COLFAX AVENUE
PERRIN AVENUE
JEF FERSON AVENUE
ORCHARD ST.
WALNUT ST.
POPL
AR
ST.
MAPLE ST.
HOW
ARD
ST.
BABBITT PL.
CIRC
LE A
VEN
UE
DU PONT PL.
BEAM AVENUE
COLFAX AVENUE
DURHAM ST.
WHIT E WAY
LAKE AVENUE
COLF
AX
GRANT AVENUE
SCHUYLER AVENUE
JEF FERSON AVENUE
PERRIN AVENUE
COLFAX AVENUE
PERRIN AVENUE
JEF FERSON AVENUE
ORCHARD ST.
WALNUT ST.
POPL
AR
ST.
MAPLE ST.
HOW
ARD
ST.
BABBITT PL.
CIRC
LE A
VEN
UE
DU PONT PL.
BEAM AVENUE
COLFAX AVENUE
DURHAM ST.
WHIT E WAY
LAKE AVENUE
COLF
AX
GRANT AVENUE
SCHUYLER AVENUE
JEF FERSON AVENUE
PERRIN AVENUE
COLFAX AVENUE
PERRIN AVENUE
JEF FERSON AVENUE
ORCHARD ST.
WALNUT ST.
POPL
AR
ST.
MAPLE ST.
HOW
ARD
ST.
BABBITT PL.
CIRC
LE A
VEN
UE
DU PONT PL.
Barbara Drive
Schulyer Avenue
Dupont
PLWSite
0 400 800200 Feet
Guelph
09-Nov-2010
Figure3
Generic Well Detail for Extraction and Injection Wells
Extra
ctio
n W
ell.a
i
Note:
1. Borehole will be drilled to the top of the glaciolacustrine silt that underlies the intermediate aquifer, which is encountered at about 80 ft bgs. Well will be built up from this contact, such that the lower section is positioned directly above the silt horizon.
2. Appropriate borehole and casing diameters, screen slot size and �lter pack grain size distribution will be selected for each type of well.
lockable cap
traffic-rated well vault
existing grade
concrete pad
cement-bentonite grout
cement-bentonite grout
blank casing
blank casing
bentonite seal
fine sand
fine sand
fine sand
sand filter pack
sand filter pack
slotted screen
slotted screen
sump / bottom cap3 ft
≥ 1
ft
25 ft
2 to
5 ft
2
5 ft
nom
inal
dep
th 8
0 ft
(not
e1)
silt underlying intermediate zone
Guelph
09-Nov-2010
Figure4
Generic Well Detail for Multilevel Wells
Mul
tilev
el W
ell.a
i
Note:
1. Borehole will be drilled to the top of the glaciolacustrine silt that underlies the intermediate aquifer, which is encountered at about 80 ft bgs. Well will be built up from this contact.
2. Appropriate borehole and casing diameters, screen slot size and filter pack grain size distribution will be selected.
SUMMARY OF HYDRAULIC ASSESSMENT TESTINGPompton Lakes Works, Pompton Lakes, New Jersey
Geosyntec Consultants
Activity Objective Description OutcomeEvaluate well transmissivity/ hydraulic conductivity, for each screened interval, for the extraction well and each injection well
Evaluate and compare hydraulic conductivity for upper and lower screened zones
Pneumatic slug tests to determine hydraulic conductivity
Differences in transmissivity will provide information to clarify design operational time frames for upper and lower zones
Evaluate well hydraulics (distinguish by screen interval) for the extraction well and each injection well
Evaluate and compare achievable pumping rates Short term pumping step tests to assess specific capacity Achievable pumping rates will inform design (pump and equipment sizing, operational times, etc.)
Hydraulic tomography Generate a more complete understanding of the hydraulic conductivity distribution of the aquifer
Series of short pumping (or injection) events in which the pumped location is varied spatially and with depth, with monitoring of hydraulic head responses at multiple other locations / intervals, yielding multiple sets of head/discharge data that are used in an iterative geostatistical inverse method to yield the hydraulic conductivity distribution of the aquifer
Thorough understanding of hydraulic conductivity distribution will support:- interpretation of monitoring data;- development of useful simulation tool; and- selection of appropriate depth intervals for groundwater monitoring at the multilevel wells
Time required to complete is expected to be shorter than tracer testing
Tracer testing Determine travel time between injection and extraction wells for upper and lower zones
Introduce different tracers at the injection wells and collect samples at regular intervals at the extraction well
Differences in tracer breakthrough between upper and lower zones will inform decisions regarding operating conditions and parameters; if the lower zone is significantly slower, flow rates and operating times for the upper and lower zones can be adjusted to optimize reagent delivery and system operation
TR0352\128 IM\IRMWP\128 IM Work Plan Tables.xlsx Page 1 of 1 2010.11.09
TABLE 2SUMMARY OF FIELD AND LABORATORY ANALYSES
Pompton Lakes Works, Pompton Lakes, New Jersey
Geosyntec Consultants
ParameterSample Matrix
AnalyticalMethod
MethodNumber*
AnalyticalLaboratory
DetectionLimit
SampleContainer
SampleVolume Preservative
HoldingTime
Field Parameters(pH, DO, ORP, temperature) water Ion Specific Electrode Field NA Varies NA NA NA NA
Volatile Organic Compounds water GC/MS 8260B Lancaster 0.1 to 1.0 µg/L 3 x 40 mL VOA vials filled completely, no headspace or bubbles
HCl,cool to 4°C 14 days
Dissolved Gases(ethane, ethene, methane) water GC/ECD or FID RSK-175 Lancaster 1 to 5 µg/L 2 x 40 mL VOA vials filled completely,
no headspace or bubblesHCl,
cool to 4°C 14 days
Inorganic Anions(bromide, chloride, sulfate) water Ion Chromatography 300.0 Lancaster 0.11 to 0.5 mg/L 500 mL
plastic or glass bottle filled to neck non-preserved,cool to 4°C 28 days
Inorganic Anions(Iodide) water Liquid Chromatography NA SiREM 0.5 mg/L 250 mL plastic bottle filled to neck non-preserved,
cool to 4°C 14 days
Dissolved Metals(arsenic, iron, manganese) water Lab-filtered, followed by
HNO3 preservative, ICP 6010B Lancaster 0.84 to 52 µg/L 500 mLplastic or glass bottle filled to neck non-preserved,
cool to 4°C 6 months
Total Organic Carbon water Combustion or Oxidation 9060A Lancaster 1 mg/L 4 x 125 mLamber glass bottle filled to neck
H3PO4 to pH<2,cool to 4°C
28 days
Dehalococcoides ethenogenes water PCR 16S rRNA NA SiREM NA 1 Lplastic bottle filled to neck non-preserved,
cool to 4°C 14 days
Notes:* - United States Environmental Protection Agency Method Number, unless otherwise indicated IRM - interim remedial measure°C - degrees Celsius L - literC degrees Celsius L literCustom - internal standard analytical method Lancaster - Lancaster Laboratories, Lancaster, PennsylvaniaDO - dissolved oxygen µg/L - micrograms per literECD - electron capture detector mg/L - milligrams per literFID - flame ionization detector mL - milliliterGC - gas chromatography MS - mass spectrometryH3PO4 - phosphoric acid NA - not applicableHCl - hydrochloric acid ORP - oxidation reduction potentialHNO3 - nitric acid VOA - volatile organic analysisICP - inductively coupled plasma-atomic emission spectrometry
TR0352\128 IM\IRMWP\128 IM Work Plan Tables.xlsx Page 1 of 1 2010.11.09
Notes:* Estimated total depthEW - estraction wellft bgs - feet below ground surfaceIW - injection wellML - multilevel wellTBD - to be determined; ML will be installed following initial hydraulic testing, 7 intervals are planned
LocationTotal Depth*
(ft bgs)
Lower Screen Interval(ft bgs)
Upper Screen Interval(ft bgs)
5 - 7 --
50 - 7550 - 7550 - 7550 - 75
20 - 4520 - 4520 - 4520 - 45
TR0352\128 IM\IRMWP\128 IM Work Plan Tables.xlsx Page 1 of 1 2010.11.09
APPENDIX A
SUMMARY OF GROUNDWATER VOC RESULTS FROM 128 IRM CHARACTERIZATION
TR0352 2010.11.09 128 IM Work Plan.doc
TABLE A-1SUMMARY OF GROUNDWATER VOC, DHG, ORGANIC AND INORGANIC RESULTS FROM WP INVESTIGATION