28
GROWING CASHFLOWS 2020 INTERIM ON THE 2ND QUARTER REPORT

GROWING CASHFLOWS
2020
INTERIMON THE 2ND QUARTER
REPORT

32 Group financials Management report Balance sheet Income statement Statement of comprehensive income Cashflow statement Changes in consolidated equity Segment report Notes Review report Responsibility statement Financial calendar Contact
GROUP FINANCIALS
in EUR m
Income statement key figures 01/01/2020-06/30/2020 01/01/2019-06/30/2019
Net actual rent 159.7 157.3
EBITDA (adjusted) 113.0 106.2
Consolidated net profit 212.8 233.7
FFO I per share in EUR 0.59 0.55
FFO I 86.5 80.3
AFFO per share in EUR 0.33 0.34
AFFO 48.6 50.2
Balance sheet key figures 06/30/2020 12/31/2019
Total assets 6,059.0 5,647.0
Equity 2,495.2 2,394.2
Equity ratio in % 41.2 42.4
EPRA Net Asset Value (NTA, fully diluted) per share in EUR 20.77 20.15
LTV in % 44.9 44.8
Portfolio data 06/30/2020 12/31/2019
Units Germany 85,500 84,510
Units Poland (secured pipeline) c. 5,800 0
GAV (real estate assets Germany and Poland) 5,717.1 5,302.4
Vacancy in % (total) 5.6 4.9
Vacancy in % (residential units) 5.1 4.5
l-f-l rental growth in % 1.4 1.9
l-f-l rental growth in % (incl. vacancy reduction) 1.5 2.4
Employees 06/30/2020 12/31/2019
Number of employees (Germany and Poland) 1,320 1,160
Capital market data
Market cap at 06/30//2020 in EUR m 3,108.7
Share capital at 06/30//2020 in EUR 146,498,765
WKN / ISIN 830350/DE0008303504
Number of shares at 06/30//2020 (issued) 146,498,765
Number of shares at 06/30//2020 (outstanding, without treasury shares) 146,268,801
Free float in % (without treasury shares) 99.82
Index MDAX/EPRA
CONTENTS
Group Financials 02
Group Management Report 04
Consolidated Balance Sheet 30 Consolidated Income Statement 32 Consolidated Statement of Comprehensive Income 33
Consolidated Cashflow Statement 34
Statement of Changes in Consolidated Equity 36
Selected Explanatory Notes 38
Review Report 50
Responsibility Statement 51
TAG Financial Calendar/Contact 52
TABLE OF CONTENTS

54 Changes in consolidated equity Notes Review report Responsibility statement Financial calendar ContactGroup financials Management report Balance sheet Income statement Statement of comprehensive income Cashflow statement
GROUP INTERIM REPORT FOR THE FIRST SIX MONTHS OF THE 2020 FINANCIAL YEAR
Foundations of the Group
Overview and corporate strategyTAG Immobilien AG (‘TAG’ or ‘the Group’ in the following) is a Hamburg-based property company focused on the Ger-man residential real estate sector. The properties owned by TAG are located in various regions of Northern and Eastern Germany and North Rhine-Westphalia, and, as of the 2020 financial year, in Poland as well. Overall, at 30 June 2020 TAG managed around 85,500 (31 December 2019: 84,500) residential units in Germany, and has a contractually secured pipeline for the construction of around 5,800 residential units in Poland.
TAG shares are listed in the MDAX of the Frankfurt Stock Exchange; TAG’s market capitalisation at 30 June 2020 was EUR 3.1bn (31 December 2019: EUR 3.2bn).
TAG’s business model in Germany is the long-term letting of flats. All functions essential to property management are carried out by its own employees. The Company also delivers caretaker services and – increasingly – craftsmen services for its own portfolio. It specialises in inexpensive housing that appeals to broad sections of the popu-lation. The Group’s own multimedia company supports the provision of multimedia to tenants and expands the range of property management services offered. Energy management is pooled in a subsidiary through which the Group supplies commercial heating to its own portfolio with the aim of optimising energy management. In the medium term, these ser-vices are to be further expanded and supplemented with new services for tenants.
TAG invests primarily in medium-size towns and in the vicinity of large metropolises, where we see not only potential for growth, but in particular better opportunities for returns in comparison with investments in big cities. The newly acquired portfolios usually have higher vacancies, which are then reduced following the acquisition, through targeted investments and proven asset-management concepts. Investments in Germany are made nearly exclusively in regions already where TAG manages assets, to be able to use existing administrative structures. Also, knowledge of the local market is essential in the acquisition of new portfolios here.
In addition to long-term property management, the Group selectively uses sales opportunities in order to reinvest the realised capital appreciation and liquidity into new portfolios with higher yields. This strategy of ‘capital recycling’ is TAG’s response to the intense competition for German residential real estate, and puts a focus on yield per share. Growth in absolute orders of magnitude is not at the forefront of the corporate strategy. Instead, the aim is to offer tenants affordable housing through sustained and active portfolio management, and investors growing cash flows through attrac-tive dividends.
As of the beginning of the 2020 financial year, TAG geographically expanded its portfolio to Poland. Vantage Development S.A. (‘Vantage’), a real estate developer whose headquarters and main activities are located in Wrocław in the western part of Poland, serves as the platform for further development, which going forward will focus on establishing the Group’s own portfolio of residential units in Poland, and currently also includes the continued sale of units already planned and new units to be built.
The growing Polish residential real estate market is the target of a regional expansion of TAG’s business model, which will focus on strong cash returns (i.e. FFO returns in relation to the equity invested) here as well. The Polish rental housing market is characterised by a supply shortage. It is considered one of the least saturated housing markets in Europe, with an increasing housing shortage that already exceeds 3.5 million units (OECD database). Furthermore, the absolute size of the Polish market (approx. 38 million inhabitants, sixth-largest EU country in terms of population), coupled with a growing services sector and favourable demographic trends (‘Generation rent’ – a growing preference for rented apartments) supports TAG’s market entry in Poland. The Management Board expects that its early market entry will give TAG a com-petitive advantage in terms of scope, market knowledge, market penetration, and market position.
TAG’s medium-term growth target, i.e. for the next three to five years, is to build up a portfolio of around 8,000−10,000 residential units in Poland. Capital spending will focus on development projects and new buildings in large cities with favourable population trends, proximity to universities, and a well-developed infrastructure.
Sustainable business developmentFew topics are currently being discussed as intensively as issues relating to sustainability. Questions about sustainability targets, the impact of business activities on the environment and society, and a company’s long-term plans are now changing the way the public looks at and perceives companies.
TAG is one of the largest private housing companies in Germany. Sustainable conduct is the basis of our business strategy. After all, it is the prerequisite for safeguarding the future of our Company. Our annual reporting on matters of sustainability in a given financial year is published in a separate Sustainability Report (available at www.tag-ag.com in the ”Investor Relations/Financial Reports/Sustainability Reports” section), which is prepared in line with the standards of the Global Reporting Initiative (GRI) and the European Public Real Estate Association (EPRA). This allows us to compare our results and targets over time, and to monitor and report developments according to objective criteria.
Our commitment to sustainable business development is also increasingly recognised and honoured by the rating agen-cies. In a report published on 26 June 2020 by Sustainalytics, a leading company for market research, ratings and data on ESG (environment, social, governance) issues, TAG is ranked 41st out of a total of 905 real estate companies analysed worldwide, putting it in the top 5% of all companies in this sector. Our Group was rated ‘low risk’ with 12.6 points, having improved by over 10 points and moved up a category compared to the previous year.
MANAGEMENTREPORT

76 Changes in consolidated equity Notes Review report Responsibility statement Financial calendar ContactGroup financials Management report Balance sheet Income statement Statement of comprehensive income Cashflow statement
Business report
The overall economy in GermanyThe German economy will probably face the sharpest decline in gross domestic product (GDP) since the Federal Repu-blic of Germany came into existence due to the effects of the coronavirus pandemic. According to the German Council of Economic Experts, GDP is expected to decline by 6.5% in 2020. Europe as a whole is estimated to see a decline of 8.5%. However, the Council is also forecasting a rise of 4.9% for the following year (2021) and thus expects a relatively rapid recovery. In 2022, GDP could already be back at pre-Covid-19 levels. Following the sharp economic decline of 12.4% in the second quarter of 2020, the Ifo Institute for Economic Research forecast for 2020 also expects a recovery in the second half of 2020, so that a decline of around 6.6% will be recorded during the course of the year. This scenario is based on the assumption that a second wave of coronavirus infections and a wave of insolvencies can be avoided. The Institute for Employment Research of the Federal Employment Agency also sees signs of recovery, not just for the German economy, and is optimistic about the future consumer climate in Europe, even if the level is comparatively low.
Accordning the Federal Employment Agency unemployment in Germany rose to 6.2% in June 2020 compared with 5.1% in March. The number of people registered as unemployed rose by more than 40,000 in June in comparison with the previous month, and the number of unemployed was up by around 640,000 year on year (compared with June 2019). However, a recovery is being seen in the labour market as well; the rise in unemployment figures is already slowing down after April and May. Overall, the labour market is proving to be relatively robust despite the economic repercussions from the Covid-19 pandemic, some of which have proven severe.
The overall economy in PolandBefore the outbreak of the Covid-19 pandemic, the Polish Economic Institute (Polski Instytut Ekonomiczny; PIE) had forecast a 3.5% growth in Poland’s GDP in 2020. However, similar to developments in Germany, Poland is currently threatened by its first recession since 1991. According to PIE forecasts published in early May 2020, two scenarios are conceivable for Poland’s GDP in 2020: In the first case, the extent of a second wave of Covid-19 pandemic with the asso-ciated negative effects is estimated to be low. In this case, the PIE predicts a 4.4% decline in Poland’s economic output in 2020 as compared to 2019. In the second scenario, the expected second wave of infection would be similar or possibly even greater than the first wave. This would mean a shutdown of several sectors of the economy for one or two months in fall. In this latter case, Poland’s GDP in 2020 would be 7.1% lower than in 2019.
Prior to the Covid-19 pandemic, the situation on the Polish labour market was considered to be especially labour-friendly. There is still a shortage of workers. However, according to Santander Bank and the Polish Central Bank, the situation could change. In the base scenario, the experts expect between 500,000 and 600,000 redundancies as a result of the Covid-19 pandemic. This would push up the unemployment rate to 5.6%.
The German residential real estate industryAccording to Savills Germany’s research results for the first half of 2020, the Covid-19 pandemic has only caused a short-term decline in activity in the German residential investment market. Despite the crisis, the transaction volume in the residential investment market in the first half of the year was around EUR 12.5bn, almost twice as high (+96%) as in the same period of the previous year. Most of this is attributable to Ado Properties’ acquisition of Adler Real Estate. However, the effects of the crisis were definitely felt in April and May, and the average volume of EUR 3.2bn in Q2 2020 was below the second-quarter average of the last five years of EUR 4.1bn. However, in June, transaction activity was already reco-vering at above-average rates. A significant increase in investor demand for residential real estate and a similarly strong result as in the previous year is forecast.
According to the EY Real Estate Trend Barometer June 2020, Germany continues to remain attractive for investments due to the stability of the real estate market, especially in a European comparison. The real estate ratio of the investors surveyed is at a new historic high of 10.8%, and it can be assumed that investments in real estate will continue to increase – especially in the stable segments of residential and logistics, despite the partly already high prices. The investment market is currently dominated by companies in the insurance sector, pension funds, private investors, and family offices.
Savills points to possible permanent changes in consumer and work behaviour in the wake of the Covid-19 pandemic due to an increased implementation of online concepts. A growing preference for more security, freedom, and living space is conceivable. In the long term this would lead to a relative strengthening of the urban periphery and a more decentralised urban development. An up-valuation of smaller cities also seems realistic if there is a reduction in time and transport costs at the place of work. This could open up opportunities for the real estate market, especially in the residential segment of ‘B locations’. In Savills’ view, a good start would be an orientation towards “bigger, greener and cheaper”. Matters of ESG (Environmental, Social and Governance) are garnering much attention in the investment industry as elsewhere, and ESG criteria are often a relevant factor in real estate investments.

98 Changes in consolidated equity Notes Review report Responsibility statement Financial calendar ContactGroup financials Management report Balance sheet Income statement Statement of comprehensive income Cashflow statement
Purchases and sales in the first half of the 2020 business yearThe following diagram gives an overview of acquisitions in Germany in the first half of the 2020 financial year:
In all, purchase agreements for 865 apartments were notarised. The average purchase multiplier (ratio between the purchase price excluding transaction costs and the annual net actual rent) of 12.9 achieved is to be considered very attractive given the stiff competition in the residential property market, and corresponds to an annual gross initial yield of 7.8%. Average vacancy in the acquired portfolios is 12.0%, and therefore offers further development potential.
In addition c. 320 units notarised in 2019 were closed. Meanwhile, in the ongoing sales business in Germany, sales of 209 units were notarised from January till June 2020. The sales price and net cash inflow totalled EUR 8.3m or 14.4 times the annual net actual rent. Only marginal book profit is expected from these sales.
Development of the TAG portfolio
Overview of the portfolioAt the end of the first half of 2020, the TAG property portfolio in Germany comprised approximately 85,500 residential units. The regional focus is mainly on Northern and Eastern Germany, and the units are distributed as follows:
Portfolio data 06/30/2020 12/31/2019
Units 85,500 84,510
Floor space in sqm 5,148,638 5,094,435
Real estate volume in EUR m 5,564.7* 5,302.4
Annualised net actual rent in EUR m p.a. (total) 322.9 319.9
Net actual rent in EUR per sqm (total) 5.54 5.51
Net actual rent in EUR per sqm (residential units) 5.43 5.39
Vacancy in % (total) 5.6 4.9
Vacancy rate in % (residential units) 5.1 4.5
l-f-l rental growth in % 1.4 1.9
l-f-l rental growth in % (incl. vacancy reduction) 1.5 2.4
* Property volume EUR 5,717.1m in total (of which EUR 5,564.7m relates to German properties and EUR 152.4m to properties in Poland)
Acquisition Saxony-Anhalt Saxony Total
Conclusion of the contract January 20 March 20
Units 431 434 865
Net actual rent in EUR/sqm/month 4.61 4.29 4.47
Vacancy in % 5.2 18.9 12.0
Purchase price in EUR m - - 29.2
Net actual rent in EUR m p.a. 1.3 1.0 2.3
LocationBernburg/Biederitz/
Dessau/Gatersleben Plauen, Jößnitz -
Closing March 20 April 20 -
Multipliers - - 12.9
Karte ENG, 2020
Berlin
GeraErfurt
Salzgitter
Chemnitz
Leipzig
Dresden
Rhine-Ruhr
Hamburg
Rostock
Berlin region (15%)
Chemnitz region (7%)
Dresden region (10%)
Erfurt region (13%)
Gera region (8%)
Hamburg region (11%)
Leipzig region (11%)
Rhine-Ruhr region (6%)
Rostock region (9%)
Salzgitter region (10%)
% acc.: proportional IFRS book value to real estate volume
••
•
•
••
•
•
••
Karte D, 2019
Region Berlin (15%)
Region Chemnitz (7%)
Region Dresden (10%)
Region Erfurt (13%)
Region Gera (8%)
Region Hamburg (11%)
Region Leipzig (11%)
Region Rhein-Ruhr (6%)
Region Rostock (9%)
Region Salzgitter (10%)
%-Satz: anteiliger IFRS-Buchwert Immobilienvermögen
••
•
•
••
•
•
••
Berlin
GeraErfurt
Salzgitter
Chemnitz
Leipzig
Dresden
Rhein-Ruhr
Hamburg
Rostock

1110 Changes in consolidated equity Notes Review report Responsibility statement Financial calendar ContactGroup financials Management report Balance sheet Income statement Statement of comprehensive income Cashflow statement
Leerstandsentwicklung D, Q2-2020
Leerstandsentwicklung ENG, Q2-2020
5,6 %6,1 %
5,9 %
4,9 %5,2 %5,2 %5,0 %
4,7 %5,2 %
5,5 %5,3 %
5.25.6 %
%5.0 %5.3 %
4,8 %5,3 %
5,7 %
4,5 %4,9 % 5,1 %
4,6 %
4.9 %5.1 %
4.6 %
Jan. Mär. Jun. Sep. Dez. Jan. Mär. Jun. Sep. Dez. Jan. Mär. Jun. Sep. Dez. Jan. Mär. Jun.
2017 2018 2019 2020
6.1 % 5.9 %
4.9 %5.2 %
4.7 %5.2 %
5.5 %
4.8 %5.3 %
5.7 %
4.5 %
Jan Mar Jun Sep Dec Jan Mar Jun Sep Dec Jan Mar Jun Sep Dec Jan Mar Jun
2017 2018 2019 2020
+ 0,5 %Akquisitionen + 0,3 %
Akquisitionen + 0,1 %Akquisitionen
+ 0.5 %Acquisitions + 0.3 %
Acquisitions + 0.1 %Acquisitions
rent increases due to modernisation surcharge
rent increases existing tenants
tenant turnover0.8 0.5
0.1
Mieterhöhungen durch Modernisierungsumlagen
Laufende Mieterhöhungen Bestandsmieter
0,8 0,5
0,1
Mietwachstum D, Q2-2020
Mietwachstum ENG, Q2-2020
1,9 1,4
2019 Q2 2020
2,0 2,0
2017
2,3
2018
Basis l-f-l
2,4 1,5
2019 Q2 2020
3,1
2017
2,6
2018
inkl. Leerstandsabbau
in %
in %
4
3
2
1
0
Basis l-f-l incl. vacancy reduction
1.9 1.4
2019 Q2 2020
2.0 2.0
2017
2.3
2018
2.4 1.5
2019 Q2 2020
3.1
2017
2.6
2018
4
3
2
1
0
Mieterhöhung Mieterwechsel
VacancyThe following table illustrates the development of vacancy in the Group’s residential units in Germany since 2017 and in the first six month of 2020 to date:
As a result of the integration of the previous year’s acquisitions and due to ongoing modernisation programmes to reduce vacancy, as well as the fact that at times fewer viewings could be held, and thus fewer rentals signed, as a result of the Covid-19 pandemic, there was a slight rise in vacancy in the first half of the year. However, vacancy is expected to fall to the unchanged forecast level (4.3% to 4.5% at year-end 2020) in the second half of 2020. In August 2020, vacancy in TAG residential units had already receded back to 5.0%.
Vacancy across the residential units in the portfolio developed from 4.6% at the beginning of the year to 5.1% on 30 June 2020. Meanwhile, the vacancy rate for the portfolio as a whole was 5.6% compared to 4.9% at 31 December 2019.
Growth in rentsAt 1.4% per annum, growth in rents from the Group’s residential units at 30 June 2020 was down year-on-year (2019: 1.9% p.a.) on a like-for-like basis (i.e. not including the acquisitions and sales of the previous twelve months). This rental growth of 1.4% was comprised of ongoing rent increases for existing tenants (0.8%), rent increases in connection with a change of tenants (0.5%), and rent increases due to modernisation charges (0.1%). If one additionally includes the effects of the vacancy reduction in rental growth, total rental growth on a like-for-like basis for the past twelve months amounts to 1.5%, after 2.4% in the financial year 2019. The lower growth seen in the first half of the year compared to H1 2019 is also related to the effects of the Covid-19 pandemic. Besides the lower vacancy reduction compared to the previous year, the fact that TAG voluntarily did not raise rents by adjusting them to comparable local rents in the period from March to June 2020, as well as lower tenant fluctuation (and thus fewer rent increases in connection with re-letting) contributed to this development. However, these effects are likewise seen as temporary, so that the forecast for the full financial year 2020 of 2.0% to 2.5% rental growth on a like-for-like basis is maintained.
The following chart shows the rental growth in the Group’s residential units in Germany in the financial years since 2017, and in the end of the second quarter of 2020:
Total investments in the residential units in the first six months of 2020 amounted to EUR 11.12 per sqm (maintenance costs recognised as expenses of EUR 3.42 per sqm, and capitalised modernisations of EUR 7.70 per sqm). Extrapolated to a full financial year of twelve months, this would come to EUR 22.24 per sqm, after 20.45 per sqm in FY 2019.
So the Group continues to achieve attractive rental growth with only moderate investment requirements, and without extensive modernisation programmes for residential units already let. The rise in total capex is due to increased moder-nisation expenditure to reduce vacancy.

1312 Changes in consolidated equity Notes Review report Responsibility statement Financial calendar ContactGroup financials Management report Balance sheet Income statement Statement of comprehensive income Cashflow statement
The portfolio in detail by regionThe following table shows further details of TAG’s property portfolio in Germany, by region, as at 30 June 2020: Development of business activities in Poland
Based on an average exchange rate of the Polish złoty (PLN) to the euro, revenues from the sale of properties by Vantage amounted to EUR 15.8m in the first half of 2020, up from EUR 4.4120:1. In the first half of 2020, sales of 266 apartments were notarised, and 155 apartments were handed over to their buyers. These handovers led to the aforementioned sales revenues.
Sales figures were down in the second quarter of 2020 due to the Covid-19 pandemic. Only 61 residential sales were notarised between April and June 2020 (Q1 2020: 205). However, in July 2020, a clearly upward trend was already obser-ved, with 57 notarised apartment sales.
As of 30 June 2020, the contractually secured pipeline for the construction of apartments comprises a total of 5,800 units, of which 4,485 units are in Wrocław, and 1,074 units are in Poznań and 240 units are in Łódź.
According to current plans, of the total 5,800 units, approx. 3,200 to 3,300 units built for sale, while approx. 2,500 to 2,600 units are to be let upon completion, thereby forming the basis for the roughly 8,000 to 10,000 units that are to be built up as a rental portfolio in Poland within a period of three to five years. The first rental income is expected in Poland upon completion of the first rental projects in the course of the 2021 financial year. Until then, Vantage’s business activities will continue to be almost exclusively in the sale of residential units.
Revaluation of the portfolio as at 30 June 2020As in the 2018 and 2019 financial years, TAG’s real estate portfolio was again completely revalued by CBRE GmbH, an independent expert, as at 30 June. In addition to this valuation, another full valuation will be performed as at 31 December 2020.
The total valuation gain of EUR 172.4m reported in the consolidated income statement for the first half of 2020, relates almost exclusively to properties in Germany (EUR 174.0m). In contrast, the revaluation result of EUR -1.6m for the proper-ties in Poland was of minor significance.
The valuation gain of EUR 174.0m reported for the German portfolio on 30 June 2020 compares with a valuation gain of EUR 202.7m in the last (mid-year) revaluation for the period from 30 June to 31 December 2019 and is attributable to both the good operating performance (effect: EUR 30.4m) and ‘yield compression’, i.e. lower capitalisation interest rates due to lower yield requirements on the part of potential buyers (effect: EUR 143.6m).
Region UnitsRentablearea sqm
IFRS BV 06/30/
2020 EUR m
In- place yield
%
Va-cancy
06/30/ 20 20
%
Va-cancy
Dec- 2019*
%
Net actual
rent EUR / sqm
Relet-ting rent
EUR / sqm
l-f-I rental
growth y-o-y
%
l-f-I rental
growth y-o-y***
%
Main-tenance
EUR / sqm
Capex EUR / sqm
Berlin 10,410 597,030 817.2 4.8 4.5 4.1 5.78 6.24 1.7 1.1 2.82 11.77
Chemnitz 7,475 437,293 358.0 6.7 8.0 7.7 4.96 4.98 1.2 2.3 3.62 15.21
Dresden 6,298 409,025 561.2 4.9 3.1 2.1 5.78 6.17 1.9 1.5 1.84 3.61
Erfurt 10,812 607,967 682.6 5.4 3.1 2.6 5.26 5.58 1.2 1.7 2.93 6.32
Gera 9,631 560,160 440.7 7.2 7.1 7.0 5.06 5.33 1.3 2.1 2.53 5.13
Hamburg 7,039 432,857 570.8 5.1 4.0 4.2 5.80 6.02 1.2 2.1 4.65 10.64
Leipzig 10,013 589,863 592.3 5.9 6.5 5.4 5.31 5.75 1.6 1.2 2.94 3.47
Rhine-Ruhr 4,188 266,405 332.1 5.2 2.6 2.1 5.54 5.71 1.6 1.6 6.04 2.87
Rostock 7,987 452,551 491.7 5.8 4.9 3.6 5.54 5.93 1.3 1.6 4.99 9.46
Salzgitter 9,180 563,122 546.3 6.3 5.5 5.2 5.41 5.60 1.2 0.6 3.50 7.65
Total residential units 83,033 4,916,272 5,392.8 5.6 5.1 4.5 5.43 5.70 1.4 1.5 3.42 7.70
Acqui-sitions 1,166 65,361 42.6 7.2 16.7 7.8 4.68 – – – – –
Commer- cial units (within res, portfolio) 1,143 146,704 – – 16.4 16.3 8.56 – – – – –
Total residential portfolio 85,342 5,128,337 5,435.4 5.9 5.5 4.9 5.50 – – – – –
Other 158 20,301 129.2** 5.1 6.1 8.1 13.33 – – – – –
Grand total 85,500 5,148,638 5,564.7** 5.9 5.6 4.9 5.54 – – – – –
*** Including effects from vacancy reduction* Excluding acquisitions 2019 ** Including EUR 69.2m book value of project developments.

1514 Changes in consolidated equity Notes Review report Responsibility statement Financial calendar ContactGroup financials Management report Balance sheet Income statement Statement of comprehensive income Cashflow statement
The following table shows the valuation effects by individual region in Germany in detail:
The valuation factor of the German portfolio (the ratio of the IFRS book value to the net actual rent) rose from 16.4 at the end of 2019 to 17.0 on 30 June 2020. This corresponds to a gross initial yield of 5.9% after 6.1% on 31 Decem-ber 2019.
Region(in EUR m)
06/30/2020Fair value
(IFRS)
06/30/2020Fair value
(EUR/sqm)
06/30/2020Implied
multipleValuation
result
Share of operational performan-
ce/ other market
develop-ments
Share of yield com-
pression
12/31/2019Fair value
(IFRS)
12/31/2019 Fair value
(EUR/sqm)
12/31/2019Implied
multipleBerlin 817.2 1,300.5 19.6 x 30.5 1.6 28.9 779.6 1,240.9 18.6 x
Chemnitz 358.0 794.7 14.6 x 4.9 1.7 3.2 347.9 764.9 14.2 x
Dresden 561.2 1,334.4 19.7 x 27.0 3.7 23.4 532.7 1,266.4 18.7x
Erfurt 682.6 1,081.3 17.3 x 11.8 3.3 8.5 660.9 1,069.8 17.1 x
Gera 440.7 751.5 13.4 x 6.9 2.8 4.1 431.2 734.2 13.2 x
Hamburg 570.8 1,290.2 18.9 x 24.9 6.3 18.7 543.6 1,224.0 18.1 x
Leipzig 592.3 987.3 16.3 x 23.1 4.6 18.4 568.1 946.4 15.6 x
Rhine-Ruhr 332.1 1,197.1 18.2 x 13.3 1.4 12.0 318.0 1,146.3 17.5 x
Rostock 491.7 1,065.3 16.6 x 12.2 1.7 10.5 446.4 1,027.7 16.2 x
Salzgitter 546.3 967.6 15.5 x 16.9 3.5 13.4 525.1 930.1 14.9 x
Total residential units 5,392.8 1,065.1 17.0 x 171.5 30.5 141.0 5,153.4 1,024.6 16.4 x
Acquisitions 42.6 652.0 13.8 x 0.3 0.0 0.3 36.8 835.5 12.3 x
Total residential portfolio 5,435.4 1,059.9 17.0 x 171.8 30.5 141.3 5,190.2 1,023.0 16.4 x
Other 129.2* 2,958.0** 19.7 x** 2.2 -0.1 2.3 112.2 2,780.5 17.4 x
Grand total 5,564.7* 1,067.4 17.0 x 174.0 30.4 143.6 5,302.4 1,030.2 16.4 x
in %
90
120
110
100
80
70
60
Stück / Mio.
2,1
1,8
1,5
1,2
0,9
0,6
0,3
0
TAG-Aktie (-5%) MDAX (-9%)
EPRA/NAREIT Europe Index (-23%) Handelsvolumen
in % Shares / m
2.1
1.8
1.5
1.2
0.9
0.6
0.3
0
01.01.2020 01.02.2020 01.03.2020 01.04.2020 01.05.2020 01.06.2020 30.06.2020
01/01/2020 02/01/2020 03/01/2020 04/01/2020 05/01/2020 06/01/2020 06/30/2020
TAG share (-5%) MDAX (-9%)
EPRA/NAREIT Europe Index (-23%) Trade volume
Kursentwicklung D, Q2-2020
Kursentwicklung ENG, Q2-2020
90
120
110
100
80
70
60
EPRA Germany Index (+/-0%)
EPRA Germany Index (+/-0%)
The TAG share and the capital market
Share performanceThe price of the MDAX-listed TAG share fluctuated sharply in the first half of 2020 due to market pressures arising from the Covid-19 pandemic. Following a price of EUR 22.16 at the end of 2019, the stock traded at highs of around EUR 25.00 in February 2020 and lows of EUR 14.93 in March 2020. However, a significant recovery set in at the end of the first half, and the share price rose again to a value of EUR 21.22 on 30 June 2020, which corresponds to a 4% decline in its price compared to the beginning of the year.
Taking into account the dividend of EUR 0.82 per share paid to shareholders in May 2020, the overall performance of TAG stock in the first half of 2020 was -1%. So by the reporting date, the share had already made up for its losses during the peak phase of the Covid-19 pandemic. By comparison, the EPRA Index, which is made up of various European real estate companies listed on international stock exchanges, recorded a 23% decline in the first half of 2020.
At the national level, the MDAX index fell by 9%, while the EPRA Germany, which comprises the main German real estate stocks, at +/- 0%, had also recovered, as shown in the following chart:
*Including EUR 69.2m book value of project developments **Excluding project developments

1716 Changes in consolidated equity Notes Review report Responsibility statement Financial calendar ContactGroup financials Management report Balance sheet Income statement Statement of comprehensive income Cashflow statement
Analysis of the earnings, assets, and financial position
Preliminary noteUnder a contract dated 8 November 2019, TAG acquired all shares in Vantage Development S.A., Wrocław, Poland. The acquisition became legally effective on 13 January 2020. Since that date, Vantage has been fully consolidated in TAG’s consolidated financial statements.
The initial consolidation resulted in the recognition of goodwill of EUR 19.8m, which amounted to EUR 18.8m on 30 June 2020 (31 March 2020: EUR 18.4m), mainly due to currency translation effects. This calculation is based on an allocation of the cash purchase price of EUR 131.9m for the shares to the fair values of the acquired assets and liabilities.
Apart from the recognition of this goodwill, the initial consolidation of Vantage did not have any material effect on TAG’s earnings, assets, and financial position. The contribution of Vantage and the business activities in Poland to TAG’s con-solidated net profit and the contribution to the TAG Group’s FFO II in the first half of 2020 are as follows:
Due to the lack of rental income, business activities in Poland had no influence on FFO I in the reporting period.
Results of operationsThe breakdown of rental income for the first half of 2020 is as follows:
Rental income in EUR m 01/01-06/30/2020 01/01-06/30/2019
Net actual rent 159.7 157.3
Pro rata remuneration of property tax and building insurance 11.1 9.8
Rental income according to IFRS 16 170.8 167.1
External operational and anciallary costs recharged to tenants 39.5 35.8
Pro rata remuneration of property tax and building insurance 2.7 2.2
Costs recharged to tenants according to IFRS 15 42.2 38.0
Total 213.0 205.1
9,6 % The Capital Group Companies, Inc., USA
5,8 % BlackRock Inc., USA
5,2 % Flossbach von Storch AG, D
4,9 % BayernInvest Kapitalverwaltungsgesellschaft mbH, D
4,7 % Versorgungsanstalt des Bundes
und der Länder, D
59,9 % Sonstige
59.9 % Other
Aktionärsstruktur, deutsch, Q2-2020
Aktionärsstruktur, englisch, Q2-2020
9,9 % MFS (Massachusetts Financial Services Company), USA
9.6 % The Capital Group Companies, Inc., USA
5.8 % BlackRock Inc., USA
5.2 % Flossbach von Storch AG, GER
4.9 % BayernInvest Kapitalverwaltungsgesellschaft mbH, GER
4.7 % Versorgungsanstalt des Bundes
und der Länder, GER
9.9 % MFS (Massachusetts Financial Services Company), USA
Share capital and shareholder structure TAG’s market capitalisation stood at EUR 3.1bn on 30 June 2020, up from EUR 3.2bn on 31 December 2019. The share capital and number of shares at 30 June 2020 remained unchanged year-on-year at EUR 146,498,765.00 and 146,498,765 shares.
At the reporting date, free float was at 99.82% of the share capital; 0.18% of the share capital (229,964 shares at 30 June 2020 after 161,815 shares at 31 December 2019) is held by TAG as treasury shares for Management Board and staff remuneration.
As before, the majority of TAG shareholders are German and international investors with a predominantly long-term invest- ment strategy, as the following overview shows:
DividendTAG’s shareholders participate substantially in the Company’s success by paying an attractive dividend. At this year’s Annual General Meeting, which was held as a virtual AGM for the first time on 22 May 2020, the distribution of a divi-dend of EUR 0.82 per share for FY 2019, after EUR 0.75 per share in the previous year, was resolved and subsequently paid out.
To keep the share established as an attractive dividend stock into the future, we plan to pay a further increased dividend of EUR 0.87 per share for the 2020 financial year, corresponding to an unchainged pay-out ratio of 75% of FFO I.
Financial Rating TAG holds an investment grade rating from Moody’s (Baa3 with stable outlook). The rating supports TAG’s stable finan-cing structure and increases its flexibility in financing-related matters.
FFO II contribution Poland in EURm 01/01-06/30/2020
Net income from Poland -3.0
Result of effects from purchase price allocation 2.4
Valuation result 1.6
Deferred taxes -2.0
Minority interest 0.2
Result of operations Poland -0.8

1918 Changes in consolidated equity Notes Review report Responsibility statement Financial calendar ContactGroup financials Management report Balance sheet Income statement Statement of comprehensive income Cashflow statement
The result from services is broken down into the services provided by the TAG Group and the pro rata property tax and building insurance incurred thereby, as follows:
The following overview shows the main items of other operating income:
Capitalised own work corresponds to internal personnel and material costs directly attributable to construction projects in Poland.
The item ”Fair value changes of investment properties and valuation of inventory properties“ includes the gains and losses from the ongoing valuation of investment properties held in the portfolio, the valuation result from the purchase of invest- ment properties, and effects from the valuation of inventory properties.
In the first six months of the 2020 financial year, the Group increased its net actual rents from EUR 157.3m to EUR 159.7m compared to the prior-year period. The main reason for this increase was the operational growth in rents.
The individual items of rental expenses are as follows:
The proceeds from the sale of properties in Germany and Poland and the results of their sale are shown below:
Expenses on the sale of properties held as inventory in Poland include increased book value of disposals of EUR 3.3m from the preliminary purchase price allocation, which in principle lead to a negative sales result. Excluding this effect, the gains on disposals for the first half of 2020 amount to EUR 2.9m.
Other operating income in EUR m 01/01-06/30/2020 01/01-06/30/2019
Capitalised internal costs 1.1 0.0
Derecognition of liabilities 0.7 0.5
Income from the reversal of provisions 0.2 0.1
Other 0.9 1.2
Total 2.9 1.8
Income from sales in EUR m 01/01-06/30/2020 01/01-06/30/2019
Revenues from the sale of investment properties 6.6 5.1
Expenses on the sale of investment properties -6.9 -5.1
Net income from the sale of investment properties -0.3 -0.0
Revenues from the sale of properties held as inventory 0.6 0.6
Expenses on the sale of properties held as inventory -1.3 -0.4
Expenses on the sale of inventories -0.7 0.2
Revenues from the sale of properties held as inventory Poland 15.8 0.0
Expenses on the sale of properties held as inventory Poland -16.2 0.0
Expenses on the sale of inventories Poland -0.4 0.0
Total -1.4 0.2
Net income from property services in EUR m 01/01-06/30/2020 01/01-06/30/2019
Energy services 12.3 10.1
Facility management 6.7 6.2
Multimedia services 4.3 4.2
Internally generated in-house craftsmen services 2.1 1.9
Recharged proportionate land tax and building insurance 1.4 1.2
Other service income 1.5 1.2
Income from property services 28.3 24.8
Expenses from property services -15.4 -14.7
Impairments accounts receivables -0.2 -0.3
Total 12.7 9.8
Rental expenses in EUR m 01/01-06/30/2020 01/01-06/30/2019
Maintenance expenses 16.9 16.7
Non-recoverable ancillary costs 4.7 4.8
Ancillary costs of vacant real estate 3.2 5.6
Non-recharged expenses 24.8 27.1
Rechargeable costs, taxes and insurance 53.3 47.8
Rental expenses 78.1 74.9
Impairment losses on rent receivables 1.9 2.5
Total 80.0 77.1

2120 Changes in consolidated equity Notes Review report Responsibility statement Financial calendar ContactGroup financials Management report Balance sheet Income statement Statement of comprehensive income Cashflow statement
The net financial result in the consolidated income statement, which represents the balance of financial income and financial expenses, improved from EUR -31.9m for the prior-year period to EUR -14.3m. Adjusted for one-off effects, the net financial result, which is used in determining FFO, improved from EUR -22.7m to EUR -21.9m compared with the first half of 2019, and is calculated as follows:
Non-cash interest from bonds mostly refers to changes in the fair value of the conversion right of the convertible bond issued by TAG, which is separately measured as an embedded derivative as of 30 June 2020. The other financial result essentially contains effects from foreign currency translation as of 30 June 2020 and income from investments.
Income taxes are composed as follows:
All in all, TAG generated consolidated earnings of EUR 212.8m in the first six months of the year, after EUR 233.7m in the first half of 2019. The decrease in consolidated net income is primarily due to the EUR 39.0m reduction in the valuation result from EUR 211.4m to EUR 172.4m. The improvement in the financial result from EUR -31.9m to EUR -14.3m contri-buted to an improvement in earnings of EUR 17.6m.
Taxes on income in EUR m 01/01-06/30/2020 01/01-06/30/2019Actual income taxes current financial year 5.5 2.9
Actual income taxes previous years 0.1 -0.3
Deferred taxes 46.0 47.3
Total 51.6 49.9
The breakdown is as follows:
Due in particular to the first-time inclusion of Vantage in the consolidated financial statements, personnel expenses rose to EUR 28.1m in the reporting period (previous year: EUR 24.3m). EUR 2.5m (previous year period: EUR 0.0m) were attributable to Vantage. On 30 June 2020, TAG had 1,320 employees, including the staff in Poland, up from 1,160 at the end of 2019.
Depreciation and amortisation of intangible assets and property, plant and equipment mainly comprises scheduled depreciation and amortisation of owner-occupied property and of IT and other office equipment, and at EUR 3.4m was only slightly above the level of EUR 3.1m in the same period of the previous year.
The composition of other operating expenses is shown below:
Valuation result real estate in EUR m 01/01-06/30/2020 01/01-06/30/2019
Investment properties
Valuation result on portfolio properties 172.2 212.3
Inventory properties
Reversal of impairment losses on inventory properties 0.0 0.0
IFRS 5 Properties
Valuation result of properties held for sale 0.2 -0.9
Total 172.4 211.4
Other operating expenses in EUR m 01/01-06/30/2020 01/01-06/30/2019
Legal, consulting and auditing costs (incl. IT consulting) 3.3 2.5
Telephone costs, postage, office supplies 0.9 0.8
IT costs 0.8 0.9
Costs of premises 0.8 0.7
Travel expenses (incl. vehicles costs) 0.6 0.7
Additional personnel expenses 0.5 0.7
Other 2.4 2.0
Total 9.3 8.3
Financial result in EUR m 01/01-06/30/2020 01/01-06/30/2019
Other financial result 1.4 0.4
Interest income 9.9 0.2
Interest expense -25.6 -32.5
Financial result -14.3 -31.9
Non-cash interest on bonds and notes -7.9 0.7
Early prepayment penalties 0.6 0.1
Other non-cash items (e.g. derivatives) -0.3 8.4
Net financial result (cash effective, excluding one-off effects) -21.9 -22.7

2322 Changes in consolidated equity Notes Review report Responsibility statement Financial calendar ContactGroup financials Management report Balance sheet Income statement Statement of comprehensive income Cashflow statement
Net assets and investmentsTotal assets increased to EUR 6,059.0m at 30 June 2020 compared to EUR 5,647.0m at 31 December 2019. On 30 June 2020, the book value of the Group’s total property volume amounted to EUR 5,717.1m on the reporting date (31 December 2019: EUR 5,302.4m), of which EUR 5,564.7m is attributable to German properties and EUR 152.4m to properties in Poland.
In the first half of 2020, TAG spent a total of EUR 54.7m (prior-year period: EUR 46.8m) on ongoing maintenance and modernisation costs across its portfolio. EUR 16.8m (prior-year period: EUR 16.7m) were spent on maintenance reco- gnised in profit or loss, and EUR 37.9m (prior-year period: EUR 30.1m) for capitalised modernisation costs, which break down as follows:
In addition, modernisation expenses of EUR 15.1m were incurred for project developments (previous year: EUR 2.9m), the bulk of which was for a former office building in Munich that is currently being converted into a hotel. These modernisation expenses are considered separately, independently of the residential portfolio.
Deferred tax liabilities were as follows at the balance sheet date:
The following table shows the main items of deferred tax liabilities:
Deferred tax assets in EUR m 06/30/2020 12/31/2019
Unused tax losses (incl. Interest carried foward) 45.9 48.9
Derivative financial instruments 18.1 21.1
Other (incl. offset) -14.3 -20.3
Total 49.7 49.7
Modernisation expenses in EUR m 01/01-06/30/2020 01/01-06/30/2019
Major measures (e.g. modernisation of entire blocks of flats) 21.5 15.3
Modernisation of flats
Previously vacant flats 11.9 9.6
Tenant turnover 4.5 5.1
Total modernisation expenses like-for-like portfolio 37.9 30.0
in EUR m 01/01-06/30/2020 01/01-06/30/2019
Net income 212.8 233.7
Elimination net income Poland 3.0 0.0
Net income Germany 215.8 233.7
Income taxes 52.3 49.9
Financial result 14.5 31.9
EBIT 282.6 315.5
Adjustments
Valuation result -174.0 -211.4
Depreciation 3.4 3.1
Elimination of IFRS 16 effects 0.0 -0.8
Sales result 1.0 -0.2
EBITDA (adjusted) 113.0 106.2
Rental income (net actual rent) 159.7 157.3
EBITDA marge (adjusted) 70.8% 67.5%
Net finance income (cash, without one-offs) -22.1 -22.7
Income taxes (cash) -3.8 -2.6
Guaranted dividend minorities -0.6 -0.6
FFO I 86.5 80.3
Capitalised maintenance -4.5 -5.1
AFFO (before modernisation capex) 82.0 75.2
Modernisation capex -33.3 -24.9
AFFO 48.7 50.2
Net revenues from sales Germany -1.0 0.2
Operating activities Poland -0.8 0.0
FFO II 84.7 80.6
Weighted average number of shares (outstanding, in 000) 146,286 146,328
FFO I per share in EUR 0.59 0.55
AFFO per share in EUR 0.33 0.34
Weighted average number of shares (fully diluted, in 000) 161,141 161,090
FFO I per share in EUR, fully diluted 0.54 0.50
AFFO per share in EUR, fully diluted 0.30 0.32
The following table shows the calculation of adjusted EBITDA, FFO I, AFFO (adjusted funds from operations excl. capex except capex for project developments) and FFO II (FFO I incl. net revenue from sales in Germany and adding in the earnings contribution from business activity in Poland) in the present year to date, compared with the same period of the previous year:
As a result, FFO I, which is currently still calculated solely on the basis of the rental business operated by TAG in Germany, increased by EUR 6.2m or 8% year-on-year in the period under review. This increase was primarily due to a EUR 6.8m increase in adjusted EBITDA and a EUR 0.6m improvement in the net financial result (cash, excluding non-recurring effects).
In the first half of 2020, AFFO declined by EUR 1.5m, or 3%, compared to the same period in 2019. Despite the EUR 6.1m increase in FFO I, the main reason for this development was the EUR 8.4m increase in the modernisation capex year-on-year, which is due to increased investments in vacancy reduction.
Deferred tax liabilities in EUR m 06/30/2020 12/31/2019
Valuation of investment properties 561.5 514.3
Other (including netting) -11.7 -17.3
Total 549.8 497.0

2524 Changes in consolidated equity Notes Review report Responsibility statement Financial calendar ContactGroup financials Management report Balance sheet Income statement Statement of comprehensive income Cashflow statement
Financial position and equityThe cash and cash equivalents on the reporting date, and the financial recources shown in the cash flow statement are as follows:
Equity, after consideration of the dividend of EUR 119.9m paid out in May 2020 (previous year: EUR 109.8m), increased by EUR 101.0m in the first six months of the 2020 financial year, mainly due to the positive consolidated result, so that total equity at 30 June 2020 amounts to EUR 2,495.2m (31 December 2019: EUR 2,394.2m). The equity ratio is 41.2% on the reporting date, after 42.4% at 31 December 2019.
Starting with the 2020 financial year, the European Public Real Estate Association (EPRA) changed the definition of net asset value (NAV) and now distinguishes between three different key figures, namely:
• EPRA Reinstatement Value (EPRA NRV), which essentially refers to the reconstruction cost value of the property portfolio, including any transaction costs incurred
• EPRA Net Tangible Assets Value (EPRA NTA), which excludes intangible assets, including goodwill, and
• EPRA Net Disposal Value (EPRA NDV), which assumes a sale of the real estate portfolio and thus also requires a fair value measurement of deferred income taxes and derivative financial instruments.
All ratios must be calculated on a fully diluted basis, i.e. in the case of TAG, taking into consideration the effects of out-standing convertible bonds and potential shares under remuneration programmes.
Unless other best practice developments arise in the industry, TAG will treat the EPRA NTA as its ‘leading NAV indicator’ and communicate it on a quarterly basis. EPRA NRV and EPRA NDV will then be determined on an annual basis as part of the Annual Report.
As of the reporting date, the calculation of the EPRA NTA, also in comparison to the ‘EPRA NAV’ calculated to the end of the 2019 financial year, is as follows:
The main reasons for the increase in the EPRA NTA are the good operating result and the property valuation.
The calculation of the debt ratio loan-to-value (LTV) is shown below:
Of the Group’s total net debt of EUR 2,599.6m, EUR 2,608.4m is attributable to Germany and EUR -8.8m to Poland. The negative net debt in Poland results from cash and cash equivalents of EUR 41.8m, which are offset by lower financial liabilities to banks (EUR 10.6m) and corporate bonds (EUR 22.4m).
Cash and cash equivalents in EUR m 06/30/2020 12/31/2019
Cash and cash equivalents as per balance sheet 176.5 91.3
Restricted cash in banks -3.4 -2.6
Financial recources 173.1 88.7
06/30/2020 12/31/2019
in EUR m NAV old NTA NAV old NTA
Consolidated equity (before non-controlling interests) 2,419.4 2,419.4 2,342.6 2,342.6
Effect from conversion of convertible bond 315.5 315.5 324.2 324.2
NAV/NTA (diluted) 2,734.9 2,734.9 2,666.8 2,666.8
Difference between fair value and book value of properties valued at cost 84.0 84.0 85.2 85.2
Deferred taxes on investment properties and derivative financial instruments 543.4 543.4 492.8 492.8
Fair value of derivative financial instruments 7.0 7.0 6.2 6.2
Intangible assets 0.0 -22.3 0.0 -2.6
EPRA NAV/NTA (diluted) 3,369.3 3,347.0 3,251.0 3,248.4
Number of shares outstanding (diluted, in 000) 161,123 161,123 161,191 161,191
EPRA NAV/NTA per share in EUR (diluted) 20.91 20.77 20.17 20.15
Number of shares outstanding (in 000) 146,269 146,269 146,337 146,337
EPRA NAV/NTA per share in EUR 21.25 21.11 20.45 20.43
in EUR m 06/30/2020 12/31/2019Non-current and current liabilities to banks 2,001.4 1,901.2
Non-current and current liabilities from corporate bonds and other loans 515.1 403.0
Non-current and current liabilities from convertible bonds 259.6 258.9
Cash and cash equivalents -176.5 -91.3
Net financial debt 2,599.6 2,471.8
Book value of investment properties 5,462.3 5,200.0
Book value of property reported under tangible assets 9.5 9.4
Book value of property held as inventory 192.6 58.5
Book value of property reported under non-current assets held for sale 52.7 34.5
Real estate volume 5,717.1 5,302.4
Difference between fair value and book value for properties valued at cost 84.0 85.2
Prepayments made or received on real estate transactions -7.5 130.4
Relevant real estate volume for LTV calculation 5,793.6 5,518.0
LTV 44.9% 44.8%

2726 Changes in consolidated equity Notes Review report Responsibility statement Financial calendar ContactGroup financials Management report Balance sheet Income statement Statement of comprehensive income Cashflow statement
The volume weighted average interest rate on bank loans was further reduced to 1.85% at the reporting date (31 Decem-ber 2019: 1.99%). Total volume weighted average cost of debt (including the interest rates on corporate and convertible bonds, promissory notes and commercial paper) amounted to 1.62% (31 December 2019: 1.73%).
The maturities of all financial liabilities on 30 June 2020 are shown in the following diagram:
The volume weighted average remaining term of bank loans at the reporting date was 8.4 years (31 December 2019: 8.7 years), that of total financial liabilities 7.0 years (31 December 2019: 7.4 years).
Fixed-interest liabilities to banks totalling EUR 409m (Q3 and A4 2020: EUR 103m; 2021: EUR 126m; 2022: EUR 49m; 2023: EUR 131m) will mature in the next 3.5 years or can be refinanced without prepayment penalty when they mature, as the contractual interest commitment is ending. The average interest rate on these bank loans is 2.5% (loans maturing in 2020), 2.7% (loans maturing in 2021), 2.1% (loans maturing in 2022) and 3.3% (loans maturing in 2023). Given the cur-rent significantly lower market interest rates, a further reduction in financing costs is to be expected in subsequent years.
General statement on the business situationIn the first half of 2020, TAG again achieved excellent results with regard to its operating performance. In addition, the financial result improved further over the same period of the previous year. As a result, FFO I rose to EUR 86.5m in the first half of 2020 (prior-year period: EUR 80.3m), EPRA NTA per share was EUR 20.78 on 30 June 2020 compared to EUR 20.17 on 31 December 2019, and LTV remained constant at 44.9% at the end of H2 2020 compared to the end of 2019 (44.8%).
Thus, the Group’s earnings and asset situation continues to show a positive development. TAG also has sufficient liquidity and is financed on a long-term basis.
Employees
The average number of employees at TAG is shown in the following table. Of the employees shown here, 1,188 (previous year: 1,145) are employed in Germany and 124 (previous year: 0) in Poland.
Other information
With the exception of the remuneration of the Company’s governance bodies, there were no business relationships with related parties.
Events after the balance sheet date
There were no significant reportable events after the reporting date.
in EUR m
Bank loans Corporate bonds Promissory notes
Convertible bond Bonds Vantage Bank loans (interest terms ending)
600
400
200
0
2020 2021 2022 2023 2024 2025 2026 2027 >12/31/2027
131125
21259
269125 431
631
9212
34
24643
26210
4980124
23
Employees 01/01-06/30/2020 01/01-06/30/2019
Operational employees 602 554
Administration and central area 194 106
Caretakers 444 416
Craftsmen 72 69
Total 1,312 1,145

2928 Changes in consolidated equity Notes Review report Responsibility statement Financial calendar ContactGroup financials Management report Balance sheet Income statement Statement of comprehensive income Cashflow statement
Outlook, opportunities and risks
Guidance for the 2020 financial yearIts business activities expose TAG to various operational and economic opportunities and risks. Please refer to the detailed presentation in the ‘Outlook, Opportunities and Risks’ section of the Group Management Report for the 2019 financial year for further details on this and regarding the outlook. Beyond these, with the exception of the effects of the Covid-19 pandemic, which are described in the following supplementary report, no significant developments have occur-red or become apparent that would lead to a different assessment of the opportunities and risks.
By their very nature, forward-looking statements are also subject to risks and uncertainties that could cause actual results to differ materially from those expressed in the forward-looking statements. Many of these risks and uncertainties are tied to factors that TAG cannot control, influence or accurately assess. This is the case, for example, when it comes to future market and economic conditions, the behaviour of other market participants, the ability to successfully integrate acquired companies and realise expected synergy effects, and government tax legislation procedures.
The guidance for the 2020 financial year for FFO I, EBT and NAV, which was published in the 2019 Annual Report, remains unchanged and is as follows (in each case excluding results from fair value changes of investment properties and from the valuation of inventory properties, from the valuation of financial derivatives, and excluding deferred tax effects from the use of tax loss carry-forwards, and in each case on an undiluted basis):
• FFO I: EUR 168−170m (2019: EUR 160.6m) or EUR 1.16 per share (2019: EUR 1.10)• EBT: EUR 164−166m (2019: EUR 162.7m) or EUR 1.13 (2019: EUR 1.11) per share • NAV per share (based on the EPRA NAV definition valid on 31 December 2019): EUR 20.60 to EUR 20.80
(31 December 2019: EUR 20.45), after factoring in a dividend payment of EUR 0.82 per share.
The guidance for the development of vacancy (in the residential portfolio, down to 4.3% to 4.5% after 4.9% including the acquisitions as of 31 December 2019 that became effective on 1 January 2020) and for rental growth on a like-for-like basis (2.0% to 2.5% after 2.4% in 2019) also remains unchanged.
For our business activities in Poland, we published our first forecast for the 2020 financial year in the Interim Report as at 31 March 2020. As our revenues in Poland are generated exclusively from property sales this year, this has no impact on the FFO I forecast presented above. With this in mind, we issue the following forecast for our business activities in Poland for the financial year 2020:
• Revenues from the sale of properties held as inventory of EUR 80−85m • Consolidated net profit (before minority interests and excluding effects of purchase price allocation) of EUR 9−11m
or EUR 0.07 per share, i.e. a contribution to the FFO II by means of the business activities in Poland.
Impact of the Covid-19 pandemic on TAG’s business activitiesSince January 2020, the coronavirus has been spreading worldwide; the World Health Organization (WHO) declared an international health emergency on 30 January 2020. Since 11 March, the WHO has classified the spread of the virus as a pandemic (‘Covid-19 pandemic’). This development not only has a repercussions for the health of many people, but also consequences for the economy and for us as a residential real estate company.
Housing is a basic need. As a large housing company we are aware of our responsibilities as a corporate citizen. We realise that our actions have an impact on society, the environment, and the economy. Providing affordable housing has always been our core business – so sustainability is traditionally anchored in our entrepreneurial activities. The current Covid-19 pandemic is a special challenge for all of us, and as a housing company we have a responsibility. Especially towards our tenants, to whom we want to offer a secure home and good service in this difficult situation. Neighbourhood management, which we have been practising for years in many of our residential neighbourhoods, is more important than ever during this time. Which is why, in the time from March through the end of June 2020, we voluntarily refrained from increasing rents by adjusting them to the local comparative rent, giving notice due to loss of income as a result of
the Covid-19 pandemic, and corresponding evictions from occupied housing. Our receivables management teams have always seen themselves as debt advisors and aim to help people in arrears with their rent so that they can continue living in their home. They are also offering instalment payments and deferral agreements during this period and are helping with applications for governmental aid.
The Act to Mitigate the Consequences of the Covid-19 Pandemic in Civil, Insolvency and Criminal Proceedings Law pas-sed by the Bundestag and Bundesrat at the end of March 2020 was of particular relevance for the real estate industry. Among other things, this law stipulated that tenants could not be given notice to 1 July 2020 for rent arrears incurred in the period from 1 April to 30 June 2020 that were due to the effects of the Covid-19 pandemic. The tenants’ obliga-tion to pay the rent remained in force. The option of extending this protection against termination for three months until 30 September 2020 was not exercised. And so, as of 1 July 2020, tenants and landlords have again been subject to the general rules of termination with regard to rent arrears.
The economic consequences of the Covid-19 pandemic and its future development continue to be difficult to assess with any reliability. Even if, given the developments to date, we do not expect any significant negative impact on our business activities, there is still a risk of increased rent losses, even if these are hardly detectable to date. This applies in particular in the event that the economic consequences of the Covid-19 pandemic turn out to be more severe and long-lasting than previously expected.
Beyond this, there is a risk that, e.g. in the event of another lockdown, our targets for reducing vacancies are not achieved because viewings cannot be held as planned. Also, restrictions in the implementation of rent increases, possibly caused by further legal requirements in connection with the Covid-19 pandemic, could negatively impact our rental growth tar-gets. Higher vacancy and lower rental growth would have a negative impact on our rental revenues, at least temporarily.
In Poland, delays in the construction or sale of apartments could result in the event of a renewed lockdown. This could lead to the postponement of rental and sales revenues to later periods.
The Covid-19 pandemic has also led to widening credit spreads in some areas of the financing market and thus tempora-rily made refinancing more expensive. In the event of a renewed strong emergence of crisis-related developments, such as a further lockdown, financing costs could rise again even for companies with an investment grade rating like TAG, which could reduce the profitability of investments.
However, even taking this theoretical risk into consideration, we do not feel the positive future prospects of our business model are at risk. With an average net actual rent of only EUR 5.43 per square meter, our rents remain in the inexpensive and affordable residential segment. Even in the event of a prolonged economic recession, we see this market segment, which forms the core of our business activities, as stable and in demand. We therefore do not expect a fundamental trend reversal, even if the negative effects of the Covid-19 pandemic on the overall economic environment become much more severe.
With regard to the financing side, too, we view our situation as positive and very solidly positioned. on 30 June 2020, we had EUR 176.4m in cash and cash equivalents and credit lines of EUR 120.0m with banks, which have not been used in full. There are no material refinancing activities planned für the financial years 2020 and 2021.
Hamburg, 14 August 2020
Dr. Harboe Vaagt CLO
Martin Thiel CFO
Claudia Hoyer COO

3130 Group financials Management report Balance sheet Income statement Statement of comprehensive income Cashflow statement Changes in consolidated equity Notes Review report Responsibility statement Financial calendar Contact
Assets in TEUR 06/30/2020 12/31/2019
Non-current assets
Investment properties 5,462,314 5,199,993
Intangible assets 22,249 2,629
Property, plant and equipment 32,585 30,926
Right-of-use assets 9,095 9,180
Other financial assets 10,282 9,003
Deferred taxes 49,664 49,730
5,586,188 5,301,461
Current assets
Property held as inventory 192,598 58,452
Other inventories 815 164
Trade receivables 17,342 17,432
Income tax receivables 642 1,431
Other current assets 32,296 10,996
Prepayments on business combinations 0 131,192
Cash and cash equivalents 176,448 91,306
420,139 310,973
Non-current assets held for sale 52,663 34,536
6,058,990 5,646,970
CONSOLIDATED BALANCE SHEET
Equity and liabilities in TEUR 06/30/2020 12/31/2019
Equity
Subscribed capital 146,269 146,337
Share premium 520,635 522,985
Other reserves -5,492 1,035
Retained earnings 1,757,975 1,672,212
Attributable to the equity holders of the parent company 2,419,387 2,342,569
Attributable to non-controlling interests 75,813 51,667
2,495,200 2,394,236
Non-current liabilities
Liabilities to banks 1,913,411 1,788,324
Liabilities from corporate bonds and other loans 350,533 350,354
Liabilities from convertible bonds 259,018 258,329
Derivative financial instruments 62,914 71,508
Retirement benefit provisions 5,622 5,799
Other non-current liabilities 23,412 17,048
Deferred taxes 549,819 497,027
3,164,729 2,988,389
Current liabilities
Liabilities to banks 87,979 112,872
Liabilities from corporate bonds and other loans 164,525 52,622
Liabilities from convertible bonds 546 546
Income tax liabilities 14,322 11,908
Other provisions 25,338 22,824
Trade payables 26,909 21,797
Other current liabilities 78,641 41,001
398,260 263,570
Liabilities associated with non-current assets held for sale 802 775
6,058,990 5,646,970

3332 Group financials Management report Balance sheet Income statement Statement of comprehensive income Cashflow statement Changes in consolidated equity Notes Review report Responsibility statement Financial calendar Contact
CONSOLIDATED STATEMENT OF COMPREHENSIVE INCOME
in TEUR01/01-
06/30/202001/01-
06/30/201904/01-
06/30/202004/01-
06/30/2019
Net income as shown in the income statement 212,838 233,737 180,712 200,436
Items that will later be classified as expense
Unrealised gains and losses from hedge accounting 0 0 0 0
Currency differences of foreign subsidiaries -7,411 0 1,966 0
Deferred taxes on unrealised gains and losses 0 0 0 0
Other comprehensive income after taxes -7,411 0 1,966 0
Total comprehensive income 205,427 233,737 184,644 200,436
attributable to non-controlling interests 6,250 6,390 5,414 5,460
attributable to equity holders of the parent company 199,177 227,347 179,230 194,976
in TEUR01/01/-
06/30/202001/01/-
06/30/201904/01/-
06/30/202004/01/-
06/30/2019
Rental income 213,032 205,070 104,171 98,666
Impairment losses -1,904 -2,218 -1,115 -1,227
Rental expense -78,088 -74,881 -35,993 -33,006
Net rental income 133,040 127,971 67,063 64,433
Revenues from the sale of real estate 22,982 5,776 9,191 1,370
Expenses on the sale of real estate -24,374 -5,574 -9,562 -1,122
Sales result -1,392 201 -371 248
Revenues from services 28,295 24,758 14,284 12,779
Impairment losses -239 -263 -157 -152
Expenses from property services -15,349 -14,655 -7,217 -7,644
Services result 12,707 9,840 6,910 4,983
Other operating income 2,874 1,755 1,304 1,107
Fair value changes in investment properties andvaluation of properties held as inventory 172,387 211,429 173,328 211,454
Personnel expense -28,094 -24,289 -14,171 -12,373
Depreciation / amortisation -3,438 -3,122 -1,782 -1,593
Other operating expense -9,295 -8,276 -4,161 -4,232
EBIT 278,788 315,509 228,119 264,027
Other financial result 1,367 375 544 305
Interest income 9,859 232 9,656 117
Interest expense -25,564 -32,492 -12,805 -19,995
EBT 264,450 283,624 225,514 244,454
Income taxes -51,612 -49,886 -44,802 -44,018
Consolidated net income 212,838 233,737 180,712 200,436
attributable to non-controlling interests 7,134 6,390 6,298 5,460
attributable to equityholders of the parent company 205,704 227,347 174,414 194,976
Earnings per share (in EUR)
Basic earnings per share 1.41 1.55 1.20 1.33
Diluted earnings per share 1.32 1.46 1.12 1.21
CONSOLIDATED INCOME STATEMENT

3534 Group financials Management report Balance sheet Income statement Statement of comprehensive income Cashflow statement Changes in consolidated equity Notes Review report Responsibility statement Financial calendar Contact
CONSOLIDATED CASH FLOW STATEMENT
in TEUR 01/01-06/30/2020 01/01-06/30/2019
Consolidated net income 212,838 233,737
Net interest income / expense through profit and loss 15,705 32,260
Current income taxes through profit and loss 5,622 2,551
Depreciation / amortisation 3,438 3,122
Other financial result - 1,367 - 375
Fair value changes in investment properties andvaluation of properties held as inventory - 172,387 - 211,429
Result from the disposal of investment properties 300 42
Result from the disposal of other non-current assets - 15 3
Impairments accounts receivables 2,143 2,481
Changes to deferred taxes 45,991 47,335
Changes in provisions 2,337 705
Interest received 420 0
Interest paid - 28,523 - 25,245
Income tax payments - 2,998 1,726
Changes in receivables and other assets - 36,327 - 11,332
Changes in payables and other liabilities 10,232 3,692
Cash flow from operating activities 57,409 79,273
in TEUR 01/01-06/30/2020 01/01-06/30/2019
Payments received from the disposal of investment properties (less selling costs) 12,990 4,411
Payments made for investments in investment properties - 96,994 - 34,280
Cash and cash equivalents acquired of company acquisitions 68,642 0
Payments received from the disposal of intangible assets and pro-perty, plant and equipment 15 5
Payments made for investments in intangible assets and property, plant and equipment - 1,484 - 3,958
Payments received from other financial assets 434 165
Cash flow from investing activities - 16,397 - 33,657
Purchase of treasury shares - 2,162 0
Proceeds from the issuance of treasury shares 0 317
Dividends paid - 119,941 - 109,754
Distribution to minority investors 0 - 300
Payments made for the purchase of minority interest - 6 - 44
Payments made for the repayment of corporate bonds - 82,977 - 35,000
Proceeds from the issuance of corporate bonds 158,937 151,332
Proceeds from new bank loans 176,238 34,430
Repayment of bank loans - 82,677 - 31,269
Repayment of lease liabilities - 1,302 - 827
Cash flow from financing activities 46,110 8,885
Net change in cash and cash equivalents 87,122 54,501
Cash and cash equivalents at the beginning of the period 88,686 89,016
Currency differences - 2,720 0
Cash and cash equivalents at the end of the period 173,088 143,517

3736 Group financials Management report Balance sheet Income statement Statement of comprehensive income Cashflow statement Changes in consolidated equity Notes Review report Responsibility statement Financial calendar Contact
STATEMENT OF CHANGES IN CONSOLIDATED EQUITY
Attributable to the parent’s shareholders
Other reserves
in TEUR
Subscri-bed
capitalShare
premiumRe tainedearnings
Currencydiffer- ences
Hedgeaccoun-
tingreserve
Retainedearnings Total
Non- control-
linginterests
Totalequity
Amount on 01/01/2020 146,337 522,985 1,035 0 0 1,672,212 2,342,569 51,667 2,394,236
Consolidated net income 0 0 0 0 0 205,704 205,704 7,134 212,838
Other comprehensive income 0 0 0 -6,527 0 0 -6,527 -884 -7,411
Total comprehensive income 0 0 0 -6,527 0 205,704 199,177 6,250 205,427
Colonia settlement offer 0 -343 0 0 0 0 -343 0 -343
Purchase of treasury shares -100 -2,059 0 0 0 0 -2,159 0 -2,159
Costs related to purchase of treasury shares 0 -3 0 0 0 0 -3 0 -3
Share-based compensation 32 55 0 0 0 0 87 0 87
Dividends paid 0 0 0 0 0 -119,941 -119,941 0 -119,941
Acquisition of Vantage Development S.A. 0 0 0 0 0 0 0 17,896 17,896
Amount on 06/30/2020 146,269 520,635 1,035 -6,527 0 1,757,975 2,419,387 75,813 2,495,200
Amount on 01/01/2019 146,322 773,417 1,035 0 0 1,085,705 2,006,479 41,847 2,048,326
Total comprehensive income 0 0 0 0 0 227,347 227,347 6,390 233,737
Colonia settlement offer 0 -284 0 0 0 0 -284 0 -284
Disposal of minority interests 15 302 0 0 0 0 317 0 317
Share-based compensation 0 68 0 0 0 0 68 0 68
Dividends paid 0 0 0 0 0 -109,754 -109,754 -300 -110,054
Amount on 06/30/2019 146,337 773,503 1,035 0 0 1,203,298 2,124,174 47,938 2,172,113
3938 Group financials Management report Balance sheet Income statement Statement of comprehensive income Cashflow statement Changes in consolidated equity Notes Review report Responsibility statement Financial calendar Contact
General information
These abridged consolidated interim financial statements have been prepared by TAG Immobilien AG (hereinafter referred to as the “Company” or “TAG”) in accordance with the provisions contained in Section 115 in connection with Section 117 of the German Securities Trading Act (WpHG) pertaining to interim financial reporting. The period under review comprises the first six months of 2020. The comparison figures refer to 31 December 2019 with respect to the consolidated balance sheet and otherwise to the first six months of 2019. In addition, the consolidated income statement and the consolidated statement of comprehensive income contain figures pertaining to the second quarter of 2020 together with the corres-ponding comparison figures for the same period of the previous year.
The consolidated interim financial statements have been prepared in accordance with the International Financial Repor-ting Standards (IFRS) in the version endorsed for application in the EU concerning interim reporting (IAS 34 – Interim Reporting) subject to mandatory application as of the reporting date. The figures reported in the consolidated interim financial statements are mostly denominated in EUR m (millions of euros) or TEUR (thousands of euros). This may result in rounding differences between the individual parts of the financial statements.
Consolidation groupOn 8 November 2019, TAG signed a contract for the acquisition of all the shares in Vantage Development S.A. (“Van-tage”). Vantage is a real estate developer with headquarters and its primary business in Wroclaw in the western part of Poland. As of the date of acquisition, Vantage’s firm project pipeline consisted of several residential projects with a total of approximately 5,300 units. The acquisition of the shares in Vantage became legally effective on 13 January 2020 (acquisition date). On the basis of a takeover bid price of PLN 11.50 per share, the total transaction price (based on a PLN/EUR exchange rate of 4.235) came to PLN 558.5m (EUR 131.9m), of which PLN 197.0m (EUR 46.5m) was returned to Vantage, and thus indirectly to TAG, following the carve-out of the commercial real estate business which was sold back to the previous shareholders. Accordingly, the net purchase price payable for the residential real estate business and the Vantage Development plat-form amounts to PLN 361.5m (EUR 85.4m) and was financed entirely from TAG’s existing liquidity position. In addition, transaction costs, particularly legal and consulting fees, of EUR 1.0m were incurred and recognised within other opera-ting expenses in the income statement.
NOTESSELECTED EXPLANATORY NOTES ON THE ABRIDGED CONSOLIDATED INTERIM FINANCIAL STATEMENTS AS OF 30 JUNE 2020
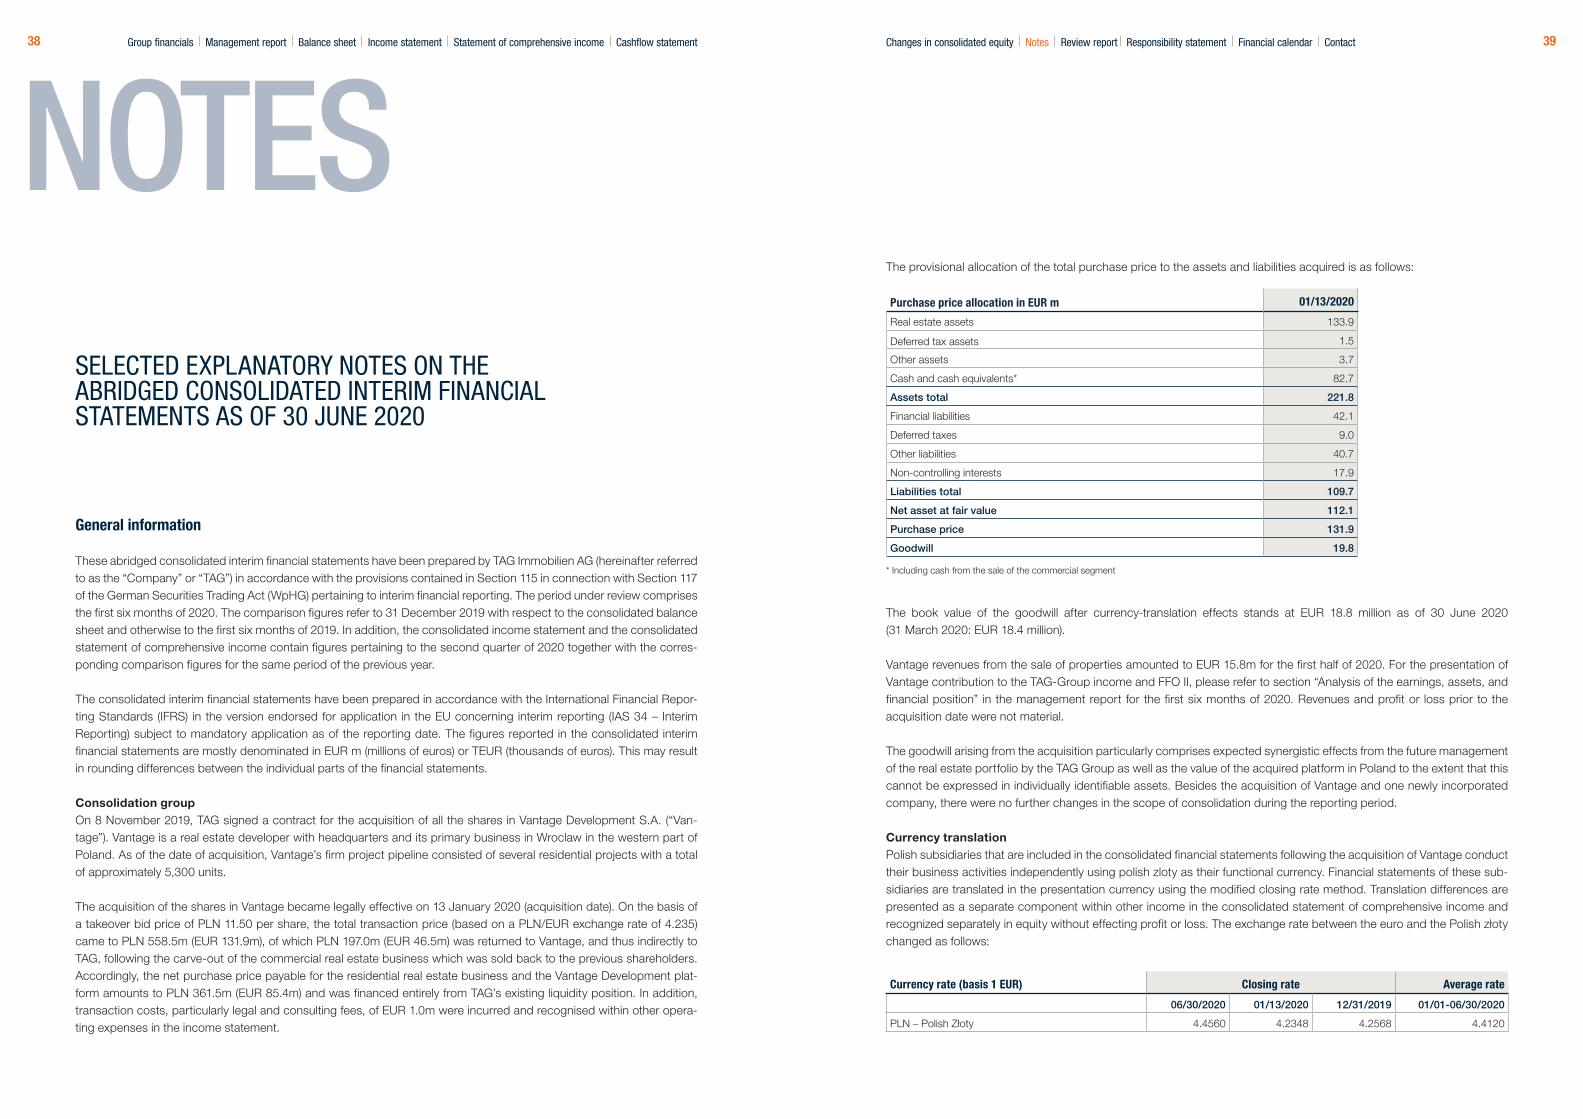
The provisional allocation of the total purchase price to the assets and liabilities acquired is as follows:
The book value of the goodwill after currency-translation effects stands at EUR 18.8 million as of 30 June 2020 (31 March 2020: EUR 18.4 million).
Vantage revenues from the sale of properties amounted to EUR 15.8m for the first half of 2020. For the presentation of Vantage contribution to the TAG-Group income and FFO II, please refer to section “Analysis of the earnings, assets, and financial position” in the management report for the first six months of 2020. Revenues and profit or loss prior to the acquisition date were not material.
The goodwill arising from the acquisition particularly comprises expected synergistic effects from the future management of the real estate portfolio by the TAG Group as well as the value of the acquired platform in Poland to the extent that this cannot be expressed in individually identifiable assets. Besides the acquisition of Vantage and one newly incorporated company, there were no further changes in the scope of consolidation during the reporting period.
Currency translationPolish subsidiaries that are included in the consolidated financial statements following the acquisition of Vantage conduct their business activities independently using polish zloty as their functional currency. Financial statements of these sub-sidiaries are translated in the presentation currency using the modified closing rate method. Translation differences are presented as a separate component within other income in the consolidated statement of comprehensive income and recognized separately in equity without effecting profit or loss. The exchange rate between the euro and the Polish złoty changed as follows:
Currency rate (basis 1 EUR) Closing rate Average rate
06/30/2020 01/13/2020 12/31/2019 01/01-06/30/2020
PLN – Polish Złoty 4.4560 4.2348 4.2568 4.4120
Purchase price allocation in EUR m 01/13/2020
Real estate assets 133.9
Deferred tax assets 1.5
Other assets 3.7
Cash and cash equivalents* 82.7
Assets total 221.8
Financial liabilities 42.1
Deferred taxes 9.0
Other liabilities 40.7
Non-controlling interests 17.9
Liabilities total 109.7
Net asset at fair value 112.1
Purchase price 131.9
Goodwill 19.8
* Including cash from the sale of the commercial segment
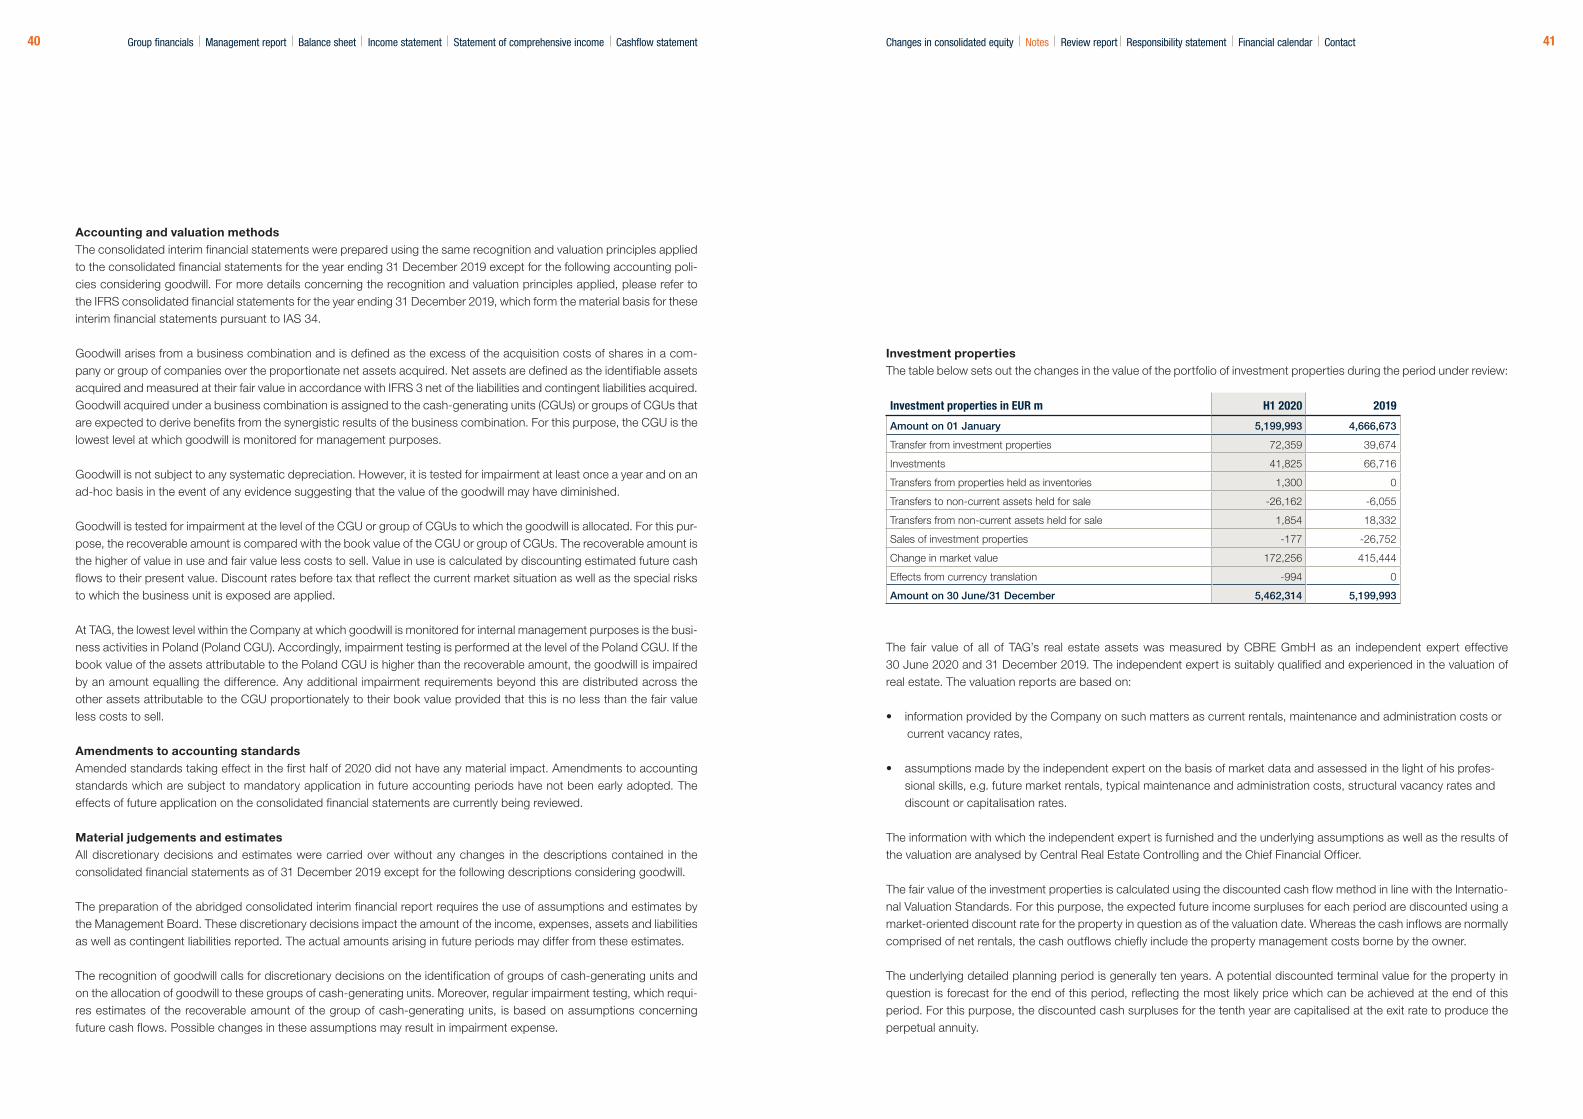
4140
Accounting and valuation methodsThe consolidated interim financial statements were prepared using the same recognition and valuation principles applied to the consolidated financial statements for the year ending 31 December 2019 except for the following accounting poli-cies considering goodwill. For more details concerning the recognition and valuation principles applied, please refer to the IFRS consolidated financial statements for the year ending 31 December 2019, which form the material basis for these interim financial statements pursuant to IAS 34.
Goodwill arises from a business combination and is defined as the excess of the acquisition costs of shares in a com-pany or group of companies over the proportionate net assets acquired. Net assets are defined as the identifiable assets acquired and measured at their fair value in accordance with IFRS 3 net of the liabilities and contingent liabilities acquired.Goodwill acquired under a business combination is assigned to the cash-generating units (CGUs) or groups of CGUs that are expected to derive benefits from the synergistic results of the business combination. For this purpose, the CGU is the lowest level at which goodwill is monitored for management purposes.
Goodwill is not subject to any systematic depreciation. However, it is tested for impairment at least once a year and on an ad-hoc basis in the event of any evidence suggesting that the value of the goodwill may have diminished.
Goodwill is tested for impairment at the level of the CGU or group of CGUs to which the goodwill is allocated. For this pur-pose, the recoverable amount is compared with the book value of the CGU or group of CGUs. The recoverable amount is the higher of value in use and fair value less costs to sell. Value in use is calculated by discounting estimated future cash flows to their present value. Discount rates before tax that reflect the current market situation as well as the special risks to which the business unit is exposed are applied.
At TAG, the lowest level within the Company at which goodwill is monitored for internal management purposes is the busi-ness activities in Poland (Poland CGU). Accordingly, impairment testing is performed at the level of the Poland CGU. If the book value of the assets attributable to the Poland CGU is higher than the recoverable amount, the goodwill is impaired by an amount equalling the difference. Any additional impairment requirements beyond this are distributed across the other assets attributable to the CGU proportionately to their book value provided that this is no less than the fair value less costs to sell.
Amendments to accounting standardsAmended standards taking effect in the first half of 2020 did not have any material impact. Amendments to accounting standards which are subject to mandatory application in future accounting periods have not been early adopted. The effects of future application on the consolidated financial statements are currently being reviewed.
Material judgements and estimatesAll discretionary decisions and estimates were carried over without any changes in the descriptions contained in the consolidated financial statements as of 31 December 2019 except for the following descriptions considering goodwill.
The preparation of the abridged consolidated interim financial report requires the use of assumptions and estimates by the Management Board. These discretionary decisions impact the amount of the income, expenses, assets and liabilities as well as contingent liabilities reported. The actual amounts arising in future periods may differ from these estimates.
The recognition of goodwill calls for discretionary decisions on the identification of groups of cash-generating units and on the allocation of goodwill to these groups of cash-generating units. Moreover, regular impairment testing, which requi-res estimates of the recoverable amount of the group of cash-generating units, is based on assumptions concerning future cash flows. Possible changes in these assumptions may result in impairment expense.
Investment propertiesThe table below sets out the changes in the value of the portfolio of investment properties during the period under review:
The fair value of all of TAG’s real estate assets was measured by CBRE GmbH as an independent expert effective 30 June 2020 and 31 December 2019. The independent expert is suitably qualified and experienced in the valuation of real estate. The valuation reports are based on:
• i nformation provided by the Company on such matters as current rentals, maintenance and administration costs or current vacancy rates,
• assumptions made by the independent expert on the basis of market data and assessed in the light of his profes-sional skills, e.g. future market rentals, typical maintenance and administration costs, structural vacancy rates and discount or capitalisation rates.
The information with which the independent expert is furnished and the underlying assumptions as well as the results of the valuation are analysed by Central Real Estate Controlling and the Chief Financial Officer.
The fair value of the investment properties is calculated using the discounted cash flow method in line with the Internatio-nal Valuation Standards. For this purpose, the expected future income surpluses for each period are discounted using a market-oriented discount rate for the property in question as of the valuation date. Whereas the cash inflows are normally comprised of net rentals, the cash outflows chiefly include the property management costs borne by the owner.
The underlying detailed planning period is generally ten years. A potential discounted terminal value for the property in question is forecast for the end of this period, reflecting the most likely price which can be achieved at the end of this period. For this purpose, the discounted cash surpluses for the tenth year are capitalised at the exit rate to produce the perpetual annuity.
Group financials Management report Balance sheet Income statement Statement of comprehensive income Cashflow statement Changes in consolidated equity Notes Review report Responsibility statement Financial calendar Contact
Investment properties in EUR m H1 2020 2019
Amount on 01 January 5,199,993 4,666,673
Transfer from investment properties 72,359 39,674
Investments 41,825 66,716
Transfers from properties held as inventories 1,300 0
Transfers to non-current assets held for sale -26,162 -6,055
Transfers from non-current assets held for sale 1,854 18,332
Sales of investment properties -177 -26,752
Change in market value 172,256 415,444
Effects from currency translation -994 0
Amount on 30 June/31 December 5,462,314 5,199,993

4342
The sum total of the discounted cash surpluses and the discounted potential selling value equals the gross present value of the property in question. The net present value is calculated by deducting the costs arising in an orderly transaction. The following table sets out the fair value of the investment properties per region and the material assumptions underlying this valuation method:
In addition, there are activities that cannot be directly allocated to the regions and their respective managers. These take the form of the serviced apartments operated by the Group and commercial real estate assets with a market value of EUR 22.9 million (previous year: EUR 21.9 million) as well as development projects in Poland within the investment properties with a value of EUR 31.1 million.
The assumptions underlying the valuation of the fair value of the real estate are made by the independent valuer on the basis of his professional experience and are subject to uncertainty. The effects of possible fluctuations in the valuation parameters are shown in the following table in the form of a sensitivity analysis:
Possible interdependencies between the individual parameters are of secondary importance or cannot be determined due to their complexity.
Segment Berlin Chemnitz Dresden Rhine -Ruhr Erfurt
06/30/ 2020
12/31/ 2019
06/30/ 2020
12/31/ 2019
06/30/ 2020
12/31/ 2019
06/30/ 2020
12/31/ 2019
06/30/ 2020
12/31/ 2019
Market value (in EUR m) 792.4 772.8 371.8 347.1 555.5 527.1 331.8 317.7 680.7 666.7
Net actual rent p.a. (in EUR m) 40.8 41.3 24.6 24.5 28.1 27.9 18.3 18.2 38.9 37.8
Vacancy (in %) 4.5 4.0 8.2 8.4 2.4 2.4 3.5 2.9 3.9 3.6
Valuation parameters (average)
Net actual rent to market rent (in %) 88 88 95 94 92 92 92 92 93 92
Increase in market rent p. a. (in %) 1.1 1.1 0.6 0.6 1.2 1.0 1.2 1.1 1.1 1.1
Maintenance costs (in EUR / sqm) 8.9 8.9 8.8 8.8 9.1 9.1 9.0 9.1 9.5 9.5
Administration costs (in EUR per unit) 221 221 234 234 245 245 260 259 228 228
Structural vacancy (in %) 3.4 3.4 4.5 4.5 2.7 2.7 1.7 1.7 2.0 2.0
Discount rate (in %) 4.8 4.9 5.2 5.3 5.0 5.1 5.0 5.2 4.9 5.0
Capitalisation rate (in %) 3.6 3.8 4.6 4.7 3.7 3.9 3.8 4.0 3.9 3.9
Segment Gera Hamburg Leipzig Rostock Salzgitter
06/30/ 2020
12/31/ 2019
06/30/ 2020
12/31/ 2019
06/30/ 2020
12/31/ 2019
06/30/ 2020
12/31/ 2019
06/30/ 2020
12/31/ 2019
Market value (in EUR m) 435.4 429.9 580.7 549.6 623.4 568.3 490.3 473.7 546.3 525.1
Net actual rent p.a. (in EUR m) 32.3 32.2 29.7 29.2 37.6 36.0 29.6 28.4 35.2 34.9
Vacancy (in %) 7.6 7.7 4.2 4.8 6.6 6.3 4.4 4.1 5.4 5.5
Valuation parameters (average)
Net actual rent to market rent (in %) 93 92 93 92 92 91 92 92 97 97
Increase in market rent p. a. (in %) 0.6 0.6 1.2 1.1 0.8 0.9 0.8 0.8 0.8 0.8
Maintenance costs (in EUR / sqm) 9.0 9.0 8.4 8.4 8.8 8.8 8.9 8.9 9.1 9.1
Administration costs (in EUR per unit) 238 238 245 245 234 235 242 244 245 244
Structural vacancy (in %) 4.8 4.8 1.6 1.6 4.0 4.0 3.3 3.3 2.2 2.2
Discount rate (in %) 5.5 5.6 5.0 5.1 5.1 5.2 4.8 4.9 5.2 5.3
Capitalisation rate (in %) 4.9 4.9 3.7 3.8 4.2 4.3 4.0 4.1 4.4 4.5
Sensitivity analysis in EUR m 06/30/2020 12/31/2019
Market value investment properties 5,462 5,200
Change in market value due to adjustments of parameters
Market rent (+ / - 2.0%) 84/-90 79/-83
Increase in market rent (+ / - 0.2%) 335/-300 308/-277
Maintenance costs (- / + 10%) 111/-112 106/-106
Administration costs (- / + 10%) 47/-47 47/-49
Structural vacancy (- / + 1.0%) 91/-88 83/-84
Discount and capitalisation rate (- / + 0.5%) 832/-632 759/-582
Group financials Management report Balance sheet Income statement Statement of comprehensive income Cashflow statement Changes in consolidated equity Notes Review report Responsibility statement Financial calendar Contact

4544
Non-current assets held for saleNon-current assets held for sale are composed solely of real estate assets previously classified as investment properties that are outside the Group’s strategic core portfolio and are therefore to be sold.
The table below sets out the movements in this item:
Sales contracts have already been signed for a portion valued at EUR 11.4 million (previous year: EUR 9.9 million), with ownership, rights of use and liabilities expected to be transferred in the second half of 2020 in most cases.
The assets are allocated to Level 3 of the fair value hierarchy and their value is measured on the basis of the independent expert’s report. The procedure underlying the calculation as well as the main valuation inputs are described in the notes on investment properties.
Liabilities in connection with the assets held for sale comprise lease liabilities under leasehold rights.
Revenue from contracts with customersRevenue from contracts with customers as defined in IFRS 15 is composed of the externally generated utility and ancil-lary costs reported as rental revenue and the internally generated operating and ancillary costs reported in net service income, plus recharged proportionate land tax and building insurance, as well as other service income. In addition, pro-ceeds from the sale of investment properties or inventory real estate constitute revenue within the meaning of IFRS 15. Revenue is categorised in accordance with the disclosures contained in the Group management report.
Further informationDetails of further events and transactions during the period under review, the Group’s net assets, financial conditions and results of operations and other disclosures can be found in the Group management report.
Notes on segment reporting
TAG manages its residential portfolio on a regional basis and has divided its real estate holdings in the “Rental” segment into the following regions: Berlin, Chemnitz, Dresden, Erfurt, Gera, Hamburg, Leipzig, Rhein-Ruhr, Rostock, Salzgitter and other activities. The “other activities” segment is composed of various rented commercial real estate assets as well as the serviced apartments operated by TAG. The business activities of these segments are based on the rental of portfolio properties to TAG customers. Accordingly, they are reported at an aggregated level within the rental segment.
The “Services” segment includes the business activities attributable to the internal service companies. In addition to ren-tal business, TAG has been expanding its activities in real-estate-related services over the past few years. This explains the aggregated disclosure of information for the rental and services segment since the end of 2019. The comparison figures in the segment report for the first half of 2019 have been duly restated.
In view of the currently low volumes involved, TAG’s business activities in Poland and selling business in Germany do not constitute distinct reportable segments and are included in other.
Segment reporting is consistent with internal reporting, which fundamentally conforms to IFRS accounting requirements (with the exception of the reconciliation of segment earnings II with EBIT described below). Segment earnings I are deri-ved from the recognised segment revenue. Segment earnings II includes the attributable personnel expenses and other income and expenses and is calculated as follows:
Non-current assets held for sale in TEUR H1 2020 2019
Amount on 1 January 34,536 86,995
Reclassification from investment properties 26,162 6,055
Investments 44 243
Changes in market value 168 -1,402
Sales -6,393 -39,023
Reclassification from investment properties -1,854 -18,332
Amount on 31 December 52,663 34,536
Group financials Management report Balance sheet Income statement Statement of comprehensive income Cashflow statement Changes in consolidated equity Notes Review report Responsibility statement Financial calendar Contact
Segment report Rental Services Other Total
Segment revenuesH1 2020 159,702 26,936 22,982 209,620
H1 2019 157,292 23,583 5,776 186,651
Segment expensesH1 2020 -35,543 -14,229 -24,374 -74,146
H1 2019 -34,945 -13,743 -5,574 -54,262
Rental expensesH1 2020 -5,525 0 0 -5,525
H1 2019 -5,817 0 0 -5,817
Investment costsH1 2020 -28,908 0 0 -28,908
H1 2019 -27,833 0 0 -27,833
Impairment losses on receivablesH1 2020 -1,904 -239 0 -2,143
H1 2019 -2,218 -263 0 -2,481
Service expensesH1 2020 0 -13,990 0 -13,990
H1 2019 0 -13,480 0 -13,480
Other revenuesH1 2020 794 0 0 794
H1 2019 923 0 0 923
Segment result IH1 2020 124,159 12,707 -1,392 135,474
H1 2019 122,347 9,840 201 132,388
Personnel expensesH1 2020 -8,841 -8,329 0 -17,170
H1 2019 -8,495 -7,587 0 -16,082
Other income/other expensesH1 2020 -1,819 1,078 0 -741
H1 2019 -1,394 1,122 0 -272
Segment result IIH1 2020 113,499 5,456 -1,392 117,563
H1 2019 112,458 3,375 201 116,034
Segment assets06/30/2020 5,495,470 0 221,641 5,717,111
12/31/2019 5,248,270 0 54,085 5,302,355

4746
Revenue arising from business activities between the segments is primarily generated by internal services provided by TAG service companies for TAG’s companies operating in the rental segment.
Reflecting internal reporting practices, rental segment revenue is reported solely on a net basis. In line with internal repor-ting practices, revenues in the services segment comprise the revenues generated by the internal service companies less land tax and building insurance in accordance with IFRS 15. Reference should be made to the section on revenue in the management report for the reconciliation with the respective items of profit and loss.
The following table reconciles segment earnings II with EBT as stated in the income statement:
Disclosures on fair values and financial instrumentsThe fair value of assets and liabilities is determined by using inputs which are as market-oriented as possible. The valua-tion hierarchy divides the input factors into three levels depending on the availability of data:
• Level 1: Prices quoted in active markets for identical assets or liabilities (such as share prices)• Level 2: Inputs other than quoted prices included within Level 1 that are observable for the asset or liability,
either directly (i.e. as prices) or indirectly (i.e. derived from prices)• Level 3: Valuation techniques for which any significant input is not based on observable market data
If input factors for different hierarchical levels are applied, the fair value is calculated on the basis of the lower hierarchical level. There were no transfers between the individual hierarchical levels in the period under review.
The fair values of the financial instruments recorded in the consolidated balance sheet break down as follows:
The changes of the book value of other financial assets allocated to level 3 are based on additions and disposals of TEUR -55 (previous year: TEUR -63) and changes in fair value through profit and loss of TEUR 74 (previous year: TEUR 75).
They primarily comprise non-listed minority interests in real estate companies and funds. Equity investments are mea-sured partially on the basis of observable market prices (Level 2) and partially on the basis of company-specific models such as customary net asset value models in the light of non-observable market data (Level 3). The inputs used in these methods include assumptions on future cash flows and future real estate prices and are based as closely as possible on market data. A change in the fair value of real estate assets held by associates would have a proportionate effect on the fair value of such associates. At the moment, there is no specific intention for these investments to be sold.
Segment earnings in TEUR 01/01-06/30/2020 01/01-06/30/2019
Segment earnings II 117,563 115,833
Capitalised investment costs not deductedfrom segment earnings 12,042 11,152
Non-allocated ancillary costs of vacant real estate -3,215 -5,621
Fair value changes in investment properties and valuation ofproperties held as inventory 172,387 211,429
Non-allocated personnel expenses -10,924 -8,207
Depreciation -3,438 -3,122
Other non-allocated income and expenses -5,627 -6,156
Net finance expense -14,338 -31,885
EBT 264,450 283,624
Fair values of financial instruments in TEUR Fair value hierarchy 06/30/2020 2019
Assets
Other financial assets Level 2 5,033 4,793
Other financial assets Level 3 5,867 3,848
Equity and liabilities
Derivatives with no hedging relationship Level 2 62,914 71,508
Group financials Management report Balance sheet Income statement Statement of comprehensive income Cashflow statement Changes in consolidated equity Notes Review report Responsibility statement Financial calendar Contact

4948 Group financials Management report Balance sheet Income statement Statement of comprehensive income Cashflow statement
Derivative financial instruments are measured using established methods, the main inputs for which are derived from active markets. The purchase price guarantees, which are recognised as a derivative financial instrument with no hedging relationship, are measured using a standardised process based on a Monte Carlo (mark-to-model) simulation applying two correlated stochastic processes. The conversion right under the convertible bond, which is recognised separately as a derivative, is measured using a binomial model.
In addition, the following financial instruments whose book values are not sufficiently close to their fair value are measured at amortised cost in the consolidated balance sheet:
The fair value of non-current liabilities is calculated as a present value using the discounted cash flow method. The dis-count rate is based on a market interest rate with matching maturities and risks.
Trade receivables, other current assets and cash and cash equivalents, which are also recognised at historical cost, have short settlement periods. Accordingly, their book value as of the balance sheet date comes close to their fair value. The same thing applies to trade payables and other current liabilities.
Financial risk management
In the light of the uncertainties surrounding the economic impact of the Covid-19 pandemic, the Company has carried out an analysis of the effects of generally impaired creditworthiness on the future risk of rental defaults. On the basis of actual default rates in the second quarter of 2020 and the existing procedure in the light of receivables, deposits and gross rents, there is no evidence of any significant increase in the expected receivables‘ default risk, so that an adjustment of the estimate of expected credit losses is not necessary as of 30 June 2020.
Other thank this, there were no material changes in the Group’s financial risks (interest, credit, liquidity and finance risk) in the period under review compared with 31 December 2019.
Material events after the end of the period covered by this interim report
No reportable events occurred after the end of the period covered by this interim report.
Hamburg, 14 August 2020
06/30/2020 12/31/2019
Financial instruments in TEURIFRS 13
Valuation Book value Fair value Book value Fair value
Liabilities to banks Level 2 2,001,390 2,099,411 1,901,196 1,977,963
Liabilities from corporate bonds and other loans Level 2 515,058 519,510 402,976 405,856
Liabilities from convertible bonds Level 2 259,563 268,540 258,875 262,493
Lease liabilities Level 2 17,493 18,103 14,041 14,531
Dr. Harboe Vaagt CLO
Martin Thiel CFO
Claudia Hoyer COO
Changes in consolidated equity Notes Review report Responsibility statement Financial calendar ContactChanges in consoli

5150
To TAG Immobilien AG, Hamburg
We have reviewed the condensed interim consolidated financial statements of the TAG Immobilien AG – comprising consolidated balance sheet, consolidated income statement, consolidated statement of comprehensive income, conso-lidated cashflow statement, statement of changes in consolidated equity and notes on the abriged consolidated interim financial statement as of June 30, 2020 together with the interim group management report of the TAG Immobilien AG, Hamburg, for the period from January 1 to June 30, 2020 that are part of the semi annual financial report according to § 115 WpHG [„Wertpapierhandelsgesetz“: „German Securities Trading Act“]. The preparation of the condensed inte-rim consolidated financial statements in accordance with International Accounting Standard IAS 34 „Interim Financial Reporting“ as adopted by the EU, and of the interim group management report in accordance with the requirements of the WpHG applicable to interim group management reports, is the responsibility of the Company’s management. Our responsibility is to issue a report on the condensed interim consolidated financial statements and on the interim group management report based on our review.
We performed our review of the condensed interim consolidated financial statements and the interim group management report in accordance with the German generally accepted standards for the review of financial statements promulgated by the Institut der Wirtschaftsprüfer (IDW). Those standards require that we plan and perform the review so that we can preclude through critical evaluation, with a certain level of assurance, that the condensed interim consolidated financial statements have not been prepared, in material respects, in accordance with IAS 34 „Interim Financial Reporting“ as adopted by the EU, and that the interim group management report has not been prepared, in material respects, in accor-dance with the requirements of the WpHG applicable to interim group management reports. A review is limited primarily to inquiries of company employees and analytical assessments and therefore does not provide the assurance attainable in a financial statement audit. Since, in accordance with our engagement, we have not performed a financial statement audit, we cannot issue an auditor’s report.
Based on our review, no matters have come to our attention that cause us to presume that the condensed interim con-solidated financial statements have not been prepared, in material respects, in accordance with IAS 34 „Interim Financial Reporting“ as adopted by the EU, or that the interim group management report has not been prepared, in material res-pects, in accordance with the requirements of the WpHG applicable to interim group management reports.
Hamburg, 14 August 2020
KPMG AGWirtschaftsprüfungsgesellschaft
ThiedeWirtschaftsprüfer
BagehornWirtschaftsprüfer
RESPONSIBILITY STATEMENT
To the best of our knowledge, and in accordance with the applicable reporting principles for financial reporting, the consolidated interim financial report gives a true and fair view of the Group’s assets, financial position and earnings situation, and the group management report includes a fair review of the development and performance of the business and the Group’s situation, as well as a description of the principal opportunities and risks associated with the expected development of the Group in the remaining financial year.
Hamburg, 14 August 2020
REVIEW REPORT
Dr. Harboe Vaagt CLO
Martin Thiel CFO
Claudia Hoyer COO
Dr. Harboe Vaagt CLO
Martin Thiel CFO
Claudia Hoyer COO
Group financials Management report Balance sheet Income statement Statement of comprehensive income Cashflow statement Changes in consolidated equity Notes Review report Responsibility statement Financial calendar Contact

5352 Changes in consolidated equity Notes Review report Responsibility statement Financial calendar ContactGroup financials Management report Balance sheet Income statement Statement of comprehensive income Cashflow statement
TAG FINANCIAL CALENDAR 2020
Publications/Events
12 November 2020 Publication of Interim Statement Q3 2020
Conferences
20 August 2020 HSBC European Real Estate Conference (virtual)
03 September 2020 Commerzbank Corporate Conference (virtual)
07 September 2020 Jefferies German/European Property Virtual Conference (virtual)
15−17 September 2020 BofAML Global Real Estate Conference (virtual)
21 September 2020 Berenberg & Goldman Sachs Corporate Conference (virtual)
23 September 2020 Baader Investment Conference (held in person or virtual)
01 October 2020 Commerzbank Real Estate Forum 2020, London
26 November 2020 Berenberg Real Estate Seminar 2020, Paris
TAG Immobilien AGSteckelhörn 520457 HamburgTelefon + 49 40 380 32 - 0Telefax + 49 40 380 32 - [email protected]
Dominique MannHead of Investor & Public RelationsTelefon + 49 40 380 32 - 300Telefax + 49 40 380 32 - [email protected]
The English version of the Interim Statement Q2 2020 is a translation of the German version. The German version is legally binding.
CONTACT
Concept: fischer’s brand loft Werbeagentur GmbH Layout and Typesetting: TAG Immobilien AG
TAG Headquarter Hamburg (Hamburg)

Steckelhörn 520457 HamburgTelefon + 49 40 380 32 - 0Telefax + 49 40 380 32 - [email protected]


