59
www.deutsche-boerse.com Interim report Quarter 3 / 2015

www.deutsche-boerse.com
Interim reportQuarter 3 / 2015

Deutsche Börse Group: key figures
Quarter ended Nine months ended 30 Sep 2015 30 Sep 2014 30 Sep 2015 30 Sep 2014
Consolidated income statement
Net revenue (total revenue less volume-related costs) €m 594.4 495.6 1,777.6 1,503.5
Net interest income from banking business €m 13.9 9.3 36.4 33.4
Operating costs €m –344.0 –274.0 –944.7 –776.2
Earnings before interest and tax (EBIT) €m 249.7 221.6 833.4 803.2
Net income for the period €m 166.1 149.4 563.5 538.3
Earnings per share (basic) € 0.90 0.81 3.06 2.93
Consolidated cash flow statement
Cash flows from operating activities excluding CCP positions €m 279.6 223.6 754.8 477.2
Consolidated balance sheet (as at 30 September)
Non-current assets €m 15,405.6 8,905.7 15,405.6 8,905.7
Equity €m 3,584.4 3,508.9 3,584.4 3,508.9
Non-current interest-bearing liabilities €m 2,045.7 1,418.0 2,045.7 1,418.0
Performance indicators
Employees (average FTEs for the period) 4,962 4,132 4,839 4,077
EBIT margin, based on net revenue % 421) 45 471) 50
Tax rate % 26.01) 26.0 26.0 26.0
Gross debt / EBITDA1) – – 1.4 1.5
Interest coverage ratio1) % – – 27.6 26.4
The shares
Opening price € 74.25 56.98 59.22 60.20
Closing price (as at 30 September) € 77.03 53.33 77.03 53.33
Market indicators
Eurex
Number of contracts m 590.7 487.0 1,740.6 1,544.3
Xetra and Börse Frankfurt
Trading volume (single-counted) €bn 404.6 283.7 1,212.4 890.1
Clearstream
Value of securities deposited (average for the period) €bn 13,230 12,249 13,253 12,149
Number of transactions m 33.9 29.8 104.9 93.2
Global Securities Financing (average outstanding volume for the period) €bn 591.2 621.5 613.2 601.7
Transparency and stability key figures
Proportion of companies listed in the Prime Standard (for shares) as a percentage of all listed companies2) % 89 81 89 81
Number of calculated indices 11,231 10,781 11,231 10,781
Number of sustainable index concepts 27 23 27 23
System availability of cash market trading system (Xetra®) % 99.996 99.999 99.999 99.999
System availability of derivatives market trading system (T7/Eurex®) % 99.847 99.999 99.906 99.982
Market risk cleared via Eurex Clearing (gross monthly average) €bn 15,658 16,779 17,263 16,240
1) Adjusted for non-recurring items
2) Market capitalisation of companies listed in the Prime Standard (shares) in relation to the market capitalisation of all companies listed on the Frankfurt Stock
Exchange
Due to rounding, numbers presented throughout this document may not add up precisely to the totals
provided and percentages may not precisely reflect the absolute figures.

3 Group management report
In a market environment supportive to trading, Deutsche Börse Group recorded growth in all segments
year-on-year. Largest increases were recorded in the Eurex and Xetra trading segments. Net revenue rose by 20 per cent to €594.4 million (Q3/2014: €495.6 million). Operating costs
totalled €344.0 million (Q3/2014: €274.0 million). The Group’s EBIT increased to €249.7 million
(Q3/2014: €221.6 million). Basic earnings per share amounted to €0.90 for an average of
184.9 million shares, adjusted for non-recurring items to €1.03 (Q3/2014: €0.81 for 184.2 million
shares; adjusted: €0.85). Both net revenue and EBIT for the first nine months of 2015 are at the upper end of the full-year fore-
cast ranges, which were lifted in the first quarter. In July, Deutsche Börse AG announced the acquisition of the 360T FX trading platform (transaction
closed on 15 October 2015) as well as the full acquisition of STOXX AG and Indexium AG, which had
previously been held as joint ventures with SIX Group AG (transaction closed on 31 July 2015). To finance the acquisitions, Deutsche Börse has issued a hybrid bond with a principal amount of
€600 million as well as a senior bond with a principal amount of €500 million. The bonds bear inter-
est of 2.75 per cent (hybrid bond) and 1.625 per cent (senior bond) p.a. In addition, the Group gener-
ated further proceeds of €200 million from the placement of treasury shares. The Group has made excellent progress with the implementation of its Accelerate growth strategy,
which was announced in July.
Deutsche Börse Group’s net revenue
up 20 per cent
Development of Deutsche Börse AG shares since the beginning of Q3/2015
1) Index-linked, closing price on 30 June 2015
STOXX® Europe 600 Financials1)
Order book turnover of Deutsche Börse sharesDaily Deutsche Börse closing share price
DAX® performance1)
0
10060
90
30
200
Quoted price € Turnover €m
20.7
.-24.7
.
27.7
.-31.7
.
3.8
.-7.8
.
10.8
.-14.8
.
24.8
.-28.8
.
31.8
.-4.9
.
7.9
.-11.9
.
14.9
.-18.9
.
21.9
.-25.9
.
28.9
.-2.1
0.
5.1
0.-
9.1
0.
1.7
.-3.7
.
6.7
.-10.7
.
13.7
.-17.7
.
17.8
.-21.8
.
12.1
0.-
16.1
0.
4 Deutsche Börse Group interim report Q3/2015
Basic principles of the Group
The fundamental information about the Group described on pages 86 to 99 of the 2014 corporate
report is still valid in principle. However, there have been changes to the basis of consolidation. To en-
hance comparability between the third quarter of 2015 and the same period of the previous year, the
changes to the basis of consolidation since 1 October 2014 are presented in addition to the changes in
the reporting period.
Changes to the basis of consolidation
Deutsche Börse AG acquired 49.9 per cent of the shares of STOXX AG, Zurich, Switzerland, and
50.1 per cent of the shares of Indexium AG, Zurich, from SIX Group AG, Zurich, effective 31 July 2015.
Following this transaction, Deutsche Börse AG holds 100 per cent of the shares of both STOXX AG and
Indexium AG. Deutsche Börse AG had already had control over STOXX AG and had included the compa-
ny in full in its consolidated financial statements. The transaction led to the acquisition of control over
Indexium AG; the company has been included in full in the consolidated financial statements since then.
Effective 1 January 2015, European Energy Exchange AG, Leipzig, Germany, (EEX) acquired an interest
of 53.34 per cent in Powernext SA, Paris, France, in exchange for 36.75 per cent of the shares of EPEX
Spot SE, Paris, France. Since then, all natural gas activities of EEX group have been bundled within
Powernext SA; EEX increased its interest in Powernext SA to 55.8 per cent as a result of this transaction
and further raised this stake to 78.29 per cent in the period under review. As Powernext SA in turn holds
50 per cent of EPEX Spot SE (EPEX), EEX also obtained a controlling interest in EPEX and its two sub-
sidiaries, EPEX Spot Schweiz AG, Zurich, Switzerland, and JV Epex-Soops B.V., Amsterdam, the Nether-
lands. All subsidiaries have been included in full in the consolidated financial statements since
1 January 2015.
To expand the spot power business (trading and clearing), an interest of 100 per cent at APX Holding
group, which covers the market areas of the Netherlands, the United Kingdom and Belgium, was ac-
quired and integrated into the EPEX Spot group effective 4 May 2015. As wholly owned subsidiaries of
EPEX Spot SE, the APX Holding group companies have been included in full in Deutsche Börse Group’s
consolidated financial statements since May 2015.
Clearstream Global Securities Services Limited (CGSS, formerly Citco Global Securities Services Ltd.),
a hedge fund custody infrastructure operator, was acquired by Clearstream and has been included in full
in the consolidated financial statements since 3 October 2014. While revenue and costs have been
allocated to the Clearstream segment since that date, the assets managed by CGSS are being included in
Clearstream’s figures successively as the migration of the customer accounts progresses.
Group interim management report

5 Group management report
Report on the economic position
Macroeconomic and sector-specific environment
The company’s business operations and macroeconomic and sector-related environment have not
changed significantly compared with the presentation in the 2014 corporate report (pages 99 to 100
and 104 to 105).
Stock market volatility, which is one of the main drivers of the Group’s trading business, was up signifi-
cantly on the prior-year period in the third quarter of 2015. There was a continuation of the change
in trend observed since the end of the third quarter of 2014. There was also a significant rise in deriva-
tives market volatility. There has been a return to the use of derivatives to hedge risks. In this business
environment, which was generally more upbeat for Deutsche Börse Group, macroeconomic events and
situations led to significant fluctuations on individual trading days; these included:
the slide in the Chinese stock market after China’s economy failed to meet expectations. This triggered
market turbulence around the world and resulted in severe volatility in the cash and derivatives mar-
kets. the uncertain timing of the reversal of interest rates in the USA
The main central banks maintained the strongly expansionary focus of their monetary policy in the third
quarter of 2015. The European Central Bank (ECB) left its key interest rate at a historically low level.
Since September 2014, it has imposed a negative rate of 0.2 per cent on commercial bank deposits.
In addition, the ECB is continuing the programme to purchase government bonds and other securities
(quantitative easing, QE) that it launched in March. Since then, it has been purchasing securities
amounting to €60 billion per month in an attempt to increase market liquidity and prevent deflation. The
ECB’s QE programme is currently due to run until September 2016 and will continue to ensure low
interest rates, which have always been a significant driver of share prices in the past. The reversal of
interest rates some experts had expected in the USA has not materialised.The Federal Reserve Bank
(Fed, US central bank) maintained its low interest rate policy. However, the market expects that the Fed
will end its loose monetary policy before the ECB does.
According to its study published in October, the International Monetary Fund (IMF) expects economic
activity to increase by around 1.5 per cent in the eurozone as a whole in 2015 (July 2015: increase
of 1.5 per cent) and to expand by around 1.5 per cent in Germany (July 2015: 1.6 per cent). The study
forecasts economic growth of around 2.5 per cent in the UK (July 2015: 2.4 per cent) and of around
2.6 per cent in the USA (July 2015: 2.5 per cent). The IMF still forecasts the highest growth by far in
2015 – approximately 6.5 per cent – in Asian countries, and especially China, in anticipation of high
domestic demand there. As a result of the divergence in estimates for the different economic regions,
global economic growth is projected to be around 3.1 per cent in 2015. Thus, the IMF study also shows
that economic development in Europe and Asia has been steady since the beginning of the year, while in
the USA it has been worse than had been expected at the start of the year.
There were no changes in corporate strategy and management in the third quarter of 2015. For a com-
prehensive presentation, please refer to the details provided in the 2014 corporate report (pages 90
to 94).

6 Deutsche Börse Group interim report Q3/2015
Research and development
As a service provider, Deutsche Börse Group does not engage in research and development activities
comparable with those of manufacturing companies. However, Deutsche Börse does develop and operate
its own trading and clearing systems as well as system solutions to achieve its structural growth objec-
tives. Against this background, the company is constantly working to maintain and further increase the
technology leadership and stability of its electronic systems – in the interests of its customers and the
systemic stability of financial markets. For this reason, Deutsche Börse has significantly overhauled its
trading and clearing systems, which go by the trade names T7 and C7, as well as further systems devel-
oped on the basis of shared architecture such as M7 or F7. Other technically challenging projects include
implementing the ECB’s plans to create a uniform securities settlement throughout the EU (TARGET2-
Securities). Product and services development activities are described in more detail in the report on
opportunities and in the report on expected developments.
Results of operations
Results of operations in the third quarter of 2015
In the cash and derivatives markets, there seems to be a gradual return of investor confidence in the
eurozone. Investment capital that had been withdrawn from some European countries in the course of
the euro currency crisis and the debt crisis and invested in the USA or Asia returned to Europe, leading
to a significant increase in trading activity. In addition, exchange rate effects, especially the euro’s weak-
ness against the US dollar, and the stable economy in Germany, combined with good corporate results,
have provided additional momentum for some of the Group’s business areas. The cash market also ben-
efited from the ECB’s quantitative easing programme and low interest rate policy, which is causing more
investment capital to flow into the equity markets. The turbulence emanating from China caused addi-
tional volatility on exchanges around the world. The return of capital to euro products was also evident
in the derivatives market, where equity index derivatives in particular experienced sharp growth. Volatili-
ty was up significantly year-on-year.
In the commodities business, Deutsche Börse’s net revenue almost tripled, driven by a positive market
environment and acquisitions. The upward trend in Clearstream’s business continued, with the volume
of securities under custody rising in the third quarter; this was due among other factors to the continuing
high index levels in the domestic German market compared with the previous year, to the weakening
of the euro against the US dollar and to additional business. Deutsche Börse Group’s technology and
market data business (Market Data + Services segment) also showed growth particularly in the Index
business area.
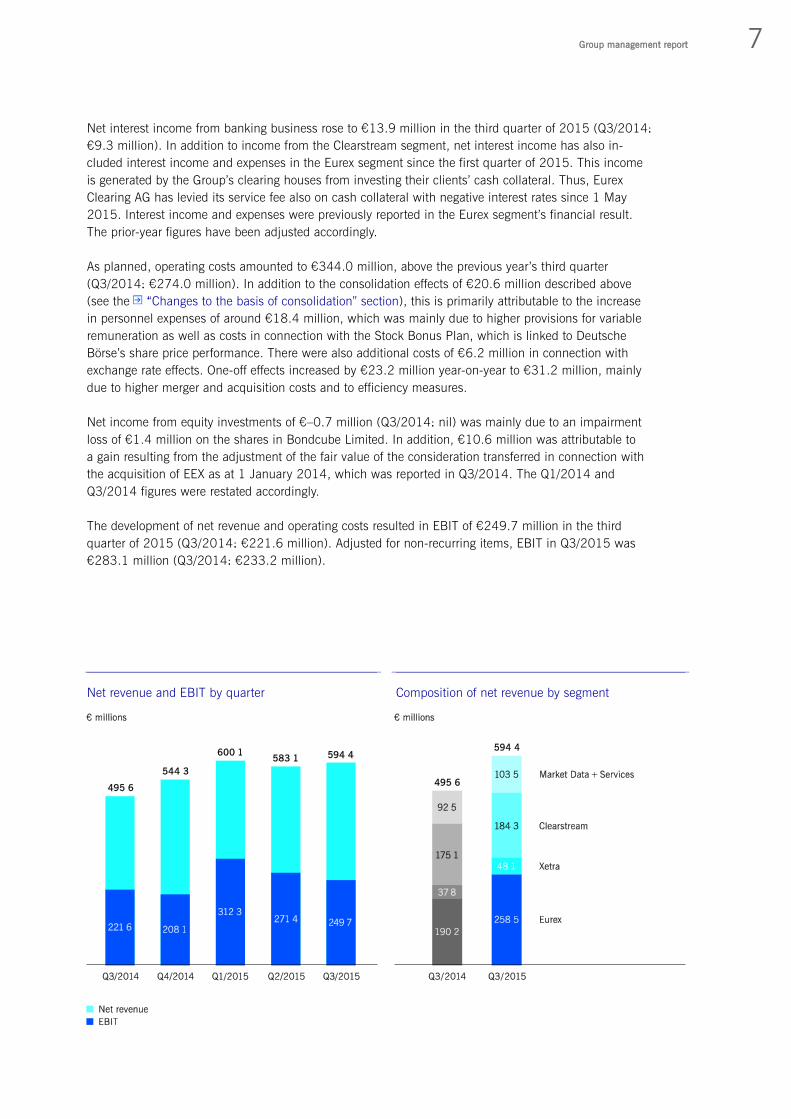
Thus, Deutsche Börse Group’s net revenue rose by 20 per cent year-on-year to €594.4 million in total
(Q3/2014: €495.6 million). The additional revenue from the consolidation of Powernext, EPEX and
APX amounted to €20.6 million (consolidation as of early May 2015); CGSS contributed revenue
amounting to €5.8 million. Net revenue is composed of sales revenue plus net interest income from
banking business and other operating income, less volume-related costs.
7 Group management report
Net interest income from banking business rose to €13.9 million in the third quarter of 2015 (Q3/2014:
€9.3 million). In addition to income from the Clearstream segment, net interest income has also in-
cluded interest income and expenses in the Eurex segment since the first quarter of 2015. This income
is generated by the Group’s clearing houses from investing their clients’ cash collateral. Thus, Eurex
Clearing AG has levied its service fee also on cash collateral with negative interest rates since 1 May
2015. Interest income and expenses were previously reported in the Eurex segment’s financial result.
The prior-year figures have been adjusted accordingly.
As planned, operating costs amounted to €344.0 million, above the previous year’s third quarter
(Q3/2014: €274.0 million). In addition to the consolidation effects of €20.6 million described above
(see the “Changes to the basis of consolidation” section), this is primarily attributable to the increase
in personnel expenses of around €18.4 million, which was mainly due to higher provisions for variable
remuneration as well as costs in connection with the Stock Bonus Plan, which is linked to Deutsche
Börse’s share price performance. There were also additional costs of €6.2 million in connection with
exchange rate effects. One-off effects increased by €23.2 million year-on-year to €31.2 million, mainly
due to higher merger and acquisition costs and to efficiency measures.
Net income from equity investments of €–0.7 million (Q3/2014: nil) was mainly due to an impairment
loss of €1.4 million on the shares in Bondcube Limited. In addition, €10.6 million was attributable to
a gain resulting from the adjustment of the fair value of the consideration transferred in connection with
the acquisition of EEX as at 1 January 2014, which was reported in Q3/2014. The Q1/2014 and
Q3/2014 figures were restated accordingly.
The development of net revenue and operating costs resulted in EBIT of €249.7 million in the third
quarter of 2015 (Q3/2014: €221.6 million). Adjusted for non-recurring items, EBIT in Q3/2015 was
€283.1 million (Q3/2014: €233.2 million).
Net revenue and EBIT by quarter Composition of net revenue by segment
8 Deutsche Börse Group interim report Q3/2015
The Group’s financial result for the third quarter of 2015 amounted to €–14.6 million (Q3/2014:
€–13.7 million). This is attributable to additional interest expenses in connection with the bond issued
at the beginning of the third quarter of 2015 to finance the STOXX acquisition.
The adjusted tax rate in the third quarter of 2015 was 26.0 per cent (Q3/2014: 26.0 per cent).
Consolidated net income for the third quarter of 2015 amounted to €166.1 million (Q3/2014:
€149.4 million). Adjusted for non-recurring items, net income for the period was at €191.4 million
(Q3/2014: €155.9 million).
Basic earnings per share, based on the weighted average of 184.9 million shares outstanding, amount-
ed to €0.90 in the third quarter of 2015 (Q3/2014: €0.81 for 184.2 million shares outstanding). Ad-
justed for non-recurring items, basic earnings per share improved to €1.03 (Q3/2014: €0.85).
Results of operations in the first nine months of 2015
Deutsche Börse Group’s nine-month results of operations improved in all segments thanks to the return
of higher volatility and restored investor confidence in the European capital markets.
Deutsche Börse Group’s total net revenue rose by 18 per cent year-on-year to €1,777.6 million in the
first nine months of 2015 (Q1–3/2014: €1,503.5 million). Without the consolidation effects in the
amount of €76.0 million, net revenue increased by 13 per cent. Net interest income from banking busi-
ness generated from customer cash deposits in the Clearstream segment and by the clearing houses in
the Eurex segment increased to €36.4 million (Q1–3/2014: €33.4 million).
Operating costs amounted to €944.7 million were also higher than in the first nine months of 2014
(Q1–3/2014: €776.2 million). Adjusted for one-off effects amounting to €53.5 million, operating costs
were 17 per cent higher in the first nine months of 2015 than in the prior-year period. This increase is
mainly due to the above-mentioned consolidation effects of €56.6 million, higher non-recurring costs for
mergers and acquisitions and for efficiency measures of €36.0 million (Q1–3/2014: €17.5 million),
additional costs of €24.3 million related to exchange rate effects and a scheduled higher level of invest-
ments in growth initiatives, which totalled €20.4 million. In addition, personnel expenses rose by
€34.1 million, primarily due to higher provisions for variable remuneration and costs in connection with
the Stock Bonus Plan, which is linked to Deutsche Börse’s share price performance.
The result from equity investments for the first nine months of 2015 was €0.5 million (Q1–3/2014:
€75.9 million). The reason for the high result in the previous year result is a one-off gain in connection
with the merger of Direct Edge Holdings, LLC (Direct Edge) and BATS Global Markets, Inc. (BATS) at
the end of January 2014. This transaction led to an exceptional item of €63.3 million being recognised
under the result from equity investments. In addition, a one-off gain of €10.6 million was recognised,
resulting from the adjustment of the fair value of the consideration transferred in connection with the
acquisition of EEX as at 1 January 2014, which was reported in Q3/2014. The Q1/2014 and Q3/2014
figures were restated accordingly. Adjusted for these items, the result from equity investments amounted
to €5.9 million in the first nine months of 2014.
EBIT rose to €833.4 million in the first nine months of 2015 (Q1–3/2014: €803.2 million); adjusted
for exceptional cost items and for one-off items in the result from equity investments, EBIT was
€889.4 million (Q1–3/2014: €750.7 million).
9 Group management report
The Group’s financial result for the first nine months of 2015 was €–26.7 million (Q1–3/2014: €–40.3
million). The improvement is mainly due to exchange rate effects totalling €14.2 million in the first and
second quarters of 2015.
The adjusted tax rate in the first three quarters of 2015 was 26.0 per cent (Q1–3/2014: 26.0 per cent).
Consolidated net income for the first nine months of 2015 amounted to €563.5 million; adjusted
€607.7 million (Q1–3/2014: €538.3 million; adjusted €505.8 million). Basic earnings per share,
based on the weighted average of 184.5 million shares outstanding, rose to €3.06 in the first nine
months of 2015 (Q1–3/2014: €2.93 for 184.1 million shares outstanding). After adjustment, the fig-
ures were €3.29 for the first three quarters of 2015 and €2.75 for the prior-year period.
Comparison of results of operations with the forecast for 2015
Due to an environment supportive to trading, business in 2015 has outperformed last year’s expecta-
tions. In addition, the consolidation of the APX Holding group in the second quarter and the US dollar’s
strengthening against the euro are having a positive effect on net revenue. Deutsche Börse Group lifted
its forecast range for financial year 2015 on publication of its report for the first quarter of 2015 (see the
report on expected developments in the interim report as at 31 March 2015). The Group is maintain-
ing this forecast.
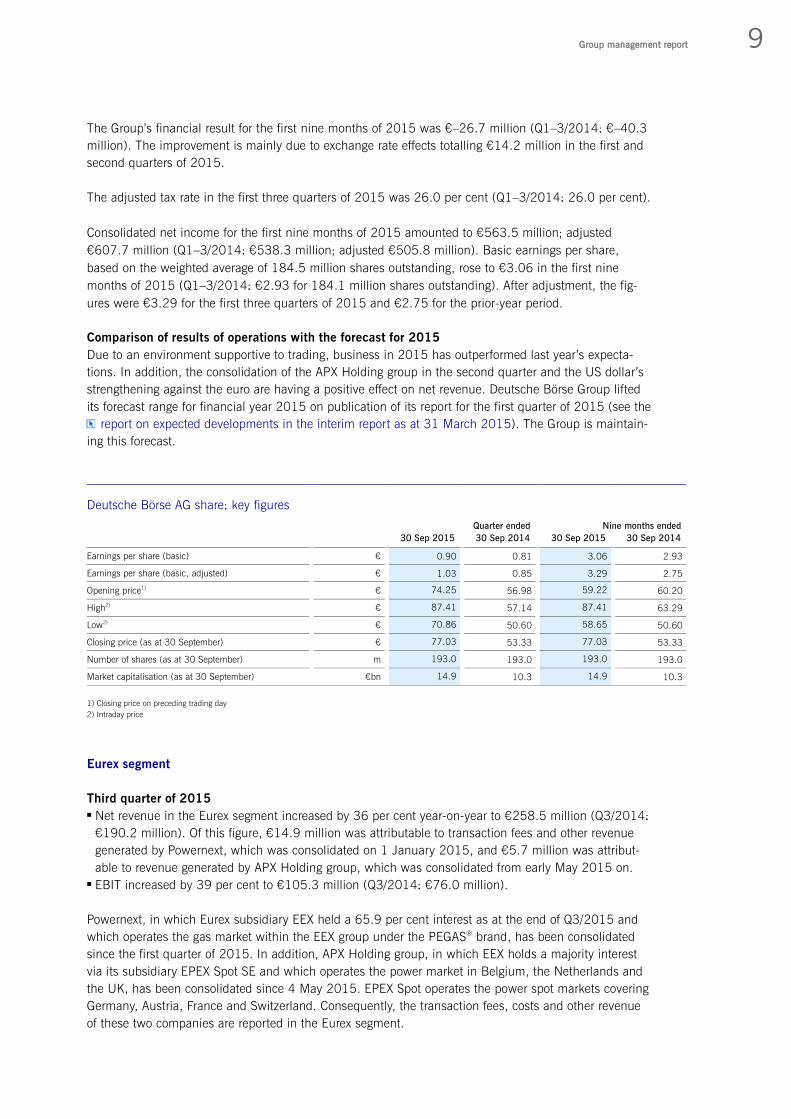
Deutsche Börse AG share: key figures
Quarter ended Nine months ended
30 Sep 2015 30 Sep 2014 30 Sep 2015 30 Sep 2014
Earnings per share (basic) € 0.90 0.81 3.06 2.93
Earnings per share (basic, adjusted) € 1.03 0.85 3.29 2.75
Opening price1) € 74.25 56.98 59.22 60.20
High2) € 87.41 57.14 87.41 63.29
Low2) € 70.86 50.60 58.65 50.60
Closing price (as at 30 September) € 77.03 53.33 77.03 53.33
Number of shares (as at 30 September) m 193.0 193.0 193.0 193.0
Market capitalisation (as at 30 September) €bn 14.9 10.3 14.9 10.3
1) Closing price on preceding trading day
2) Intraday price
Eurex segment
Third quarter of 2015 Net revenue in the Eurex segment increased by 36 per cent year-on-year to €258.5 million (Q3/2014:
€190.2 million). Of this figure, €14.9 million was attributable to transaction fees and other revenue
generated by Powernext, which was consolidated on 1 January 2015, and €5.7 million was attribut-
able to revenue generated by APX Holding group, which was consolidated from early May 2015 on. EBIT increased by 39 per cent to €105.3 million (Q3/2014: €76.0 million).
Powernext, in which Eurex subsidiary EEX held a 65.9 per cent interest as at the end of Q3/2015 and
which operates the gas market within the EEX group under the PEGAS® brand, has been consolidated
since the first quarter of 2015. In addition, APX Holding group, in which EEX holds a majority interest
via its subsidiary EPEX Spot SE and which operates the power market in Belgium, the Netherlands and
the UK, has been consolidated since 4 May 2015. EPEX Spot operates the power spot markets covering
Germany, Austria, France and Switzerland. Consequently, the transaction fees, costs and other revenue
of these two companies are reported in the Eurex segment.

10 Deutsche Börse Group interim report Q3/2015
Like the cash market, the derivatives market also benefited from the positive trading environment in the
third quarter: the year-on-year growth in equity market volatility and the increased confidence in the
European capital market among investors led to a rise in trading activity among market participants. The
number of futures and options contracts traded on the Eurex derivatives market rose by a total of 24 per
cent to 421.3 million contracts (Q3/2014: 340.0 million). Including the International Securities Ex-
change (ISE), which saw its market share increase year-on-year in the third quarter of 2015, the trading
volume in the Eurex segment was 590.7 million contracts (Q3/2014: 487.0 million).
Equity index derivatives remained the highest-volume product group on the Eurex derivatives exchange.
The number of traded contracts increased by 38 per cent in the third quarter of 2015 to 234.0 million
(Q3/2014: 169.3 million). Net revenue from trading and clearing equity index derivatives rose by 36 per
cent to €111.4 million (Q3/2014: €81.8 million).
The situation in European interest rate derivatives trading was mixed: on the one hand, the persistently
low interest rates, the ECB’s programme of large-scale government bond purchases and the unlikelihood
of a change in the ECB’s loose monetary policy in the near future had a negative effect on trading. On
the other hand, discussions about the future of the European currency union, in particular the debt dis-
pute between Greece and its creditors, and the reversal of interest rates in the USA, which was expected
by some market participants, resulted in additional hedging requirements among investors. Overall, the
number of traded contracts increased by 4 per cent to 116.6 million in the third quarter of 2015
(Q3/2014: 111.6 million). Net revenue increased to €42.1 million (Q3/2014: €40.1 million). The
volatile market environment also drove up volumes in the equity derivatives product group; they in-
creased by 19 per cent in the third quarter of 2015, to 67.2 million contracts (Q3/2014: 56.7 million);
net revenue rose to €7.8 million (Q3/2014: €6.3 million).
Breakdown of net revenue in the Eurex segment

11 Group management report
The Eurex volatility derivatives continued to be extremely successful in the derivatives market. At a rec-
ord figure of 3.6 million contracts in the third quarter of 2015, the number of traded contracts rose by
47 per cent year-on-year (Q3/2014: 2.4 million). Derivatives on French and Italian government bonds
remained on their continuous growth trajectory to achieve volumes of 11.3 million traded contracts in the
third quarter of 2015, up 9 per cent year-on-year (Q3/2014: 10.4 million). These products have been
introduced progressively on Eurex since 2009 to round off the exchange’s long-term European interest
rate derivatives offering.
Moreover, in August trading in IRS Constant Maturity Futures (CMFs) was launched on the GMEX plat-
form. Global Markets Exchange Group International LLP (GMEX) is a group of companies that develop
sustainable and innovative solutions for the global financial markets. GMEX and Eurex have co-operated
since the end of 2014, preparing the launch of the futures together with market participants. Due to its
lower margin requirements, the IRS CMF contract is a cost-effective alternative to OTC traded and
cleared interest rate swaps.
In the third quarter of 2015, ISE generated a volume of 169.4 million US options contracts (Q3/2014:
147.0 million). ISE slightly increased its market share of US equity options to 16.4 per cent (Q3/2014:
15.6 per cent. Net revenue in Eurex’s US options business rose to €25.4 million (Q3/2014:
€19.1 million).
The EEX group recorded a strong quarter with very high growth rates, with trading volumes up signifi-
cantly year-on-year. Trading volumes on the power spot and derivatives markets rose by 42 per cent to
702.9 TWh (Q3/2014: 493.3 TWh). This growth is mainly attributable to the increased share of the
power derivatives market, especially in Germany, Italy and Spain. In September, EEX opened an office in
Oslo in order to have a presence for local customers in the important northern European power market.
Despite lower volatility, trading volumes of natural gas products on the PEGAS platform rose by 41 per
cent to 208.1 TWh (Q3/2014: 147.8 TWh). In emission rights trading, 174.6 million tonnes of CO2
were traded, an increase of 68 per cent on the prior-year quarter (Q3/2014: 104.2 million tonnes of
CO2). Overall, net revenue in the commodities area almost tripled in the Eurex segment, to €40.8 million
(Q3/2014: €16.1 million) thanks to the EEX group.
In the third quarter of 2015, the average outstanding volume on Eurex Repo®, the marketplace for the
collateralised money market as well as for the GC Pooling® (General Collateral Pooling) offering, declined
by 27 per cent to €151.6 billion (Q3/2014: €207.5 billion, single-counted for both periods). Many
bonds capable of functioning as collateral for repo transactions are being withdrawn from the market due
to the low interest rate environment and the ECB’s bond-buying programme. In addition, the high excess
liquidity is currently leading to lower refinancing requirements among participants. In GC Pooling, the
average outstanding volume decreased by 24 per cent to €124.7 billion (Q3/2014: €164.8 billion). In
the euro repo market, average outstanding volumes were €26.9 billion, down 37 per cent on the prior-
year quarter (Q3/2014: €42.7 billion, single-counted for both periods). As part of the GC Pooling offer-
ing, investors have been able to enter into transactions not only in euros and US dollars, but also in
Swiss francs since December 2014. Net revenue in the repo business decreased to €6.4 million
(Q3/2014: €8.5 million).

12 Deutsche Börse Group interim report Q3/2015
First nine months of 2015 Net revenue in the first nine months grew by 29 per cent to €757.4 million (Q1–3/2014: €585.6
million); excluding the Powernext SA and APX Holding group revenue, net revenue was €699.9 million. EBIT increased to €355.9 million (Q1–3/2014: €346.8 million) and thereby less significantly as the
net revenue. In 2014, €63.3 million was attributable to non-recurring income that Deutsche Börse
Group generated as a result of a revaluation of its shares in Direct Edge in connection with the merger
of Direct Edge and BATS. In addition, €10.6 million was attributable to an adjustment of the fair value
of the consideration transferred in connection with the acquisition of EEX as at 1 January 2014, which
was reported in Q3/2014. This led in turn to an adjustment to Q1/2014 and hence to the nine-month
result for the prior-year period. Net of these factors, EBIT was €280.8 million in the first nine months
of 2014.
Trading volumes for European futures and options rose by 18 per cent in the first nine months of 2015
to 1,292.2 million contracts (Q1–3/2014: 1,092.8 million). A total of 1,740.6 million contracts were
traded on Eurex’s derivatives exchanges in the first three quarters, 13 per cent more than in the prior-
year period (Q1–3/2014: 1,544.3 million).
Volumes for European-traded equity index derivatives increased by 30 per cent in the first nine months
of 2015 to 646.0 million contracts (Q1–3/2014: 496.2 million). Interest rate derivatives trading grew
by 10 per cent in Q1–3/2015 to 387.4 million contracts (Q1–3/2014: 352.1 million). The volume of
equity derivatives contracts rose by 5 per cent year-on-year to 248.2 million contracts (Q1–3/2014:
237.1 million).
Eurex segment: key indicators
30 Sep 2015
Quarter ended
30 Sep 2014 Change
30 Sep 2015
Nine months
ended
30 Sep 2014 Change
Financial derivatives m contracts m contracts % m contracts m contracts %
Total Eurex and ISE1) 590.7 487.0 21 1,740.6 1,544.3 13
European derivatives1) 2) 421.3 340.0 24 1,292.2 1,092.8 18
European equity index
derivatives 234.0 169.3 38 646.0 496.2 30
European interest rate
derivatives 116.6 111.6 4 387.4 352.1 10
European equity
derivatives 67.2 56.7 19 248.2 237.1 5
US options (ISE) 169.4 147.0 15 448.3 451.5 – 1
Commodities3) TWh/m t C02 TWh/m t C02 % TWh/m t C02 TWh/m t C02 %
Electricity (TWh) 702.9 493.34) 42 2,125.0 1,312.14) 62
Gas (TWh) 208.1 147.8 41 643.5 396.6 62
Emissions trading (m t
CO2) 174.6 104.2 68 490.0 429.0 14
Repo business5) €bn €bn % €bn €bn %
Total Eurex Repo® 151.6 207.5 – 27 182.0 199.8 – 9
GC Pooling® 124.7 164.8 – 24 148.7 158.0 – 6
Euro market 26.9 42.7 – 37 33.3 41.8 – 20
1) Prior-year figures adjusted for flexible options and EEX trading volume in derivatives, which is now reported at EEX under Commodities (total of –0.3 million
contracts in Q3/2014 and –0.7 million contracts in Q1–3/2014)
2) The total shown does not equal the sum of the individual figures as it includes other traded products such as ETFs, volatility, foreign exchange and precious metals
derivatives.
3) Including volumes traded on Powernext and EPEX; prior-year figures have been adjusted accordingly; including APX volumes since 4 May 2015
4) Thereof, 91.9 TWh in Q3/2014 and 278.5 TWh in Q1–3/2014 are attributable to power trading at EPEX.
5) Since the Swiss National Bank no longer offers money market instruments through Eurex Repo, the volume in Swiss francs has ceased with immediate effect. The
average outstanding volumes on the repo market in Swiss francs amounted to €8.6 billion in Q3/2014 and €19.4 billion in Q1–3/2014.

13 Group management report
On ISE, market participants traded 448.3 million contracts in the first nine months of 2015, slightly
fewer than in the prior-year period (Q1–3/2014: 451.5 million).
Volumes on the EEX group power spot and derivatives markets rose by 62 per cent to 2,125.0 TWh in
the first nine months of 2015 (Q1–3/2014: 1,312.1 TWh). Trading volumes of gas products increased
by 62 per cent to 643.5 TWh (Q1–3/2014: 396.6 TWh). In the emission rights trading segment,
490.0 million tonnes of CO2 were traded, an increase of 14 per cent on the prior-year period
(Q1–3/2014: 429.0 million tonnes of CO2).
The average outstanding volume on the Eurex Repo market was €182.0 billion in the first nine months
of 2015, 9 per cent down on the prior-year period (Q1–3/2014: €199.8 billion; single-counted for both
periods). Volumes on the euro market declined by 20 per cent to €33.3 billion (Q1–3/2014:
€41.8 billion). At €148.7 billion, GC Pooling recorded a 6 per cent decrease in average outstanding
volumes in the first nine months of 2015 (Q1–3/2014: €158.0 billion).
Xetra segment
Third quarter of 2015 Net revenue rose by 27 per cent to €48.1 million (Q3/2014: €37.8 million). The Xetra segment increased its EBIT by 28 per cent to €26.8 million (Q3/2014: €20.9 million).
The upward trend in the cash market continued in the third quarter of 2015. After investors had with-
drawn capital from Europe in recent years in the course of the debt crisis in certain European countries,
they are now increasingly returning to Europe. This applies in particular to investors from the USA, who
expect to see key interest rates rise in their home country (even though this failed to materialise in Sep-
tember). German companies’ relatively good results of operations and the stable economic environment
Breakdown of net revenue in the Xetra segment

14 Deutsche Börse Group interim report Q3/2015
make Germany an attractive destination for investors. Volatility is significantly higher than a year ago,
and the ECB’s low interest rate policy and its QE programme, which continued in the third quarter, are
contributing to the increase in trading activity in the cash market.
Trading volumes on Xetra® increased by 44 per cent year-on-year to €392.2 billion (Q3/2014:
€272.0 billion). In the third quarter of 2015, the number of Xetra transactions was up 40 per cent on
the prior-year quarter to 66.6 million (Q3/2014: 47.6 million). The average value per transaction was
€11.8 thousand (Q3/2014: €11.4 thousand). The Xetra segment generated a total of €31.0 million in
net revenue from trading (Q3/2014: €22.8 million). The net revenue of the central counterparty for
equities increased year-on-year in the third quarter, to €8.7 million (Q3/2014: €6.6 million). Other net
revenue remained stable at €8.4 million (Q3/2014: €8.4 million).
The Frankfurt Stock Exchange generated a trading volume of €12.4 billion, including warrants and cer-
tificates, in the third quarter of 2015, 6 per cent more than in the prior-year period
(Q3/2014: €11.7 billion).
On Tradegate Exchange, which is operated by a company in which Deutsche Börse holds a majority
interest, investors traded securities with a volume of €17.3 billion in the third quarter of 2015, a 59 per
cent rise year-on-year (Q3/2014: €10.9 billion).
Deutsche Börse operates Europe’s biggest marketplace for exchange-traded funds (ETFs), with a market
share of 32 per cent in the third quarter (Q3/2014: 33 per cent). As at 30 September 2015, 1,087
ETFs were listed on the Frankfurt Stock Exchange (30 September 2014: 1,038 ETFs). The investment
opportunities offered by exchange-traded funds now cover equity markets in many different regions and
sectors, as well as other asset classes, such as bonds and commodities. Investors can also use ETFs to
pursue trading strategies in combination with dividends and volatility, for example. Passive investment
instruments are becoming increasingly popular with investors: fund assets under management held by
ETF issuers amounted to €320.4 billion (Q3/2014: €271.6 billion), a year-on-year rise of 18 per cent.
The segment’s trading volume increased by 52 per cent to €47.2 billion in the third quarter of 2015
(Q3/2014: €31.1 billion). The company is the market leader among all the European exchanges in
terms of both supply and demand.
Besides the marketplace for ETFs, Deutsche Börse operates a segment for exchange-traded commodities
(ETCs). Xetra-Gold®, a physically backed bearer bond issued by Deutsche Börse Commodities GmbH, is
the most successful ETC product. Gold holdings reached a new record high of 59.3 tonnes in the third
quarter of 2015 (30 September 2014: 49.4 tonnes). At €32.12 (Xetra price on 30 September 2015),
the current value of gold under custody is around €1.9 billion (30 September 2014: €1.5 billion). Of
the ETCs that can be traded on Xetra, Xetra-Gold is by far the highest-volume security. The order book
turnover on Xetra amounted to €347.0 million in the third quarter of 2015, representing a 30 per cent
share of the ETC market.
Xetra segment: key indicators
30 Sep 2015
Quarter ended
30 Sep 2014 Change
30 Sep 2015
Nine months
ended
30 Sep 2014 Change
€bn €bn % €bn €bn %
Trading volume (order book turnover,
single-counted)
Xetra® 392.2 272.0 44 1,169.6 851.1 37
Börse Frankfurt 12.4 11.7 6 42.8 39.0 10
Tradegate Exchange 17.3 10.9 59 58.1 38.0 53

15 Group management report
Launched in June, the Deutsche Börse Venture Network, a programme that aims to improve the finan-
cing opportunities available to young growth enterprises, continues to expand. A total of 41 growth
enterprises and 75 investors were active on the platform at the end of the third quarter. The Deutsche
Börse Venture Network provides a forum for young and growth enterprises to interact with international
investors.
Many companies see an IPO or initial listing as a good opportunity to increase their equity. Despite a
recent deterioration as a result of concerns about economic developments in China or following the mar-
ket volatility in the course of manipulation allegations against Volkswagen, low interest rates currently
offer new issuers a favourable environment for such a move. In the listing business, Deutsche Börse
recorded five initial listings in the third quarter of 2015. These were three IPOs with a placement vol-
ume totalling approximately €1.7 billion and two technical listings without a public offer. The biggest
IPO was that of Deutsche Pfandbriefbank AG; the company placed shares worth €1.16 billion. Further-
more, 23 companies implemented capital increases in the third quarter; the placement volume amount-
ed to around €2.9 billion. With the hybrid bond of Deutsche Börse AG, the Prime Standard for corporate
bonds registered a new admission. The issue volume of the bond as given in the prospectuses amounted
to a total of €600.0 million.
First nine months of 2015 Net revenue in the first nine months of 2015 amounted to €142.4 million, up 20 per cent on the
previous year (Q1–3/2014: €118.6 million). EBIT increased to €83.4 million (Q1–3/2014: €67.7 million).
Trading volumes on Xetra amounted to €1,169.6 billion in the first nine months, up 37 per cent on the
prior-year period (Q1–3/2014: €851.1 billion). The number of transactions in Xetra trading also
increased in the first nine months of 2015, rising 26 per cent to 187.6 million (Q1–3/2014:
148.6 million). The trading volume on the Frankfurt Stock Exchange rose by 10 per cent in the first nine
months of 2015 to €42.8 billion (Q1–3/2014: €39.0 billion). Tradegate Exchange generated a trading
volume of €58.1 billion in the first nine months of 2015, an increase of 53 per cent (Q1–3/2014:
€38.0 billion). The volume of ETFs traded in the XTF® segment rose by 60 per cent in the first nine
months of 2015 to €147.1 billion (Q1–3/2014: €91.9 billion).
In the listing business, the Frankfurt Stock Exchange recorded 30 new admissions in the first nine
months of 2015, 14 of which were in the Prime Standard, six in the General Standard and ten in the
Entry Standard. The total placement volume was €3.1 billion. The new admissions comprise 15 initial
listings and 15 transfers. Moreover, five companies raised a total of €1.1 million in debt (as given in the
prospectuses) via the Entry Standard and Prime Standard for corporate bonds in the reporting period.
Overall, 74 capital increases with a total volume of €9.1 billion were implemented by listed companies
in the first nine months of 2015.
Clearstream segment
Third quarter of 2015 At €184.3 million, Clearstream registered a 5 per cent increase in net revenue in the third quarter of
2015, compared to the prior-year period (Q3/2014: €175.1 million). Of this, €5.8 million was attribut-
able to Clearstream Global Securities Services (CGSS) net revenue in the investment fund business. Clear-
stream has owned CGSS in Cork, Ireland, since 3 October 2014. This subsidiary provides hedge fund
trade execution and custody processing services for financial institutions. EBIT stood at €72.7 million in the third quarter of 2015 (Q3/2014: €84.1 million).

16 Deutsche Börse Group interim report Q3/2015
The average value of assets under custody in the third quarter of 2015 increased to €13.2 trillion
(Q3/2014: €12.2 trillion). On the one hand, this was due to sustained equity price gains on the
German domestic market, which increased the value of assets under custody to €6.1 trillion in
Q3/2015 (Q3/2014: €5.7 trillion). On the other hand, international assets under custody, which
mainly comprise off-exchange (over-the-counter, OTC) traded bonds, amounted to €7.2 trillion in
the third quarter of 2015, significantly above last year (Q3/2014: €6.5 trillion). The growth of
international assets under custody is partly due to the devaluation of the euro against the US dollar,
which in turn has increased the euro value of assets denominated in dollars. New customers and
business gains also contributed to growth in the custody business. Net revenue increased to €97.3
million in Q3/2015 (Q3/2014: €90.9 million).
The number of settlement transactions processed by Clearstream rose by 14 per cent to 33.9 million
(Q3/2014: 29.8 million). This increase was due to higher trading activity by market participants in the
third quarter of 2015. At a total of 10.2 million transactions, Clearstream’s international settlement
activity for Q3/2015 was 2 per cent lower year-on-year (Q3/2014: 10.3 million). Settlements of interna-
tional OTC transactions decreased to 8.4 million (Q3/2014: 8.7 million), or 82 per cent of all interna-
tional transactions. Settlements of on-exchange transactions rose by 9 per cent to 1.8 million
(Q3/2014: 1.6 million), or 18 per cent of all international transactions. In the domestic business,
settlement transactions climbed by 22 per cent to 23.8 million in the third quarter of 2015 (Q3/2014:
19.4 million), due to higher trading activity on the part of German retail investors. Of this figure,
63 per cent were on-exchange transactions and 37 per cent OTC transactions. On-exchange trans-
actions increased to 15.0 million (Q3/2014: 12.1 million), while OTC transactions rose to 8.8 million
(Q3/2014: 7.3 million). Net revenue in the settlement business went up by 11 per cent to
€32.4 million in the third quarter of 2015 (Q3/2014: €29.2 million).
TARGET2-Securities (T2S), the ECB’s single European settlement platform, went live on 22 June 2015
with a first wave of central securities depositories (CSDs). The Italian market concluded the first migra-
tion wave on 31 August 2015 and joined the markets of Greece, Malta, Romania and Switzerland.
Breakdown of net revenue in the Clearstream
segment

17 Group management report
All markets have successfully migrated their domestic settlement to euro central bank money and/or their
euro business to T2S and are running stable ever since. Clearstream and LuxCSD will adapt existing
links as CSDs continue to migrate into T2S in four waves. In 2016, Clearstream’s CSDs will migrate in
wave 3.
Within the Global Securities Financing (GSF) business, which includes triparty repo, securities lending
and collateral management, average outstandings decreased year-on-year to €591.2 billion (Q3/2014:
€621.5 billion). Total GSF net revenue was up 7 per cent to €17.3 million in Q3/2015 (Q3/2014:
€16.1 million). In September 2015, Latvijas Banka followed Deutsche Bundesbank (German national
central bank) and Banca d’Italia in choosing Clearstream’s comprehensive suite of securities lending
services to reinject securities purchased under ECB’s Public Sector Purchase Programme (PSPP) into
the market.
Overnight customer cash deposits decreased in the third quarter of 2015 to reach an average
of €11.3 billion (Q3/2014: €11.7 billion). Adjusted for assets restricted by EU and US sanction
programmes, customer cash deposits decreased to €9.8 billion (Q3/2014: €10.5 billion). Net
interest income from Clearstream’s banking business decreased by 17 per cent to €8.0 million
in Q3/2015 (Q3/2014: €9.6 million). Growth in cash deposits exceeded net interest income,
reflecting sustained low interest rate levels.
Clearstream segment: key indicators
30 Sep 2015
Quarter ended
30 Sep 2014 Change
30 Sep 2015
Nine months
ended
30 Sep 2014 Change
Custody €bn €bn % €bn €bn %
Value of securities deposited
(average value) 13,230 12,249 8 13,253 12,149 9
international 7,177 6,545 10 7,102 6,445 10
domestic 6,053 5,704 6 6,151 5,704 8
Settlement m m % m m %
Securities transactions 33.9 29.8 14 104.9 93.2 13
international – OTC 8.4 8.7 – 4 27.6 27.2 2
international – on-exchange 1.8 1.6 9 6.0 5.5 10
domestic – OTC 8.8 7.3 20 25.6 22.7 13
domestic – on-exchange 15.0 12.1 24 45.6 37.9 21
Global Securities Financing €bn €bn % €bn €bn %
Outstanding volume (average value) 591.2 621.5 – 5 613.2 601.7 2
Average daily cash balances €m €m % €m €m %
Total1) 11,300 11,743 – 4 12,455 11,762 6
euros 3,454 4,899 – 29 4,289 4,947 – 13
US dollars 5,851 5,281 11 6,104 5,187 18
other currencies 1,995 1,563 28 2,061 1,628 27
1) Contains amounts that are or were restricted by EU and US sanctions of around €1.5 billion in Q3/2015 (Q3/2014: €1.3 billion) and €1.5 billion in Q1–3/2015
(Q1–3/2014: €1.3 billion).
18 Deutsche Börse Group interim report Q3/2015
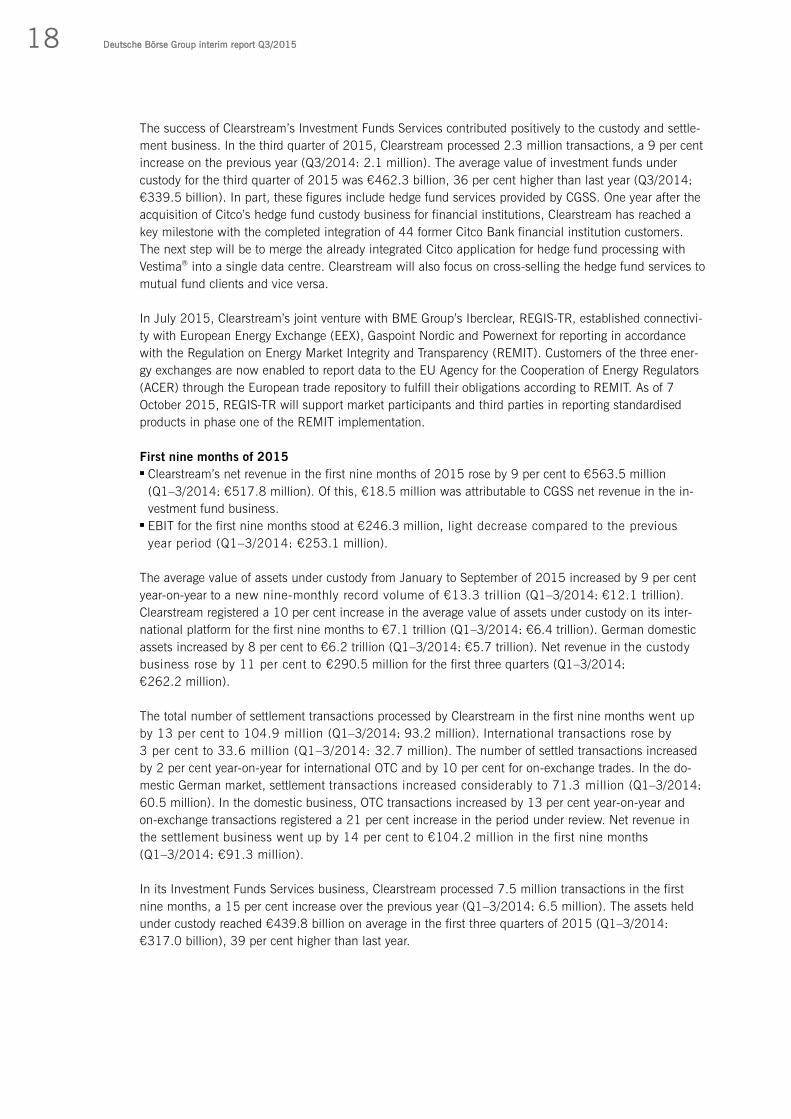
The success of Clearstream’s Investment Funds Services contributed positively to the custody and settle-
ment business. In the third quarter of 2015, Clearstream processed 2.3 million transactions, a 9 per cent
increase on the previous year (Q3/2014: 2.1 million). The average value of investment funds under
custody for the third quarter of 2015 was €462.3 billion, 36 per cent higher than last year (Q3/2014:
€339.5 billion). In part, these figures include hedge fund services provided by CGSS. One year after the
acquisition of Citco’s hedge fund custody business for financial institutions, Clearstream has reached a
key milestone with the completed integration of 44 former Citco Bank financial institution customers.
The next step will be to merge the already integrated Citco application for hedge fund processing with
Vestima® into a single data centre. Clearstream will also focus on cross-selling the hedge fund services to
mutual fund clients and vice versa.
In July 2015, Clearstream’s joint venture with BME Group’s Iberclear, REGIS-TR, established connectivi-
ty with European Energy Exchange (EEX), Gaspoint Nordic and Powernext for reporting in accordance
with the Regulation on Energy Market Integrity and Transparency (REMIT). Customers of the three ener-
gy exchanges are now enabled to report data to the EU Agency for the Cooperation of Energy Regulators
(ACER) through the European trade repository to fulfill their obligations according to REMIT. As of 7
October 2015, REGIS-TR will support market participants and third parties in reporting standardised
products in phase one of the REMIT implementation.
First nine months of 2015 Clearstream’s net revenue in the first nine months of 2015 rose by 9 per cent to €563.5 million
(Q1–3/2014: €517.8 million). Of this, €18.5 million was attributable to CGSS net revenue in the in-
vestment fund business. EBIT for the first nine months stood at €246.3 million, light decrease compared to the previous
year period (Q1–3/2014: €253.1 million).
The average value of assets under custody from January to September of 2015 increased by 9 per cent
year-on-year to a new nine-monthly record volume of €13.3 trillion (Q1–3/2014: €12.1 trillion).
Clearstream registered a 10 per cent increase in the average value of assets under custody on its inter-
national platform for the first nine months to €7.1 trillion (Q1–3/2014: €6.4 trillion). German domestic
assets increased by 8 per cent to €6.2 trillion (Q1–3/2014: €5.7 trillion). Net revenue in the custody
business rose by 11 per cent to €290.5 million for the first three quarters (Q1–3/2014:
€262.2 million).
The total number of settlement transactions processed by Clearstream in the first nine months went up
by 13 per cent to 104.9 million (Q1–3/2014: 93.2 million). International transactions rose by
3 per cent to 33.6 million (Q1–3/2014: 32.7 million). The number of settled transactions increased
by 2 per cent year-on-year for international OTC and by 10 per cent for on-exchange trades. In the do-
mestic German market, settlement transactions increased considerably to 71.3 million (Q1–3/2014:
60.5 million). In the domestic business, OTC transactions increased by 13 per cent year-on-year and
on-exchange transactions registered a 21 per cent increase in the period under review. Net revenue in
the settlement business went up by 14 per cent to €104.2 million in the first nine months
(Q1–3/2014: €91.3 million).
In its Investment Funds Services business, Clearstream processed 7.5 million transactions in the first
nine months, a 15 per cent increase over the previous year (Q1–3/2014: 6.5 million). The assets held
under custody reached €439.8 billion on average in the first three quarters of 2015 (Q1–3/2014:
€317.0 billion), 39 per cent higher than last year.

19 Group management report
In the first nine months of 2015, outstandings in the GSF business increased to an average of
€613.2 billion, a rise of 2 per cent year-on-year (Q1–3/2014: €601.7 billion). Net revenue went up by
7 per cent to €51.3 million in the first three quarters (Q1–3/2014: €47.8 million).
Overnight customer cash deposits increased by 6 per cent year-on-year to reach an average of
€12.5 billion (Q1–3/2014: €11.8 billion). Adjusted for assets restricted by relevant EU and US
sanction programmes, customer cash deposits stood at €10.9 billion in the first three quarters of
2015 (Q1–3/2014: €10.5 billion). Net interest income from banking business decreased to
€26.6 million in the first nine months of 2015 (Q1–3/2014: €28.4 million).
Market Data + Services segment
Third quarter of 2015 Net revenue rose by 12 per cent to €103.5 million (Q3/2014: €92.5 million). EBIT increased to €44.9 million (Q3/2014: €40.6 million).
In the Information business area – the marketing of real-time and historic market data – the MD+S
segment generated a stable result in the third quarter of 2015: net revenue amounted to €37.0 million
(Q3/2014: €37.9 million).
The Index business area generates its revenue from calculating and marketing indices and benchmarks
that are used by banks and fund management companies, mainly as underlyings or benchmarks for
financial instruments and investment vehicles. Deutsche Börse operates this business via its STOXX AG
subsidiary. Since the end of July 2015, both STOXX AG and Indexium AG have been wholly owned
subsidiaries of Deutsche Börse Group. This increases strategic flexibility and helps the Group to fully
develop existing potential in the fast-growing index business. Net revenue increased by 27 per cent to
€27.4 million in the third quarter (Q3/2014: €21.5 million). The trend among investors towards pas-
sively managed financial products, such as ETFs, led to an increase in assets under management in
Breakdown of net revenue in the Market Data +
Services segment
20 Deutsche Börse Group interim report Q3/2015
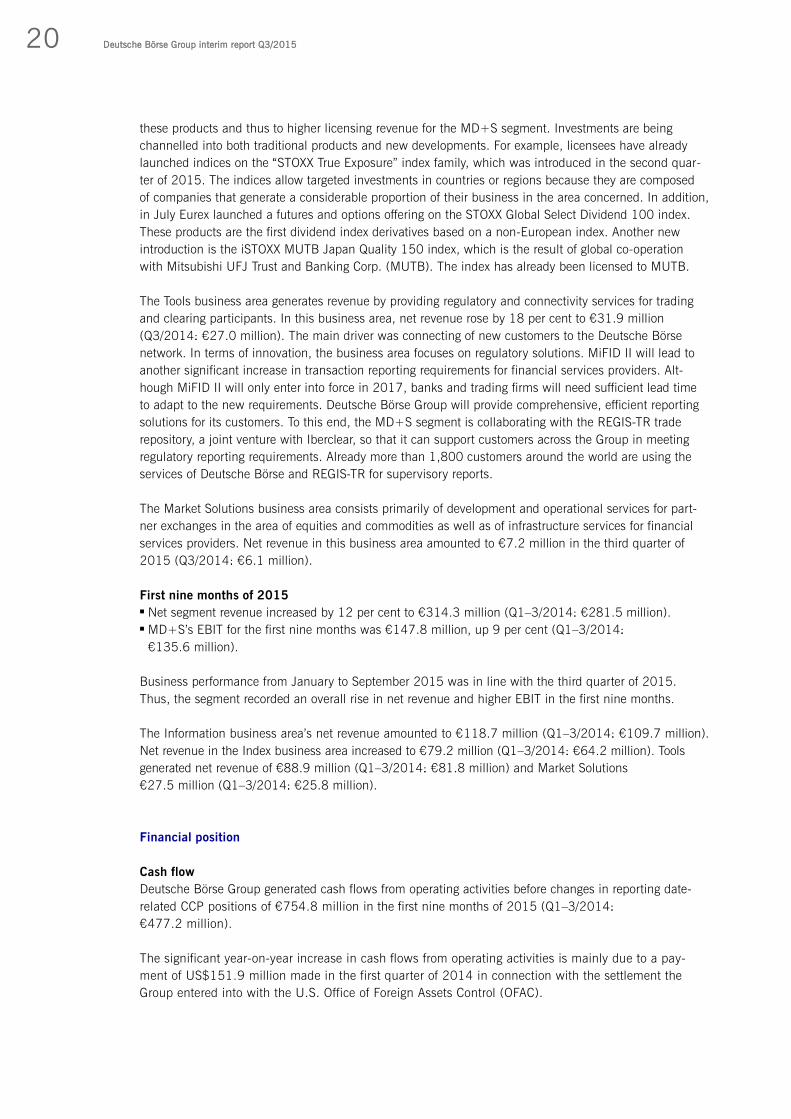
these products and thus to higher licensing revenue for the MD+S segment. Investments are being
channelled into both traditional products and new developments. For example, licensees have already
launched indices on the “STOXX True Exposure” index family, which was introduced in the second quar-
ter of 2015. The indices allow targeted investments in countries or regions because they are composed
of companies that generate a considerable proportion of their business in the area concerned. In addition,
in July Eurex launched a futures and options offering on the STOXX Global Select Dividend 100 index.
These products are the first dividend index derivatives based on a non-European index. Another new
introduction is the iSTOXX MUTB Japan Quality 150 index, which is the result of global co-operation
with Mitsubishi UFJ Trust and Banking Corp. (MUTB). The index has already been licensed to MUTB.
The Tools business area generates revenue by providing regulatory and connectivity services for trading
and clearing participants. In this business area, net revenue rose by 18 per cent to €31.9 million
(Q3/2014: €27.0 million). The main driver was connecting of new customers to the Deutsche Börse
network. In terms of innovation, the business area focuses on regulatory solutions. MiFID II will lead to
another significant increase in transaction reporting requirements for financial services providers. Alt-
hough MiFID II will only enter into force in 2017, banks and trading firms will need sufficient lead time
to adapt to the new requirements. Deutsche Börse Group will provide comprehensive, efficient reporting
solutions for its customers. To this end, the MD+S segment is collaborating with the REGIS-TR trade
repository, a joint venture with Iberclear, so that it can support customers across the Group in meeting
regulatory reporting requirements. Already more than 1,800 customers around the world are using the
services of Deutsche Börse and REGIS-TR for supervisory reports.
The Market Solutions business area consists primarily of development and operational services for part-
ner exchanges in the area of equities and commodities as well as of infrastructure services for financial
services providers. Net revenue in this business area amounted to €7.2 million in the third quarter of
2015 (Q3/2014: €6.1 million).
First nine months of 2015 Net segment revenue increased by 12 per cent to €314.3 million (Q1–3/2014: €281.5 million). MD+S’s EBIT for the first nine months was €147.8 million, up 9 per cent (Q1–3/2014:
€135.6 million).
Business performance from January to September 2015 was in line with the third quarter of 2015.
Thus, the segment recorded an overall rise in net revenue and higher EBIT in the first nine months.
The Information business area’s net revenue amounted to €118.7 million (Q1–3/2014: €109.7 million).
Net revenue in the Index business area increased to €79.2 million (Q1–3/2014: €64.2 million). Tools
generated net revenue of €88.9 million (Q1–3/2014: €81.8 million) and Market Solutions
€27.5 million (Q1–3/2014: €25.8 million).
Financial position
Cash flow
Deutsche Börse Group generated cash flows from operating activities before changes in reporting date-
related CCP positions of €754.8 million in the first nine months of 2015 (Q1–3/2014:
€477.2 million).
The significant year-on-year increase in cash flows from operating activities is mainly due to a pay-
ment of US$151.9 million made in the first quarter of 2014 in connection with the settlement the
Group entered into with the U.S. Office of Foreign Assets Control (OFAC).

21 Group management report
In addition, Deutsche Börse Group made tax payments in the amount of €122.6 million in the first
nine months of 2015 (Q1–3/2014: €188.5 million). The higher tax payments in the previous year
were largely attributable to a non-recurring expense for additional tax payments in Luxembourg for the
years 2009 to 2011.
Other non-cash expenses amounted to €14.3 million (Q1–3/2014: other non-cash income of
€42.8 million) is primarily due to the remeasurement of the interest in Direct Edge in the first quarter
of 2014 following the merger of Direct Edge and BATS.
Deferred tax expenses declined to €9.6 million (Q1–3/2014: €32.9 million). The deferred tax expenses
in the previous year were mainly attributable to a non-recurring effect in connection with the merger
of Direct Edge and BATS.
Including the changes in the CCP positions, cash flows from operating activities were €736.3 million
(Q1–3/2014: €481.1 million).
Cash outflows from investing activities amounted to €872.8 million in the first nine months of 2015
(Q1–3/2014: cash inflows of €104.1 million). The decrease can primarily be attributed to the following
changes:
Cash outflows in connection with maturing collateralised cash investments with an original maturity
of more than three months amounted to €89.7 million (Q1–3/2014: cash inflows of €352.5 million);
in addition, securities in the total amount of €5.5 million matured or were sold (Q1–3/2014:
€92.1 million). Moreover, the Group acquired securities with an original maturity of more than three months in
an amount of €671.7 million (Q1–3/2014: €278.4 million). Due to the consolidation of Powernext and EPEX as at 1 January 2015, cash flows resulted in an
increase of €40.1 million. In the previous year, cash funds increased by €61.5 million due to the
consolidation of the EEX. Since no purchase price was payable in 2015 and 2014, there were no
cash outflows.
Cash outflows from financing activities of €380.2 million were recorded in the first nine months of 2015
(Q1–3/2014: cash outflows of €410.6 million). There was a cash outflow totalling €653.8 million in
connection with the acquisition of the remaining 49.9 per cent of the shares of STOXX AG. This trans-
action was financed by issuing a bond with a principal amount of €600.0 million. A cash outflow of
€150.5 million was incurred in relation to the maturing 2008 series A private placements. In addition,
€1,710.0 million of commercial paper was issued (Q1–3/2014: €974.7 million) and €1,650.0 million
repaid on maturity (Q1–3/2014: €985.0 million). In addition, Deutsche Börse AG made dividend
payments of €386.8 million for financial year 2014 (Q1–3/2014: €386.6 million).
As a result, cash and cash equivalents as at 30 September 2015 amounted to €–592.1 million
(30 September 2014: €118.9 million). Other cash and bank balances amounted to €899.5 million
(30 September 2014: €707.0 million).

22 Deutsche Börse Group interim report Q3/2015
Capital structure As a rule, Deutsche Börse Group aims to achieve a dividend distribution ratio of 40 to 60 per cent of adjusted consolidated net income. Until 2012, the company made additional funds available to its shareholders in the form of share buy-backs. Since 2013 these funds have been used for the company’s further development, for requirements to maintain its credit rating, and for capital requirements, which depend on the legal and regulatory framework. To further develop the company, the Group announced the acquisitions of STOXX AG (including Indexium AG) and 360T Beteiligungs GmbH as part of its growth programme “Accelerate” in the third quarter of 2015. Both of these acquisitions were closed before the publication of this interim report. In accordance with Group-wide capital management and in line with Deutsche Börse AG’s credit rating, the company invested a total of €1.3 billion to fund the transactions. In general, customers of the company expect to have conservative interest coverage and debt/equity ratios and to maintain strong credit ratings. Deutsche Börse Group continues to pursue its objective of achieving an interest coverage ratio (ratio of EBITDA to interest expenses from financing activities) of at least 16 at Group level. The Group met this objective in the first nine months of 2015, achieving an interest coverage ratio of 27.6 (Q1–3/2014: 26.4). This figure is based on a relevant interest expense of €35.8 million and an adjusted EBITDA of €1,317.7 million. In addition, Deutsche Börse aims to achieve a ratio of interest-bearing gross debt to EBITDA of no more than 1.5 at Group level. In the first nine months, the Group achieved a ratio of gross debt to EBITDA of 1.4. This figure is based on gross debt of €1,865.7 million and an adjusted EBITDA of €1,317.6 mil-lion. Gross debt includes interest-bearing liabilities of €1,745.7 million and commercial paper of €120.0 million outstanding at the end of the third quarter. To fund the full acquisition of STOXX AG (including Indexium AG) and 360T Beteiligungs GmbH, it raised €1.1 billion in debt. On 30 July, Deutsche Börse AG successfully placed a hybrid bond with an aggregate principal amount
of €600.0 million, due in 2041. The bond carries an annual coupon of 2.75 per cent until the first repayment date in February 2021. After that, the bond will have a floating coupon, with adjustments once a year in February.
On 1 October, Deutsche Börse placed another bond, in this case a senior bond with an aggregate prin-cipal amount of €500 million, due in 2025. The bond bears annual interest of 1.625 per cent.
Deutsche Börse additionally placed 2,475,248 treasury shares on 3 September 2015, generating pro-ceeds of €200 million. Due to the two bond issues, the ratio of gross debt to EBITDA is expected to rise to around 1.9 as at the end of financial year 2015. Deutsche Börse aims to return to a level of 1.5 for this ratio mainly by increasing EBITDA. In combination with the financing mix for the 360T acquisition, on 9 October Standard & Poor’s confirmed Deutsche Börse AG’s “AA” credit rating, but changed the out-look from stable to negative. Moreover, to ensure the continued success of the Clearstream segment, which is active in securities custody and settlement, the company aims to retain Clearstream Banking S.A.’s strong “AA” credit rating. On 15 October 2015, Fitch Ratings affirmed Clearstream Banking S.A.’s “AA” rating with a stable out-look. The rating reflects the company’s very low risk appetite, combined with stringent risk control frameworks, prudent liquidity management and sound capitalisation.

23 Group management report
Net assets
As at 30 September 2015, Deutsche Börse Group’s non-current assets amounted to €15,405.6 million
(30 September 2014: €8,905.7 million). They consisted primarily of intangible assets and financial
assets as well as of financial instruments of its central counterparties. Intangible assets primarily
included goodwill of €2,337.5 million (30 September 2014: €2,165.2 million) and other intangible
assets of €1,101.2 million (30 September 2014: €945.7 million). Receivables and securities from
banking business of €1,923.1 million (30 September 2014: €1,378.7 million) accounted for the larg-
est part of financial assets, which amounted to €2,193.6 million as at the balance sheet date (30 Sep-
tember 2014: €1,656.8 million). Non-current assets were matched by equity of €3,584.4 million
(30 September 2014: €3,508.9 million). Non-current liabilities totalling €11,958.7 million (30 Septem-
ber 2014: €5,705.0 million) mainly related to financial instruments of the central counterparties
amounting to €9,164.5 million (30 September 2014: €3,678.5 million), which are reported separately
from the current financial instruments of the central counterparties due to a maturity of more than three
months, interest-bearing liabilities of €2,045.7 million (30 September 2014: €1,418.0 million) as well
as deferred tax liabilities of €476.6 million (30 September 2014: €350.7 million).
Among other things, changes in current liabilities were the result of the decrease in liabilities from
banking business to €14,877.6 million (30 September 2014: €14,427.6 million). Commercial paper
amounting to nominally €120.0 million was outstanding as at the end of the third quarter of 2015
(30 September 2014: €90.0 million).
Report on post-balance sheet date events
As announced in July 2015, Deutsche Börse AG acquired all shares of 360T Beteiligungs GmbH effec-
tive 15 October 2015. As a result, it controls 360T Beteiligungs GmbH and its subsidiaries; and now
includes these companies in full in its consolidated financial statements.
Risk report
Deutsche Börse Group provides detailed information on its operating environment, strategy, principles,
organisation, processes, methods and concepts of its risk management in its 2014 corporate report
on pages 144 to 171. The assessment of operational, financial, business and project-related risks did
not change significantly in the period under review. Following the completion of the acquisition on 15
October 2015, 360T will in future be included in the assessment of Deutsche Börse Group’s risks.
Operational risks for Deutsche Börse Group relate to availability, processing, material goods, as well as
litigation and business practice. Further information concerning operational risk and the measures to
mitigate them can be found in Deutsche Börse Group’s corporate report 2014 on pages 156 to 163.

24 Deutsche Börse Group interim report Q3/2015
On 12 November 2012, the Chicago Board Options Exchange (CBOE) filed a patent infringement law
suit against the International Securities Exchange (ISE) (the “CBOE Litigation”). In the CBOE Litigation,
CBOE alleges US$525 million in damages for infringement of three patents, which relate to systems
and methods for limiting market-maker risk. ISE believes that CBOE’s damages claim lacks merit be-
cause it is unsupported by the facts and the law. ISE intends to vigorously defend itself in this lawsuit.
Upon ISE’s motion, the case was stayed, pending the outcome of certain petitions filed by ISE with the
U.S. Patent and Trademark Office (USPTO) in which ISE sought to invalidate the CBOE patents. On
2 March 2015, the USPTO has partially granted ISE’s petitions and has issued decisions determining
that all three CBOE patents are at least insofar invalid as they constitute unpatentable abstract ideas.
These decisions have been appealed by CBOE to the U.S. Court of Appeals for the Federal Circuit. A
decision on those appeals is expected in H2/2016.
In its 2012 corporate report, Deutsche Börse Group informed about proceedings, Peterson vs Clear-
stream Banking S.A., the first Peterson proceeding, initiated by various plaintiffs seeking turnover of
certain customer positions held in Clearstream Banking S.A.’s securities omnibus account with its US
depository bank, Citibank NA, and asserting direct claims against Clearstream Banking S.A. for damages
of US$250 million. That matter was settled between Clearstream Banking S.A. and the plaintiffs and the
direct claims against Clearstream Banking S.A. were abandoned.
In July 2013, the US court ordered turnover of the customer positions to the plaintiffs, ruling that these
were owned by Bank Markazi, the Iranian central bank. Bank Markazi appealed, and the decision was
affirmed on 9 July 2014. Bank Markazi has sought review in the Supreme Court. Once that process is
complete, if the funds are turned over, a related case, Heiser vs Clearstream Banking S.A., also seeking
turnover of the same assets, will be dismissed.
On 30 December 2013, a number of US plaintiffs from the first Peterson case, as well as other US
plaintiffs, filed a complaint targeting turnover of certain blocked assets that Clearstream Banking S.A.
holds as a custodian in Luxembourg. In 2014, the defendants in this action, including Clearstream
Banking S.A., moved to dismiss the case. On 19 February 2015, the US court issued a decision grant-
ing the defendants’ motions and dismissing the lawsuit. On 6 March 2015, the plaintiffs appealed the
decision to the Second Circuit Court of Appeals.
On 2 April 2014, Clearstream Banking S.A. was informed that the United States Attorney for the South-
ern District of New York has opened a grand jury investigation against Clearstream Banking S.A. due to
Clearstream Banking S.A.’s conduct with respect to Iran and other countries subject to US sanction laws.
Clearstream Banking S.A. is cooperating with the US attorney.
A dispute has arisen between MBB Clean Energy AG (MBB), the issuer of a bond eligible in Clearstream
Banking AG, and end investors. MBB issued a first tranche of the bond in April 2013 and a second
tranche of the bond in December 2013. The global certificates for the two tranches of the bond were
delivered into Clearstream Banking AG by the paying agent of the issuer. The dispute relates to the non-
payment of the second tranche of the bond with a nominal value of €500 million and the purported lack
of validity of the bond. Clearstream Banking AG’s role in the dispute on the purported lack of validity of
the MBB Clean Energy AG bond is primarily to safekeep the global note, deposited by the paying agent
of the issuer, as national central securities depository. At this stage, it is unclear if and to what extent
potential damages exist and if so who would ultimately be responsible. Insolvency proceedings have
meanwhile been opened in respect of the issuer, MBB Clean Energy AG.

25 Group management report
Deutsche Börse Group is exposed to financial risks mainly in the form of credit risk and liquidity risk
in the financial institutions of the Clearstream Holding group and Eurex Clearing AG. In addition, the
Group’s cash investments and receivables are subject to credit risk. The majority of cash investments
involve short-term transactions that are collateralised, thus minimising liquidity risk as well as market
price risk from cash investments. Market price risk is immaterial for the entire Group. Further infor-
mation on financial risks can be found on pages 163 to 169 of the 2014 corporate report.
Business risk reflects the sensitivity of the Group to macroeconomic developments and its vulnerability
to event risk, such as regulatory initiatives or changes in the competitive environment. In addition, it
includes the Group’s strategic risk, which relates to the impact of risk on the business strategy and
any resulting adjustment to the strategy. Furthermore, external factors such as a lack of investor confi-
dence in the financial markets may impact financial performance. Further information concerning
business risks can be found on pages 169 and 170 of the 2014 corporate report.
Currently, the Group is pursuing several major projects. These are constantly monitored to identify
risks at an early stage and enable appropriate countermeasures to be taken. Further information con-
cerning project risks can be found in the 2014 corporate report on page 170.
The Group evaluates its risk situation on an ongoing basis. Taking into account the stress test calcu-
lations performed, the required economic capital and earnings at risk as well as the risk management
system, which it considers to be effective, the Executive Board of Deutsche Börse AG is of the opinion
that the risk-bearing capacity of the Group is sufficient. A significant change in the Group’s risk profile
cannot be identified at present.
Report on opportunities
Deutsche Börse Group’s management of opportunities aims to identify and assess opportunities as
early as possible and to initiate appropriate measures in order to take advantage of opportunities and
transform them into business success. At present, the Executive Board cannot identify any significant
change in the Group’s opportunities that were described in detail in the 2014 corporate report on
pages 172 to 178. The Group has, however, made excellent progress with the implementation of its
Accelerate growth programme, which was announced in July. In particular the completion of the
acquisition of STOXX and 360T and the resulting access to the highly attractive FX trading market
should make a significant contribution to the Group’s future growth. In addition, organisational measures
have been implemented to support the group’s growth ambitions. They include, among others, the
global coordination of sales activities and product development across different business areas.
As part of its growth initiatives, Deutsche Börse Group made further progress in the third quarter relat-
ing to the structural growth opportunities described in the 2014 corporate report, including OTC
derivatives clearing, collateral and liquidity management and its expansion in Asia.
26 Deutsche Börse Group interim report Q3/2015
With respect to the TARGET2-Securities (T2S) project, the European Central Bank (ECB) completed the
first of four migration phases in August 2015. Clearstream has invested considerate amounts in adapting
its systems to the new settlement structure. It will be connected to T2S in wave 3. This will result in the
opportunity for the Group to gain new customers for Clearstream’s innovative services, such as global
liquidity management. Moreover, by connecting Northern Trust, Clearstream has added another customer
for its fund custody business, one of the main drivers of Clearstream’s growth in the area of investment
funds. Furthermore, thanks to its cash and derivatives market product offering in the power and the gas
markets, the Group believes it is in a very good position to participate in the structural growth of the
energy markets.
In the index business, the Group aims to give STOXX, which is already established as an index provider
in Europe, a more global reach so that other indices can be developed and marketed worldwide along-
side the DAX® and STOXX® index families. In the first nine months of 2015, ETF assets under manage-
ment based on Deutsche Börse indices increased by 12 per cent. In addition to diversifying the range of
indices, Deutsche Börse is also benefiting in this area from the growing structural trend among investors
towards passively managed funds.
In addition to structural growth opportunities, Deutsche Börse Group has cyclical opportunities. The
uncertainty regarding global economic performance and developments in key interest rates going forward,
which has dominated the market since the end of the third quarter of 2014, has increased volatility on
the stock and interest rate markets. These developments again resulted in higher demand for hedging
among market participants in the third quarter of 2015. As a result, trading volumes almost matched
the level achieved in previous quarters.
Although the company cannot influence these cyclical opportunities directly, they could lift Deutsche
Börse Group’s net revenue and consolidated net income significantly.
Report on expected developments
The report on expected developments describes how Deutsche Börse Group is expected to perform in
financial year 2015. It contains statements and information on events in the future. These forward-
looking statements and information are based on the company’s expectations and assumptions at the
time of publication of this report. In turn, these are subject to known and unknown opportunities, risks
and uncertainties. Numerous factors influence the Group’s success, its business strategy and financial
results. Many of these factors are outside the company’s control. Should opportunities, risks, or uncer-
tainties materialise or one of the assumptions made turn out to be incorrect, the actual development of
the Group could deviate either positively or negatively from the expectations and assumptions contained
in the forward-looking statements and information contained in this report on expected developments.
Deutsche Börse Group is not planning any fundamental change to its operating policies in the coming
years.
Development of results of operations
For the remainder of financial year 2015, Deutsche Börse Group does not expect any material devia-
tion from the forecasts for its operating environment made in its 2014 consolidated financial state-
ments.

27 Group management report
Given the clearly positive business performance in the first quarter of 2015, the consolidation of the APX Holding group in the course of the year and the significant appreciation of the US dollar against the euro, the Group lifted its forecast for 2015 on publication of the figures for the first quarter of 2015. The fore-cast range for net revenue was increased by €100 million. The Group thus expects net revenue to in-crease to around €2,200 million to €2,400 million in 2015. In addition, operating costs of approxi-mately €1,230 million (adjusted for non-recurring items) were anticipated. Following the completion of the acquisition of 360T at the beginning of the fourth quarter of 2015, this company will be included in full in Deutsche Börse Group’s consolidated financial statements. The revision to the forecast range for net revenue after Q1/2015 also affects EBIT and net income for the year adjusted for non-recurring items. EBIT adjusted for one-off effects is expected to amount to between approximately €975 million and €1,175 million (originally €925 million to €1,125 million). As a result, the Group now expects full-year costs of approximately €1,245 million, plus one-off effects of €110 million. Thus, both net revenue and EBIT are at the upper end of the full-year forecast ranges, which were lifted in the first quarter, thanks to the continued positive business development in the second and third quarters of 2015. As before, the Group anticipates a tax rate of approximately 26 per cent for the forecast period, adjusted for any non-recurring items. Due to the city of Eschborn’s plans to increase its trade income tax multipli-er, the Group expects a slight increase in the tax rate to 27 per cent. The financial result for 2015 as a whole will improve as a result of positive exchange rate effects in the first quarter due to the increase in holdings of US dollars. Consolidated net income for the period is expected to amount to approximately €675 million to €825 million (originally €625 million to €775 million), adjusted for one-off effects in both cases. The assumptions on which the forecast is based can be found on pages 178 to 185 of the 2014 corporate report. Development of the Group’s financial position
The company expects cash flows from operating activities to remain clearly positive in the future; these are Deutsche Börse Group’s main financing instrument. The company plans to invest amounts of around €150 million per year in intangible assets and property, plant and equipment at Group level. The investments will serve primarily to develop new products and services in the Eurex and Clear-stream segments and enhance existing ones. The total mainly comprises investments in the trading infrastructure and risk management functionalities.
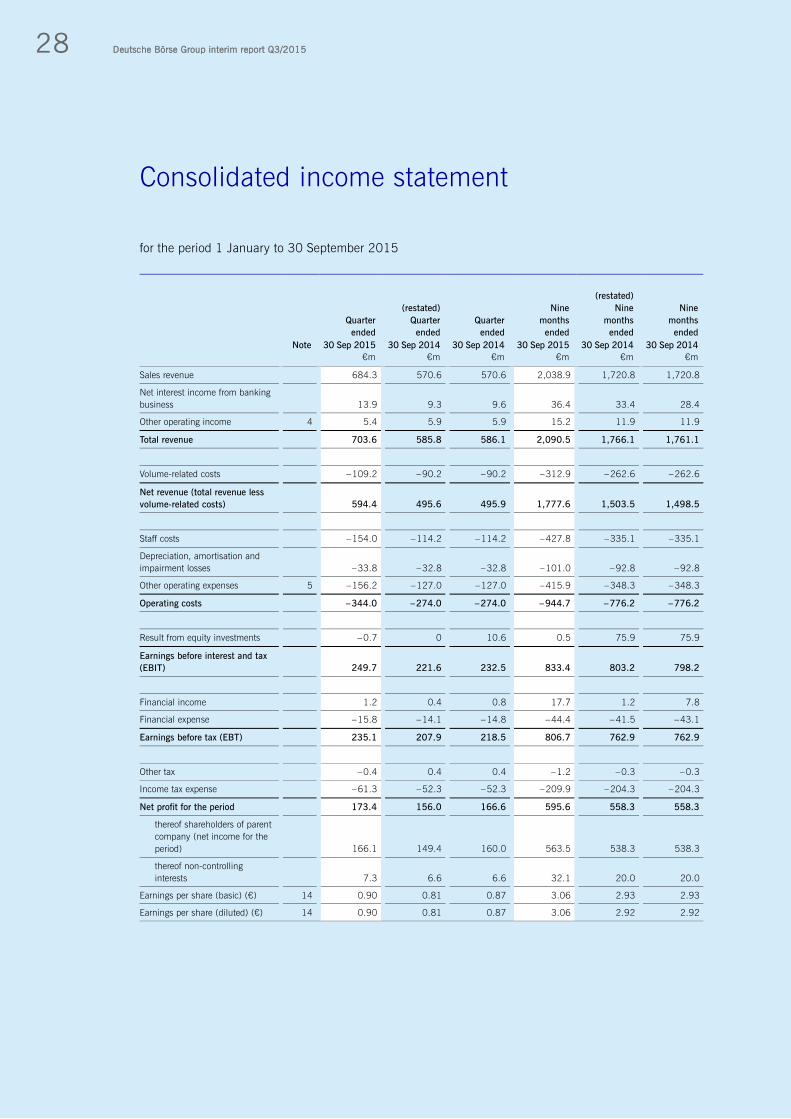
28 Deutsche Börse Group interim report Q3/2015
for the period 1 January to 30 September 2015
Quarter
ended
(restated)
Quarter
ended
Quarter
ended
Nine
months
ended
(restated)
Nine
months
ended
Nine
months
ended
Note 30 Sep 2015 30 Sep 2014 30 Sep 2014 30 Sep 2015 30 Sep 2014 30 Sep 2014
€m €m €m €m €m €m
Sales revenue 684.3 570.6 570.6 2,038.9 1,720.8 1,720.8
Net interest income from banking
business 13.9 9.3 9.6 36.4 33.4 28.4
Other operating income 4 5.4 5.9 5.9 15.2 11.9 11.9
Total revenue 703.6 585.8 586.1 2,090.5 1,766.1 1,761.1
Volume-related costs – 109.2 – 90.2 – 90.2 – 312.9 – 262.6 – 262.6
Net revenue (total revenue less
volume-related costs) 594.4 495.6 495.9 1,777.6 1,503.5 1,498.5
Staff costs – 154.0 – 114.2 – 114.2 – 427.8 – 335.1 – 335.1
Depreciation, amortisation and
impairment losses – 33.8 – 32.8 – 32.8 – 101.0 – 92.8 – 92.8
Other operating expenses 5 – 156.2 – 127.0 – 127.0 – 415.9 – 348.3 – 348.3
Operating costs – 344.0 – 274.0 – 274.0 – 944.7 – 776.2 – 776.2
Result from equity investments – 0.7 0 10.6 0.5 75.9 75.9
Earnings before interest and tax
(EBIT) 249.7 221.6 232.5 833.4 803.2 798.2
Financial income 1.2 0.4 0.8 17.7 1.2 7.8
Financial expense – 15.8 – 14.1 – 14.8 – 44.4 – 41.5 – 43.1
Earnings before tax (EBT) 235.1 207.9 218.5 806.7 762.9 762.9
Other tax – 0.4 0.4 0.4 – 1.2 – 0.3 – 0.3
Income tax expense – 61.3 – 52.3 – 52.3 – 209.9 – 204.3 – 204.3
Net profit for the period 173.4 156.0 166.6 595.6 558.3 558.3
thereof shareholders of parent
company (net income for the
period) 166.1 149.4 160.0 563.5 538.3 538.3
thereof non-controlling
interests 7.3 6.6 6.6 32.1 20.0 20.0
Earnings per share (basic) (€) 14 0.90 0.81 0.87 3.06 2.93 2.93
Earnings per share (diluted) (€) 14 0.90 0.81 0.87 3.06 2.92 2.92
Consolidated income statement
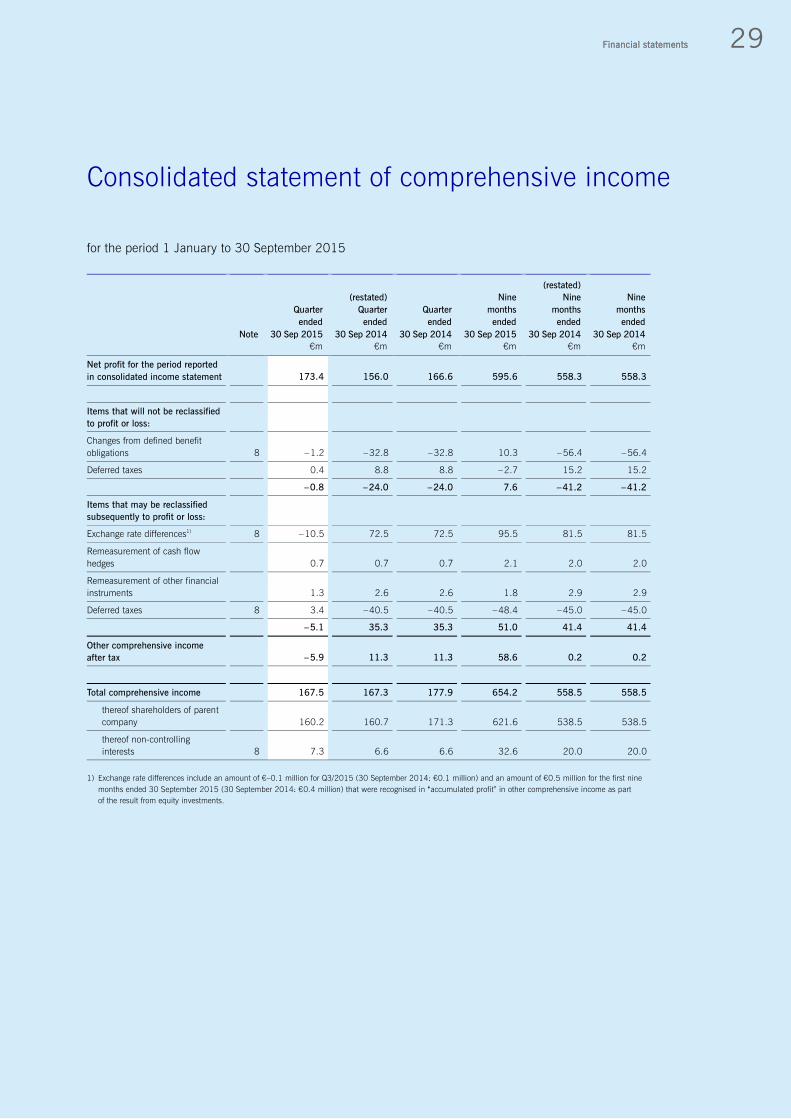
29 Financial statements
for the period 1 January to 30 September 2015
Quarter
ended
(restated)
Quarter
ended
Quarter
ended
Nine
months
ended
(restated)
Nine
months
ended
Nine
months
ended
Note 30 Sep 2015 30 Sep 2014 30 Sep 2014 30 Sep 2015 30 Sep 2014 30 Sep 2014
€m €m €m €m €m €m
Net profit for the period reported
in consolidated income statement 173.4 156.0 166.6 595.6 558.3 558.3
Items that will not be reclassified
to profit or loss:
Changes from defined benefit
obligations 8 – 1.2 – 32.8 – 32.8 10.3 – 56.4 – 56.4
Deferred taxes 0.4 8.8 8.8 – 2.7 15.2 15.2
– 0.8 – 24.0 – 24.0 7.6 – 41.2 – 41.2
Items that may be reclassified
subsequently to profit or loss:
Exchange rate differences1) 8 – 10.5 72.5 72.5 95.5 81.5 81.5
Remeasurement of cash flow
hedges 0.7 0.7 0.7 2.1 2.0 2.0
Remeasurement of other financial
instruments 1.3 2.6 2.6 1.8 2.9 2.9
Deferred taxes 8 3.4 – 40.5 – 40.5 – 48.4 – 45.0 – 45.0
– 5.1 35.3 35.3 51.0 41.4 41.4
Other comprehensive income
after tax – 5.9 11.3 11.3 58.6 0.2 0.2
Total comprehensive income 167.5 167.3 177.9 654.2 558.5 558.5
thereof shareholders of parent
company 160.2 160.7 171.3 621.6 538.5 538.5
thereof non-controlling
interests 8 7.3 6.6 6.6 32.6 20.0 20.0
1) Exchange rate differences include an amount of €–0.1 million for Q3/2015 (30 September 2014: €0.1 million) and an amount of €0.5 million for the first nine
months ended 30 September 2015 (30 September 2014: €0.4 million) that were recognised in “accumulated profit” in other comprehensive income as part
of the result from equity investments.
Consolidated statement of comprehensive income

30 Deutsche Börse Group interim report Q3/2015
as at 30 September 2015
Assets
Note 30 Sep 2015 (restated)
31 Dec 20141) 31 Dec 2014 30 Sep 2014 €m €m €m €m
NON-CURRENT ASSETS
Intangible assets 6
Software 208.8 221.1 221.3 201.3
Goodwill 2,337.5 2,225.0 2,224.5 2,165.2
Payments on account and construction in progress 144.4 100.2 100.2 92.8
Other intangible assets 1,101.2 980.2 980.5 945.7
3,791.9 3,526.5 3,526.5 3,405.0
Property, plant and equipment 6
Fixtures and fittings 36.2 37.4 37.4 36.5
Computer hardware, operating and office equipment 58.3 62.3 62.3 56.5
Payments on account and construction in progress 6.8 1.2 1.2 0.1
101.3 100.9 100.9 93.1
Financial assets 7
Investments in associates and joint ventures 33.6 104.2 104.2 91.5
Other equity investments 205.4 166.8 166.8 161.0
Receivables and securities from banking business 1,923.1 1,305.0 1,305.0 1,378.7
Other financial instruments 31.0 25.8 25.8 25.2
Other loans 0.5 0.4 0.4 0.4
2,193.6 1,602.2 1,602.2 1,656.8
Financial instruments of the central counterparties 9,164.5 5,885.8 5,885.8 3,678.5
Other non-current assets 11.6 11.5 11.5 12.0
Deferred tax assets 142.7 140.3 140.3 60.3
Total non-current assets 15,405.6 11,267.2 11,267.2 8,905.7
CURRENT ASSETS
Receivables and other current assets
Financial instruments of the central counterparties 160,304.2 170,251.0 170,251.0 191,643.2
Receivables and securities from banking business 14,147.2 10,307.1 10,307.1 13,984.9
Trade receivables 528.3 342.9 342.9 359.8
Receivables from related parties 1.2 1.0 1.0 0.9
Income tax receivables 2) 86.0 75.0 75.0 22.9
Other current assets 325.9 554.3 554.3 284.4
175,392.8 181,531.3 181,531.3 206,296.1
Restricted bank balances 31,154.5 22,283.5 22,283.5 24,821.3
Other cash and bank balances 899.5 826.1 826.1 707.0
Total current assets 207,446.8 204,640.9 204,640.9 231,824.4
Total assets 11 222,852.4 215,908.1 215,908.1 240,730.1
Consolidated balance sheet

31 Financial statements
Equity and liabilities
Note 30 Sep 2015
(restated)
31 Dec 20141) 31 Dec 2014 30 Sep 2014
€m €m Mio. € €m
EQUITY 8
Subscribed capital 193.0 193.0 193.0 193.0
Share premium 1,325.5 1,249.0 1,249.0 1,249.0
Treasury shares – 315.5 – 443.0 – 443.0 – 443.0
Revaluation surplus – 5.2 – 15.9 – 15.9 – 8.2
Accumulated profit 2,242.8 2,446.6 2,446.6 2,201.1
Shareholders’ equity 3,440.6 3,429.7 3,429.7 3,191.9
Non-controlling interests 143.8 322.4 322.4 317.0
Total equity 3,584.4 3,752.1 3,752.1 3,508.9
NON-CURRENT LIABILITIES
Provisions for pensions and other employee
benefits 9 148.5 145.6 145.6 143.3
Other non-current provisions 105.5 110.5 110.5 103.7
Deferred tax liabilities 476.6 379.5 379.5 350.7
Interest-bearing liabilities 2,045.7 1,428.5 1,428.5 1,418.0
Financial instruments of the central
counterparties 9,164.5 5,885.8 5,885.8 3,678.5
Other non-current liabilities 17.9 12.6 12.6 10.8
Total non-current liabilities 11,958.7 7,962.5 7,962.5 5,705.0
CURRENT LIABILITIES
Tax provisions 362.4 282.7 282.7 229.3
Other current provisions 102.5 108.1 108.1 96.6
Financial instruments of the central
counterparties 159,948.0 169,001.9 169,001.9 191,143.2
Liabilities from banking business 14,877.6 11,487.1 11,487.1 14,427.6
Other bank loans and overdrafts 12.9 0.7 0.7 1.1
Trade payables 351.2 221.2 221.2 192.9
Liabilities to related parties 0.5 1.6 1.6 2.2
Cash deposits by market participants 31,153.4 22,282.4 22,282.4 24,821.3
Other current liabilities 500.8 807.8 807.8 602.0
Total current liabilities 207,309.3 204,193.5 204,193.5 231,516.2
Total liabilities 219,268.0 212,156.0 212,156.0 237,221.2
Total equity and liabilities 11 222,852.4 215,908.1 215,908.1 240,730.1
1) The adjusted consolidated balance sheet as at 31 December 2014 reflects the changes resulting from the purchase price allocation for Clearstream Global Securi-
ties Services Limited, Cork, Ireland. For details see note 2 of this interim report.
2) Thereof €1.6 million (31 December 2014: €6.8 million and 30 September 2014: €6.3 million) with a remaining maturity of more than one year from corporation
tax credits in accordance with section 37 (5) of the Körperschaftsteuergesetz (KStG, the German Corporation Tax Act)

32 Deutsche Börse Group interim report Q3/2015
for the period 1 January to 30 September 2015
Quarter ended Nine months ended
Twelve-months
period as at
Note
30 Sep
2015
30 Sep
2014
30 Sep
2014
30 Sep
2015
30 Sep
2014
30 Sep
2014
€m €m €m €m €m €m
Net profit for the period 173.4 156.0 595.6 558.3 825.8 688.6
Depreciation, amortisation and impairment losses 6 33.8 32.8 101.0 92.8 133.0 124.0
Increase/(decrease) in non-current provisions 7.6 1.7 8.6 – 3.2 7.5 – 16.0
Deferred tax expense/(income) 8 7.5 2.1 9.6 32.9 – 72.1 34.9
Cash flows from derivatives 0 0 0 0 0 – 2.0
Other non-cash (income)/expense 16.4 8.4 14.3 – 42.8 10.4 – 35.3
Changes in working capital, net of non-cash
items: 40.8 21.5 25.2 – 162.1 56.2 – 132.6
(Increase)/decrease in receivables and other
assets 39.1 47.3 – 26.3 – 41.3 – 48.0 – 60.7
Increase/(decrease) in current liabilities 12.1 – 25.9 64.6 – 127.8 115.5 – 76.3
Increase in non-current liabilities – 10.4 0.1 – 13.1 7.0 – 11.3 4.4
Net loss on disposal of non-current assets 0.1 1.1 0.5 1.3 1.6 – 0.5
Cash flows from operating activities excluding
CCP positions 279.6 223.6 754.8 477.2 962.4 661.1
Changes from liabilities from CCP positions – 77.5 2.6 – 283.3 7.2 – 14.9 21.5
Changes in receivables from CCP positions 56.0 – 0.3 264.8 – 3.3 – 15.0 – 10.6
Cash flows from operating activities 258.1 225.9 736.3 481.1 932.5 672.0
Payments to acquire intangible assets – 25.8 – 24.3 – 79.4 – 69.7 – 112.6 – 98.1
Payments to acquire property, plant and
equipment – 10.0 – 7.8 – 23.3 – 13.6 – 40.3 – 27.2
Payments to acquire non-current financial
instruments – 198.4 – 183.0 – 714.8 – 316.7 – 765.3 – 316.8
Payments to acquire investments in associates
and joint ventures 0 – 1.3 – 2.0 – 2.5 – 13.1 – 7.4
Payments to acquire subsidiaries, net of cash
acquired 0 0 36.1 58.4 – 11.1 58.4
Effects of the disposal of (shares in) subsidiaries,
net of cash disposed 0 0 – 5.2 0 – 5.2 0
Proceeds from the disposal of shares in
associates and joint ventures 0 3.6 0 3.6 0 3.6
(Net increase)/net decrease in current receivables
and securities from banking business with an
original term greater than three months – 299.9 – 257.0 – 89.7 352.5 – 510.3 285.3
Proceeds from disposals of available-for-sale
non-current financial instruments 0.8 0 5.5 92.1 230.6 117.4
Cash flows from investing activities – 533.3 – 469.8 – 872.8 104.1 – 1,227.3 15.2
Consolidated cash flow statement

33 Financial statements
Quarter ended Nine months ended
Twelve-months
period as at
Note
30 Sep
2015
30 Sep
2014
30 Sep
2015
30 Sep
2014
30 Sep
2015
30 Sep
2014
Mio. € Mio. € Mio. € Mio. € Mio. € Mio. €
Proceeds from sale of treasury shares 202.3 2.4 202.3 2.4 202.3 2.4
Payments to non-controlling interests – 669.1 – 0.4 – 704.8 – 16.1 – 705.3 – 16.1
Proceeds from non-controlling interests 3.2 0 3.2 0 3.2 0
Repayment of long-term financing 0 0 – 150.5 0 – 150.5 0
Proceeds from long-term financing 596.4 0 596.4 0 596.4 0
Repayment of short-term financing – 1,080.0 – 445.0 – 1,650.0 – 985.0 – 1,870.0 – 1,360.0
Proceeds from short-term financing 825.0 334.9 1,710.0 974.7 1,900.0 1,194.7
Dividends paid 0 0 – 386.8 – 386.6 – 386.8 – 386.6
Cash flows from financing activities – 122.2 – 108.1 – 380.2 – 410.6 – 410.7 – 565.6
Net change in cash and cash equivalents – 397.4 – 352.0 – 516.7 174.6 – 705.5 121.6
Effect of exchange rate differences – 6.5 0.1 – 6.9 0.5 – 5.5 – 1.5
Cash and cash equivalents as at beginning of period – 188.2 470.8 – 68.5 – 56.2 118.9 – 1.2
Cash and cash equivalents as at end of period 13 – 592.1 118.9 – 592.1 118.9 – 592.1 118.9
Additional information to payments reflected within
cash flows from operating activities:
Interest income and other similar income 44.3 0.6 136.4 7.5 146.6 10.6
Dividends received 0 6.5 2.0 24.6 2.3 24.7
Interest paid – 49.0 – 1.2 – 126.6 – 22.0 – 156.3 – 50.4
Income tax paid – 16.8 – 43.3 – 122.6 – 188.5 – 171.1 – 205.5
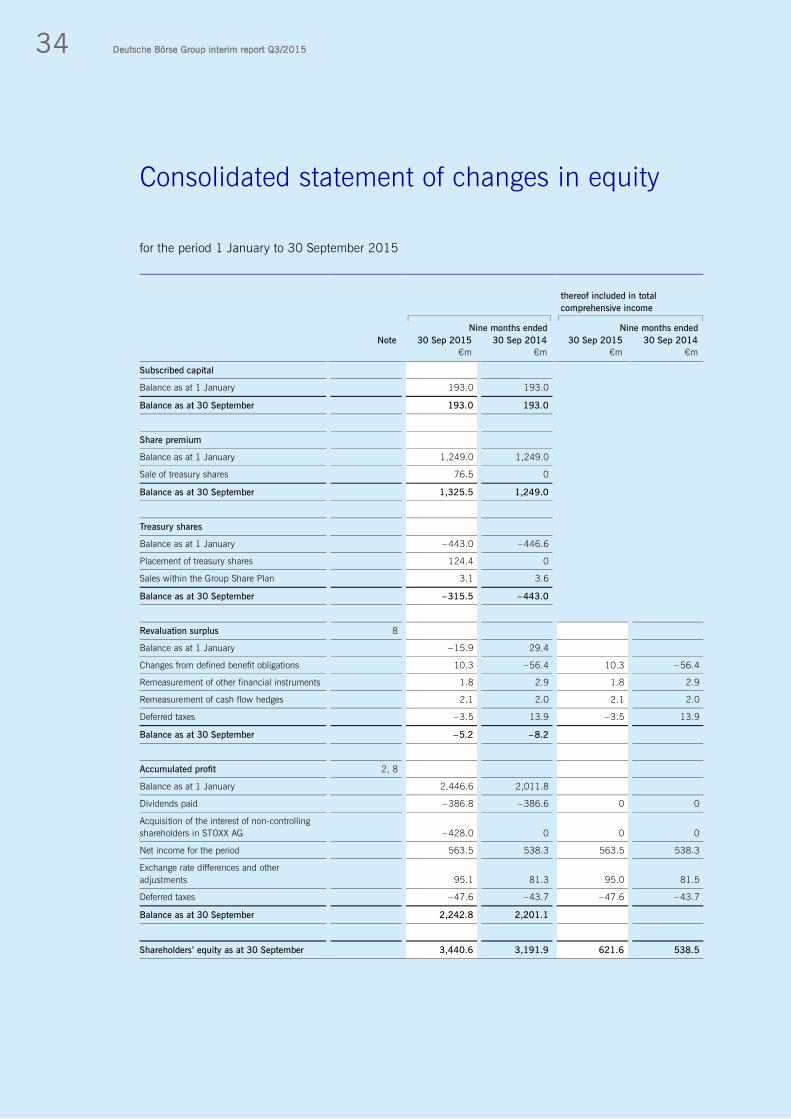
34 Deutsche Börse Group interim report Q3/2015
for the period 1 January to 30 September 2015
thereof included in total
comprehensive income
Nine months ended Nine months ended
Note 30 Sep 2015 30 Sep 2014 30 Sep 2015 30 Sep 2014
€m €m €m €m
Subscribed capital
Balance as at 1 January 193.0 193.0
Balance as at 30 September 193.0 193.0
Share premium
Balance as at 1 January 1,249.0 1,249.0
Sale of treasury shares 76.5 0
Balance as at 30 September 1,325.5 1,249.0
Treasury shares
Balance as at 1 January – 443.0 – 446.6
Placement of treasury shares 124.4 0
Sales within the Group Share Plan 3.1 3.6
Balance as at 30 September – 315.5 – 443.0
Revaluation surplus 8
Balance as at 1 January – 15.9 29.4
Changes from defined benefit obligations 10.3 – 56.4 10.3 – 56.4
Remeasurement of other financial instruments 1.8 2.9 1.8 2.9
Remeasurement of cash flow hedges 2.1 2.0 2.1 2.0
Deferred taxes – 3.5 13.9 – 3.5 13.9
Balance as at 30 September – 5.2 – 8.2
Accumulated profit 2, 8
Balance as at 1 January 2,446.6 2,011.8
Dividends paid – 386.8 – 386.6 0 0
Acquisition of the interest of non-controlling
shareholders in STOXX AG – 428.0 0 0 0
Net income for the period 563.5 538.3 563.5 538.3
Exchange rate differences and other
adjustments 95.1 81.3 95.0 81.5
Deferred taxes – 47.6 – 43.7 – 47.6 – 43.7
Balance as at 30 September 2,242.8 2,201.1
Shareholders’ equity as at 30 September 3,440.6 3,191.9 621.6 538.5
Consolidated statement of changes in equity

35 Financial statements
thereof included in total
comprehensive income
Nine months ended Nine months ended
Note 30 Sep 2015 30 Sep 2014 30 Sep 2015 30 Sep 2014
€m €m €m €m
Shareholders’ equity (brought forward) 3,440.6 3,191.9 621.6 538.5
Non-controlling interests
Balance as at 1 January 322.4 231.4
Acquisition of the interest of non-controlling
shareholders in STOXX AG – 225.8 0 0 0
Changes due to capital increases 8 14.8 65.3 0 0
Changes due to share in net income of
subsidiaries for the period 8 32.1 20.0 32.1 20.0
Exchange rate differences and other
adjustments 0.3 0.3 0.5 0
Total non-controlling interests as at 30
September 143.8 317.0 32.6 20.0
Total as at 30 September 3,584.4 3,508.9 654.2 558.5
36 Deutsche Börse Group interim report Q3/2015
Basis of preparation
1. Accounting policies
Deutsche Börse AG (“the company”) is incorporated as a German stock corporation (“Aktiengesellschaft”)
and is domiciled in Germany. The company’s registered office is in Frankfurt/Main.
The interim financial statements have been prepared in compliance with the International Financial Report-
ing Standards (IFRSs) and the related interpretations issued by the International Accounting Standards
Board (IASB), as adopted by the European Union in accordance with Regulation No. 1606/2002 of the
European Parliament and of the Council on the application of International Accounting Standards. As at
30 September 2015, there were no effective standards or interpretations not yet adopted by the European
Union that could affect the interim financial statements. Accordingly, the interim financial statements also
comply with the IFRSs as issued by the IASB.
In addition to the standards and interpretations applied as at 31 December 2014, the following amend-
ments and interpretations were applied for the first time:
IFRIC 21 “Levies” (May 2013) Amendments resulting from the “Annual Improvements Project 2010–2012” (December 2013) Amendments resulting from the “Annual Improvements Project 2011–2013” (December 2013) IAS 19 “Employee Benefits” (November 2013)
Furthermore, IAS 34 (“Interim Financial Reporting”) was applied. The income tax expense for the interim
reporting period was calculated using a forecast effective Group tax rate of 26 per cent. The nominal tax
rates used when calculating the Group tax rate ranged between 12.5 and 45 per cent. Deferred tax
assets were recognised for tax loss carryforwards at the end of the interim reporting period where these
can be expected to be realised within the next five tax periods.
Since 31 December 2014 and by the date of publication of this interim report, the IASB has issued no
other standards which have not yet been adopted by the EU and which are relevant to Deutsche Börse AG.
In accordance with the provisions of the Wertpapierhandelsgesetz (WpHG, German Securities Trading
Act), these interim financial statements are supplemented by a Group interim management report.
Effective 1 January 2015, the interest result of the central counterparties is reported under “net interest
income from banking business.” By investing their customers’ cash collateral, the clearing houses gener-
ate interest income and expense, which have so far been included in the financial result. The reclassifi-
cation is due to a change in the pricing model of Eurex Clearing AG effective 1 May 2015. The changed
model provides for an interest-driven cash handling fee. Prior-year figures have been adjusted according-
ly as shown in the following table:
Notes to the interim financial statements

37 Notes
Restatement of comparative figures as at 30 September 2014
(restated)
Quarter ended
Quarter ended
(restated)
Nine months
ended
Nine months
ended
30 Sep 2014 30 Sep 2014 30 Sep 2014 30 Sep 2014
€m €m €m €m
Net interest income from banking business 9.3 9.6 33.4 28.4
Total revenue 585.8 586.1 1,766.1 1,761.1
Net revenue (total revenue less volume-related costs) 495.6 495.9 1,503.5 1,498.5
Earnings before interest and tax (EBIT) 221.6 232.5 803.2 798.2
Financial income 0.4 0.8 1.2 7.8
Financial expense – 14.1 – 14.8 – 41.5 – 43.1
Earnings before tax (EBT) 207.9 218.5 762.9 762.9
2. Group structure
The purchase price allocation for Clearstream Global Securities Services Limited, Cork, Ireland, (CGSS)
was adjusted as at 31 March 2015 during the measurement period. The assessment of the fair value
of the intangible assets that were acquired effective 3 October 2014 by Clearstream International S.A.,
Luxembourg, together with the shares of CGSS was revised in the first quarter of 2015. The previously
assumed fair value of all acquired assets and liabilities amounting to €32.1 million as at the date of
acquisition decreased by €0.5 million to €31.6 million. The goodwill resulting from the acquisition in-
creased accordingly by €0.5 million from €15.1 million to €15.6 million and reflects mainly the ex-
pected revenue-related synergies with existing and potential customers in the custody business as well
as expected cost-related synergies from the use of uniform IT systems. The balance sheet as at 31 De-
cember 2014 has been adjusted accordingly. For the purchase price allocation, see note 2 of the
interim report as at 31 March 2015.
Effective 1 January 2015, European Energy Exchange AG, Leipzig, Germany, (EEX) acquired an interest
of 53.34 per cent in Powernext SA, Paris, France, in exchange for 36.75 per cent of the shares of EPEX
Spot SE, Paris, France. Since then, all natural gas activities of EEX group have been bundled within
Powernext SA; EEX increased its interest in Powernext SA to 55.8 per cent as a result of this transaction.
Within the measurement period, the measurement of customer relationships was retrospectively adjusted
in the second quarter. This measurement adjustment gave rise to total goodwill of €18.4 million as at
the reporting date, mainly reflecting synergies resulting from pooling the entire gas exchange activities
at Powernext SA. The current status of preliminary allocation of the purchase price to the assets acquired
and liabilities assumed is shown in the following table:

38 Deutsche Börse Group interim report Q3/2015
Goodwill resulting from the business combination with Powernext SA and EPEX Spot group
Preliminary goodwill
calculation
1 Jan 2015
€m
Consideration transferred
Fair value of transferred equity interest in EPEX Spot SE (less non-controlling interests) 45.3
Acquired bank balances – 40.1
Total consideration 5.2
Acquired assets and liabilities
Customer relationships 73.3
Trade names 7.2
Other intangible assets 2.0
Other non-current assets 0.9
Deferred tax assets 1.7
Other current assets 12.8
Liabilities – 11.8
Deferred tax liabilities on temporary differences – 27.0
Non-controlling interests – 72.3
Total assets and liabilities acquired – 13.2
Goodwill (not tax-deductible) 18.4
In addition, EEX acquired an additional 283,048 shares of Powernext SA at a total price of €25.4 mil-
lion in the reporting period, thus increasing its interest to a total of 72.29 per cent.
As Powernext SA in turn holds 50 per cent of the EPEX Spot SE, EEX at the same time obtained a control-
ling interest in EPEX Spot SE and its two subsidiaries, EPEX Spot Schweiz AG, Zurich, Switzerland, and
JV Epex-Soops B.V., Amsterdam, the Netherlands, effective 1 January 2015. All subsidiaries have been
included in full in the consolidated financial statements since 1 January 2015. The consolidation of the
EPEX Spot group generated a rise of €41.0 million in sales revenue as well as an increase of €3.3 million
in earnings after tax and offsetting of non-controlling interests. The consolidation of Powernext SA gener-
ated a growth of €12.9 million in sales revenue as well as an increase of €0.4 million in earnings after
tax and offsetting of non-controlling interests.
To expand the spot power business (trading and clearing), the APX Holding group, which covers the
market areas of the Netherlands, the United Kingdom and Belgium, was acquired and integrated into
the EPEX Spot group effective 4 May 2015. In doing so, EPEX Spot SE acquired an interest amounting
to 100 per cent in the APX Holding group for a total purchase price of €16.8 million from Deutsche
Börse Group’s perspective. The acquisition was financed by issuing new shares in EPEX Spot SE. Be-
cause of the resulting dilutive effect, EEX’s interest in EPEX Spot SE declined to 35.08 per cent. All of
the APX Holding group’s clearing activities were subsequently transferred to European Commodity
Clearing AG (ECC), a wholly owned subsidiary of EEX. As at the reporting date, preliminary purchase
price allocation resulted in total goodwill of €6.6 million, which is mainly attributable to synergies
resulting from the integration of the European power spot market. As wholly owned subsidiaries of the
EPEX Spot SE, the APX Holding Group companies have been included in full in Deutsche Börse
Group’s consolidated financial statements since May 2015. The consolidation of the APX Holding
group generated growth of €10.0 million in sales revenue as well as an increase of €0.3 million in
earnings after tax, net of non-controlling interests.
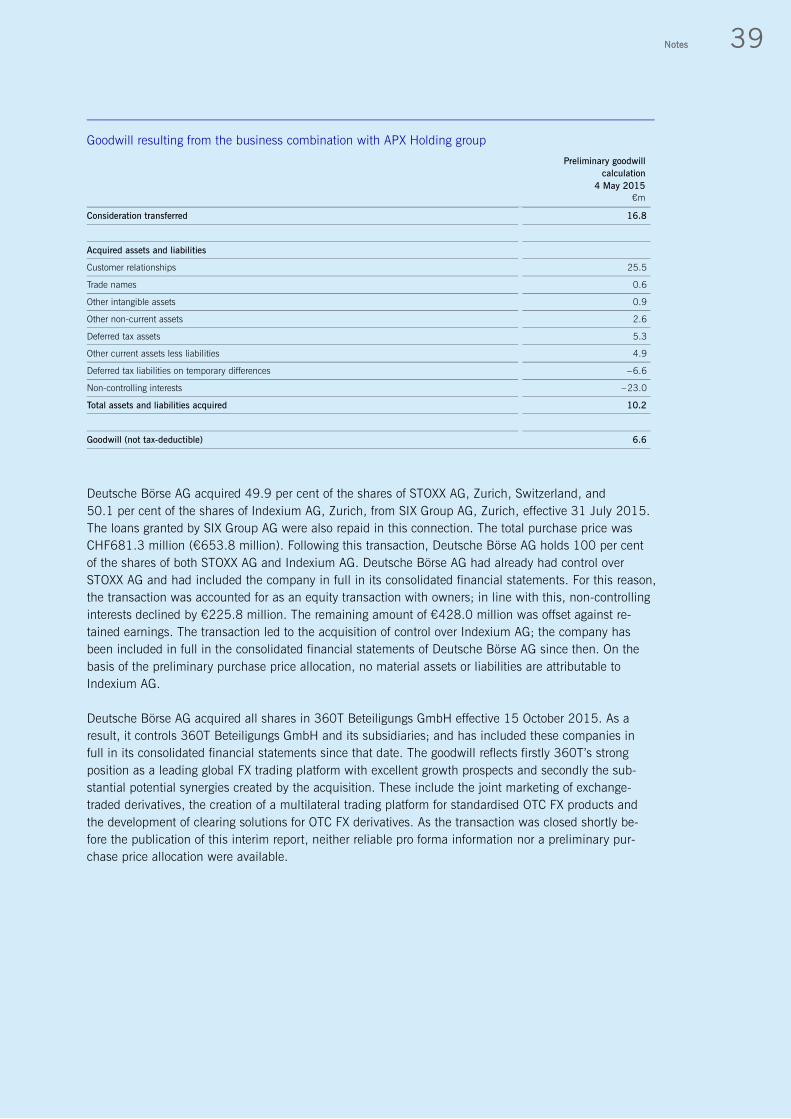
39 Notes
Goodwill resulting from the business combination with APX Holding group
Preliminary goodwill
calculation
4 May 2015
€m
Consideration transferred 16.8
Acquired assets and liabilities
Customer relationships 25.5
Trade names 0.6
Other intangible assets 0.9
Other non-current assets 2.6
Deferred tax assets 5.3
Other current assets less liabilities 4.9
Deferred tax liabilities on temporary differences – 6.6
Non-controlling interests – 23.0
Total assets and liabilities acquired 10.2
Goodwill (not tax-deductible) 6.6
Deutsche Börse AG acquired 49.9 per cent of the shares of STOXX AG, Zurich, Switzerland, and
50.1 per cent of the shares of Indexium AG, Zurich, from SIX Group AG, Zurich, effective 31 July 2015.
The loans granted by SIX Group AG were also repaid in this connection. The total purchase price was
CHF681.3 million (€653.8 million). Following this transaction, Deutsche Börse AG holds 100 per cent
of the shares of both STOXX AG and Indexium AG. Deutsche Börse AG had already had control over
STOXX AG and had included the company in full in its consolidated financial statements. For this reason,
the transaction was accounted for as an equity transaction with owners; in line with this, non-controlling
interests declined by €225.8 million. The remaining amount of €428.0 million was offset against re-
tained earnings. The transaction led to the acquisition of control over Indexium AG; the company has
been included in full in the consolidated financial statements of Deutsche Börse AG since then. On the
basis of the preliminary purchase price allocation, no material assets or liabilities are attributable to
Indexium AG.
Deutsche Börse AG acquired all shares in 360T Beteiligungs GmbH effective 15 October 2015. As a
result, it controls 360T Beteiligungs GmbH and its subsidiaries; and has included these companies in
full in its consolidated financial statements since that date. The goodwill reflects firstly 360T’s strong
position as a leading global FX trading platform with excellent growth prospects and secondly the sub-
stantial potential synergies created by the acquisition. These include the joint marketing of exchange-
traded derivatives, the creation of a multilateral trading platform for standardised OTC FX products and
the development of clearing solutions for OTC FX derivatives. As the transaction was closed shortly be-
fore the publication of this interim report, neither reliable pro forma information nor a preliminary pur-
chase price allocation were available.

40 Deutsche Börse Group interim report Q3/2015
In the first quarter of 2015, the International Securities Exchange, LLC, New York, USA, (ISE) made an
additional investment of US$30 million in The Options Clearing Corporation, Chicago, USA, (OCC) as
part of their plan to fund increased regulatory capital requirements. ISE has also committed to a capital
replenishment plan which provides up to an additional US$40 million of funding.
Moreover, on 1 January 2015, EEX acquired 50 per cent of the shares of Gaspoint Nordic A/S,
Brøndby, Denmark, for a price of €600 thousand. The purchase price includes goodwill amounting
to €280 thousand. As EEX exercises significant influence within the meaning of IAS 28, Gaspoint
Nordic A/S has been classified as an associate and accounted for using the equity method since
1 January 2015.
Effective 28 April 2015, Deutsche Börse AG acquired another 12,500 shares in Global Markets Ex-
change Group International LLP, London, United Kingdom, (GMEX) for a purchase price of £1 million.
As a result, Deutsche Börse AG increased its interest to a total of 33.17 per cent. Since Deutsche
Börse AG exercises significant influence within the meaning of IAS 28, GMEX continues to be classified
as an associate and is accounted for using the equity method.
Due to the changes to the shareholder agreement, Clearstream International S.A. lost its controlling ma-
jority in LuxCSD S.A., Luxembourg. As a consequence, the company was deconsolidated in the second
quarter of 2015. Since then it has been reported under the “investments in associates and joint ven-
tures” item and accounted for using the equity method.
EPEX Spot SE, Paris, France, contributed €125 thousand to the formation of SEEPEX a.d., Belgrade,
Serbia, effective 14 July 2015. The business purpose of the company is to operate a power trading
exchange in Serbia for south-east Europe. EPEX Spot SE holds 60,000 of a total of 240,000 ordinary
voting shares, and hence a 25 per cent share of the voting rights. Since EPEX Spot SE exercises signifi-
cant influence within the meaning of IAS 28, SEEPEX a.d. is classified as an associate and is accounted
for using the equity method.
3. Seasonal influences and valuations
The Group’s revenues are influenced more by the volatility and the transaction volume on the capital
markets than by seasonal factors. Owing to a concentration of costs for projects only coming to com-
pletion in the fourth quarter, costs in the fourth quarter tend to be higher than in the first three quarters
of the financial year.
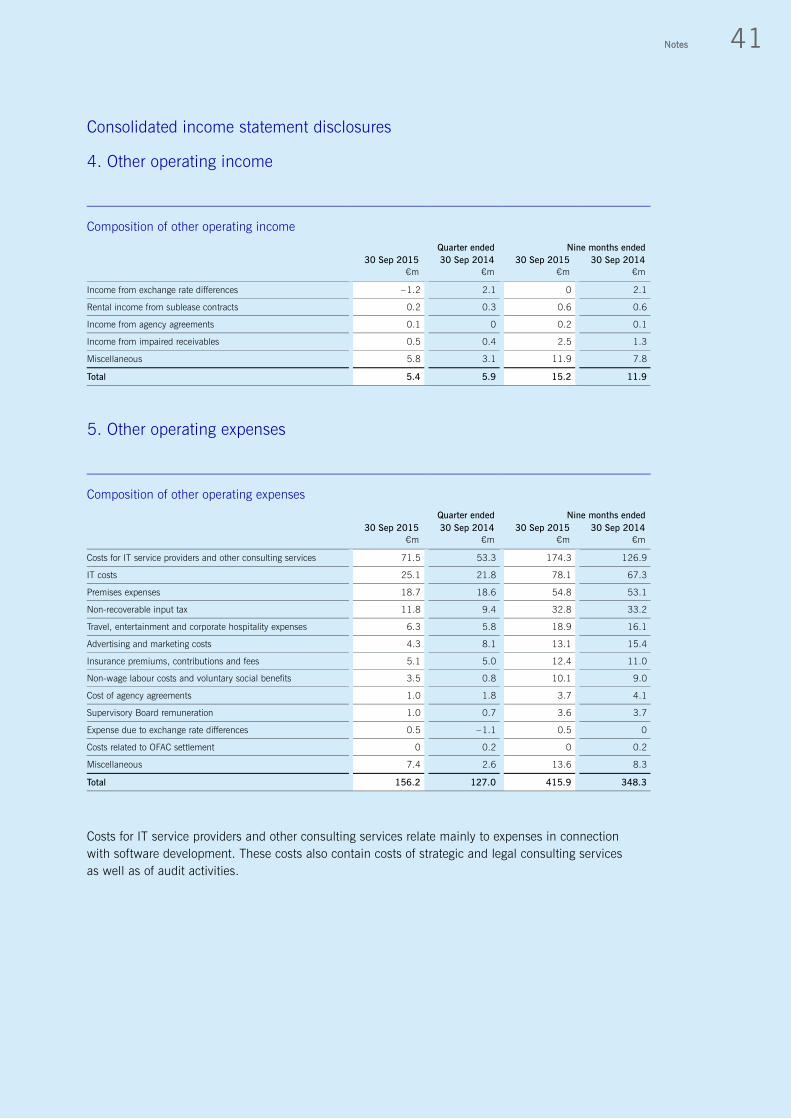
41 Notes
Consolidated income statement disclosures
4. Other operating income
Composition of other operating income
Quarter ended Nine months ended
30 Sep 2015 30 Sep 2014 30 Sep 2015 30 Sep 2014
€m €m €m €m
Income from exchange rate differences – 1.2 2.1 0 2.1
Rental income from sublease contracts 0.2 0.3 0.6 0.6
Income from agency agreements 0.1 0 0.2 0.1
Income from impaired receivables 0.5 0.4 2.5 1.3
Miscellaneous 5.8 3.1 11.9 7.8
Total 5.4 5.9 15.2 11.9
5. Other operating expenses
Composition of other operating expenses
Quarter ended Nine months ended
30 Sep 2015 30 Sep 2014 30 Sep 2015 30 Sep 2014
€m €m €m €m
Costs for IT service providers and other consulting services 71.5 53.3 174.3 126.9
IT costs 25.1 21.8 78.1 67.3
Premises expenses 18.7 18.6 54.8 53.1
Non-recoverable input tax 11.8 9.4 32.8 33.2
Travel, entertainment and corporate hospitality expenses 6.3 5.8 18.9 16.1
Advertising and marketing costs 4.3 8.1 13.1 15.4
Insurance premiums, contributions and fees 5.1 5.0 12.4 11.0
Non-wage labour costs and voluntary social benefits 3.5 0.8 10.1 9.0
Cost of agency agreements 1.0 1.8 3.7 4.1
Supervisory Board remuneration 1.0 0.7 3.6 3.7
Expense due to exchange rate differences 0.5 – 1.1 0.5 0
Costs related to OFAC settlement 0 0.2 0 0.2
Miscellaneous 7.4 2.6 13.6 8.3
Total 156.2 127.0 415.9 348.3
Costs for IT service providers and other consulting services relate mainly to expenses in connection
with software development. These costs also contain costs of strategic and legal consulting services
as well as of audit activities.

42 Deutsche Börse Group interim report Q3/2015
Consolidated balance sheet disclosures
6. Intangible assets and property, plant and equipment
As at 30 September 2015, intangible assets amounted to €3,791.9 million (31 December 2014:
€3,526.5 million).
This item primarily consists of goodwill in the amount of €2,337.5 million (31 December 2014:
€2,225.0 million), other intangible assets (licences, trade names and customer relationships) in the
amount of €1,101.2 million (31 December 2014: €980.2 million), internally developed software in the
amount of €177.8 million (31 December 2014: €184.9 million) as well as payments on account and
construction in progress of €144.4 million (31 December 2014: €100.2 million).
The increase in goodwill in the amount of €112.5 million is mainly attributable to the initial consolidation
of Powernext SA and the EPEX Spot group (€18.4 million) as well as APX Holding group (€6.6 million),
and to a currency effect of €87.4 million.
The increase in other intangible assets in the amount of €121.0 million is primarily due to the recogni-
tion of hidden reserves totalling €109.5 million in the course of the initial consolidation of Powernext SA
and EPEX Spot group as well as APX Holding group (see note 2) and due to exchange rate effects.
The decline in internally developed software amounting to €7.1 million was primarily due to amortisa-
tion of €38.0 million. This was offset by reclassifications of assets under construction in the amount of
€26.6 million and additions, including changes to the basis of consolidation, totalling €3.6 million.
Property, plant and equipment totalled €101.3 million as at 30 September 2015 (31 December 2014:
€100.9 million).
7. Financial assets
Financial assets amounted to €2,193.6 million as at 30 September 2015 (31 December 2014:
€1,602.2 million). €618.1 million of this increase mainly relates to receivables and securities from
banking business.
Due to the unsatisfactory economic development of a company in which Deutsche Börse AG holds an
interest, an at-equity revaluation amounting to €0.4 million as well as an impairment loss totalling
€4.9 million were recognised on the investment in Bondcube Limited in the first nine months of 2015.
8. Equity
In the current financial year, equity decreased by €167.7 million to €3,584.4 million (31 Decem-
ber 2014: €3,752.1 million). It includes the consolidated net income for the period of €563.5 million
and the dividend in the amount of €386.8 million distributed by Deutsche Börse AG that had an off-
setting effect.
While the placement of treasury shares in connection with the proportionate funding of the acquisition
of 360T led to an increase in equity in the total amount of €199.5 million, the full acquisition of STOXX
AG resulted in a €428.0 million decline in accumulated profit.
43 Notes
The increase of €10.7 million in the revaluation surplus is mainly due to the change in defined benefit
obligations.
Exchange rate differences and deferred taxes thereon in the total amount of €47.9 million had an impact
on the change in equity.
Non-controlling interests increased to €40.7 million due to the initial consolidation of EPEX Spot SE,
Paris, France, Powernext SA, Paris, France, and Dutch APX Holding group, all subsidiaries of European
Energy Exchange AG. The profits generated by all consolidated subsidiaries also contributed to the in-
crease in non-controlling interests in the amount of €32.1 million, whereas the dividends distributed by
these entities reduced this item by €25.6 million.
Non-controlling interests relating to STOXX AG in the amount of €225.8 million were reversed as a re-
sult of the full acquisition.
9. Pension provisions
Pension provisions are measured using the projected unit credit method in accordance with IAS 19 on
the basis of actuarial reports. As at 30 September 2015, the discount rate for pension plans and other
employee benefits was 2.2 per cent in Germany and Luxembourg (31 December 2014: 2.15 per cent;
30 September 2014: 2.4 per cent); in Switzerland, the discount rate used was unchanged as against
year-end 2014, at 1.1 per cent (30 September 2014: 2.0 per cent).
10. Interest-bearing liabilities
The euro and US dollar bonds issued by Deutsche Börse AG have a carrying amount of €2,045.7 mil-
lion (31 December 2014: €1,568.3 million, of which €139.8 million was recognised in other current
liabilities) and a fair value of €2,151.4 million (31 December 2014: €1,688.4 million).
The increase in interest-bearing liabilities is primarily attributable to the issuance of a new hybrid bond
with a principal amount of €600 million. The bond has a term of 26 years and an annual coupon of
2.75 per cent. The proceeds of the issue will be used to refinance existing liabilities and to fund the
acquisition in full of the STOXX AG and Indexium AG joint ventures. For further details on this and on
the issuance of a senior bond in the fourth quarter of 2015 to fund the acquisition of 360T Beteiligungs
GmbH, see the “Capital structure” section on page 22 of the combined management report.
The interest-bearing liabilities (€139.8 million) recognised in the item “other current liabilities” as at
31 December 2014 were repaid in the second quarter 2015.
11. Total assets
The decline in consolidated total assets by €7.4 billion to €222.9 billion as at 30 September 2015
(30 June 2015: €230.3 billion) depends to a significant extent on the financial instruments of the
central counterparties, receivables and liablities from banking business as well as cash deposits by
market participants. The level of these items can vary widely on a daily basis according to customers’
needs and actions.

44 Deutsche Börse Group interim report Q3/2015
12. Fair value hierarchy
Financial assets and liabilities that are measured at fair value are allocated to the following three
hierarchy levels: financial assets and liabilities are allocated to level 1 if there is a quoted price for iden-
tical assets and liabilities in an active market. They are allocated to level 2 if the inputs on which fair
value measurement is based are observable either directly or indirectly; these inputs must be based on
market expectations. Financial assets and liabilities are allocated to level 3 if the fair value is determined
on the basis of unobservable inputs.
As at 30 September 2015, financial assets and liabilities measured at fair value were allocated to the
hierarchy levels 1 to 3 as follows:
Fair value hierarchy
Fair value as at
30 Sep 2015 thereof attributable to:
Level 1 Level 2 Level 3
€m €m €m €m
Recurrently carried at fair value
ASSETS
Financial assets held for trading
Derivatives
Non-current financial instruments of the central
counterparties 9,164.5 9,164.5 0 0
Current financial instruments of the central counterparties 160,304.2 160,304.2 0 0
Current receivables and securities from banking business 6.8 0 6.8 0
Total 169,475.5 169,468.7 6.8 0
Available-for-sale financial assets
Equity instruments
Other equity investments 6.5 0 0 6.5
Total 6.5 0 0 6.5
Debt instruments
Other financial instruments 25.1 25.1 0 0
Non-current receivables and securities from banking business 1,923.1 1,923.1 0 0
Current receivables and securities from banking business 174.0 174.0 0 0
Total 2,122.2 2,122.2 0 0
Total assets 171,604.2 171,590.9 6.8 6.5
LIABILITIES
Financial liabilities held for trading
Derivatives
Non-current financial instruments of the central
counterparties 9,164.5 9,164.5 0 0
Current financial instruments of the central counterparties 159,948.0 159,948.0 0 0
Liabilities from banking business 20.5 0 20.5 0
Other current liabilities 5.8 0 0 5.8
Contingent purchase price components
Other noncurrent liabilities 4.6 0 0 4.6
Total liabilities 169,143.4 169,112.5 20.5 10.4

45 Notes
As at 30 September 2014, financial assets and liabilities measured at fair value were allocated to the
hierarchy levels 1 to 3 as follows:
Fair value hierarchy
Fair value as at
30 Sep 2014 thereof attributable to:
Level 1 Level 2 Level 3
€m €m €m €m
Recurrently carried at fair value
ASSETS
Financial assets held for trading
Derivatives
Non-current financial instruments of the central
counterparties 3,678.5 3,678.5 0 0
Current financial instruments of the central counterparties 191,643.2 191,643.2 0 0
Current receivables and securities from banking business 44.7 0 44.7 0
Total 195,366.4 195,321.7 44.7 0
Available-for-sale financial assets
Equity instruments
Other equity investments 4.6 0 0 4.6
Total 4.6 0 0 4.6
Debt instruments
Other financial instruments 24.4 24.4 0 0
Non-current receivables and securities from banking business 1,378.7 1,378.7 0 0
Current receivables and securities from banking business 567.0 567.0 0 0
Total 1,970.1 1,970.1 0 0
Total assets 197,341.1 197,291.8 44.7 4.6
LIABILITIES
Financial liabilities held for trading
Derivatives
Non-current financial instruments of the central
counterparties 3,678.5 3,678.5 0 0
Current financial instruments of the central counterparties 191,143.2 191,143.2 0 0
Liabilities from banking business 0 0 0 0
Other current liabilities 5.8 0 0 5.8
Contingent purchase price components
Other noncurrent liabilities 7.6 0 0 7.6
Other current liabilities 0.9 0 0 0.9
Total liabilities 194,836.0 194,821.7 0 14.3
In the first nine months of 2015, no reclassifications were made between the different levels.
Financial assets and financial liabilities listed in levels 2 and 3 are measured as follows.
The derivatives listed in level 2 comprise forward foreign exchange transactions. The fair value of the
forward foreign exchange transactions is determined on the basis of the forward foreign exchange rates
for the remaining period to maturity as at the balance sheet date.
46 Deutsche Börse Group interim report Q3/2015
The equity investments allocated to level 2 are measured on the basis of current, comparable market
transactions.
As at the balance sheet date, the items allocated to level 3 and their measurements were as follows:
Development of financial instruments in level 3
Assets Liabilities Total
Other equity
investments
Other non-
current
liabilities
Other current
liabilities
€m €m €m €m
Balance as at 1 Jan 2015 5.6 – 9.1 – 5.9 – 9.4
Additions 1.7 0 0 1.7
Diposals – 1.1 0 0 – 1.1
Unrealised capital gains recognised in income 0 4.5 0.1 4.6
Financial result 0 – 0.2 0 – 0.2
Other operating income 0 4.7 0.1 4.8
Changes recognised in the revaluation surplus 0.3 0 0 0.3
Balance as at 30 Sep 2015 6.5 – 4.6 – 5.8 – 3.9
The value of the equity investment listed in level 3 at the beginning of 2015 is reviewed annually by the
issuer, who may initiate transactions. The number of shares was reduced in the third quarter, resulting
in an outflow of €0.7 million in this item. This and an offsetting effect of €0.3 million recognised outside
profit or loss resulted in a decline totalling €0.4 million. During the second quarter, there was an inflow
of €1.7 million to this item, which resulted from an equity fund. The fair value of this fund is calculated
on the basis of the net asset value determined by the issuer. A partial disposal and the measurement of
the remaining shares resulted in a decrease of €0.4 million being recognised in equity in the third quar-
ter of 2015.
The fair value amounted to €4.6 million and reported under other non-current liabilities is attributable to
the contingent purchase price components. In the first half of 2015, adjustments to the expected pay-
ment obligations led to expenses of €0.2 million, which were recognised in the financial result in profit
or loss. In the third quarter of 2015, the reassessment of the probability that the two obligations would
be utilised resulted in other operating income of €4.7 million. These two purchase price components are
measured on the basis of internal discounted cash flow models, which discount the expected future
payment obligations to the measurement date using interest rates that are appropriate to the risk.

47 Notes
Furthermore, as at the start of the year, derivative financial instruments belonging to an incentive pro-
gramme amounting to €5.8 million were allocated to other current liabilities of level 3. The financial
instruments are regularly measured at fair value through profit and loss using an internal model as at
the quarterly balance sheet dates. The results from the subsequent measurement are recognised under
other operating expenses. As at the balance sheet date 30 September 2015, there was an income of
€0.1 million. The model takes into account the criteria underlying the conditional repayment of the
grant made by Eurex Clearing AG. The criteria include, in particular, non-financial indicators as the
expected number of customers in a specific market segment as well as expected trading volumes. They
are continuously monitored, while taking possible adjustments into account; for this, information of
customers is also used. Since there is an internal model, the parameters can be different as at the set-
tlement date; however, the derivative financial instrument will not exceed an amount of €–7.0 million;
this amount arises if the beneficiaries of the incentive programme fulfil the conditions and a repayment
of the contribution is not taken into consideration.
The fair value of other financial assets and liabilities not measured at fair value is determined as follows:
the euro and US dollar bonds issued by Deutsche Börse AG have a fair value of €2,151.4 million
(31 December 2014: €1,688.4 million) and are reported under interest-bearing liabilities. US dollar
bonds with a nominal value of US$170.0 million matured in the second quarter. A further bond with a
principal amount of €600 million was issued in the third quarter. The fair value of the euro bonds in the
amount of €1,867.6 million is calculated on the basis of the quoted values of the bonds, and the fair
value of the US dollar bonds in the amount of €283.8 million represents the present value of the cash
flows relating to the private placements on the basis of market parameters. Consequently, the euro bonds
are to be allocated to level 2 and the US dollar bonds to level 3.
The carrying amounts of the following items represent a reasonable approximation of their fair value:
unlisted equity instruments whose fair value generally cannot be reliably determined on a continuous
basis and which are reported under the “financial assets” item; these are carried at cost less any im-
pairment losses other loans, which are reported under “financial assets” other receivables and other assets as well as current receivables from banking business, to the extent
that these are measured at amortised cost restricted bank balances cash and other bank balances cash deposits by market participants other current liabilities

48 Deutsche Börse Group interim report Q3/2015
Other disclosures
13. Reconciliation to cash and cash equivalents
Reconciliation to cash and cash equivalents
30 Sep 2015 1 Jan 2015
€m €m
Restricted bank balances 31,154.5 22,283.5
Other cash and bank balances 899.5 826.1
Financial instruments of the central counterparties (netted) 356.2 1,249.1
less bank loans and overdrafts – 12.9 – 0.7
32,397.3 24,358.0
Reconciliation to cash and cash equivalents
Current receivables and securities from banking business 14,147.2 10,307.1
less loans to banks and customers with an original maturity of more than three months – 931.6 – 563.0
less available-for-sale debt instruments – 174.0 – 401.1
less derivatives 0 0
Current liabilities from banking business – 14,877.6 – 11,487.1
Current liabilities from cash deposits by market participants – 31,153.4 – 22,282.4
– 32,989.4 – 24,426.5
Cash and cash equivalents – 592.1 – 68.5
14. Earnings per share
Under IAS 33, earnings per share are calculated by dividing the net profit for the period attributable
to shareholders of the parent company (net income for the period) by the weighted average number
of shares outstanding.
Diluted earnings per share are determined by adding the number of potentially dilutive ordinary shares
that may be acquired under the Stock Bonus Plan (SBP) or the Long-term Sustainable Instrument (LSI)
to the average number of shares. In order to calculate the number of potentially dilutive ordinary shares,
the exercise prices were adjusted by the fair value of the services still to be provided.
When determining diluted earnings per share, all SBP and LSI tranches for which cash settlement has
not been resolved are assumed to be equity-settled – regardless of the actual accounting in accordance
with IFRS 2.
49 Notes
There were the following potentially dilutive rights to purchase shares as at 30 September 2015:
Calculation of the number of potentially dilutive ordinary shares
Tranche Exercise price
Adjustment of
the exercise
price according
to IAS 331)
Average
number of
outstanding
options
Average price
for the period2)
Number of
potentially
dilutive
ordinary shares
€ € 30 Sep 2015 € 30 Sep 2015
20143) 0 14.12 65,454 74.62 53,068
1) According to IAS 33.47 (a) for share options and other share-based payment arrangements, the issue price and the exercise price shall include the fair value
of any goods or services to be supplied to the entity in the future under the share option or other share-based payment arrangement.
2) Volume-weighted average price of Deutsche Börse AG shares on Xetra for the period 1 January to 30 September 2015.
3) This relates to rights to shares under the Share Bonus Plan and the Long-term Sustainable Instrument for senior executives. As the 2014 tranche options will only
be granted in future financial years, the number indicated for the balance sheet date may change subsequently.
As the volume-weighted average share price was higher than the adjusted exercise prices for the 2014
tranche, these options are considered dilutive under IAS 33 as at 30 September 2015.
Calculation of earnings per share (basic and diluted)
Quarter ended
(restated)
Quarter ended
Nine months
ended
Nine months
ended
30 Sep 2015 30 Sep 2014 30 Sep 2015 30 Sep 2014
Number of shares outstanding as at beginning of period 184,186,855 184,115,457 184,186,855 184,115,657
Number of shares outstanding as at end of period 186,723,986 184,186,855 186,723,986 184,186,855
Weighted average number of shares outstanding 184,867,550 184,186,855 184,416,247 184,139,611
Number of potentially dilutive ordinary shares 14,642 110,512 53,068 106,984
Weighted average number of shares used to compute diluted
earnings per share 184,882,192 184,297,367 184,469,315 184,246,595
Net income for the period (€m) 166.1 149.4 563.5 538.3
Earnings per share (basic) (€) 0.90 0.81 3.06 2.93
Earnings per share (diluted) (€) 0.90 0.81 3.06 2.92
As at 30 September 2015, 65,452 options were excluded from the calculation of the weighted average
number of potentially dilutive shares, as their effect during the period is not dilutive.

50 Deutsche Börse Group interim report Q3/2015
15. Segment reporting
Composition of sales revenue by segment
Quarter ended Nine months ended
30 Sep 2015 30 Sep 2014 30 Sep 2015 30 Sep 2014
€m €m €m €m
External sales revenue
Eurex 309.9 226.5 893.7 686.7
Xetra 53.9 44.1 162.4 136.9
Clearstream 220.5 205.5 671.8 611.2
Market Data + Services 100.0 94.5 311.0 286.0
Total external sales revenue 684.3 570.6 2,038.9 1,720.8
Internal sales revenue
Clearstream 1.9 2.3 6.0 5.7
Market Data + Services 10.3 7.4 29.3 22.5
Total internal sales revenue 12.2 9.7 35.3 28.2
Net interest income from banking business
Quarter ended
(restated)
Quarter ended
Nine months
ended
(restated)
Nine months
ended
30 Sep 2015 30 Sep 2014 30 Sep 2015 30 Sep 2014
€m €m €m €m
Gross interest income
Eurex 45.2 0.4 115.0 6.6
Clearstream 8.4 8.7 27.7 32.2
Total gross interest income 53.6 9.1 142.7 38.8
Interest expense
Eurex – 39.4 – 0.7 – 105.3 – 1.6
Clearstream – 0.3 0.9 – 1.0 – 3.8
Total interest expense – 39.7 0.2 – 106.3 – 5.4
Total 13.9 9.3 36.4 33.4
Net revenue
Quarter ended
(restated)
Quarter ended
Nine months
ended
(restated)
Nine months
ended
30 Sep 2015 30 Sep 2014 30 Sep 2015 30 Sep 2014
€m €m €m €m
Eurex 258.5 190.2 757.4 585.6
Xetra 48.1 37.8 142.4 118.6
Clearstream 184.3 175.1 563.5 517.8
Market Data + Services 103.5 92.5 314.3 281.5
Total 594.4 495.6 1,777.6 1,503.5

51 Notes
Operating costs
Quarter ended Nine months ended
30 Sep 2015 30 Sep 2014 30 Sep 2015 30 Sep 2014
€m €m €m €m
Eurex 153.3 114.1 404.5 314.3
Xetra 20.4 17.0 56.4 51.3
Clearstream 111.7 91.1 317.3 264.7
Market Data + Services 58.6 51.8 166.5 145.9
Total 344.0 274.0 944.7 776.2
Earnings before interest and tax (EBIT)
Quarter ended
(restated)
Quarter ended
Nine months
ended
(restated)
Nine months
ended
30 Sep 2015 30 Sep 2014 30 Sep 2015 30 Sep 2014
€m €m €m €m
Eurex 105.3 76.0 355.9 346.8
Xetra 26.8 20.9 83.4 67.7
Clearstream 72.7 84.1 246.3 253.1
Market Data + Services 44.9 40.6 147.8 135.6
Total 249.7 221.6 833.4 803.2
Investment in intangible assets and property,
plant and equipment
Quater ended Nine months ended
30 Sep 2015 30 Sep 2014 30 Sep 2015 30 Sep 2014
€m €m €m €m
Eurex 16.7 15.3 45.0 39.0
Xetra 0.5 0.2 1.1 0.6
Clearstream 17.1 14.1 52.2 40.1
Market Data + Services 2.0 2.5 4.4 3.6
Total 36.3 32.1 102.7 83.3

52 Deutsche Börse Group interim report Q3/2015
16. Financial liabilities and other risks
Interest-bearing liabilities
The following payment obligations arose from the interest-bearing liabilities as at 30 September 2015:
Expected payment obligations from interest-bearing liabilities
Expected payment obligations1) at
30 Sep 2015 30 Sep 2014
€m €m
Up to 1 year 44.5 176.3
1 to 5 years 1,022.0 884.5
More than 5 years 1,259.3 709.5
Total 2,325.8 1,770.3
1) The expected payment obligations in US dollars were translated into euros at the applicable forward rate.
Other risks
Peterson vs Clearstream Banking S.A., Citibank NA et al. (“Peterson I”) and
Heiser vs Clearstream Banking S.A.
In its 2012 corporate report, Deutsche Börse Group informed about proceedings, Peterson vs Clear-
stream Banking S.A., the first Peterson proceeding, initiated by various plaintiffs seeking turnover of
certain customer positions held in Clearstream Banking S.A.’s securities omnibus account with its US
depository bank, Citibank NA, and asserting direct claims against Clearstream Banking S.A. for damages
of US$250 million. That matter was settled between Clearstream Banking S.A. and the plaintiffs and the
direct claims against Clearstream Banking S.A. were dismissed.
In July 2013, the US court ordered turnover of the customer positions to the plaintiffs, ruling that these
were owned by Bank Markazi, the Iranian central bank. Bank Markazi appealed, and the decision was
affirmed on 9 July 2014. Bank Markazi has sought review in the Supreme Court. Once that process is
complete, if the funds are turned over, a related case, Heiser vs Clearstream Banking S.A., also seeking
turnover of the same assets, will be dismissed.

53 Notes
Peterson vs Clearstream Banking S.A. (“Peterson II”)
On 30 December 2013, a number of US plaintiffs from the first Peterson case, as well as other US
plaintiffs, filed a complaint targeting certain blocked assets that Clearstream Banking S.A. holds as a
custodian in Luxembourg. In 2014, the defendants in this action, including Clearstream Banking S.A.,
moved to dismiss the case. On 19 February 2015, the US court issued a decision granting the defend-
ants’ motions and dismissing the lawsuit. On 6 March 2015, the plaintiffs appealed the decision to the
Second Circuit Court of Appeals.
Criminal investigations against Clearstream Banking S.A.
On 2 April 2014, Clearstream Banking S.A. was informed that the United States Attorney for the South-
ern District of New York has opened a grand jury investigation against Clearstream Banking S.A. due to
Clearstream Banking S.A.’s conduct with respect to Iran and other countries subject to US sanction laws.
Clearstream Banking S.A. is cooperating with the US attorney.
Dispute between MBB Clean Energy AG and end investors
A dispute has arisen between MBB Clean Energy AG (MBB), the issuer of a bond eligible in Clearstream
Banking AG, and end investors. MBB issued a first tranche of the bond in April 2013 and a second
tranche of the bond in December 2013. The global certificates for the two tranches of the bond were
delivered into Clearstream Banking AG by the paying agent of the issuer. The dispute relates to the non-
payment of the second tranche of the bond with a nominal value of €500 million and the purported lack
of validity of the bond. Clearstream Banking AG’s role in the dispute on the purported lack of validity of
the MBB Clean Energy AG bond is primarily to safekeep the global note, deposited by the paying agent
of the issuer as national central securities depository. At this stage, it is unclear if and to what extent
potential damages exist and if so who would ultimately be responsible. Insolvency proceedings have
meanwhile been opened in respect of the issuer, MBB Clean Energy AG.
CBOE vs ISE
On 12 November 2012, the Chicago Board Options Exchange (CBOE) filed a patent infringement
lawsuit against the International Securities Exchange (ISE) (the “CBOE Litigation”). In the CBOE Litiga-
tion, CBOE alleges US$525 million in damages for infringement of three patents, which relate to
systems and methods for limiting market-maker risk. ISE believes that CBOE’s damages claim lacks
merit because it is unsupported by the facts and the law. ISE intends to vigorously defend itself in this
lawsuit. Upon ISE’s motion, the case was stayed, pending the outcome of certain petitions filed by ISE
with the U.S. Patent and Trademark Office (USPTO) in which ISE seeks to invalidate the CBOE patents.
On 2 March 2015, the USPTO has partially granted ISE’s petitions and has issued decisions determin-
ing that all three CBOE patents are at least insofar invalid as they constitute unpatentable abstract ideas.
These decisions have been appealed by CBOE at the U.S. Court of Appeals for the Federal Circuit. A
decision in these appeal proceedings is expected in the second half of 2016.

54 Deutsche Börse Group interim report Q3/2015
In addition to the matters described above and in prior disclosures, Deutsche Börse Group is from time
to time involved in various legal proceedings that arise in the ordinary course of its business. Deutsche
Börse Group recognises provisions for litigation and regulatory matters when it has a present obligation
from an event in the past, an outflow of resources with economic benefit to settle the obligation is prob-
able and it is possible to reliably estimate the amount. In such cases, there may be an exposure to loss
in excess of the amounts accrued. When these conditions are not met, Deutsche Börse Group does not
recognise a provision. As a litigation or regulatory matter develops, Deutsche Börse Group evaluates on
an ongoing basis whether the requirements to recognise a provision are met. Deutsche Börse Group may
not be able to predict what the eventual loss or range of loss related to such matters will be. Deutsche
Börse Group does not believe, based on currently available information, that the results of any of these
various proceedings will have a material adverse effect on its financial statements as a whole.
Tax risks
Due to its business activities in various countries, Deutsche Börse Group is exposed to tax risks. A pro-
cess has been developed to recognise and evaluate these risks, which – in the first place – are recog-
nised depending on the probability they will arise. In a second step, these risks are measured on the
basis of their expected value. In case it is more probable than not that the risks will arise, a tax provision
is recognised. Deutsche Börse Group continuously reviews if the preconditions for the recognition
of corresponding tax provisions are met.
17. Material transactions with related parties
The following table shows the material transactions with companies classified as related parties. All
transactions were effected on an arm’s length basis.
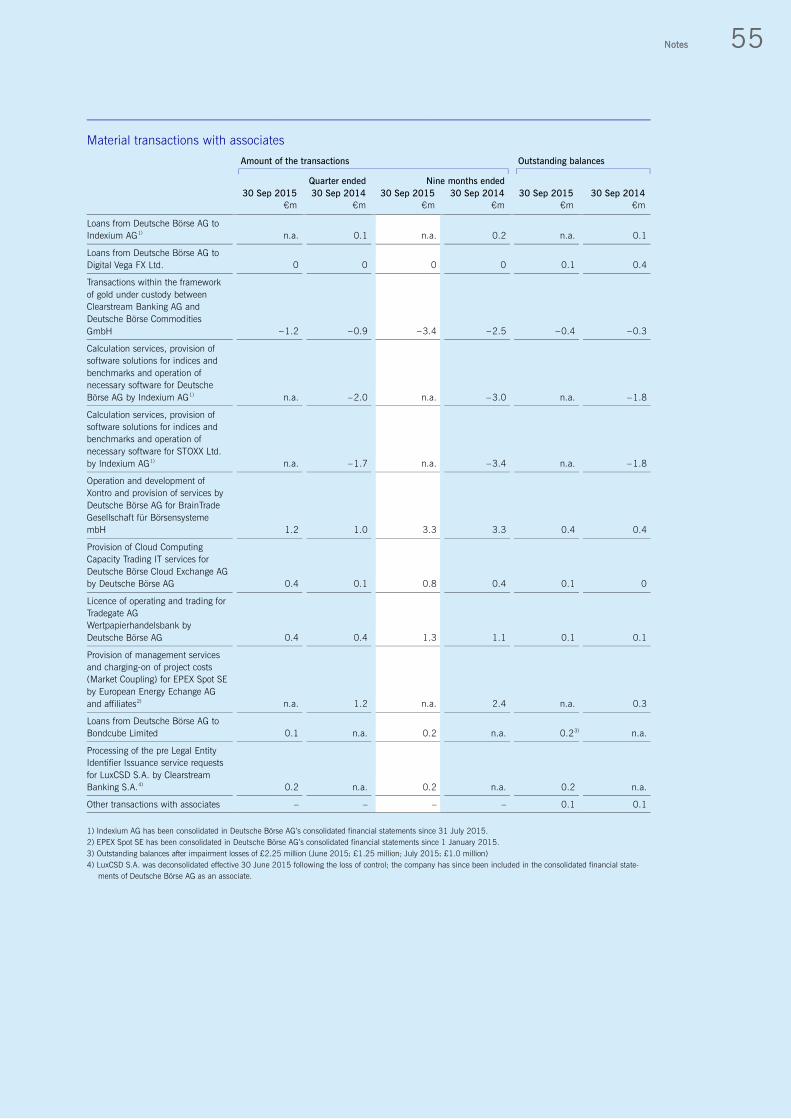
55 Notes
Material transactions with associates
Amount of the transactions Outstanding balances
Quarter ended Nine months ended
30 Sep 2015 30 Sep 2014 30 Sep 2015 30 Sep 2014 30 Sep 2015 30 Sep 2014
€m €m €m €m €m €m
Loans from Deutsche Börse AG to
Indexium AG
1) n.a. 0.1 n.a. 0.2 n.a. 0.1
Loans from Deutsche Börse AG to
Digital Vega FX Ltd. 0 0 0 0 0.1 0.4
Transactions within the framework
of gold under custody between
Clearstream Banking AG and
Deutsche Börse Commodities
GmbH – 1.2 – 0.9 – 3.4 – 2.5 – 0.4 – 0.3
Calculation services, provision of
software solutions for indices and
benchmarks and operation of
necessary software for Deutsche
Börse AG by Indexium AG
1) n.a. – 2.0 n.a. – 3.0 n.a. – 1.8
Calculation services, provision of
software solutions for indices and
benchmarks and operation of
necessary software for STOXX Ltd.
by Indexium AG
1) n.a. – 1.7 n.a. – 3.4 n.a. – 1.8
Operation and development of
Xontro and provision of services by
Deutsche Börse AG for BrainTrade
Gesellschaft für Börsensysteme
mbH 1.2 1.0 3.3 3.3 0.4 0.4
Provision of Cloud Computing
Capacity Trading IT services for
Deutsche Börse Cloud Exchange AG
by Deutsche Börse AG 0.4 0.1 0.8 0.4 0.1 0
Licence of operating and trading for
Tradegate AG
Wertpapierhandelsbank by
Deutsche Börse AG 0.4 0.4 1.3 1.1 0.1 0.1
Provision of management services
and charging-on of project costs
(Market Coupling) for EPEX Spot SE
by European Energy Echange AG
and affiliates
2) n.a. 1.2 n.a. 2.4 n.a. 0.3
Loans from Deutsche Börse AG to
Bondcube Limited 0.1 n.a. 0.2 n.a. 0.2
3) n.a.
Processing of the pre Legal Entity
Identifier Issuance service requests
for LuxCSD S.A. by Clearstream
Banking S.A.
4) 0.2 n.a. 0.2 n.a. 0.2 n.a.
Other transactions with associates – – – – 0.1 0.1
1) Indexium AG has been consolidated in Deutsche Börse AG’s consolidated financial statements since 31 July 2015.
2) EPEX Spot SE has been consolidated in Deutsche Börse AG’s consolidated financial statements since 1 January 2015.
3) Outstanding balances after impairment losses of £2.25 million (June 2015: £1.25 million; July 2015: £1.0 million)
4) LuxCSD S.A. was deconsolidated effective 30 June 2015 following the loss of control; the company has since been included in the consolidated financial state-
ments of Deutsche Börse AG as an associate.

56 Deutsche Börse Group interim report Q3/2015
Transactions with key management personnel
Key management personnel are persons who directly or indirectly have authority and responsibility
for planning, directing and controlling the activities of Deutsche Börse Group. The Group defines the
members of the Executive Board and the Supervisory Board as key management personnel for the
purposes of IAS 24.
In the third quarter of 2015, Deutsche Börse AG had the following business relations with entities
whose key management personnel are, at the same time, key management personnel at entities within
bodies of Deutsche Börse Group.
On 30 July 2009, European Commodity Clearing Luxembourg S.à r.l., Luxembourg, (ECC Luxembourg)
– a subsidiary of European Commodity Clearing AG – entered into a managing director agreement with
ffp Conseils SARL, Metz, France, for an indefinite period. The subject of the agreement is to provide a
natural person for the function of managing director in the management of ECC Luxembourg. In addition
to his/her position as managing director of ECC Luxembourg, this person is also a member of the key
personnel at the parent company of ffp Conseils SARL, pmi Beratung GmbH. In the first nine months of
2015, ECC Luxembourg made payments of approximately €46 thousand for these managing director
services.
Moreover, a follow-on agreement for the provision of advisory services was entered into between
Deutsche Börse AG and KM Networks GmbH, Hofheim, Germany, at the beginning of financial year
2015. A supervisory board member of European Energy Exchange AG is at the same time a member of
the key personnel at the consultancy firm KM Networks. Payments of €7 thousand were made in con-
nection with these advisory services in the first nine months of 2015.
18. Employees
Employees
Quarter ended
Nine months
ended
30 Sep 2015 30 Sep 2014 30 Sep 2015 30 Sep 2014
Average number of employees during the period 4,962 4,132 4,839 4,077
Employed as at the balance sheet date 4,998 4,161 4,998 4,161
The increase in the number of employees results largely from changes to the basis of consolidation
(518 employees). Since new jobs were created in connection with strategically important projects, the
number of employees increased by 319 persons year-on-year as at the balance sheet date.
There was an average of 4,659 full-time equivalent (FTE) employees during the third quarter of 2015
(Q3/2014: 3,858).

57 Notes
19. Events after the balance sheet date
As announced in July 2015, Deutsche Börse AG acquired all shares of 360T Beteiligungs GmbH effec-
tive 15 October 2015. As a result, it controls 360T Beteiligungs GmbH and its subsidiaries; and now
includes these companies in full in its consolidated financial statements.
Frankfurt / Main, 28 October 2015
Deutsche Börse AG
The Executive Board
Contact
Investor Relations
Phone +49-(0) 69- 2 11-1 16 70
Fax +49-(0) 69- 2 11-1 46 08
E-mail [email protected]
www.deutsche-boerse.com/ir_e
Publication date
28 October 2015
Publications service
The 2014 corporate report may be obtained from
the publications service of Deutsche Börse Group.
Phone +49-(0) 69- 2 11-1 15 10
Fax +49-(0) 69- 2 11-1 15 11
Downloads at
www.deutsche-boerse.com/annualreport
Reproduction – in whole or in part – only with
the written permission of the publisher
Registered trademarks
DAX®, Eurex®, Eurex Repo®, FWB®, GC Pooling®,
Xetra®, Xetra-Gold® and XTF® are registered
trademarks of Deutsche Börse AG.
STOXX® is a registered trademark of STOXX AG.
PEGAS® is a registered trademark of Powernext SA.
Published byDeutsche Börse AG60485 Frankfurt /MainGermanywww.deutsche-boerse.com
Order number 1015-4598
Financial calendar28 October 2015Q3/2015 results
29 October 2014Analyst and investor conference Q3/2015
17 February 2016 Preliminary results Q4 and FY 2015
18 February 2016 Analyst and investor conference Q4 and FY 2015
18 February 2016 Annual press briefing


