Accounting Horizons American Accounting Association Vol. 29, No. 3 DOI: 10.2308/acch-51100 2015 pp. 603–629 Internal Control Quality and Credit Default Swap Spreads Dragon Yongjun Tang, Feng Tian, and Hong Yan SYNOPSIS: This paper presents the first study on the effects of internal control quality on derivatives pricing. Specifically, we utilize data from the credit default swap (CDS) transactions of well-monitored companies to examine the relationship between the quality of internal control and the cost of debt. CDS data are advantageous for the study of this relationship because CDS contracts are comparatively more homogeneous, standardized, and liquid than either bank loans or public bonds. We find that, all else being equal, companies experiencing internal control material weakness (MW) exhibit higher CDS spreads than companies with effective internal control. Moreover, the MW effect on CDS spreads is more pronounced for company-level MWs than for less severe, account-specific MWs. We also document that CDS spreads increase around the filings of MWs. Furthermore, the deterioration of internal control quality is related to increases in CDS spreads. Finally, short-maturity CDS spreads are more affected by MWs than are long-maturity CDS spreads. Keywords: internal control over financial reporting; SOX 404; material weaknesses; credit default swaps; CDS; cost of debt; derivatives pricing. JEL Classifications: M41; G32; K22. Data Availability: The data are available from public sources. INTRODUCTION W e examine the effect of internal control quality under Section 404 of the Sarbanes- Oxley Act of 2002 (SOX 404, U.S. House of Representatives 2002) on the pricing of credit derivatives by analyzing a unique transaction dataset from the credit default swap Dragon Yongjun Tang is an Associate Professor at The University of Hong Kong, Feng Tian is an Assistant Professor at The Hong Kong Polytechnic University, and Hong Yan is a Professor at Shanghai Advanced Institute of Finance, and Shanghai Jiao Tong Univeristy. We thank Paul A. Griffin (editor), two anonymous referees, John Abernathy, Gary Biddle, Konan Chan, Mark DeFond, Fei Du, Yanling Guan, Jun Han, Grace Hu, Qiao Liu, Kirill Novoselov, Chul Park, Morton Pincus, Wing Suen, Eric Yeung, Liandong Zhang, Yinglei Zhang, Liu Zheng, and conference and seminar participants at the 2011 American Accounting Association Annual Meeting, the 2011 Asian Academic Accounting Association Annual Meeting, and at The University of Hong Kong for useful comments and discussions. Ying Deng provided excellent research assistance. This work is supported in part by the National Natural Science Foundation of China (NSFC, No. 71271134). Submitted: August 2012 Accepted: March 2015 Published Online: March 2015 Corresponding author: Feng Tian Email: [email protected]603
Internal Control Quality and Credit DefaultSwap Spreads
Dragon Yongjun Tang, Feng Tian, and Hong Yan
SYNOPSIS: This paper presents the first study on the effects of internal control quality
on derivatives pricing. Specifically, we utilize data from the credit default swap (CDS)
transactions of well-monitored companies to examine the relationship between the
quality of internal control and the cost of debt. CDS data are advantageous for the study
of this relationship because CDS contracts are comparatively more homogeneous,
standardized, and liquid than either bank loans or public bonds. We find that, all else
being equal, companies experiencing internal control material weakness (MW) exhibit
higher CDS spreads than companies with effective internal control. Moreover, the MW
effect on CDS spreads is more pronounced for company-level MWs than for less severe,
account-specific MWs. We also document that CDS spreads increase around the filings
of MWs. Furthermore, the deterioration of internal control quality is related to increases
in CDS spreads. Finally, short-maturity CDS spreads are more affected by MWs than are
long-maturity CDS spreads.
Keywords: internal control over financial reporting; SOX 404; material weaknesses;
credit default swaps; CDS; cost of debt; derivatives pricing.
JEL Classifications: M41; G32; K22.
Data Availability: The data are available from public sources.
INTRODUCTION
We examine the effect of internal control quality under Section 404 of the Sarbanes-
Oxley Act of 2002 (SOX 404, U.S. House of Representatives 2002) on the pricing of
credit derivatives by analyzing a unique transaction dataset from the credit default swap
Dragon Yongjun Tang is an Associate Professor at The University of Hong Kong, Feng Tian is anAssistant Professor at The Hong Kong Polytechnic University, and Hong Yan is a Professor atShanghai Advanced Institute of Finance, and Shanghai Jiao Tong Univeristy.
We thank Paul A. Griffin (editor), two anonymous referees, John Abernathy, Gary Biddle, Konan Chan, Mark DeFond,Fei Du, Yanling Guan, Jun Han, Grace Hu, Qiao Liu, Kirill Novoselov, Chul Park, Morton Pincus, Wing Suen, EricYeung, Liandong Zhang, Yinglei Zhang, Liu Zheng, and conference and seminar participants at the 2011 AmericanAccounting Association Annual Meeting, the 2011 Asian Academic Accounting Association Annual Meeting, and atThe University of Hong Kong for useful comments and discussions. Ying Deng provided excellent research assistance.This work is supported in part by the National Natural Science Foundation of China (NSFC, No. 71271134).
Submitted: August 2012Accepted: March 2015
Published Online: March 2015Corresponding author: Feng Tian
(CDS) market. CDSs are derivatives based on the credit risk of reference firms and are considered
among the most important recent developments in credit markets. The CDS market has enjoyed
tremendous growth, reaching over $21 trillion in outstanding notional value by the end of 2013.1
CDS contracts are the primary instrument for credit risk transfer and provide a superior measure of
credit risk because they are more standardized, homogeneous, and liquid than either public bonds or
bank loan.2 Popular media outlets, such as Bloomberg, often cite CDS spreads as a summary
measure of a firm’s financial health. Therefore, the CDS market provides an adequate setting to
examine the relationship between internal control quality under SOX 404, and credit risk, and to
understand the broad effects of accounting information on derivatives pricing (Griffin 2014).
SOX 404 requires that managers and auditors provide an annual assessment of the
effectiveness of internal control over financial reporting (i.e., internal control quality). The
compliance requirements for SOX 404 have remained controversial for a decade, and lawmakers
have repeatedly revisited these requirements (Gupta, Weirich, and Turner 2013). One of the main
rationales for SOX 404 is that material weaknesses (MWs) signal the likelihood of unreliable
financial reporting and greater information risk, which thereby affect the functioning of capital
markets (U.S. House of Representatives 2005).
We hypothesize that CDS spreads are higher for firms disclosing MWs. First, MWs reduce the
reliability of financial reporting and increase the information risk for credit investors. Hence,
investors may charge higher credit premiums to compensate for this heightened information risk
(see, e.g., Duffie and Lando 2001; Lambert, Leuz, and Verrecchia 2007). Second, the default risk of
borrowing firms with MWs may be higher because managerial misappropriation is more easily
concealed in the presence of MWs (Lambert et al. 2007), and the value of credit claims may also
decrease if misappropriation takes place.
Our empirical analysis supports this hypothesis and indicates that CDS spreads are significantly
higher for firms with MWs than for firms with effective internal control. The effect of internal
control quality on CDS spreads is economically large, that is, the annual debt interest expense is
$35.7 million higher for the average firm with MWs. Over the short term, CDS spreads increase by
1.78 percent around the three days of MW disclosures, suggesting a decrease of $49 million in the
outstanding debt value for the average firm in our sample. CDS spreads are higher for firms with
more severe, company-level MWs than for firms with account-specific MWs. Furthermore, two
pieces of evidence suggest that changes in CDS spreads are associated with MWs. First, the
reporting of MWs is significantly associated with an increase of CDS spreads. Second, the
deterioration of internal control quality (from effective during the prior year to reporting MWs in
the current year) is significantly related to an increase of CDS spreads.
Our unique data enable us to conduct a novel test to investigate how internal control quality
affects the term structure of CDS spreads across maturities. The prominent prediction from the
Duffie and Lando (2001) model is that the effect of MWs on CDS spreads is more pronounced over
the short term than over the long term because information risk from MWs matters most for debts
that will mature soon. We find that the effect of MWs on one-year CDS spreads is significantly
larger than the effect on five-year CDS spreads. This finding supports the theoretical prediction and
suggests that accounting information is particularly useful for short-term credit derivative valuation.
1 A survey conducted by the International Swap and Derivatives Association (ISDA) implies an annualized growth rateof 179 percent during the period 1998–2007 (Available at: http://www.isda.org/statistics/pdf/ISDA-Market-Survey-historical-data.pdf ).
2 Studies such as Griffin (2014) argue that CDS spreads provide relatively pure pricing of credit risk and reflectchanges in credit risk more accurately and quickly than other debt instruments because of the unique characteristics ofCDS contracts.
Our study provides evidence of the importance of internal control quality and the usefulness of
SOX 404 disclosures for credit derivatives pricing. Schneider, Gramling, Hermanson, and Ye
(2009) note that prior research on the impact of SOX 404 is inconclusive. Extant studies using
equity data have yielded mixed findings regarding the association between internal control quality
and the cost of equity (Ogneva, Raghunandan, and Subramanyam 2007; Ashbaugh-Skaife, Collins,
Kinney, and LaFond 2009; Gordon and Wilford 2012). Debt market evidence extracted from bonds
and loans has also been inconsistent. Although Kim, Song, and Zhang (2011) demonstrate that bank
loan rates are higher for companies with internal control MWs than for firms without such MWs,
Dhaliwal, Hogan, Trezevant, and Wilkins (2011) find that there is no association between reporting
internal control MWs and increased bond spreads in their study of companies monitored by banks
or rating agencies (essentially large firms). Contributing to the prior credit market research, we
provide strong evidence that MWs are positively related with CDS spreads both cross-sectionally
and over time. More importantly, our investigation on the effect of MWs on the term structure of
CDS spreads produces additional insight into how internal control quality affects credit risk.
The findings of this study also improve the understanding of CDS pricing, which has been
previously studied by Das, Hanouna, and Sarin (2009) and Callen, Livnat, and Segal (2009).
Recently, Griffin (2014) reviews the accounting research on CDSs and calls for further research,
including into the role of MWs in the CDS market. Our evidence that CDS pricing is influenced by
information risk measured by the quality of internal control supports the theoretical prediction of
Duffie and Lando (2001). Our findings also complement Arora, Richardson, and Tuna (2014) on
the effect of financial asset reliability on the term structure of CDS spreads for financial firms, and
Yu (2005) on the effect of accounting transparency on the term structure of bond spreads.
The rest of the paper is organized as follows. First, we introduce the CDS market and
hypothesize the relationship between CDS spreads and internal control quality. We then describe
our sample and the empirical design. Next, we report our findings on the effects of internal control
quality on CDS prices. Finally, we summarize our findings and conclude.
BACKGROUND AND HYPOTHESIS DEVELOPMENT
The CDS Market and Related Studies
CDSs can be regarded as insurance contracts protecting credit claims. In a CDS transaction, the
protection seller agrees to compensate the protection buyer if a default event with respect to a
reference issue occurs before the contract expires. For this credit protection, the buyer pays the
seller a fee that resembles an insurance premium. The annualized fee for a CDS contract is referred
to as the CDS spread or the CDS price. The CDS market has grown rapidly in recent years. An
ISDA survey indicates that the outstanding notional size of the CDS market was $180 billion in
1998 and grew to $62 trillion by 2007 (the CDS market continued to be active after the 2008 global
financial crisis).3
CDS contracts have become the main financial instrument to undertake credit risk transfer. The
major participants in the CDS market include large commercial banks, insurance companies, and
hedge funds. CDS reference companies are usually large firms. CDSs attracted a substantial amount
of attention during the 2008 global financial crisis and the 2010–2012 European sovereign crisis.
CDS spreads are often quoted as a timely barometer of the financial health of a reference firm or
sovereign entity. Recent empirical research on credit risk often employs CDS contracts as the main
instrument, and Longstaff, Mithal, and Neis (2005) suggest that CDS spreads are a superior
3 See Longstaff et al. (2005), Callen et al. (2009), Augustin, Subrahmanyam, Tang, and Wang (2014), and Griffin(2014) for overviews of the CDS market.
Internal Control Quality and Credit Default Swap Spreads 605
Accounting HorizonsSeptember 2015
measure of the credit risk premium. The advantages of CDSs in credit risk analysis are also
supported by other studies. For instance, Blanco, Brennan, and Marsh (2005) find that the CDS
market leads the bond market in the price discovery of credit risk. Acharya and Johnson (2007)
report that information flows from the CDS market to the equity market, particularly for major
negative news. Ericsson, Jacobs, and Oviedo (2009) show that much of the variation in CDS
spreads can be explained by structural model factors linked to firm fundamentals. Hilscher, Pollet,
and Wilson (2014) indicate that the CDS market does not lead the equity market in general but that
during major events, such as earnings releases, CDSs incorporate information quickly.
There is a growing literature within accounting that analyzes CDSs. Callen et al. (2009) and
Das et al. (2009) find that accounting earnings are priced into the levels of and changes in CDS
spreads, whereas De Franco, Vasvari, and Wittenberg-Moerman (2009) show that CDS prices are
responsive to debt analysts’ reports. Shivakumar, Urcan, Vasvari, and Zhang (2011) demonstrate
that CDS pricing reacts significantly to management forecast news and that the reaction to forecast
news is stronger than to actual earnings news. Batta (2011) examines the direct relevance of
accounting information for CDS pricing. Kim, Kraft, and Ryan (2013) find that greater financial
statement comparability is associated with lower CDS spreads. Griffin (2014) provides a
comprehensive review of CDS-related research in accounting and calls for additional accounting
research on CDSs, including the role of internal control quality in the CDS market, because such
research would enhance our understanding of the role of accounting information in helping
investors assess various credit risks.
Internal Control over Financial Reporting (SOX 404)
The evaluation of internal control over financial reporting has long been an important part of
the auditing process (Kinney, Maher, and Wright 1990). Prior to the enactment of the Sarbanes-
Oxley Act (SOX) in 2002, U.S. companies were required to disclose the effectiveness of internal
control only occasionally (e.g., in the event of an auditor termination). Since November 15, 2004,
SOX 404 has required firm management to assess the quality of internal control over financial
reporting and to provide periodic, auditor-attested evaluations of internal control effectiveness.4,5
A number of studies have evaluated the determinants of internal control quality (e.g.,
Ashbaugh-Skaife, Collins, and Kinney 2007; Doyle, Ge, and McVay 2007b; Ge and McVay 2005)
and found that smaller, younger, riskier, and financially weaker firms tend to report internal control
4 Section 404 has been one of the most controversial provisions of SOX because of the costs associated withcompliance (Palmrose 2010). Consequently, the Securities and Exchange Commission (SEC) has issued severalmanagement guidelines and the Public Company Accounting Oversight Board (PCAOB) replaced Audit StandardNo. 2 (AS No. 2) with Audit Standard No. 5 (AS No. 5) to alleviate the burden on filing firms and their auditors. Inaddition, compliance with Section 404 was postponed several times for small firms (market value below $75 million).See http://www.sec.gov/rules/interp/2007/33-8810.pdf and http://pcaobus.org/News/Releases/Pages/05242007_BoardApprovesNewAuditStandard.aspx. Furthermore, the Dodd-Frank Wall Street Reform and Consumer ProtectionAct of 2010 (U.S. House of Representatives 2010) granted small firms, i.e., non-accelerated filers, permanentexemptions from auditor certification requirements under Section 404 (b) of SOX. On April 5, 2012, the JumpstartOur Business Startups Act (JOBS Act, U.S. House of Representatives 2012) further exempted emerging growthcompanies, newly publicly listed companies, and middle-sized companies with revenues below $1 billion or marketvalue below $700 million, from compliance under SOX Section 404 (b).
5 The implementation of SOX 404 has become an important issue in auditing. Audits of internal control processesunder Section 404 are fundamentally different from audits of financial statements in terms of objective, value, andapproach (Kinney, Martin, and Shepardson 2013; Akresh 2010). Correspondingly, audit fees increased significantlyafter the implementation of SOX 404 and were positively associated with MWs (Raghunandan and Rama 2006; R.Hoitash, U. Hoitash, and Beard 2008). Furthermore, although companies that remediate MWs have lower audit feescompared to firms that continue to report MWs, the remediating firms continue to pay a significant fee premiumcompared to firms with clean internal control reports since the SOX 404 implementation (Munsif, Raghunandan,Rama, and Singhvi 2011). DeFond and Zhang (2014) present a comprehensive review of the topic.
MWs. Klamm, Kobelsky, and Watson (2012) observe that various types of MWs are positively
related to the persistent MWs. Nagy (2010) and Holder, Karim, and Robin (2013) note that the
implementation of SOX 404 improves earnings quality. Moreover, Doyle et al. (2007a) and
Ashbaugh-Skaife, Collins, Kinney, and LaFond (2008) report that internal control quality is
positively associated with earnings quality.6
Extant studies of the equity market offer a mixed picture of the capital market implications of
internal control quality. On the one hand, Ogneva et al. (2007) find no association among internal
control MWs and several risk measures—including the cost of equity capital, earnings quality, and
return volatility—after controlling for other firm characteristics. Beneish, Billings, and Hodder
(2008) demonstrate that equity markets do not react to Section 404 internal control MW disclosures.
On the other hand, Ashbaugh-Skaife et al. (2009) show that internal control weaknesses are
associated with higher idiosyncratic risk, higher systematic risk, and higher cost of equity. Gordon
and Wilford (2012) use a more recent sample of internal controls under SOX 404 to revisit the
relationship between internal control quality and the cost of equity and suggest that internal control
weaknesses are related to higher costs of equity. Skaife, Veenman, and Wangerin (2013) report that
internal control weaknesses are associated with higher profitability of insider trading, which
suggests that wealth transfers from companies to managers may occur under inferior internal
control regimes. Coates and Srinivasan (2014) provide a comprehensive review of the effects of
SOX in general, and Section 404 in particular, and suggest that more research is needed since
evidence of the Act’s net social welfare remains inconclusive.
Hypothesis Development
Internal control quality disclosures may be useful to credit investors in assessing information
risk. First, MWs cast doubt on the reliability of firms’ financial reports. As defined by auditing
standards (i.e., AS No. 2 [PCAOB 2004] or AS No. 5 [PCAOB 2007]), MWs in a firm imply more
than a remote likelihood that the firm’s internal control system will fail to detect or avoid material
misstatements in financial reports. This definition implies greater uncertainty regarding whether
financial reports and disclosures of a company are reliable. Such uncertainty increases the
information risk to creditors when assessing potential credit losses resulting from default. Eventually,
according to theory, creditors require compensation for information-related risk (Verrecchia 2001;
Duffie and Lando 2001; Easley and O’Hara 2004; Lambert et al. 2007). Second, weak internal
controls exacerbate agency conflicts because expropriation of debt holders by managers may be
more difficult to detect. Cheng, Dhaliwal, and Zhang (2013) show that firms with weak internal
controls tend to either over-invest or under-invest. Thus, ineffective internal controls might increase
information asymmetry between managers and creditors, which should lead to higher credit spreads.
Recent studies have examined the relationship between internal control quality and the cost of
debt and employed this line of reasoning using data on public bonds or private loans. Dhaliwal et al.
(2011) find that corporate bond spreads are marginally higher for firms disclosing internal control
MWs, but this relationship is nonexistent for firms monitored by banks. Conversely, Costello and
Wittenberg-Moerman (2011) and Kim et al. (2011) document that loan spreads are higher for firms
reporting internal control MWs among bank-monitored companies. Therefore, the evidence is
mixed. Because credit risk estimations in both bond and bank loan markets are complicated by their
embedded heterogeneous features—such as covenants, callability, and convertibility—it is
important to examine the relationship between credit risk and internal control quality in a cleaner
setting. We analyze this relationship in the largest market for credit derivatives, i.e., the CDS
6 Bardhan, Lin, and Wu (2015) study S&P 500 companies and find that family firms exhibit more MWs thannonfamily firms.
Internal Control Quality and Credit Default Swap Spreads 607
Accounting HorizonsSeptember 2015
market, because CDS-referenced companies are monitored by an arguably broader set of market
participants, which includes banks and participants in the bond and derivatives markets.7 Therefore,
given the theoretical prediction regarding the relationship between the quality of internal control
and credit risk, we hypothesize the following:
H1: CDS spreads are positively associated with internal control MWs.
MWs have different types and severities. Doyle, Ge, and McVay (2007a) classify internal control
MWs as two types. The first type of internal control MWs (i.e., account-specific MWs) is related to
specific accounts and transactions that can be easily overcome by auditors with additional procedures
(i.e., additional substantive tests). The other type of MWs (i.e., company-level MWs), however, is
associated with a firm’s overall control environment and/or financial reporting process. Such
systematic weaknesses can have a pervasive and permanent effect on the reliability of financial
reporting. This type of MW calls into question whether managers are able to maintain effective
management systems for their companies. Thus, debt market analysts regard company-level MWs as
more severe than account-specific MWs (Moody’s Investor Service 2004, 2006, 2007). Studies of
both private loan and public bond markets investigate the different effects of company-level MWs
versus account-specific MWs (Costello and Wittenberg-Moerman 2011; Dhaliwal et al. 2011; Kim et
al. 2011). These studies indicate that the effect of company-level MWs on credit spreads is larger than
the effect of account-specific MWs in private loans but not in the public bond market. Moreover,
Doyle et al. (2007a) find that company-level internal control weaknesses are more strongly related to
a range of risk measures (earnings quality, management forecast accuracy, etc.) than are account-
specific MWs.8 Accordingly, we hypothesize the following:
H2: Company-level MWs are more positively associated with CDS spreads than account-
specific MWs.
If the quality of internal control is important to CDS pricing, then we expect that CDS spreads
change around internal control filings. Importantly, we expect that the year-by-year change in
internal control quality should be associated with a change in CDS spreads. If a firm’s internal
control changes from effective to reporting MWs, CDS spreads are expected to increase. If internal
control weaknesses are remediated, then we expect to observe a decrease in CDS spreads because
the reliability of financial reporting will have improved, which will lead to lower information risk.
In the equity market, Gordon and Wilford (2012) find that cost of equity increases when internal
control quality deteriorates or MWs are not remediated and decreases when MWs are remediated.
In the debt market, Kim et al. (2011) document that loan spreads are negatively associated with the
remediation of MWs, while Costello and Wittenberg-Moerman (2011) find no evidence for such an
association.9 Accordingly, we hypothesize the following:
7 There are concerns that the CDS market is volatile and manipulated by a small number of banks (e.g., Alloway 2013).If this were the case, then the relationship between internal control quality and CDS spreads might be distorted, butwould bias the results against our hypothesis.
8 We focus on the classification with company-level and account-specific MWs. Such a classification is consistent withMoody’s and the COSO/PCAOB internal control framework (COSO 2004; AS No. 5, PCAOB 2007). Depending onthe research question, prior studies have used alternative classifications. For example, Klamm et al. (2012) categorizeMWs into information technology (IT) related and non-IT related MWs to study the persistence of MWs, while Feng,Li, McVay, and Skaife (2015) emphasize the role of inventory-related MWs in operations and classify such MWsinto inventory-tracking MWs and inventory-valuation MWs.
9 Prior studies have also examined the association between changes in internal control quality and other accounting andfinancial outputs, such as accruals quality, management forecast errors, inventory turnover, investment efficiency,analyst forecasts, insider trading, and audit fees (e.g., Ashbaugh-Skaife et al. 2008; Cheng et al. 2013; Clinton,Pinello, and Skaife 2014; Feng, Li, and McVay 2009; Feng et al. 2015; Munsif et al. 2011; Skaife et al. 2013). Thisstudy focuses on the relationship between internal control and capital market consequences.
608 Tang, Tian, and Yan
Accounting HorizonsSeptember 2015
H3a: CDS spread changes are associated with internal control quality disclosures.
H3b: CDS spread changes are associated with internal control quality changes.
We test H3a by examining the change in CDS spreads when internal control reports are filed.
We test H3b by examining the annual change in CDS spreads associated with changes in MWs in
the following scenarios: remediation cases in which MWs are corrected, repeated weakness cases in
which MWs repeat annually, and deterioration cases in which internal control changes from
effective to ineffective.
According to Duffie and Lando (2001), the information risk from low-quality internal control
not only increases credit spreads but also affects the term structure of credit spreads (i.e., credit
spreads at different maturities). In their model, investors rely on financial reports to estimate credit
risk. When financial reports are perceived as accurate, credit spreads approach zero as debt
approaches maturity. If a firm has MWs in financial reporting, then its financial information is likely
unreliable thereby creating information risk. Such information risk persists even as debt approaches
maturity. Therefore, their theory predicts that the information risk effect on credit spreads is more
pronounced at short maturities. Following Duffie and Lando (2001), Yu (2005) uses the annual
Association for Investment Management and Research (AIMR) corporate disclosure rankings as a
proxy for perceived disclosure quality and finds that firms with higher AIMR rankings tend to have
lower bond spreads. This transparency spread is especially pronounced for short-term bonds.
Compared to AIMR rankings, mandated internal control reports directly address financial reporting
processes and are attested by auditors thereby representing a theoretically appealing measure of
accounting information quality as described by Duffie and Lando (2001). Furthermore, Duffie and
Lando (2001) argue that CDSs are ideal for investigating the effect of accounting information risk
on term structure compared to bonds because CDSs are not contaminated by various covenant terms
or the heterogeneous characteristics of bonds. Therefore, we hypothesize the following:
H4: The effect of MWs on short-term CDS spreads is more pronounced than on longer-term
CDS spreads.
DATA AND SAMPLE DESCRIPTION
Our dataset is drawn from the intersection of SOX 404 disclosure data and CDS trading data
for U.S. corporations. We combine three sets of data in our empirical analysis: CDS data from
interdealer broker GFI Group Inc., Section 404 internal control reports compiled by Audit
Analytics, and firm financial and accounting information from CRSP and Compustat.
Sample Selection
We first retrieve all internal control data under Section 404 from Audit Analytics for firms with
a fiscal year ending between November 15, 2004, and May 31, 2007.10 The reports contain
management and auditor opinions about a firm’s internal control quality.
We require CDS transaction data over the sample period for firms with internal control
reporting. Our main CDS dataset comes from the GFI Group, a leading CDS interdealer broker. The
data, captured by GFI Group’s CreditMatch electronic and voice hybrid trading system, include all
transacted prices and tradable quotes with varying maturities for a reference entity. We augment the
GFI data with CDS trades and quotes from CreditTrade, another major interdealer broker operating
10 We end the sample period before the credit crisis for our main analysis. In our additional analysis, we extend the databeyond 2007 and discuss the findings for the crisis period.
Internal Control Quality and Credit Default Swap Spreads 609
Accounting HorizonsSeptember 2015
until 2006. CreditTrade data were previously used by Blanco et al. (2005) and Acharya and
Johnson (2007). The combined GFI and CreditTrade CDS data provide comprehensive coverage of
the market, although our findings are similar if we use only the GFI data. Actual transaction data are
critical to compare CDS spreads before and after MW announcements. We focus on five-year CDS
contracts, which are the most liquid. However, we also examine one-year and three-year contracts
when we test H4.
Summary Statistics
Panel A of Table 1 reports the summary statistics for our main variables. Our final sample
consists of 921 firm-year observations for 450 unique companies (i.e., CDS reference entities). The
average CDS spread is 77.8 basis points (bps) over our sample observations (median¼ 41.7 bps).
The data period corresponds to an economic expansion period with relatively low CDS spreads.
Nevertheless, there is substantial variation across CDS observations, and the standard deviation is
106.3 bps. Our sample firms are relatively large; the median total asset value of our firms is
approximately $11.8 billion. During our sample period, only firms (i.e., accelerated filers) with over
$75 million in assets were required to comply with SOX 404. Overall, our sample represents an
important cross-section of the U.S. capital market.
Panel B of Table 1 reports that the average CDS spread is 208 bps for firms reporting MWs and
68.4 bps for firms with effective internal controls. The difference in CDS spreads between these two
groups is statistically significant at the 1 percent level. Furthermore, firms with MWs have more
business segments, more restructuring activities, poorer performance, are more financially
distressed, have higher leverage, and higher stock return volatility than firms with effective
internal controls. These characteristics differences are consistent with previous studies of internal
control quality (i.e., Ge and McVay 2005). Importantly, Panel B of Table 1 indicates that the bid-
ask spread in the CDS market is much higher for MW firms than for non-MW firms. This pattern
suggests that MWs are related to higher information risk to credit market participants.
EMPIRICAL RESULTS
Event Studies of Internal Control Material Weakness Disclosures
We first conduct event studies to examine whether investors in the CDS market react to the
disclosure of MWs in internal controls. The extant studies of bank loan and public bond markets
focus on long-run changes in credit spreads due to the illiquidity of these markets. In contrast, we
capitalize on the higher trading frequency of CDSs to examine whether internal control disclosures
provide relevant information to credit derivatives markets. To conduct such an investigation, we
search for relevant news items through 10K Wizard and Factiva to determine the first date of a MW
disclosure 90 days prior to the filing date of an internal control report for firms disclosing MWs in
our sample. For these event dates, we estimate percentage changes in CDS spreads over the [�1,
þ1] three-day or [�2,þ2] five-day event windows. For purposes of comparison, we also calculate
cumulative stock returns during the same event window. Our estimation of the CDS spread change
follows Shivakumar et al. (2011). We use changes in CDS spreads instead of returns because our
window is a three-day (five-day) period, and calculating returns may involve estimation errors.11
Our results are robust to various adjustments to the CDS changes.
11 Lok and Richardson (2011) provide a method to calculate the credit return by considering the carry component of aCDS contract and its duration and show that, over short windows, raw changes and credit returns are highlycorrelated. We find similar results using CDS raw changes instead of percentage changes.
610 Tang, Tian, and Yan
Accounting HorizonsSeptember 2015
TA
BL
E1
Su
mm
ary
Sta
tist
ics
Pa
nel
A:
Su
mm
ary
Sta
tist
ics
of
the
Ov
era
llS
am
ple
Va
ria
ble
sM
ean
S.D
.Q
1M
edia
nQ
3
CD
SSP
RE
AD
77
.83
51
06
.29
62
3.6
67
41
.66
78
0.0
00
LO
G(C
DS
SPR
EA
D)
3.8
26
0.9
75
3.1
64
3.7
30
4.3
82
SEG
1.5
31
0.8
15
1.0
99
1.7
92
2.0
79
M&
A0
.23
80
.26
00
.00
00
.20
00
.40
0
RE
STR
UC
TU
RE
0.3
98
0.3
52
0.0
00
0.4
00
0.8
00
GR
OW
TH
0.1
12
0.1
51
0.0
28
0.0
76
0.1
57
INV
EN
TO
RY
0.0
95
0.1
20
0.0
11
0.0
54
0.1
33
%L
OSS
0.1
16
0.1
99
0.0
00
0.0
00
0.2
00
RZ
SCO
RE
4.7
76
1.7
14
3.0
00
5.0
00
6.0
00
SIZ
E9
.43
71
.19
58
.50
19
.38
61
0.2
27
SWA
PR
AT
E4
.87
80
.34
44
.56
05
.02
05
.15
0
TE
RM
SLO
PE
0.2
28
0.3
82
�0
.10
0�
0.0
10
0.7
70
LE
VE
RA
GE
0.2
47
0.1
49
0.1
38
0.2
15
0.3
22
VO
L_R
ET
0.2
45
0.0
83
0.1
85
0.2
26
0.2
89
LO
G(F
inan
cial
CD
S)
4.3
74
0.2
76
4.2
79
4.3
10
4.6
49
LO
G(C
DX
)3
.77
90
.19
03
.58
63
.68
24
.00
2
LO
G(B
ASP
RE
AD
)2
.17
40
.81
61
.75
52
.11
02
.60
3
Tot
alA
sset
s($
bil
lio
n)
47
.63
61
58
.94
44
.86
01
1.7
96
27
.69
0
Lon
g-T
erm
Deb
t($
bil
lio
n)
8.7
20
33
.03
70
.96
92
.48
25
.67
4
Mar
ket
Val
ue($
bil
lio
n)
23
.48
14
0.0
24
4.3
18
10
.32
22
2.9
69
Ind
icat
or
Var
iab
les
Per
cen
tag
eo
fN
on
zero
Ob
serv
atio
ns
Nu
mb
ero
fN
on
zero
Ob
serv
atio
ns
MW
6.7
3%
62
AC
CO
UN
TSP
EC
IFIC
MW
2.6
1%
24
CO
MP
AN
YL
EV
EL
MW
4.1
3%
38
FO
RE
IGN
27
.69
%2
55
This
pan
elre
port
sth
esu
mm
ary
stat
isti
csof
our
sam
ple
,w
hic
hco
nsi
stof
921
firm
yea
rsfo
r450
dis
tinct
firm
s.S
eeA
ppen
dix
Afo
rvar
iable
defi
nit
ions.
(con
tinu
edo
nn
ext
pa
ge)
Internal Control Quality and Credit Default Swap Spreads 611
Accounting HorizonsSeptember 2015
TA
BL
E1
(co
nti
nu
ed)
Pa
nel
B:
Un
iva
ria
teC
om
pa
riso
no
fM
Wv
ersu
sN
on
-MW
Fir
ms
Fir
ms
wit
hE
ffec
tiv
eIn
tern
al
Co
ntr
ol
MW
Fir
ms
Va
ria
ble
sM
ean
Med
ian
S.D
.M
ean
Med
ian
S.D
.t-
test
Wil
cox
on
Tes
t
CD
SSP
RE
AD
68
.44
24
0.5
00
87
.20
52
07
.97
21
52
.33
32
12
.10
8(�
5.1
5)*
**
(�6
.54
)**
*
LO
G(C
DS
SPR
EA
D)
3.7
57
3.7
01
0.9
24
4.7
75
5.0
26
1.1
67
(�6
.71
)**
*(�
6.5
4)*
**
SEG
1.5
13
1.7
92
0.8
12
1.7
80
2.0
13
0.8
21
(�2
.48
)**
(�3
.02
)**
*
M&
A0
.23
40
.20
00
.25
90
.29
00
.20
00
.27
4(�
1.5
5)
(�1
.68
)*
RE
STR
UC
TU
RE
0.3
87
0.4
00
0.3
50
0.5
43
0.6
00
0.3
47
(�3
.40
)**
*(�
3.3
9)*
**
GR
OW
TH
0.1
14
0.0
77
0.1
53
0.0
82
0.0
59
0.1
28
(1.8
9)*
(2.0
8)*
*
INV
EN
TO
RY
0.0
97
0.0
54
0.1
22
0.0
76
0.0
53
0.0
88
(1.7
7)*
(0.7
7)
%L
OSS
0.1
03
0.0
00
0.1
82
0.2
98
0.2
00
0.3
00
(�5
.05
)**
*(�
5.8
2)*
**
RZ
SCO
RE
4.8
49
5.0
00
1.7
05
3.7
74
4.0
00
1.5
19
(5.3
3)*
**
(4.7
0)*
**
SIZ
E9
.44
19
.39
01
.18
99
.38
59
.36
51
.28
5(0
.33
)(0
.63
)
SWA
PR
AT
E4
.87
95
.05
00
.34
54
.86
64
.94
00
.34
4(0
.29
)(0
.82
)
TE
RM
SLO
PE
0.2
28
�0
.01
00
.38
70
.22
40
.04
50
.32
3(0
.10
)(�
1.0
4)
LE
VE
RA
GE
0.2
42
0.2
11
0.1
45
0.3
05
0.2
73
0.1
86
(�2
.61
)**
(�2
.48
)**
VO
L_R
ET
0.2
41
0.2
24
0.0
79
0.2
94
0.2
66
0.1
09
(�3
.73
)**
*(�
4.0
1)*
**
LO
G(F
inan
cial
CD
S)
4.3
77
4.3
04
0.2
67
4.3
38
4.4
48
0.3
79
(0.8
0)
(�0
.66
)
LO
G(C
DX
)3
.77
63
.68
10
.18
93
.81
43
.75
80
.19
9(�
1.4
3)
(�2
.48
)**
LO
G(B
ASP
RE
AD
)2
.14
12
.07
90
.79
22
.62
52
.74
61
.00
2(�
3.7
2)*
**
(�4
.85
)**
*
Tot
alA
sset
s($
bil
lio
n)
44
.74
51
1.8
94
15
1.4
17
87
.26
71
1.6
68
23
7.6
45
(�1
.39
)(0
.57
)
Lon
g-T
erm
Deb
t($
bil
lio
n)
7.2
03
2.5
58
19
.79
42
9.5
27
2.2
16
10
1.8
56
(�1
.72
)*(�
0.3
2)
Mar
ket
Val
ue($
bil
lio
n)
24
.39
11
0.6
54
41
.05
81
0.2
49
5.7
36
14
.13
7(6
.01
)**
*(4
.07
)**
*
Ind
icat
or
Var
iab
leP
erce
nta
ge
of
No
nze
roO
bse
rvat
ion
sP
erce
nta
ge
of
No
nze
roO
bse
rvat
ion
sC
hi-
squ
ared
test
FO
RE
IGN
25
.84
%5
3.2
3%
(21
.65
)**
*
***,
**,
*D
enote
signifi
cance
atth
e0.0
1,
0.0
5,
and
0.1
0le
vel
s,re
spec
tivel
y.
This
pan
elre
port
sth
euniv
aria
teco
mpar
ison
bet
wee
nfi
rms
wit
hM
Ws
and
firm
sw
ith
effe
ctiv
ein
tern
alco
ntr
ol.
See
Appen
dix
Afo
rvar
iable
defi
nit
ions.
612 Tang, Tian, and Yan
Accounting HorizonsSeptember 2015
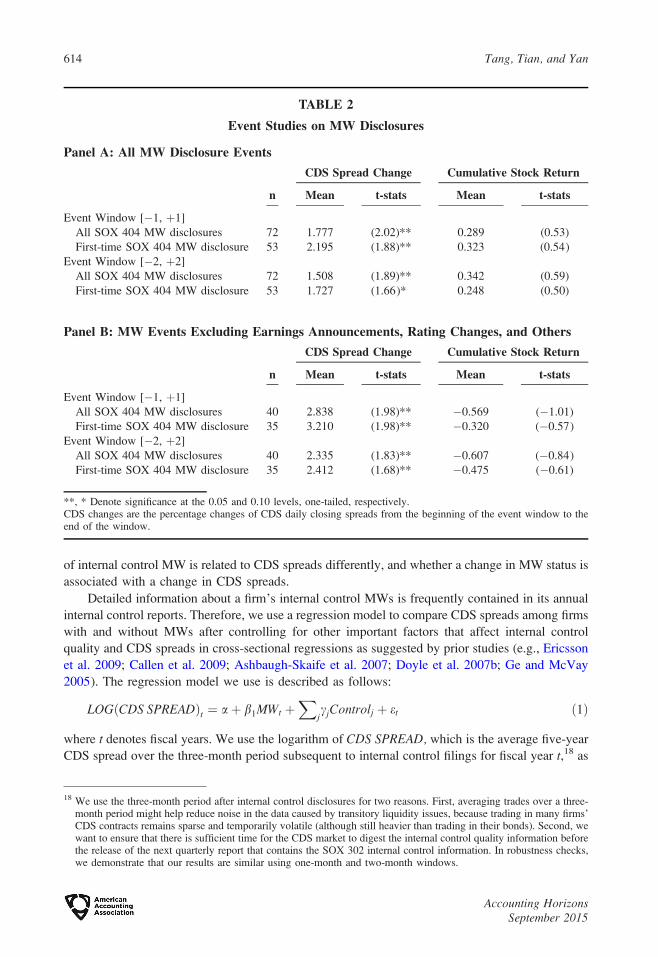
Panel A of Table 2 reports that CDS spreads increase by 1.78 percent (1.51 percent), on
average, over a three-day (five-day) event window surrounding MW disclosures.12 These CDS
spread increases are statistically significant, which suggests that disclosures of SOX 404 MWs
convey new negative information to the credit derivatives market.13 The reaction to MW
disclosures is also economically meaningful, that is, the debt value of an average MW firm in our
sample is reduced by approximately 0.167 percent, or $49 million during the three days
surrounding MW disclosures.14 Moreover, we examine the first-time disclosure of MWs under
SOX 404 and find that the percentage change in CDS spreads increases slightly in magnitude.
We scrutinize concurrent news within the three-day window to capture the MW announcement
effect. Twenty events were accompanied with earnings announcements in firm press releases, six
events with credit rating changes, four events with M&A and restructuring, and nine events with
other news such as change in auditor/officer, lawsuits, and repurchase of shares. With exclusion of
such concurrent news, 40 events remain.15 Panel B of Table 2 indicates that, after dropping the
events with abovementioned concurrent news, MW disclosures are associated with a 2.84 percent
increase in CDS spreads, which is significant at the 5 percent level. In contrast, the cumulative stock
market reaction is negative but insignificant. This finding is consistent with the findings obtained by
Beneish et al. (2008) that SOX 404 MW disclosures have no noticeable impact on stock prices.16
The different reactions of the CDS and stock markets might be due to market segmentation or the
limits of arbitrage. Kapadia and Pu (2012) report that pricing discrepancies between CDSs and
stocks are common, Acharya and Johnson (2007) show that CDSs lead stock prices for major
negative events, while Hilscher et al. (2014) argue that CDSs react more quickly during salient
news events.17 Overall, the combined results from both the credit derivatives markets and the stock
market suggest that MW disclosures provide relevant new information to the CDS markets.
Cross-Sectional Regression Analysis
The evidence regarding the immediate CDS market reaction to disclosures of internal control
MWs suggests that CDS pricing is affected by internal control quality. To test our hypotheses, we
construct cross-sectional regressions to analyze how internal control quality (internal control
weaknesses versus effective internal control) is associated with CDS spreads, whether the severity
12 The event studies include 72 MW events covered by our CDS data but only 62 are used in the subsequent regressionanalysis due to the constraints of control variables.
13 We also estimate the adjusted CDS spread changes by subtracting the average CDS spread change with the samecredit rating over the same period from raw CDS spread changes and obtain similar results.
14 We estimate the bond price change using the duration relationship: Dp ’�D 3 DCDS, where D is the debt durationof the company and Dp is the percentage change in debt value. Because the average CDS spread for MW firms is 208bps, the change in CDS spreads is 3.7 bps. We obtain these approximate percentage and dollar estimates using theaverage debt duration of 4.5 years and total long-term liabilities of $29.5 billion in our MW sample.
15 The initial MW disclosures before formal filings do not provide much detail as to whether MWs are company-level oraccount-specific weaknesses, but these reports provide information indicating the severity of MWs and imply that 20MWs are detected because of financial misstatements and ten MWs are delinquent, which are regarded as more severeby Moody’s Investors Service (2004, 2006). This pattern is consistent with the prior studies indicating that auditorsdetect a large portion of MWs through misstatements (Kinney et al. 2013; Gramling, O’Donnell, and Vandervelde2013; Bedard and Graham 2011).
16 We conjecture that the lack of a significant reaction in the stock market may be related to two factors: (1) Stock pricesreflect MW information in a noisier way, and (2) MW information is explicitly taken into consideration by ratingagencies such as Moody’s, but not by equity analysts.
17 However, there is considerable research on the correlations between CDS and stock returns. For example, Blanco etal. (2005) demonstrate that CDSs move with stock returns. However, the majority of studies testing the informationalefficiency of the CDS market find that CDS prices lead price discovery in other markets (Griffin 2014). We believethat such an issue remains debatable.
Internal Control Quality and Credit Default Swap Spreads 613
Accounting HorizonsSeptember 2015
of internal control MW is related to CDS spreads differently, and whether a change in MW status is
associated with a change in CDS spreads.
Detailed information about a firm’s internal control MWs is frequently contained in its annual
internal control reports. Therefore, we use a regression model to compare CDS spreads among firms
with and without MWs after controlling for other important factors that affect internal control
quality and CDS spreads in cross-sectional regressions as suggested by prior studies (e.g., Ericsson
et al. 2009; Callen et al. 2009; Ashbaugh-Skaife et al. 2007; Doyle et al. 2007b; Ge and McVay
2005). The regression model we use is described as follows:
LOGðCDS SPREADÞt ¼ aþ b1MWt þX
jcjControlj þ et ð1Þ
where t denotes fiscal years. We use the logarithm of CDS SPREAD, which is the average five-year
CDS spread over the three-month period subsequent to internal control filings for fiscal year t,18 as
TABLE 2
Event Studies on MW Disclosures
Panel A: All MW Disclosure Events
n
CDS Spread Change Cumulative Stock Return
Mean t-stats Mean t-stats
Event Window [�1, þ1]
All SOX 404 MW disclosures 72 1.777 (2.02)** 0.289 (0.53)
**, * Denote significance at the 0.05 and 0.10 levels, one-tailed, respectively.CDS changes are the percentage changes of CDS daily closing spreads from the beginning of the event window to theend of the window.
18 We use the three-month period after internal control disclosures for two reasons. First, averaging trades over a three-month period might help reduce noise in the data caused by transitory liquidity issues, because trading in many firms’CDS contracts remains sparse and temporarily volatile (although still heavier than trading in their bonds). Second, wewant to ensure that there is sufficient time for the CDS market to digest the internal control quality information beforethe release of the next quarterly report that contains the SOX 302 internal control information. In robustness checks,we demonstrate that our results are similar using one-month and two-month windows.
614 Tang, Tian, and Yan
Accounting HorizonsSeptember 2015
the dependent variable. The five-year CDS contracts are the most popular and most actively traded
in the market. Our key independent variable is an indicator, MW, for whether a company reports
internal control MWs (MW ¼ 1) or not (MW ¼ 0) in year t.First, we control for the determinants of internal control weaknesses and include the number of
segments (SEG), foreign transactions (FOREIGN), mergers and acquisitions (M&A), restructuring
(RESTRUCTURE), sales growth (GROWTH), inventory (INVENTORY), firm size (SIZE), and past
losses (%LOSS) (e.g., Ge and McVay 2005; Ashbaugh-Skaife et al. 2007; Doyle et al. 2007b).
Second, we control for the commonly used determinants of credit spreads by including stock return
volatility (VOL_RET) and leverage (LEVERAGE) (see, e.g., Ericsson et al. 2009; Callen et al.
2009). We include a ranked Altman (1968) Z-score (RZSCORE) to control for financial distress.
We also control for macroeconomic conditions by including interest rate swap rate (SWAPRATE)
and term slope (TERMSLOPE). Prior studies indicate that credit risk not only relies on the reference
firm’s risk, but also on the default risk of CDS contract sellers (i.e., counter-party risk) (Jarrow and
Yu 2001; Morkoetter, Pleus, and Westerfeld 2012). Since CDS sellers are financial institutions in
most situations, we include the financial industry CDS spreads to control for counter-party risk
because the financial industry CDS spreads represent their ability to fulfill obligations as CDS
sellers.19 CDS index is included to control for the overall CDS market spread changes. We further
follow Tang and Yan (2012) and Bongaerts, de Jong, and Driessen (2011) in utilizing the bid-ask
spread of CDS contracts to control for the liquidity of the CDS market. Detailed definitions of these
variables are provided in Appendix A. Our main regression analysis is conducted on a pooled time-
series and cross-sectional panel with industry and year fixed effects. We cluster standard errors by
firms and years.
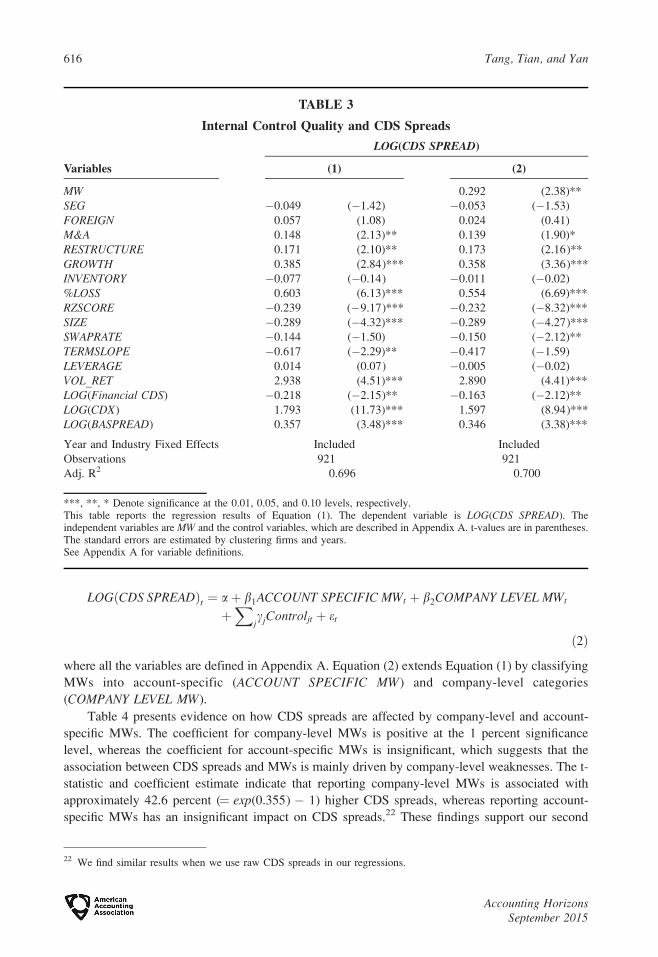
Table 3 reports our baseline panel regression results using LOG(CDS SPREAD) as the
dependent variable. Column (1) reports the results without including MW. Column (2) includes both
MW and all control variables. In Column (2), the coefficient estimate for MW is positive and
significant at the 5 percent level or better, which supports our first hypothesis that CDS spreads are
positively associated with MWs. The coefficient on MW is 0.292, suggesting that internal control
MWs are associated with a 33.9 percent (¼ exp(0.292)� 1) higher CDS spreads with a full set of
control variables. To provide a more direct explanation regarding the effect of MWs on CDS
spreads, we also use the CDS spread without taking a logarithm as the dependent variable to repeat
the regressions and find that the coefficient estimate on MW is 47.1, which is significant at the 5
percent level. This estimate suggests that CDS spreads are 47 bps higher for MW firms than firms
with effective internal controls. This CDS spread difference can be translated into a $40.9 million
difference in annual interest expenses between a MW and a non-MW firm.20
In sum, our results in Table 3 suggest that internal control MWs are significantly associated
with higher CDS spreads.21 Therefore, our baseline empirical tests support H1. Our findings also
imply that internal control quality plays an important role in credit risk pricing in the CDS market, a
market in which reference companies are intensely monitored by sophisticated market participants.
To test H2—that company-level MWs are more positively associated with CDS spreads than
account-specific MWs—we further analyze the effect of the severity of MWs on CDS spreads by
employing the following regression:
19 Alternatively, we use the top six (or fourteen) CDS dealers’ average CDS spreads as the proxy for the counter-partyrisk. Our analysis is robust to these alternative measures.
20 Given the average debt amount of $8.7 billion, the annual interest expense is estimated as follows: 8,700 3 0.47percent¼ $40.9 million. Since the average long-term debt interest rate (the risk-free rate in our sample period plus thecredit spread) for a MW firm in our sample is 6.1 percent, these 47 bps account for 7.7 percent of the total interestexpense for a MW firm.
21 The analysis in Table 3 is based on a cross-sectional regression model, which does not imply the potential to exploitthe slow diffusion of MW news.
Internal Control Quality and Credit Default Swap Spreads 615
***, **, * Denote significance at the 0.01, 0.05, and 0.10 levels, respectively.This table reports the regression results of Equation (1). The dependent variable is LOG(CDS SPREAD). Theindependent variables are MW and the control variables, which are described in Appendix A. t-values are in parentheses.The standard errors are estimated by clustering firms and years.See Appendix A for variable definitions.
22 We find similar results when we use raw CDS spreads in our regressions.
616 Tang, Tian, and Yan
Accounting HorizonsSeptember 2015
hypothesis that company-level MWs have a greater impact on CDS spreads than account-specific
MWs.
The regression results in Tables 3 and 4 suggest that poor-quality internal control is associated
with higher CDS spreads. To test H3, we examine the change in CDS spreads around internal
control reports from three months prior to the reports to three months after the reports in Panel A of
Table 5. Compared to the event study for short windows documented in Table 2, Panel A of Table 5
compares the change of CDS spreads to MWs to effective internal control with multiple controls.
The results indicate that the CDS spread change to internal control reports with MWs is 15.8
percent higher than the change of spreads to effective internal control reports. This pattern supports
H3a.
Because the quality of internal control under SOX 404 changes annually, we also examine how
the change in MWs is related to the annual change in CDS spreads. Panel B of Table 5 reports the
summary statistics for the annual change in CDS spreads for four types of changes in internal
control quality. The table indicates that most firms in the sample maintain effective internal control
over time. Of the firms, 13 firms experience internal control quality deterioration (MW¼ 0 to MW¼1), 20 firms remediate MWs (MW¼ 1 to MW¼ 0), and 19 firms continue to have MWs (MW¼ 1 to
MW ¼ 1). In Panel C, the multivariate regressions indicate that when firm internal control quality
TABLE 4
Severity of Internal Control Quality and CDS Spreads
Variables LOG(CDS SPREAD)
ACCOUNT SPECIFIC MW 0.196 (1.07)
COMPANY LEVEL MW 0.355 (4.22)***
SEG �0.053 (�1.52)
FOREIGN 0.025 (0.41)
M&A 0.142 (1.96)*
RESTRUCTURE 0.174 (2.15)**
GROWTH 0.359 (3.40)***
INVENTORY 0.004 (0.01)
%LOSS 0.554 (6.75)***
RZSCORE �0.232 (�8.23)***
SIZE �0.289 (�4.24)***
SWAPRATE �0.149 (�2.17)**
TERMSLOPE �0.432 (�1.59)
LEVERAGE �0.008 (�0.04)
VOL_RET 2.884 (4.42)***
LOG(Financial CDS) �0.149 (�1.61)
LOG(CDX) 1.583 (10.06)***
LOG(BASPREAD) 0.345 (3.37)***
Year and Industry Fixed Effects Included
Observations 921
Adj. R2 0.700
***, **, * Denote significance at the 0.01, 0.05, and 0.10 levels, respectively.This table reports the regression results of Equation (2). The dependent variable is LOG(CDS SPREAD) of three monthCDS spreads. The independent variables are ACCOUNT SPECIFIC MW, COMPANY LEVEL MW, and the controlvariables, which are described in Appendix A. t-values are in parentheses. The standard errors are estimated by clusteringfirms and years.See Appendix A for variable definitions.
Internal Control Quality and Credit Default Swap Spreads 617
Accounting HorizonsSeptember 2015
TABLE 5
The Change in Internal Control Quality and the CDS Spread Change
Panel A: The Change of CDS Spreads around Internal Control Reports
***, **, * Denote significance at the 0.01, 0.05, and 0.10 levels, respectively.This panel measures changes of all the variables as information change from three months subsequent to internal controlreports to three months prior to internal control reports. The dependent variable is the three-month change of LOG(CDSSPREAD) around internal control reports. The standard errors are estimated by clustering firms and years.See Appendix A for variable definitions.
Panel B: Descriptive Statistics on the CDS Spread Change Associated with the Change inInternal Control Quality
Change in Internal Control Quality n Mean Median S.D.
MW ¼ 0 to MW ¼ 0 467 �0.122 �0.173 0.507
MW ¼ 0 to MW ¼ 1 13 0.369 0.329 0.754
MW ¼ 1 to MW ¼ 0 20 �0.190 �0.220 0.388
MW ¼ 1 to MW ¼ 1 19 �0.071 �0.085 0.465
This panel presents descriptive statistics for the change of LOG(CDS SPREAD) from year t�1 to year t associated witheach of the groups with the change of internal control quality from year t�1 to year t.
control. The negative coefficient on remediation cases suggests a decrease in CDS spreads, but this
change is statistically insignificant.
According to Duffie and Lando (2001), the effect of information risk from financial reporting
on CDS spreads is more pronounced at short maturities. In our previous empirical tests, we focus on
five-year CDS spreads because these contracts are most liquid and are unlikely to be contaminated
by the illiquidity of the credit market. To explore how internal control quality affects the term
structure of credit spreads, we include three-year and one-year CDSs in the tests. Panel A of Table 6
reports the descriptive statistics regarding the effect of internal control quality on CDS spreads at
five-, three-, and one-year maturities. The table indicates that MW firm spreads are always
significantly larger than those of firms with effective internal control. More importantly, the effect
of MWs on CDS spreads is more pronounced for one-year CDSs than three-year or five-year CDSs.
Panel B reports the regression results by controlling for factors potentially affecting both internal
control quality and CDS spreads. The coefficient on the interaction term MW 3 3-Year Maturity is
positive and significant at the 1 percent level. This result suggests that, all else equal, the effect of
MW on CDS spreads is 170 percent greater than the average credit spread effect. Moreover, the
TABLE 5 (continued)
Panel C: Regression of the CDS Spread Change on the Change in Internal Control Quality
Variables
DLOG(CDS SPREAD)t�1 ! t
(1) (2)
MW ¼ 0 to MW ¼ 1 0.467 (2.50)**
MW ¼ 1 to MW ¼ 0 �0.073 (�1.00)
MW ¼ 1 to MW ¼ 1 �0.053 (�0.13)
DSEG �0.033 (�0.16) �0.041 (�0.20)
DFOREIGN 0.005 (0.07) �0.032 (�3.22)***
DM&A �0.027 (�0.04) 0.009 (0.01)
DRESTRUCTURE �0.076 (�2.65)*** �0.031 (�0.27)
DGROWTH 0.871 (1.43) 0.901 (1.78)*
DINVENTORY 6.187 (3.67)*** 6.079 (5.51)***
D%LOSS �0.194 (�0.76) �0.206 (�0.72)
DRZSCORE �0.054 (�0.69) �0.042 (�0.68)
DSIZE �0.023 (�0.21) �0.035 (�0.33)
DSWAPRATE �0.005 (�0.11) �0.025 (�0.42)
DTERMSLOPE 0.091 (0.85) 0.017 (0.18)
DLEVERAGE 0.895 (2.64)*** 0.998 (6.11)***
DVOL_RET 0.617 (1.35) 0.565 (1.10)
DLOG(Financial CDS) 0.235 (1.51) 0.177 (2.62)***
DLOG(CDX) �0.043 (�0.07) 0.190 (0.56)
DLOG(BASPREAD) 0.175 (2.08)** 0.162 (1.64)
Year and Industry Fixed Effects Included Included
Observations 519 519
Adj. R2 0.148 0.164
***, **, * Denote significance at the 0.01, 0.05, and 0.10 levels, respectively.In this panel, the dependent variable is change of LOG(CDS SPREAD) from year t�1 to year t. The independent variablesare the changes of MW and the control variables, which are described in Appendix A. t-values are in parentheses. Thestandard errors are estimated by clustering firms and years.See Appendix A for variable definitions.
Internal Control Quality and Credit Default Swap Spreads 619
Accounting HorizonsSeptember 2015
TABLE 6
Internal Control Quality and Term Structure of CDS Spreads
Panel A: Descriptive Statistics of CDS Spread Term Structures
Maturity
Firms with EffectiveInternal Control MW Firms
t-test Wilcoxon Testn Mean Median n Mean Median
1 Year 54 3.352 3.008 7 5.612 5.096 (�3.55)*** (�3.05)***
3 Years 152 3.392 3.178 13 5.145 5.150 (�4.80)*** (�4.08)***
5 Years 859 3.757 3.701 62 4.775 5.026 (�6.71)*** (�6.54)***
This panel presents descriptive statistics of LOG(CDS SPREAD) for MW versus non-MW subsamples at differentmaturities.
Panel B: Regression Results
Variables LOG(CDS SPREAD)
MW 0.242 (2.37)**
MW 3 3-Year Maturity 0.658 (3.22)***
MW 3 1-Year Maturity 1.110 (3.33)***
3-Year Maturity �0.414 (�6.34)***
1-Year Maturity �0.651 (�10.58)***
SEG �0.083 (�1.78)*
FOREIGN 0.070 (1.05)
M&A 0.134 (1.60)
RESTRUCTURE 0.155 (2.13)**
GROWTH 0.346 (5.81)***
INVENTORY �0.334 (�0.58)
%LOSS 0.445 (2.96)***
RZSCORE �0.232 (�8.05)***
SIZE �0.261 (�3.66)***
SWAPRATE �0.093 (�1.65)
TERMSLOPE �0.320 (�0.93)
LEVERAGE 0.145 (0.57)
VOL_RET 2.853 (4.11)***
LOG(Financial CDS) �0.225 (�3.62)***
LOG(CDX) 1.614 (5.55)***
LOG(BASPREAD) 0.423 (4.25)***
Year and Industry Fixed Effects Included
Observations 1,147
Adj. R2 0.699
***, **, * Denote significance at the 0.01, 0.05, and 0.10 levels, respectively.t-statistics are in parentheses. The standard errors are estimated by clustering firms and years. 3-Year Maturity is anindicator variable that equals 1 if a CDS is a three-year senior contract, and 0 otherwise; 1-Year Maturity is an indicatorvariable that equals 1 if a CDS is a one-year senior contract, and 0 otherwise.See Appendix A for other variable definitions.
620 Tang, Tian, and Yan
Accounting HorizonsSeptember 2015
coefficient on MW 3 1-Year Maturity is greater than the coefficients on MW and MW 3 3-YearMaturity.23 The overall pattern of MW on CDS spreads at different maturities supports our
hypothesis that the effect of MW on CDS spreads is more pronounced at short maturities, which
suggests that MWs significantly increase the information risk component of CDS spreads.24
Additional Analysis and Robustness Checks
We conduct the following additional tests without tabulating the results. First, financial firms
are highly regulated and often act as the dealers and counterparties in CDS contracts. There is a
concern that the interconnectedness of financial firms might affect CDS informational efficiency
(Griffin 2014). In fact, financial firms have complied with internal control provisions since 1992,
which is much earlier than the implementation of SOX 404 (Altamuro and Beatty 2010). We
exclude financial firms from the sample and obtain similar results.
Second, the CDS data from Markit are often used in research (e.g., Arora et al. 2014; Kim et al.
2013). As discussed by Subrahmanyam, Tang, and Wang (2014), CDS spreads in GFI more
reliably reflect true market information because they are based on actual transactions, while Markit
can provide CDS spreads for a larger number of firms because the CDS spreads can be generated
from models and are not limited to those with market transactions. GFI data have been previously
used by Hull, Predescu, and White (2004), Nashikkar, Subrahmanyam, and Mahanti (2011), and
others.25 Nevertheless, our analysis is robust to the use of Markit data.
Third, as discussed before, MWs affect credit spreads by increasing information risk and/or
default risk. Our results for the effect of MWs on CDS spreads in Table 6 suggest that MWs have an
impact on the information-related component of CDS spreads, but are silent on whether MWs can
directly increase default risk. To distinguish the specific effects of these two channels, we
decompose CDS spreads into a default-related and a nondefault-related component that closely
relates to information risk. We first obtain Moody’s KMV Expected Default Frequency (EDF) to
estimate the default probability for nonfinancial firms.26 We then regress CDS spreads on EDF for
each industry-year group and obtain estimated coefficients. Next, we calculate the default-related
CDS spreads by multiplying the estimated coefficients by EDF. The difference between the overall
CDS spreads and fitted default-related CDS spreads is the nondefault-related CDS component. Our
analysis shows that the effect of MWs on credit spreads is mainly related to information risk
because the effect of company-level MWs is reflected in nondefault-related CDS spreads. This
result suggests that the information risk from MWs largely drives the MW-CDS spread in the
presence of controls for all other major factors that explain CDS spreads. When using the default-
related CDS spreads as the dependent variable, the coefficient on MW is positive but insignificant.
This result indicates that there is no evidence that MWs affect credit spreads by increasing default
probability, which is consistent with findings from Kim et al. (2011) in the bank loan market.
23 However, the difference between the coefficients on MW 3 3-Year Maturity and MW 3 1-Year Maturity is notsignificant. Such insignificance is likely due to small number of MW cases with one-year CDS spread information(i.e., seven observations in Table 6, Panel A).
24 In Table 6, the number of observed CDS spreads is smaller for shorter maturities. There may be a concern that a firmwith five-year CDS but not three-year or one-year CDS trading information differs substantially from firms with CDStrading spanning all maturities. To mitigate this concern, we limit the sample to firms with CDS spreads at all threematurities. The results from this restricted, smaller sample are similar.
25 Another transaction-based data source similar to GFI is CreditTrade, which has been previously used by other studies,such as Blanco et al. (2005), Acharya and Johnson (2007), Pan and Singleton (2008). We also obtain data fromCreditTrade (the data stop in 2006) and combine GFI with CreditTrade as our CDS data (using GFI data aloneprovides similar results).
26 We focus on nonfinancial firms in the decomposition because financial firms are highly regulated and their defaultprobability is largely influenced by regulator policies.
Internal Control Quality and Credit Default Swap Spreads 621
Accounting HorizonsSeptember 2015
Fourth, to mitigate concerns that information contemporaneous with internal control
disclosures might lead to a positive relationship between MW and CDS spreads, we include the
following control variables: (1) disclosure intensity, for which we use the disclosure of research and
development expenditures, order backlog, and number of employees at the segment level as proxies
(Karuna 2013); (2) strength of corporate governance, for which we follow Gompers, Ishii, and
Metrick (2003) to include a governance index to control for the strength of corporate governance;
(3) accruals quality, for which we include the absolute value of abnormal accruals to ensure that the
effect of internal control quality on CDS spreads is incremental to the effect of accruals quality; (4)
information environment, for which we include the number of analysts covering the firm to control
for the firm’s information environment; (5) news prominence, for which we include unexpected
trading volume as a proxy for news prominence;27 and (6) stock returns, for which we incorporate
stock returns over the same period in the regressions to explore whether the effect of internal control
disclosures on CDS spreads is incremental to factors affecting equity markets. These additional
controls in the regressions produce similar results.
Fifth, our main sample period ends on May 31, 2007, which is before the 2008 global financial
crisis. However, it is also interesting to explore the role of internal control quality in the CDS
market during the financial crisis. We collect additional data for the period from June 1, 2007
through June 30, 2008 to extend our analysis. Our additional sample has includes 227 firm-year
observations with all relevant information but only four instances of MWs.28 Regression analysis
based on such few observations is not likely to be meaningful.29 Thus, we conduct event studies of
these four MW instances to investigate the CDS market reaction to MW disclosures during the
financial crisis, which indicate that CDS spreads increase by 4.5 percent during the three-day event
window, though the change is not statistically significant. Nevertheless, this result is consistent with
our previous finding that CDS spreads are positively associated with the presence of MWs.30
Sixth, we conduct several other sensitivity analyses. We first alter the observation window for
CDS spreads. When we use either a two-month or one-month observation window for CDS
spreads, and the results are similar to our baseline results using a three-month window. We also
note that our results are robust for using individual CDS contracts directly, similar to Callen et al.
(2009), instead of averaging CDS spreads across all contracts for the same name. Furthermore,
when we restrict our sample of companies to those covered by rating agencies, we obtain results
27 There are two reasons for using this proxy. First, Huberman and Regev (2001) demonstrate that prominent news isassociated with high trading volume in the stock market; therefore, we control for news prominence by includingabnormal stock trading volume. Second, prior studies, such as Cready and Hurtt (2002), suggest that equity tradingvolume contains information for future stock price changes; therefore, we control for information relevant to theequity market by including stock trading volume.
28 The downward trend of the number of ineffective internal control reports filed is consistent with other studies onMWs. For example, Skaife et al. (2013) document that the fraction of MWs decreases from 17.3 percent in 2004 to3.2 percent in 2008 in their sample. Several speeches by practitioners also confirm this trend (SEC 2009). We furtherexplore the CDS sample from July 2008 to March 2009 and find that there is no MW case covered by the CDS sampleduring this period.
29 Given that the CDS market becomes volatile during the financial crisis, including these observations would reduce thepower of our tests but provide little to examine the internal control quality and CDS spread relationship because of thesmall number of reports of internal control weaknesses. Even if we include this group of the sample, we obtain similarresults with slightly lower statistical significance.
30 Given that the CDS market becomes volatile during the financial crisis, including these observations would reduce thepower of our tests but provide little to examine the internal control quality and CDS spread relationship because of thesmall number of reports of internal control weaknesses. Even if we include this group of the sample, we obtain similarresults with slightly lower statistical significance.
622 Tang, Tian, and Yan
Accounting HorizonsSeptember 2015
similar to those reported in Tables 3–5, which suggests that the effect of MWs on CDS spreads is in
addition to the rating agency monitoring channel documented by Dhaliwal et al. (2011).31,32
CONCLUSIONS
We investigate how internal control quality affects the pricing of credit default swaps (CDSs).
We find that, all else being equal, CDS spreads are 47.1 bps higher, on average, for firms with
internal control material weaknesses (MWs) than for firms with effective internal controls. This
MW effect on CDS spreads is driven mainly by company-level weaknesses rather than by account-
specific weaknesses. We further document that CDS spreads increase around the reporting of MWs
and that deterioration of internal control quality is related to an increase in CDS spreads.
Furthermore, the effect of MWs on CDS spreads is stronger for short-term than for long-term CDS
contracts.
Our study is the first to examine the effect of internal control quality on derivatives pricing.
There is growing interest in understanding the role of accounting information for the CDS market
and the impact of CDSs on accounting practices (Griffin 2014). Our analysis using CDS transaction
data demonstrates that even in a market in which companies are continuously monitored, internal
control quality plays an important role in credit pricing. Importantly, the use of CDS data
distinguishes our study from prior research in the following two aspects. First, our finding on the
term structure of CDS spreads reveals that MWs increase information risk to creditors, as the CDS
market provides a cleaner setting to uncover this term structure effect (Duffie and Lando 2001).
Second, because CDS spreads better reflect credit risk than bond or loan spreads (Longstaff et al.
2005), we are able to identify the information risk channel through which MWs affect CDS spreads.
Moreover, regulatory bodies, such as the Public Company Accounting Oversight Board (PCAOB),
differentiate the type of internal control MWs (i.e., company-level versus account-specific MWs) in
their regulatory documents and our finding regarding the differential effects of these two types of
MWs provides partial justification for such considerations.
One caveat for our study is that some companies may not disclose MW information in a timely
manner (e.g., Rice and Weber 2012). Therefore, we may under or overestimate the effect of internal
control MWs on CDS spreads. Nevertheless, we believe that our study provides an importance
piece of evidence on how accounting information affects derivatives pricing. The effect of other
accounting disclosures on credit derivatives markets warrants future studies.
REFERENCES
Acharya, V. V., and T. C. Johnson. 2007. Insider trading in credit derivatives. Journal of Financial
Economics 84 (1): 110–141.
Akresh, A. D. 2010. A risk model to opine on internal control. Accounting Horizons 24 (1): 65–78.
Alloway, T. 2013. Pension fund sues banks over CDS ‘‘dominance.’’ Financial Times (May 7).
31 Because the major investors in the CDS market are financial institutions, we expect that these financial institutions—such as banks and hedge funds—actively trade and monitor CDS reference companies.
32 We also explore the differential effect of MWs on CDS spreads for subgroups with high or low credit ratings. Thenonlinearity of creditor payoff functions suggests that CDS spreads are sensitive to credit risk-related informationwhen reference firms are close to bankruptcy (Plummer and Tse 1999). We examine such nonlinearity by separatingthe sample to two subgroups: one with high credit ratings (BBBþ or higher) and one with low credit ratings. Ouranalysis shows that, in the subgroup with low crediting rating, the association between MWs and CDS spreads issignificant and positive and that such an association is stronger for company-level MWs. However, the MW-CDSspread relation is insignificant in the subgroup with high credit ratings.
Internal Control Quality and Credit Default Swap Spreads 623
Altamuro, J., and A. Beatty. 2010. How does internal control regulation affect financial reporting? Journalof Accounting & Economics 49 (1/2): 58–74.
Altman, E. I. 1968. Financial ratios, discriminant analysis, and prediction of corporate bankruptcy. TheJournal of Finance 23 (4): 589–609.
Arora, N., S. Richardson, and I. Tuna. 2014. Asset reliability and security prices: Evidence from credit
markets. Review of Accounting Studies 19 (1): 363–395.
Ashbaugh-Skaife, H., D. W. Collins, and W. R. Kinney, Jr. 2007. The discovery and reporting of internal
control deficiencies prior to SOX-mandated audits. Journal of Accounting & Economics 44 (1/2):
166–192.
Ashbaugh-Skaife, H., D. W. Collins, W. R. Kinney, and R. LaFond. 2008. The effect of SOX internal
control deficiencies and their remediation on accrual quality. The Accounting Review 83 (1): 217–
250.
Ashbaugh-Skaife, H., D. W. Collins, W. R. Kinney, and R. LaFond. 2009. The Effect of SOX internal
control deficiencies on firm risk and cost of equity. Journal of Accounting Research 47 (1): 1–43.
Augustin, P., M. G. Subrahmanyam, D. Y. Tang, and S. Q. Wang. 2014. Credit default swaps: A survey.
Foundations and Trends in Finance 9 (1–2): 1–196.
Bardhan, I. R., S. Lin, and S.-L. Wu. 2015. The quality of internal control over financial reporting in family
firms. Accounting Horizons 29 (1): 41–60.
Batta, G. 2011. The direct relevance of accounting information for credit default swap pricing. Journal ofBusiness Finance & Accounting 38 (9/10): 1096–1122.
Bedard, J. C., and L. Graham. 2011. Detection and severity classifications of Sarbanes-Oxley Section 404
internal control deficiencies. The Accounting Review 86 (3): 825–855.
Beneish, M. D., M. B. Billings, and L. D. Hodder. 2008. Internal control weaknesses and information
uncertainty. The Accounting Review 83 (3): 665–703.
Blanco, R., S. Brennan, and I. W. Marsh. 2005. An empirical analysis of the dynamic relation between
investment-grade bonds and credit default swaps. The Journal of Finance 60 (5): 2255–2281.
Bongaerts, D., F. de Jong, and J. Driessen. 2011. Derivative pricing with liquidity risk: Theory and evidence
from the credit default swap market. The Journal of Finance 66 (1): 203–240.
Callen, J. L., J. Livnat, and D. Segal. 2009. The impact of earnings on the pricing of credit default swaps.
The Accounting Review 84 (5): 1363–1394.
Cheng, M., D. Dhaliwal, and Y. Zhang. 2013. Does investment efficiency improve after the disclosure of
material weaknesses in internal control over financial reporting? Journal of Accounting & Economics56 (1): 1–18.
Clinton, S. B., A. S. Pinello, and H. A. Skaife. 2014. The implications of ineffective internal control and
SOX 404 reporting for financial analysts. Journal of Accounting and Public Policy 33 (4): 303–327.
Coates, J. C., and S. Srinivasan. 2014. SOX after ten years: A multidisciplinary review. AccountingHorizons 28 (3): 627–671.
Committee of Sponsoring Organizations of the Treadway Commission (COSO). 2004. Enterprise RiskManagement—Integrated Framework. New York, NY: American Institute of Certified Public
Accountants.
Costello, A. M., and R. Wittenberg-Moerman. 2011. The impact of financial reporting quality on debt
contracting: Evidence from internal control weakness reports. Journal of Accounting Research 49 (1):
97–136.
Cready, W. M., and D. N. Hurtt. 2002. Assessing investor response to information events using return and
volume metrics. The Accounting Review 77: 891–909.
Das, S. R., P. Hanouna, and A. Sarin. 2009. Accounting-based versus market-based cross-sectional models
of CDS spreads. Journal of Banking & Finance 33 (4): 719–730.
De Franco, G., F. P. Vasvari, and R. Wittenberg-Moerman. 2009. The informational role of bond analysts.
Journal of Accounting Research 47 (5): 1201–1248.
DeFond, M., and J. Zhang. 2014. A review of archival auditing research. Journal of Accounting &
Dhaliwal, D., C. Hogan, R. Trezevant, and M. Wilkins. 2011. Internal control disclosures, monitoring, and
the cost of debt. The Accounting Review 86 (4): 1131–1156.
Doyle, J., W. Ge, and S. McVay. 2007a. Accruals quality and internal control over financial reporting. TheAccounting Review 82 (5): 1141–1170.
Doyle, J., W. Ge, and S. McVay. 2007b. Determinants of weaknesses in internal control over financial
reporting. Journal of Accounting & Economics 44 (1/2): 193–223.
Duffie, D., and D. Lando. 2001. Term structures of credit spreads with incomplete accounting information.
Econometrica 69 (3): 633–664.
Easley, D., and M. O’Hara. 2004. Information and the cost of capital. The Journal of Finance 59 (4): 1553–
1583.
Ericsson, J., K. Jacobs, and R. Oviedo. 2009. The determinants of credit default swap premia. Journal ofFinancial and Quantitative Analysis 44 (1): 109–132.
Feng, M., C. Li, and S. McVay. 2009. Internal control and management guidance. Journal of Accounting &Economics 48 (2/3): 190–209.
Feng, M., C. Li, S. E. McVay, and H. A. Skaife. 2015. Does ineffective internal control over financial
reporting affect a firm’s operations? Evidence from firms’ inventory management. The AccountingReview 90 (2): 529–557.
Ge, W., and S. McVay. 2005. The disclosure of material weaknesses in internal control after the Sarbanes-
Oxley Act. Accounting Horizons 19 (3): 137–158.
Gompers, P., J. Ishii, and A. Metrick. 2003. Corporate governance and equity prices. Quarterly Journal ofEconomics 118 (1): 107–155.
Gordon, L. A., and A. L. Wilford. 2012. An analysis of multiple consecutive years of material weaknesses
in internal control. The Accounting Review 87 (6): 2027–2060.
Gramling, A. A., E. F. O’Donnell, and S. D. Vandervelde. 2013. An experimental examination of factors
that influence auditor assessments of a deficiency in internal control over financial reporting.
Accounting Horizons 27 (2): 249–269.
Griffin, P. A. 2014. The market for credit default swaps: New insights into investors’ use of accounting
Huberman, G., and T. Regev. 2001. Contagious speculation and a cure for cancer: A nonevent that made
stock prices soar. The Journal of Finance 56 (1): 387–396.
Hull, J., M. Predescu, and A. White. 2004. The relationship between credit default swap spreads, bond
yields, and credit rating announcements. Journal of Banking & Finance 28 (11): 2789–2811.
Jarrow, R. A., and F. Yu. 2001. Counterparty risk and the pricing of defaultable securities. The Journal ofFinance 56 (5): 1765–1799.
Karuna, C. 2013. Industry Product Market Competition and Corporate Voluntary Disclosure: Evidencefrom Discretionary Forward-Looking Line Items at the Industrial Segment. Working paper,
University of Houston.
Kim, J.-B., B. Y. Song, and L. Zhang. 2011. Internal control weakness and bank loan contracting: Evidence
from SOX Section 404 disclosures. The Accounting Review 86 (4): 1157–1188.
Kim, S., P. Kraft, and S. Ryan. 2013. Financial statement comparability and credit risk. Review ofAccounting Studies 18 (3): 783–823.
Kinney, W. R., R. D. Martin, and M. L. Shepardson. 2013. Reflections on a decade of SOX 404(b) audit
production and alternatives. Accounting Horizons 27 (4): 799–813.
Internal Control Quality and Credit Default Swap Spreads 625
Kinney, W. R., M. W. Maher, and D. W. Wright. 1990. Assertions-based standards for integrated internal
control. Accounting Horizons 4 (4): 1–8.
Klamm, B. K., K. W. Kobelsky, and M. W. Watson. 2012. Determinants of the persistence of internal
control weaknesses. Accounting Horizons 26 (2): 307–333.
Lambert, R., C. Leuz, and R. E. Verrecchia. 2007. Accounting information, disclosure, and the cost of
capital. Journal of Accounting Research 45 (2): 385–420.
Lok, S., and S. Richardson. 2011. Credit markets and financial information. Review of Accounting Studies16 (3): 487–500.
Longstaff, F. A., S. Mithal, and E. Neis. 2005. Corporate yield spreads: Default risk or liquidity? New
evidence from the credit default swap market. The Journal of Finance 60 (5): 2213–2253.
Moody’s Investors Service. 2004. First Year Section 404 Reports on Internal Control: Impact on Rating WillDepend on Nature of Material Weaknesses Reported. New York, NY: Moody’s Investors Service.
Moody’s Investors Service. 2006. Second Year Section 404 Reports on Internal Control: Delinquent FilersAre Most at Risk of Negative Rating Action. New York, NY: Moody’s Investors Service.
Moody’s Investors Service. 2007. Third Year Section 404 Reports on Internal Control: Control ProblemsAre Decreasing, but Reporting Can Be Improved. New York, NY: Moody’s Investors Service.
Morkoetter, S., J. Pleus, and S. Westerfeld. 2012. The impact of counterparty risk on credit default swap
pricing dynamics. The Journal of Credit Risk 8 (1): 63–88.
Munsif, V., K. Raghunandan, D. V. Rama, and M. Singhvi. 2011. Audit fees after remediation of internal
control weaknesses. Accounting Horizons 25 (1): 87–105.
Nagy, A. L. 2010. Section 404 compliance and financial reporting quality. Accounting Horizons 24 (3):
441–454.
Nashikkar, A., M. G. Subrahmanyam, and S. Mahanti. 2011. Liquidity and arbitrage in the market for credit
risk. Journal of Financial and Quantitative Analysis 46 (3): 627–656.
Ogneva, M., K. Raghunandan, and K. R. Subramanyam. 2007. Internal control weakness and cost of equity:
Evidence from SOX Section 404 disclosures. The Accounting Review 82 (5): 1255–1297.
Palmrose, Z.-V. 2010. Balancing the costs and benefits of auditing and financial reporting regulation post-
SOX, Part I: Perspectives from the Nexus at the SEC. Accounting Horizons 24 (2): 313–326.
Pan, J., and K. J. Singleton. 2008. Default and recovery implicit in the term structure of sovereign CDS
spreads. The Journal of Finance 63 (5): 2345–2384.
Plummer, C. E., and S. Y. Tse. 1999. The effect of limited liability on the informativeness of earnings:
Evidence from the stock and bond markets. Contemporary Accounting Research 16 (Fall): 541–574.
Public Company Accounting Oversight Board (PCAOB). 2004. An Audit of Internal Control over FinancialReporting Performed in Conjunction with an Audit of Financial Statements. Auditing Standard No. 2.
Available at: http://pcaobus.org/Standards/Auditing/Pages/Auditing_Standard_2.aspx
Public Company Accounting Oversight Board (PCAOB). 2007. An Audit of Internal Control over FinancialReporting That Is Integrated with an Audit of Financial Statements. Auditing Standard No. 5.
Available at: http://pcaobus.org/Standards/Auditing/Pages/Auditing_Standard_5.aspx
Raghunandan, K., and D. V. Rama. 2006. SOX Section 404 material weakness disclosures and audit fees.
Auditing: A Journal of Practice & Theory 25 (1): 99–114.
Rice, S. C., and D. P. Weber. 2012. How effective is internal control reporting under SOX 404?
Determinants of the (non-)disclosure of existing material weaknesses. Journal of AccountingResearch 50 (3): 811–843.
Schneider, A., A. A. Gramling, D. R. Hermanson, and Z. Ye. 2009. A review of academic literature on
internal control reporting under SOX. Journal of Accounting Literature 28: 1–46.
Securities and Exchange Commission (SEC). 2009. Remarks before the 2009 AICPA National Conference
on current SEC and PCAOB developments, by Doug Besch. Available at: http://www.sec.gov/news/
speech/2009/spch120709db.htm
Shivakumar, L., O. Urcan, F. Vasvari, and L. Zhang. 2011. The debt market relevance of management
earnings forecasts: Evidence from before and during the credit crisis. Review of Accounting Studies
CDS SPREAD CDS spread, the average CDS spread (basis points) in the three months
subsequent to the filing dates of SOX 404 reports, respectively, in year t(Data Source: GFI and CreditTrade). We use five-year senior CDS spreads
for the results in Tables 3–5, and one-, three-, and five-year senior CDS
spreads in Table 6 for the analysis of the CDS spread term structure with
MWs.
LOG(CDS SPREAD) LOG(CDS spread), natural logarithm of CDS SPREAD in year t.MW Material weakness, an indicator variable that is equal to 1 if a firm reports
material weaknesses (MW) in internal control over financial reporting in
the SOX 404 reports, and 0 otherwise in year t (Data Source: Audit
Analytics).
ACCOUNT SPECIFIC MW Account-specific material weakness, an indicator variable that is equal to 1 if
the firm reports an account-specific MW, and 0 otherwise in year t (Data
Source: Audit Analytics, 10K Wizard, and Moody’s Investors Service).
COMPANY LEVEL MW Company-level material weakness, an indicator variable that equals 1 if the
firm reports a company-level MW, and 0 otherwise in year t (Data Source:
Audit Analytics, 10K Wizard, and Moody’s Investors Service).
SEG Number of segments, the log of 1 plus the sum of the number of business
and geographic segments reported for the firm in year t (Data Source:
Compustat Segment Data).
FOREIGN Foreign currency transaction, an indicator variable equal to 1 if the firm has a
nonzero foreign currency transaction in year t, and 0 otherwise (Compustat
item: FCA).
M&A Mergers and acquisitions, proportion of the current and prior four years (from
year t to year t�4) that a firm is involved in mergers and acquisition
activities (Compustat item: SALE_FN).
RESTRUCTURE Restructure, proportion of the current and prior four years (from year t to year
t�4) that a firm is involved in restructuring activities (Compustat items:
RCP, RCA, RCEPS, and RCD).
GROWTH Sales growth, average sales growth in the past five years, as (Compustat item:
SALE) from year t to year t�4.
INVENTORY Inventory, inventory (Compustat item: INVT) divided by total assets
(Compustat item: AT) at the end of year t.%LOSS Firm loss, proportion of the current and prior four years (from year t to year t
�4) that a firm reports negative earnings (Compustat item: NI).
RZSCORE Altman Z-score, decile rank of Altman (1968) Z-score at the end of year t(Data Source: Compustat). Here, Z-score ¼ 1.2 3 (working capital/total