International Education in Australia 2008 – 2013: Introduction According to Deloie Access Economics 1 , Australia’s internaonal educaon export earnings have declined from $17.9 billion in 2009-10 to $15.3 billion 2 . To beer understand the drivers of this decline, the Australian Council for Private Educaon and Training (ACPET) analysed Australia’s internaonal terary student market, examining the latest data on both offshore student visa applicaons and the enrolment paerns and preferences of internaonal students already in Australia. ACPET’s analysis highlights three key trends: 1. Offshore applicaons to study in Australia are alarmingly low. The full extent of the downturn in new applicaons is hidden in enrolment data, which is being ‘propped up’ by students already onshore applying to do more study. 2. Private providers are growing in popularity amongst internaonal students in Australia, dominang the vocaonal educaon and training (VET) and the English Language Intensive Courses for Overseas Students (ELICOS) sectors, while also gaining market share in higher educaon. 3. Declining enrolments from China and, in parcular, India have sll not stabilised. While Australia connues to be a global leader in internaonal educaon, that leadership is eroding rapidly and is under considerable threat as compeng countries grow their share of the market 3 . Australia’s expensive and inflexible student visa system, onerous and inefficient regulatory regime, preferenal treatment of the university sector over other trusted instuons and a reluctance to aggressively promote internaonal educaon overseas are combining to turn prospecve students away from Australia, with devastang results for the sector. While the university sector is now rebounding, thanks in large part to streamlined visa processing, the evidence is clear that the VET, ELICOS and schools sectors remain in deep decline. While some measures have been introduced to assist the sector, such as enhanced post study work rights for higher educaon graduates, reducing financial requirements for high 1 The Economic Contribuon of Internaonal Students, Delioes Access Economic, ACPET 2013 2 Australian Bureau of Stascs, Internaonal Trade in Services, by Country, by State and be Detailed Services Category, Financial Year, 2011-12, Nov 2012. 3 Countries such as the UK, Canada and Germany give significant aid funding for vocaonal educaon and training in Asian and Africa. In contrast Austalian has lim- ited investment in assisng countries to improve capacity in this sector and impact on Australia’s place in the internaonal market. risk visa applicants, streamlining student visa processing (SVP) for universies, establishing the Tuion Protecon Service and risk based approaches to determining levies for private providers, such approaches have not been evenly applied across the sector and have resulted in disproporonate impacts on market recovery. In order to correct this rapid decline in one of Australia’s largest exports, it is vital that the next Australian Government: • fully recognises the social, economic and strategic contribuon that internaonal educaon makes to Australia and the role that the private educaon sector plays; • supports the scope, diversity and contribuons of private instuons; and • applies regulaon and risk management evenly across the internaonal educaon sector 4 . Key trend #1: Offshore applications to study in Australia are alarmingly low The true extent of the decline in Australia’s internaonal educaon sector is broadly misunderstood and underesmated. Much of this stems from the prevalence of using enrolment data rather than offshore student visa applicaons in public debate. The latest Australian Educaon Internaonal (AEI) data 5 shows that there were 379,214 enrolments by full-fee paying internaonal students in Australia on a student visa at year to date (YTD) June 2013. While this decline of 2.2% from the same me in 2012, is itself concerning (parcularly in contrast with an annual growth rate over the preceding decade of 5.8%) it is actually “propped up” by students already onshore applying to do more study, and masks the real nature of this crisis. To understand the real freefall in internaonal student applicaons, we need to look at offshore visa applicaons 6 (new students applying from outside Australia to study here) as the most reliable indicator of the health of the sector. Here, the paern of decline is entrenched and debilitang for the VET and ELICOS sectors. As shown in Figure 1, overall offshore student visa applicaons are down by more than 37% from 262,086 in 2008/09 to 163,793 in 2012/13 Looking closely at the impact on VET and ELICOS sectors (Figures 2 and 3), we see that offshore applicaons in 2012-13 were at 4 ACPET Policy Statement on Internaonal Educaon, July 2013. 5 Monthly Summary of Internaonal Student Enrolment Data, Australian Educaon Internaonal, Australian Government, YTD June 2013 6 hp://www.immi.gov.au/media/stascs/study/_pdf/student-visa-program- report-2013-06-30.pdf Three Key Trends ACPET International Education in Australia 2008 – 2013: Three Key Trends 1
Transcript
International Education in Australia 2008 – 2013:
Introduction
According to Deloitte Access Economics1, Australia’s international education export earnings have declined from $17.9 billion in 2009-10 to $15.3 billion2.
To better understand the drivers of this decline, the Australian Council for Private Education and Training (ACPET) analysed Australia’s international tertiary student market, examining the latest data on both offshore student visa applications and the enrolment patterns and preferences of international students already in Australia.
ACPET’s analysis highlights three key trends:
1. Offshore applications to study in Australia are alarmingly low. The full extent of the downturn in new applications is hidden in enrolment data, which is being ‘propped up’ by students already onshore applying to do more study.
2. Private providers are growing in popularity amongst international students in Australia, dominating the vocational education and training (VET) and the English Language Intensive Courses for Overseas Students (ELICOS) sectors, while also gaining market share in higher education.
3. Declining enrolments from China and, in particular, India have still not stabilised.
While Australia continues to be a global leader in international education, that leadership is eroding rapidly and is under considerable threat as competing countries grow their share of the market3.
Australia’s expensive and inflexible student visa system, onerous and inefficient regulatory regime, preferential treatment of the university sector over other trusted institutions and a reluctance to aggressively promote international education overseas are combining to turn prospective students away from Australia, with devastating results for the sector.
While the university sector is now rebounding, thanks in large part to streamlined visa processing, the evidence is clear that the VET, ELICOS and schools sectors remain in deep decline.
While some measures have been introduced to assist the sector, such as enhanced post study work rights for higher education graduates, reducing financial requirements for high
1 The Economic Contribution of International Students, Deliottes Access Economic, ACPET 2013
2 Australian Bureau of Statistics, International Trade in Services, by Country, by State and be Detailed Services Category, Financial Year, 2011-12, Nov 2012.
3 Countries such as the UK, Canada and Germany give significant aid funding for vocational education and training in Asian and Africa. In contrast Austalian has lim-ited investment in assisting countries to improve capacity in this sector and impact on Australia’s place in the international market.
risk visa applicants, streamlining student visa processing (SVP) for universities, establishing the Tuition Protection Service and risk based approaches to determining levies for private providers, such approaches have not been evenly applied across the sector and have resulted in disproportionate impacts on market recovery.
In order to correct this rapid decline in one of Australia’s largest exports, it is vital that the next Australian Government:
• fully recognises the social, economic and strategic contribution that international education makes to Australia and the role that the private education sector plays;
• supports the scope, diversity and contributions of private institutions; and
• applies regulation and risk management evenly across the international education sector 4.
Key trend #1: Offshore applications to study in Australia are alarmingly low
The true extent of the decline in Australia’s international education sector is broadly misunderstood and underestimated. Much of this stems from the prevalence of using enrolment data rather than offshore student visa applications in public debate.
The latest Australian Education International (AEI) data5 shows that there were 379,214 enrolments by full-fee paying international students in Australia on a student visa at year to date (YTD) June 2013. While this decline of 2.2% from the same time in 2012, is itself concerning (particularly in contrast with an annual growth rate over the preceding decade of 5.8%) it is actually “propped up” by students already onshore applying to do more study, and masks the real nature of this crisis.
To understand the real freefall in international student applications, we need to look at offshore visa applications6 (new students applying from outside Australia to study here) as the most reliable indicator of the health of the sector. Here, the pattern of decline is entrenched and debilitating for the VET and ELICOS sectors.
As shown in Figure 1, overall offshore student visa applications are down by more than 37% from 262,086 in 2008/09 to 163,793 in 2012/13
Looking closely at the impact on VET and ELICOS sectors (Figures 2 and 3), we see that offshore applications in 2012-13 were at
4 ACPET Policy Statement on International Education, July 2013.5 Monthly Summary of International Student Enrolment Data, Australian Education
International, Australian Government, YTD June 20136 http://www.immi.gov.au/media/statistics/study/_pdf/student-visa-program-
report-2013-06-30.pdf
Three Key Trends
ACPET International Education in Australia 2008 – 2013: Three Key Trends 1
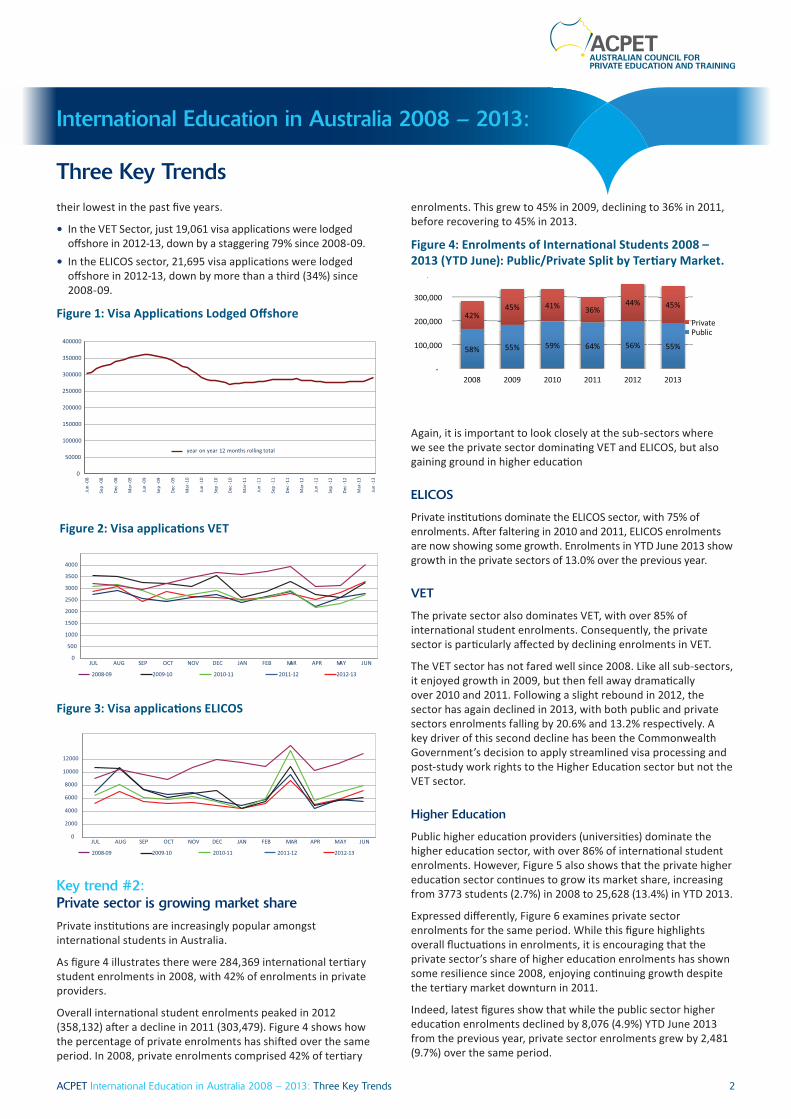
their lowest in the past five years.
• In the VET Sector, just 19,061 visa applications were lodged offshore in 2012-13, down by a staggering 79% since 2008-09.
• In the ELICOS sector, 21,695 visa applications were lodged offshore in 2012-13, down by more than a third (34%) since 2008-09.
Figure 1: Visa Applications Lodged Offshore
Figure 2: Visa applications VET
4000
3500
3000
2500
2000
1500
1000
500
0
JUL AUG SEP OCT NOV DEC JAN FEB MAR APR MAY JUN
2008-09 2009-10 2010-11 2011-12 2012-13
Figure 3: Visa applications ELICOS
12000
10000
8000
6000
4000
2000
0
JUL AUG SEP OCT NOV DEC JAN FEB MAR APR MAY JUN
2008-09 2009-10 2010-11 2011-12 2012-13
Key trend #2: Private sector is growing market share
Private institutions are increasingly popular amongst international students in Australia.
As figure 4 illustrates there were 284,369 international tertiary student enrolments in 2008, with 42% of enrolments in private providers.
Overall international student enrolments peaked in 2012 (358,132) after a decline in 2011 (303,479). Figure 4 shows how the percentage of private enrolments has shifted over the same period. In 2008, private enrolments comprised 42% of tertiary
enrolments. This grew to 45% in 2009, declining to 36% in 2011, before recovering to 45% in 2013.
Figure 4: Enrolments of International Students 2008 – 2013 (YTD June): Public/Private Split by Tertiary Market.
Again, it is important to look closely at the sub-sectors where we see the private sector dominating VET and ELICOS, but also gaining ground in higher education
ELICOS
Private institutions dominate the ELICOS sector, with 75% of enrolments. After faltering in 2010 and 2011, ELICOS enrolments are now showing some growth. Enrolments in YTD June 2013 show growth in the private sectors of 13.0% over the previous year.
VET
The private sector also dominates VET, with over 85% of international student enrolments. Consequently, the private sector is particularly affected by declining enrolments in VET.
The VET sector has not fared well since 2008. Like all sub-sectors, it enjoyed growth in 2009, but then fell away dramatically over 2010 and 2011. Following a slight rebound in 2012, the sector has again declined in 2013, with both public and private sectors enrolments falling by 20.6% and 13.2% respectively. A key driver of this second decline has been the Commonwealth Government’s decision to apply streamlined visa processing and post-study work rights to the Higher Education sector but not the VET sector.
Higher Education
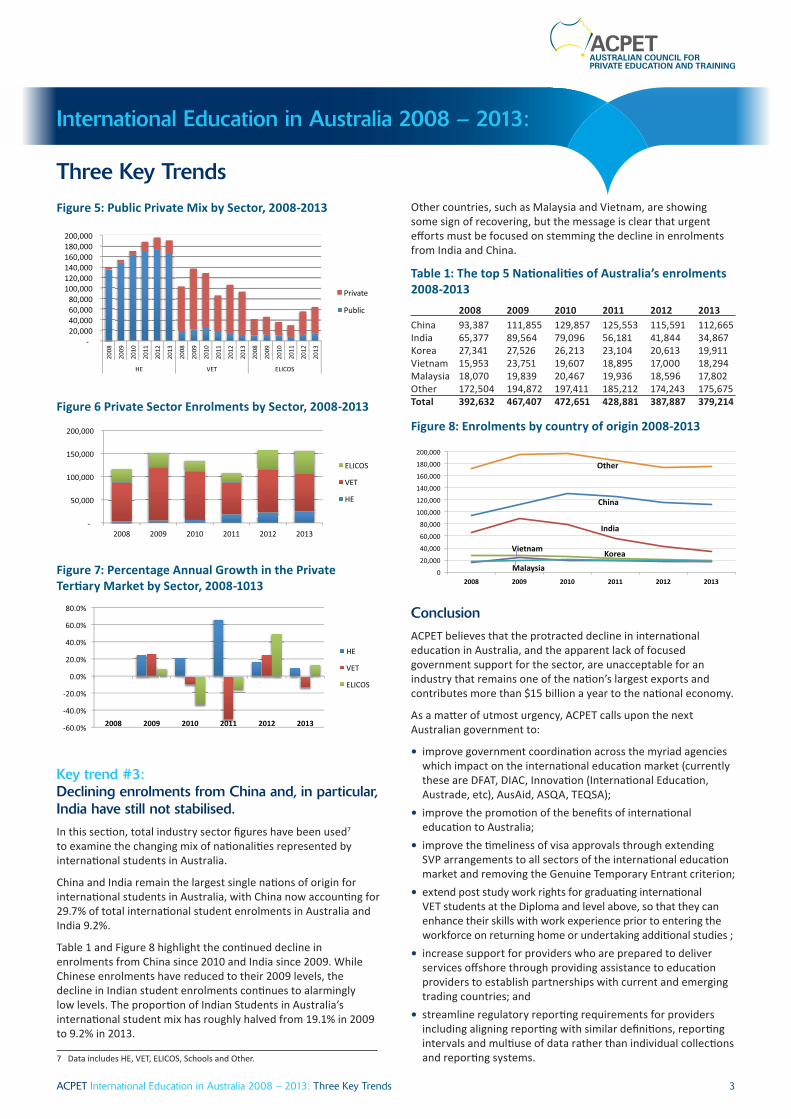
Public higher education providers (universities) dominate the higher education sector, with over 86% of international student enrolments. However, Figure 5 also shows that the private higher education sector continues to grow its market share, increasing from 3773 students (2.7%) in 2008 to 25,628 (13.4%) in YTD 2013.
Expressed differently, Figure 6 examines private sector enrolments for the same period. While this figure highlights overall fluctuations in enrolments, it is encouraging that the private sector’s share of higher education enrolments has shown some resilience since 2008, enjoying continuing growth despite the tertiary market downturn in 2011.
Indeed, latest figures show that while the public sector higher education enrolments declined by 8,076 (4.9%) YTD June 2013 from the previous year, private sector enrolments grew by 2,481 (9.7%) over the same period.
Three Key Trends
International Education in Australia 2008 – 2013:
Jun
-08
Sep
-08
Dec
-08
Mar
-09
Jun
-09
Sep
-09
Dec
-09
Mar
-10
Jun
-10
Sep
-10
Dec
-10
Mar
-11
Jun
-11
Sep
-11
Dec
-11
Mar
-12
Jun
-12
Sep
-12
Dec
-12
Mar
-13
Jun
-13
400000
350000
300000
250000
200000
150000
100000
50000
0
year on year 12 months rolling total
ACPET International Education in Australia 2008 – 2013: Three Key Trends 2
Figure 5: Public Private Mix by Sector, 2008-2013
Figure 6 Private Sector Enrolments by Sector, 2008-2013
Figure 7: Percentage Annual Growth in the Private Tertiary Market by Sector, 2008-1013
Key trend #3: Declining enrolments from China and, in particular, India have still not stabilised.
In this section, total industry sector figures have been used7 to examine the changing mix of nationalities represented by international students in Australia.
China and India remain the largest single nations of origin for international students in Australia, with China now accounting for 29.7% of total international student enrolments in Australia and India 9.2%.
Table 1 and Figure 8 highlight the continued decline in enrolments from China since 2010 and India since 2009. While Chinese enrolments have reduced to their 2009 levels, the decline in Indian student enrolments continues to alarmingly low levels. The proportion of Indian Students in Australia’s international student mix has roughly halved from 19.1% in 2009 to 9.2% in 2013.
7 Data includes HE, VET, ELICOS, Schools and Other.
Other countries, such as Malaysia and Vietnam, are showing some sign of recovering, but the message is clear that urgent efforts must be focused on stemming the decline in enrolments from India and China.
Table 1: The top 5 Nationalities of Australia’s enrolments 2008-2013
Figure 8: Enrolments by country of origin 2008-2013
Conclusion
ACPET believes that the protracted decline in international education in Australia, and the apparent lack of focused government support for the sector, are unacceptable for an industry that remains one of the nation’s largest exports and contributes more than $15 billion a year to the national economy.
As a matter of utmost urgency, ACPET calls upon the next Australian government to:
• improve government coordination across the myriad agencies which impact on the international education market (currently these are DFAT, DIAC, Innovation (International Education, Austrade, etc), AusAid, ASQA, TEQSA);
• improve the promotion of the benefits of international education to Australia;
• improve the timeliness of visa approvals through extending SVP arrangements to all sectors of the international education market and removing the Genuine Temporary Entrant criterion;
• extend post study work rights for graduating international VET students at the Diploma and level above, so that they can enhance their skills with work experience prior to entering the workforce on returning home or undertaking additional studies ;
• increase support for providers who are prepared to deliver services offshore through providing assistance to education providers to establish partnerships with current and emerging trading countries; and
• streamline regulatory reporting requirements for providers including aligning reporting with similar definitions, reporting intervals and multiuse of data rather than individual collections and reporting systems.
Three Key Trends
International Education in Australia 2008 – 2013:
ACPET International Education in Australia 2008 – 2013: Three Key Trends 3